Effect of the Arctic Oscillation on precipitation in the ... · Effect of the Arctic Oscillation on...
14
CLIMATE RESEARCH Clim Res Vol. 37: 3–16, 2008 doi: 10.3354/cr00749 Printed September 2008 Published online August 7, 2008 1. INTRODUCTION First identified by Lorenz (1951), the Arctic Oscilla- tion (AO) or Northern Hemisphere Annular Mode (NAM) (Limpasuvan & Hartmann 1999), along with its more localized feature called the North Atlantic Oscil- lation (NAO) (Wallace & Gutzler 1981), is now recog- nized as the major contributor to weather and climate variability of the mid- and high latitudes across the Northern Hemisphere (NH) at intraseasonal to inter- decadal timescales. The AO is characterized by a dipole fluctuation in pressure of one sign over the Arc- tic and the opposite sign in mid-latitudes at around 55° N, with major centers of action near Greenland and the Azores, and a minor one located over the North Pacific. The state of the AO reflects the strength of the polar vortex in the stratosphere and westerly wind flow north of 45° in the troposphere such that its positive phase is associated with a strong vortex and westerly winds with opposing conditions dominating during the negative phase (Marshall et al. 2001). The most prominent AO-related climate effects are observed during the cold season over the eastern USA, the North Atlantic sector, Eurasia, and the polar cap (Higgins et al. 2000, 2007, Marshall et al. 2001). The low (high) index of the AO is typically accompa- nied by anomalously high (low) pressure over the North Atlantic, warm (cool) conditions throughout the midlatitudes of North America and Eurasia poleward of 40° N, above (below) normal precipitation over northern Europe and southeastern North America, and reduced (enhanced) precipitation over southern © Inter-Research 2008 · www.int-res.com *Email: [email protected] Effect of the Arctic Oscillation on precipitation in the eastern USA during ENSO winters Dagmar Budikova* Department of Geography-Geology, Illinois State University, Normal, Illinois 61790-4400, USA ABSTRACT: The El Niño–Southern Oscillation (ENSO) and the Arctic Oscillation (AO), respectively, dominate global and Northern Hemispheric climate variability on interannual timescales. Statistical and composite analyses of historical climate records between 1899 and 2007 reveal a strong influence of the AO on eastern USA winter precipitation and atmospheric circulation over the Pacific/North American (PNA) region during ENSO years. Records of the standardized precipitation index (SPI) and anomalies in the 500 hPa geopotential height field show the AO to exert greatest effect on El Niño-related climate. The presence of a strong northwardly displaced polar front jet and a well- developed Bermuda high during months when the AO is positive promotes the influx of warm and moist air from the western Atlantic into the study area, significantly enhancing winter El Niño- related precipitation in the southeast USA. Negative phases of the AO that coincide with El Niños deepen the lows over the North Pacific and diminish the influence of the Bermuda high on the east- ern USA. This modification enhances the influx of northerly air into the study area, bringing unsea- sonably dry winters to the Midwest and the Ohio Valley. The presence of the negative phase of the AO returns the wintertime circulation and SPI regimes to near-normal values throughout the study area during La Niña winters, whereas no appreciable effects on La Niña–related circulation and SPI regimes are noted when AO becomes positive. The interaction between ENSO and the AO helps to account for the inter-ENSO variability of climate teleconnections across the PNA region, possibly enhancing our ability to provide better winter climate forecasts across the eastern United States during ENSO episodes. KEY WORDS: Climate variability · ENSO teleconnections · Arctic Oscillation · Precipitation · USA Resale or republication not permitted without written consent of the publisher
-
Upload
duongtuong -
Category
Documents
-
view
225 -
download
0
Transcript of Effect of the Arctic Oscillation on precipitation in the ... · Effect of the Arctic Oscillation on...

CLIMATE RESEARCHClim Res
Vol. 37: 3–16, 2008doi: 10.3354/cr00749
Printed September 2008 Published online August 7, 2008
1. INTRODUCTION
First identified by Lorenz (1951), the Arctic Oscilla-tion (AO) or Northern Hemisphere Annular Mode(NAM) (Limpasuvan & Hartmann 1999), along with itsmore localized feature called the North Atlantic Oscil-lation (NAO) (Wallace & Gutzler 1981), is now recog-nized as the major contributor to weather and climatevariability of the mid- and high latitudes across theNorthern Hemisphere (NH) at intraseasonal to inter-decadal timescales. The AO is characterized by adipole fluctuation in pressure of one sign over the Arc-tic and the opposite sign in mid-latitudes at around55° N, with major centers of action near Greenland andthe Azores, and a minor one located over the NorthPacific. The state of the AO reflects the strength of the
polar vortex in the stratosphere and westerly wind flownorth of 45° in the troposphere such that its positivephase is associated with a strong vortex and westerlywinds with opposing conditions dominating during thenegative phase (Marshall et al. 2001).
The most prominent AO-related climate effects areobserved during the cold season over the easternUSA, the North Atlantic sector, Eurasia, and the polarcap (Higgins et al. 2000, 2007, Marshall et al. 2001).The low (high) index of the AO is typically accompa-nied by anomalously high (low) pressure over theNorth Atlantic, warm (cool) conditions throughout themidlatitudes of North America and Eurasia polewardof 40° N, above (below) normal precipitation overnorthern Europe and southeastern North America,and reduced (enhanced) precipitation over southern
© Inter-Research 2008 · www.int-res.com*Email: [email protected]
Effect of the Arctic Oscillation on precipitation inthe eastern USA during ENSO winters
Dagmar Budikova*
Department of Geography-Geology, Illinois State University, Normal, Illinois 61790-4400, USA
ABSTRACT: The El Niño–Southern Oscillation (ENSO) and the Arctic Oscillation (AO), respectively,dominate global and Northern Hemispheric climate variability on interannual timescales. Statisticaland composite analyses of historical climate records between 1899 and 2007 reveal a strong influenceof the AO on eastern USA winter precipitation and atmospheric circulation over the Pacific/NorthAmerican (PNA) region during ENSO years. Records of the standardized precipitation index (SPI)and anomalies in the 500 hPa geopotential height field show the AO to exert greatest effect onEl Niño-related climate. The presence of a strong northwardly displaced polar front jet and a well-developed Bermuda high during months when the AO is positive promotes the influx of warmand moist air from the western Atlantic into the study area, significantly enhancing winter El Niño-related precipitation in the southeast USA. Negative phases of the AO that coincide with El Niñosdeepen the lows over the North Pacific and diminish the influence of the Bermuda high on the east-ern USA. This modification enhances the influx of northerly air into the study area, bringing unsea-sonably dry winters to the Midwest and the Ohio Valley. The presence of the negative phase of theAO returns the wintertime circulation and SPI regimes to near-normal values throughout the studyarea during La Niña winters, whereas no appreciable effects on La Niña–related circulation and SPIregimes are noted when AO becomes positive. The interaction between ENSO and the AO helps toaccount for the inter-ENSO variability of climate teleconnections across the PNA region, possiblyenhancing our ability to provide better winter climate forecasts across the eastern United Statesduring ENSO episodes.
KEY WORDS: Climate variability · ENSO teleconnections · Arctic Oscillation · Precipitation · USA
Resale or republication not permitted without written consent of the publisher
Clim Res 37: 3–16, 2008
Europe and northeast North America (Thompson &Wallace 1998, Marshall et al. 2001). New et al. (2001)demonstrated that the AO explains approximately 48and 35% of the area-averaged winter precipitationvariability over land in the latitude bands 60 to 80° Nand 40 to 60° N, respectively.
The El Niño–Southern Oscillation (ENSO), a naturalphenomenon of the equatorial Pacific, is known as thedominant source of global climate variability on inter-annual timescales (Wallace & Gutzler 1981). It reflectsthe oscillation of the atmosphere–ocean system be-tween the coasts of Ecuador to the east and Papua NewGuinea and Australia to the west. The ENSO com-prises 2 extreme states, the El Niño (warm phase) andLa Niña (cool phase) (Wallace & Gutzler 1981), thatreflect the sea surface temperature (SST) conditionsacross the central and eastern basin of the equatorialPacific. ENSO explains about 38% of the interannualvariance on globally averaged land precipitation (Newet al. 2001). The relationship between ENSO andwinter climate of the Pacific/North American (PNA)region has been well documented (Yarnal & Leathers1988, Ropelewski & Halpert 1989, Leathers et al. 1991,Frauenfeld & Davis 2000, Higgins et al. 2007). The win-ter anomalies of the tropical atmosphere and oceanassociated with the ENSO disperse the Rossby wavesinto the NH, often exciting the PNA teleconnectionpattern (Wallace & Gutzler 1981). El Niño winterstypically coincide with an enhanced PNA patternmarked by a strong meridional flow of the polar jetover the northern USA that results from the presenceof an anomalously deep trough or a strong Aleutianlow over the North Pacific Ocean, a strong ridge orwell-developed Canadian High over the northwesternsections of the North American continent, and a well-developed trough or low pressure system over thesoutheast USA and the Gulf of Mexico. The path of thepolar jet, along with the presence of an active subtrop-ical jet over the southern portions of the USA, producesunseasonably warm and dry winters across westernCanada and the northwest USA, dry and cool condi-tions throughout the Ohio Valley region, and wet con-ditions across the south during El Niño years. DuringLa Niña winters, the teleconnection responses weaklyreflect that of a reverse phase of the PNA with signifi-cant dry conditions observed only in the south. Yarnal& Leathers (1988) stressed that the precise positionof the ridge–trough pattern has considerable effect onthe resulting regional precipitation totals across theeastern USA, an observation that helps account forthe inter-ENSO precipitation variability documentedacross the region (Hoerling & Kumar 1997).
Recent literature on teleconnections has focused ondocumenting the climatic effects of ENSO’s interactionwith other key modes of climatic variability. Across the
PNA region questions have centered on the modula-tion of winter climates by distinct states of the PacificDecadal Oscillation (PDO) (e.g. Zhang et al. 1997,Gershunov & Barnett 1998, Frauenfeld & Davis 2002,Budikova 2005), the Atlantic Multidecadal Oscillation(AMO) (e.g. Enfield et al. 2001, McCabe et al. 2004),and the NAO (e.g. Rodo et al. 1997, Huang et al. 1998).Recently, Randel (2004) and Taguchi & Hartmann(2006) demonstrated that ENSO may influence theNAM in both the stratosphere and the tropospherethrough an enhancement of planetary Rossby waveactivity as the waves propagate into the stratosphereand interact with the polar vortex. The enhanced vari-ations in the vortex intensity then communicate down-ward to the troposphere (Baldwin & Durkerton 1999).Bronnimann et al. (2004) argued that the signature ofEl Niño during the early 1940s closely resembled thatof the negative NAM from the surface to the 100 hPalevel. Hamilton (1993), and, more recently, Labitzke &van Loon (1999) claimed that the polar vortex tends tobe weaker during El Niño winters and stronger duringLa Niña winters. Quadrelli & Wallace (2002) exploredthe effect of ENSO on the AO, and Li et al. (2006)examined the link between the tropical Pacific SSTforcing and the AO. Both studies found El Niño andLa Niña to be associated with very distinct structuresof the AO, the AO structure being significantly modi-fied by the state of ENSO. New evidence is also emerg-ing regarding the effect of the NAM on the ENSO.Thompson & Lorenz (2004) revealed a coupling be-tween the NAM and the tropical atmosphere, and,more recently, Nakamura et al. (2006) found a connec-tion between spring NAM and ENSO outbreaks dur-ing following winter. Bond & Harrison (2006) showedthat ENSO signatures observed in Alaska’s winterweather have varied with the extreme phases of theAO.
The present study aims to build on the current litera-ture by exploring the interaction between the AO andENSO, with a focus on understanding the influence ofthe AO on El Niño- and La Niña-related regional pre-cipitation regimes across the eastern USA as definedby the standardized precipitation index (SPI). It ishypothesized that the state of the atmospheric circula-tion over the NH influences the structure of the tele-connection pattern that emanates from the equatorialPacific during ENSO events over North America,affecting the expected surface SPI regimes across theeastern USA. Specific research questions include thefollowing: How do various phases of the AO affectwinter El Niño- and La Niña-related atmospheric cir-culation regimes across the PNA region? What regionsof the eastern USA experience the greatest modifica-tions in El Niño- and La Niña-related SPI regimesdue to the AO?
4
Budikova: Effect of the AO on precipitation in the USA during ENSO winters
2. DATA AND METHODS
Winter is defined in this study by the extended sea-son between December and the following March(DJFM). The utilized methods draw upon several datasources spanning the time period between December1899 and March 2007. Time series of total monthly pre-cipitation were obtained for 260 climate divisionsacross the study area from the National Climatic DataCenter (Asheville, NC) (NCDC 1994). Guttman &Quayle (1996) described the construction of these divi-sions, the computation of data values for each monthand climate division on record, the data treatment pro-cedures, and discussed the strength and weaknesses ofthe dataset. The SPI was computed from the monthlyprecipitation values using the gamma distribution asdescribed by McKee et al. (1993) to obtain an indexvalue for each winter month based on the entire datarecord. The SPI monitors the probability of anom-alously dry or wet events for each year and representsthe number of standard deviations from the mean totalprecipitation value, allowing for precipitation amountsto be more comparable across various geographicregions.
A time series of the monthly Niño-3.4 SST index(Kaplan et al. 1998) was obtained from the Interna-tional Research Institute for the 1899 to 2007 period.The index represents a spatial average of SST condi-tions across the central equatorial Pacific (5° N to 5° S,90 to 150° W) and monitors the state of the ENSO. Itwas used to classify the 109 winter seasons into ElNiño, La Niña, and ENSO-neutral years. A DJFMperiod was classified as an El Niño (La Niña) if the5 mo running mean of the Niño-3.4 index exceeded0.5°C (–0.5°C) for at least 6 consecutive months duringand prior to the season. All remaining years were con-sidered ENSO neutral. The resulting classification ofyears by ENSO phases is shown in Table 1. A total of24 La Niña (ENSO–), 26 El Niño (ENSO+), and 59ENSO-neutral (ENSONeu) winters were identified bythis method.
The AO index was computed by Thompson & Wal-lace (1998) by projecting the AO pattern on NH sealevel pressure. A time series of the monthly indexspanning the 1899 to 2001 winter periods was obtainedfrom Colorado State University (CSU). Also obtainedwere records of the monthly AO time series from theClimate Prediction Center (CPC) for the 1950 to 2007period. The December through March indices wereextracted from each data source. The CPC monthlytime series for the period 1950–2001 were used to pre-dict the 2002–2007 winter values for the CSU datasetusing simple linear regression (Wilks 1995) to obtain acontinuous dataset for the AO between 1900 and 2007.The regression coefficients are shown in Table 2. For
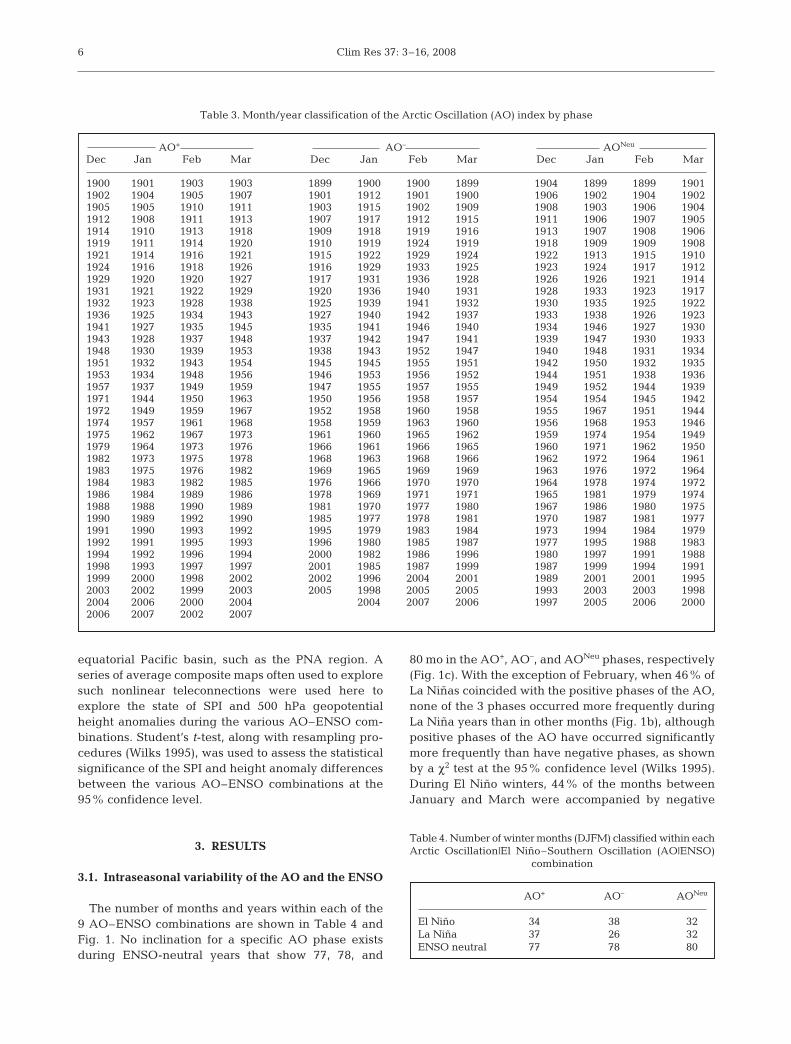
each month, the extrapolated 1899–2007 CSU datasetcontained 108 yr of records for December and 109 yrfor January through March. The dataset was used toclassify all winter months into positive, negative, andneutral phases of the AO by dividing the distributionsinto thirds (Table 3) (Wilks 1995). Values that fellwithin the 33.3rd percentile were classified as AO neg-ative (AO–), those that fell above the 66.6th percentilewere classified as AO positive (AO+). All remainingyears were considered AO neutral (AONeu).
Time series for each of the 4 winter months wereobtained for 500 hPa geopotential heights for the1949–2007 period to examine the atmospheric circula-tion regimes associated with the various AO–ENSOcombinations. The data were obtained for the NH fromthe NCEP/NCAR reanalysis (Kalnay et al. 1996)dataset, gridded to a 2.5° × 2.5° resolution. Monthlyanomalies were computed for each dataset based onthe period of record.
ENSO teleconnections vary from one event to thenext (Hoerling et al. 1997). Teleconnections observedduring El Niño are rarely a mirror image of thoseobserved during La Niña (Montroy et al. 1998). Thisfact is especially true in remote areas far from the
5
Table 1. El Niño, La Niña, and ENSO-neutral winters asdefined by the DJFM season (1899 to 2007) (listed years
correspond to the months of January through March)
El Niño (ENSO+) 1900, 1903, 1905, 1906, 1912, 1914, 1915,1919, 1920, 1924, 1926, 1930, 1931, 1941,1942, 1958, 1966, 1970, 1973, 1983, 1987,1992, 1995, 1998, 2003, 2005
La Niña (ENSO–) 1904, 1909, 1910, 1911, 1917, 1925, 1934,1939, 1943, 1945, 1950, 1956, 1965, 1971,1974, 1975, 1976, 1985, 1989, 1996, 1999,2000, 2001, 2007
ENSO neutral 1899, 1901, 1902, 1907, 1908, 1913, 1916,(ENSONeu) 1918, 1921, 1922, 1923, 1927, 1928, 1929,
1932, 1933, 1935, 1936, 1937, 1938, 1940,1944, 1946, 1947, 1948, 1949, 1951, 1952,1953, 1954, 1955, 1957, 1959, 1960, 1961,1962, 1963, 1964, 1967, 1968, 1969, 1972,1977, 1978, 1979, 1980, 1981, 1982, 1984,1986, 1988, 1990, 1991, 1993, 1994, 1997,2002, 2004, 2006
Table 2. Linear regression coefficients used to estimate theColorado State University Arctic Oscillation time series
between 2002 and 2007
Slope Intercept r2
December 1.022 0.190 0.972January 1.030 0.473 0.980February 1.011 0.455 0.971March 1.065 0.277 0.985
Clim Res 37: 3–16, 2008
equatorial Pacific basin, such as the PNA region. Aseries of average composite maps often used to exploresuch nonlinear teleconnections were used here toexplore the state of SPI and 500 hPa geopotentialheight anomalies during the various AO–ENSO com-binations. Student’s t-test, along with resampling pro-cedures (Wilks 1995), was used to assess the statisticalsignificance of the SPI and height anomaly differencesbetween the various AO–ENSO combinations at the95% confidence level.
3. RESULTS
3.1. Intraseasonal variability of the AO and the ENSO
The number of months and years within each of the9 AO–ENSO combinations are shown in Table 4 andFig. 1. No inclination for a specific AO phase existsduring ENSO-neutral years that show 77, 78, and
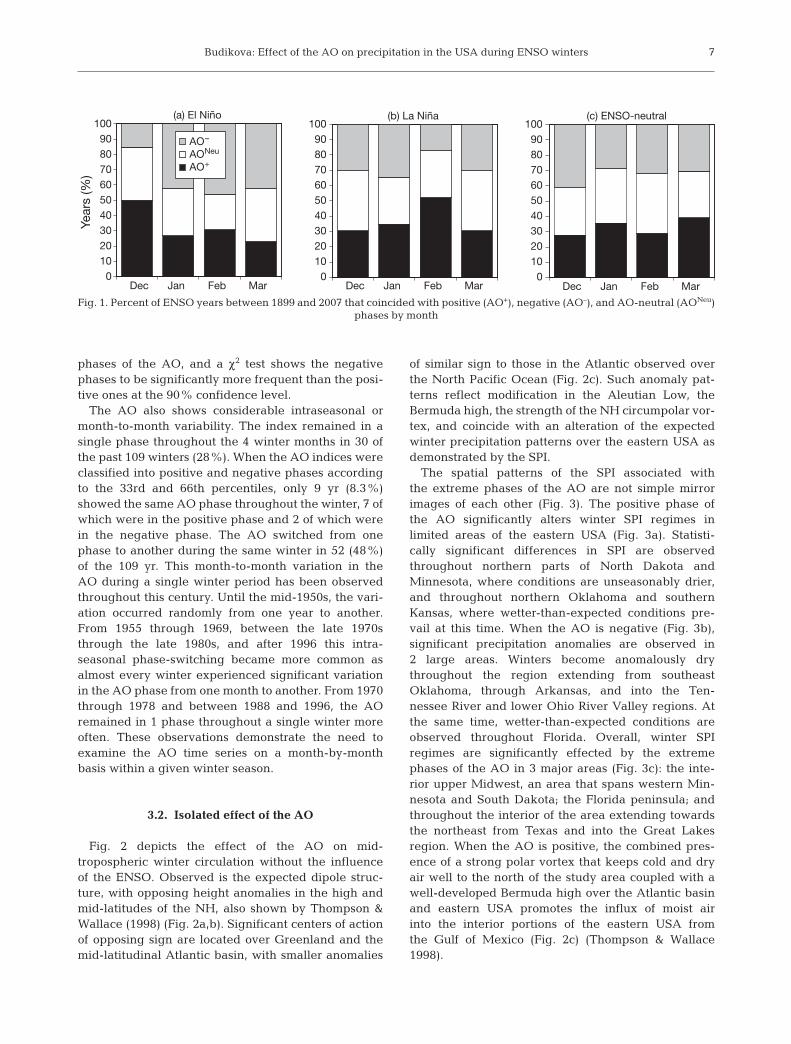
80 mo in the AO+, AO–, and AONeu phases, respectively(Fig. 1c). With the exception of February, when 46% ofLa Niñas coincided with the positive phases of the AO,none of the 3 phases occurred more frequently duringLa Niña years than in other months (Fig. 1b), althoughpositive phases of the AO have occurred significantlymore frequently than have negative phases, as shownby a χ2 test at the 95% confidence level (Wilks 1995).During El Niño winters, 44% of the months betweenJanuary and March were accompanied by negative
6
Table 4. Number of winter months (DJFM) classified within eachArctic Oscillation|El Niño–Southern Oscillation (AO|ENSO)
combination
AO+ AO– AONeu
El Niño 34 38 32La Niña 37 26 32ENSO neutral 77 78 80
Table 3. Month/year classification of the Arctic Oscillation (AO) index by phase
AO+ AO– AONeu
Dec Jan Feb Mar Dec Jan Feb Mar Dec Jan Feb Mar
1900 1901 1903 1903 1899 1900 1900 1899 1904 1899 1899 19011902 1904 1905 1907 1901 1912 1901 1900 1906 1902 1904 19021905 1905 1910 1911 1903 1915 1902 1909 1908 1903 1906 19041912 1908 1911 1913 1907 1917 1912 1915 1911 1906 1907 19051914 1910 1913 1918 1909 1918 1919 1916 1913 1907 1908 19061919 1911 1914 1920 1910 1919 1924 1919 1918 1909 1909 19081921 1914 1916 1921 1915 1922 1929 1924 1922 1913 1915 19101924 1916 1918 1926 1916 1929 1933 1925 1923 1924 1917 19121929 1920 1920 1927 1917 1931 1936 1928 1926 1926 1921 19141931 1921 1922 1929 1920 1936 1940 1931 1928 1933 1923 19171932 1923 1928 1938 1925 1939 1941 1932 1930 1935 1925 19221936 1925 1934 1943 1927 1940 1942 1937 1933 1938 1926 19231941 1927 1935 1945 1935 1941 1946 1940 1934 1946 1927 19301943 1928 1937 1948 1937 1942 1947 1941 1939 1947 1930 19331948 1930 1939 1953 1938 1943 1952 1947 1940 1948 1931 19341951 1932 1943 1954 1945 1945 1955 1951 1942 1950 1932 19351953 1934 1948 1956 1946 1953 1956 1952 1944 1951 1938 19361957 1937 1949 1959 1947 1955 1957 1955 1949 1952 1944 19391971 1944 1950 1963 1950 1956 1958 1957 1954 1954 1945 19421972 1949 1959 1967 1952 1958 1960 1958 1955 1967 1951 19441974 1957 1961 1968 1958 1959 1963 1960 1956 1968 1953 19461975 1962 1967 1973 1961 1960 1965 1962 1959 1974 1954 19491979 1964 1973 1976 1966 1961 1966 1965 1960 1971 1962 19501982 1973 1975 1978 1968 1963 1968 1966 1962 1972 1964 19611983 1975 1976 1982 1969 1965 1969 1969 1963 1976 1972 19641984 1983 1982 1985 1976 1966 1970 1970 1964 1978 1974 19721986 1984 1989 1986 1978 1969 1971 1971 1965 1981 1979 19741988 1988 1990 1989 1981 1970 1977 1980 1967 1986 1980 19751990 1989 1992 1990 1985 1977 1978 1981 1970 1987 1981 19771991 1990 1993 1992 1995 1979 1983 1984 1973 1994 1984 19791992 1991 1995 1993 1996 1980 1985 1987 1977 1995 1988 19831994 1992 1996 1994 2000 1982 1986 1996 1980 1997 1991 19881998 1993 1997 1997 2001 1985 1987 1999 1987 1999 1994 19911999 2000 1998 2002 2002 1996 2004 2001 1989 2001 2001 19952003 2002 1999 2003 2005 1998 2005 2005 1993 2003 2003 19982004 2006 2000 2004 2004 2007 2006 1997 2005 2006 20002006 2007 2002 2007
Budikova: Effect of the AO on precipitation in the USA during ENSO winters
phases of the AO, and a χ2 test shows the negativephases to be significantly more frequent than the posi-tive ones at the 90% confidence level.
The AO also shows considerable intraseasonal ormonth-to-month variability. The index remained in asingle phase throughout the 4 winter months in 30 ofthe past 109 winters (28%). When the AO indices wereclassified into positive and negative phases accordingto the 33rd and 66th percentiles, only 9 yr (8.3%)showed the same AO phase throughout the winter, 7 ofwhich were in the positive phase and 2 of which werein the negative phase. The AO switched from onephase to another during the same winter in 52 (48%)of the 109 yr. This month-to-month variation in theAO during a single winter period has been observedthroughout this century. Until the mid-1950s, the vari-ation occurred randomly from one year to another.From 1955 through 1969, between the late 1970sthrough the late 1980s, and after 1996 this intra-seasonal phase-switching became more common asalmost every winter experienced significant variationin the AO phase from one month to another. From 1970through 1978 and between 1988 and 1996, the AOremained in 1 phase throughout a single winter moreoften. These observations demonstrate the need toexamine the AO time series on a month-by-monthbasis within a given winter season.
3.2. Isolated effect of the AO
Fig. 2 depicts the effect of the AO on mid-tropospheric winter circulation without the influenceof the ENSO. Observed is the expected dipole struc-ture, with opposing height anomalies in the high andmid-latitudes of the NH, also shown by Thompson &Wallace (1998) (Fig. 2a,b). Significant centers of actionof opposing sign are located over Greenland and themid-latitudinal Atlantic basin, with smaller anomalies
of similar sign to those in the Atlantic observed overthe North Pacific Ocean (Fig. 2c). Such anomaly pat-terns reflect modification in the Aleutian Low, theBermuda high, the strength of the NH circumpolar vor-tex, and coincide with an alteration of the expectedwinter precipitation patterns over the eastern USA asdemonstrated by the SPI.
The spatial patterns of the SPI associated withthe extreme phases of the AO are not simple mirrorimages of each other (Fig. 3). The positive phase ofthe AO significantly alters winter SPI regimes inlimited areas of the eastern USA (Fig. 3a). Statisti-cally significant differences in SPI are observedthroughout northern parts of North Dakota andMinnesota, where conditions are unseasonably drier,and throughout northern Oklahoma and southernKansas, where wetter-than-expected conditions pre-vail at this time. When the AO is negative (Fig. 3b),significant precipitation anomalies are observed in2 large areas. Winters become anomalously drythroughout the region extending from southeastOklahoma, through Arkansas, and into the Ten-nessee River and lower Ohio River Valley regions. Atthe same time, wetter-than-expected conditions areobserved throughout Florida. Overall, winter SPIregimes are significantly effected by the extremephases of the AO in 3 major areas (Fig. 3c): the inte-rior upper Midwest, an area that spans western Min-nesota and South Dakota; the Florida peninsula; andthroughout the interior of the area extending towardsthe northeast from Texas and into the Great Lakesregion. When the AO is positive, the combined pres-ence of a strong polar vortex that keeps cold and dryair well to the north of the study area coupled with awell-developed Bermuda high over the Atlantic basinand eastern USA promotes the influx of moist airinto the interior portions of the eastern USA fromthe Gulf of Mexico (Fig. 2c) (Thompson & Wallace1998).
7
(a) El Niño
Year
s (%
)
1009080706050403020100
1009080706050403020100
1009080706050403020100
(b) La Niña
Dec Jan Feb Mar Dec Jan Feb Mar Dec Jan Feb Mar
(c) ENSO-neutral
AO–
AONeu
AO+
Fig. 1. Percent of ENSO years between 1899 and 2007 that coincided with positive (AO+), negative (AO–), and AO-neutral (AONeu) phases by month

Clim Res 37: 3–16, 2008
3.3. Effect of the AO on ENSO-related precipitation
Winter SPI regimes associated with El Niño are dis-tinct during various phases of the AO (Fig. 4a to f).Without the influence of the AO, high SPI values arepresent in Florida and throughout Texas and the GreatPlains region south of South Dakota, where wetter-than-expected conditions prevail (Fig. 4a). When theAO becomes positive, the wet conditions observed inFlorida spread into the interior and along the easternseaboard to Virginia (Fig. 4b), the most significantlyaffected states being Alabama, Georgia, and SouthCarolina (Fig. 4d).
The presence of the negative phase of the AO coin-cides with a significant ‘drying’ of a large area span-ning towards the northeast from eastern Kansas tothe Great Lakes via Missouri, Illinois, Indiana, Ohio,Kentucky, and eastern Pennsylvania (Fig. 4c). Alsomodified are precipitation patterns across southernFlorida, where the typically wet conditions associatedwith El Niño become even wetter when AO is in itsnegative phase.
Fig. 4f reveals a vast area with significantly differentEl Niño-related SPI regimes associated with the 2extreme phases of the AO. This region spans east-wards of the Great Plains and is marked by signifi-
cantly wetter El Niño winters during the positive phaseof the AO. Precipitation of the Florida Peninsula is alsodistinctly affected during El Niño years, with signifi-cantly drier winters present during the positive phase.
When the AO is in its neutral phase, La Niña wintersare typically marked by wet conditions throughoutthe southern portions of the Ohio Valley, in the Ten-nessee Valley, around the northern Great Lakes ofWisconsin, Michigan, Minnesota, and in North Dakota(Fig. 5a). At this time, conditions are dry throughout
8
Fig. 2. The 500 hPa geopotential height anomalies (m): (a)AO+|ENSONeu, (b) AO–|ENSONeu, and (c) difference in heightanomalies during positive and negative phases of the AOwhen ENSO is neutral (AO+|ENSONeu and AO–|ENSONeu).Darkly shaded areas: significant at the 95% confidence level
a b
c

Budikova: Effect of the AO on precipitation in the USA during ENSO winters
Texas, along the Gulf coast, and in Florida. With theexception of Florida, the SPI returns to seasonal levelswhen the AO becomes positive (Fig. 5b). Fig. 5d showsthat areas with significant effects on SPI regimes whenthe AO is positive are small in extent and randomlyscattered. Precipitation conditions return to seasonalvalues throughout the study area during months whenthe AO is negative (Fig. 5a,c,e). Fig. 5f shows areaswith markedly different La Niña-related SPI regimesto be associated with the 2 extreme phases of the AO.Included are regions of southern Louisiana, Alabama,Georgia, and northern Florida, where winters are sig-nificantly drier during the positive phase of the AO. Atthe same time, wetter La Niña winters are observedwhen the AO is in its positive phase in the interiorof the study area, with significant differences beingobserved across the northern sections of the OhioValley.
Fig. 6a,b reveal the distinct effect of the 2 extremephases of the AO on ENSO-related SPI. When the AO ispositive, El Niño precipitation regimes are significantlydifferent from those observed during La Niña along theeast coast from Florida to New England, along the GulfStates, throughout Texas, and the southern GreatPlains. When compared to La Niña, these areas are sig-nificantly wetter during El Niño years. Also, distinctlyaffected are limited sections of the northern Ohio Val-ley, where El Niños are significantly drier in compari-son to La Niñas (Fig. 6a). When the AO is negative, theeffected area around the Great Lakes markedly ex-pands to include the northern sections of the Midwestaround Lake Superior, the central Midwest, and theOhio Valley. At the same time, the large area of signifi-cantly wetter conditions observed during El Niño whenthe AO is positive becomes limited to Florida, southernGeorgia, the southern Gulf States and Texas, when theAO becomes negative (Fig. 6b).
3.4. Atmospheric circulation
3.4.1. Isolated ENSO teleconnections
Atmospheric conditions associated with ENSO-related SPI regimes were examined using averagecomposite maps of 500 hPa geopotential height sur-
9
Fig. 3. Differences in mean standardized pre-cipitation index (SPI; σ) depicting the impact ofthe various phases of the AO under ENSO-neutral conditions: when the AO is (a) positive,(b) negative, and (c) between positive and neg-ative phases. Dotted and outlined areas: signif-icant differences at the 95% confidence level

Clim Res 37: 3–16, 200810
Fig. 4. Effect of the AO on mean El Niño-related SPI (σ) when (a) AO is neutral, (b) AO is positive, (c) AO is negative; (d) differ-ence between positive and neutral phases (effect of the positive phase of the AO), (e) difference between negative and neutralphases (effect of the negative phase of the AO), and (f) overall effect of the extreme phases of AO. Dotted and outlined areas:
significant differences at the 95% confidence level

Budikova: Effect of the AO on precipitation in the USA during ENSO winters 11
Fig. 5. Effect of the AO on La Niña-related SPI (σ) for the same conditions as described in Fig. 4

Clim Res 37: 3–16, 2008
faces as they help define the migration paths of airmasses and storms that control temperature and pre-cipitation over the PNA region (Diaz et al. 2001). Thetypical El Niño and La Niña signatures in the mid-tropospheric field have been well documented over thePNA region and are evident during AO-neutral peri-ods. El Niño events coincide with a circulation patternthat resembles the positive phase of the PNA pattern(Fig. 7a) that favors a strong meridional flow of thepolar jet stream and winter storm tracks across thenorthern sections of the USA and a strong subtropicaljet flow across the south. The synoptic circulation pat-tern during La Niña occurrences typically resemblesthe reverse phase of the PNA reflective of a zonal west-to-east jet and storm track flow over the North Ameri-can continent (Fig. 7b).
3.4.2. Effect of the AO on ENSO-related atmosphericcirculation
The positive phase of the AO alters the expectedsynoptic conditions over the PNA region during ElNiño winters (Figs. 7a,c & 8a). Height anomalies dropover the high latitudes of the NH and Eurasia, with sig-nificant declines in pressures observed over Green-land and central Eurasia. Geopotential heights risethroughout the mid-latitudes, significantly over Europeand just off the northeastern coast of USA. The pres-ence of a well-developed high pressure system overthe North American continent, including the easternUSA and the western Atlantic basin, promotes theinflux of moist air into the study area from the east.
Mid-tropospheric height anomalies decline (rise)throughout the mid- (high-)latitudes of the NH duringEl Niño years when the AO is negative (Figs. 7a,d &8b). The decline in pressure is statistically significantover the northwestern sections of the North Pacific andAsia, throughout the Atlantic basin and over Mexico.Significant rise in geopotential heights spans an areaaround the polar cap from Beaufort and the SiberianSea to the Greenland Sea and Labrador. The circula-tion is marked by an intensified Aleutian Low thatextends west past the dateline and a considerablyweakened Bermuda High over the Atlantic. The high-pressure cell typically situated over the interior ofCanada is displaced to the north and east, reachingmaximum intensity over eastern Canada and Green-land. The intensification of the atmospheric circulationover the North Pacific can be attributed to the anom-alously weak polar vortex and increased meridionalflow (e.g. Marshall et al. 2001) in conjunction with theexpected circulation anomalies associated with ElNiño (e.g. Wallace & Gutzler 1981, Bond & Harrison2006).
The mid- (high-)latitudes are dominated by positive(negative) height anomalies during La Niña winterswhen the AO is in its positive phase, enhancing the ex-pected atmospheric flow over the North Pacific andsoutheastern USA (Figs. 7b,e & 8c). A statistically sig-nificant rise in geopotential heights is observed over themidlatitudes of the western North Pacific, the Atlanticbasin and over the western interior of the USA. Thesechanges are coupled with a significant decline in heightanomalies over the Arctic Ocean. When the AO is neg-ative, the positive height anomalies typically present
12
Fig. 6. Difference between mean El Niño- and La Niña-related SPI regimes (σ) during winter months when: the AO is (a) positive or (b) negative. Dotted and outlined areas: significant differences at the 95% confidence level
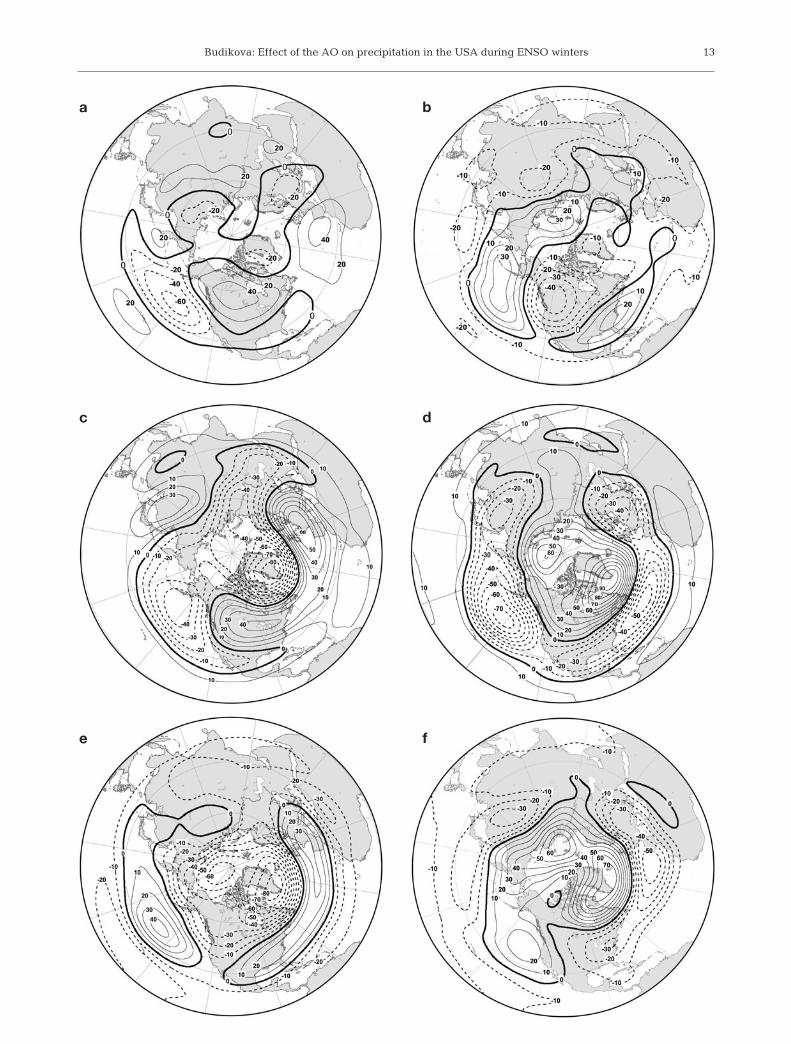
Fig. 7. Mean 500 hPa geopotential height anomalies (m) associated with various AO–ENSO combinations: (a) AONeu|ENSO+, (b) AONeu|ENSO–, (c) AO+|ENSO+, (d) AO–|ENSO+, (e) AO+|ENSO–, (f) AO–|ENSO–
Budikova: Effect of the AO on precipitation in the USA during ENSO winters
a b
c d
e f
13
Clim Res 37: 3–16, 2008
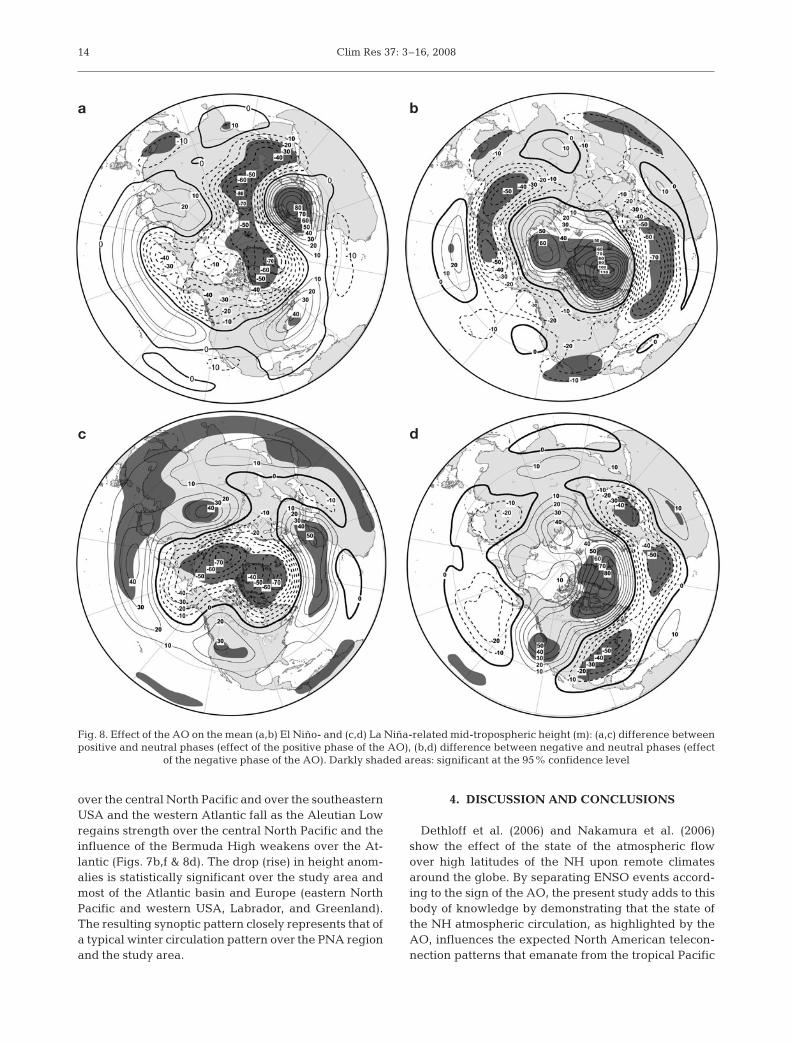
over the central North Pacific and over the southeasternUSA and the western Atlantic fall as the Aleutian Lowregains strength over the central North Pacific and theinfluence of the Bermuda High weakens over the At-lantic (Figs. 7b,f & 8d). The drop (rise) in height anom-alies is statistically significant over the study area andmost of the Atlantic basin and Europe (eastern NorthPacific and western USA, Labrador, and Greenland).The resulting synoptic pattern closely represents that ofa typical winter circulation pattern over the PNA regionand the study area.
4. DISCUSSION AND CONCLUSIONS
Dethloff et al. (2006) and Nakamura et al. (2006)show the effect of the state of the atmospheric flowover high latitudes of the NH upon remote climatesaround the globe. By separating ENSO events accord-ing to the sign of the AO, the present study adds to thisbody of knowledge by demonstrating that the state ofthe NH atmospheric circulation, as highlighted by theAO, influences the expected North American telecon-nection patterns that emanate from the tropical Pacific
14
a b
c d
Fig. 8. Effect of the AO on the mean (a,b) El Niño- and (c,d) La Niña-related mid-tropospheric height (m): (a,c) difference betweenpositive and neutral phases (effect of the positive phase of the AO), (b,d) difference between negative and neutral phases (effect
of the negative phase of the AO). Darkly shaded areas: significant at the 95% confidence level

Budikova: Effect of the AO on precipitation in the USA during ENSO winters
basin during ENSO years. Such changes, in turn, sig-nificantly modify surface precipitation patterns acrossthe eastern USA, as described by the SPI.
Between January and March, El Niño winters aremore often than not accompanied by the negative phaseof the AO. This observation is consistent with results byTaguchi & Hartmann (2006), who showed that suddenstratospheric warming indicative of a decrease in theNAM index to strong negative values is more frequentduring El Niño winters than during La Niña. Labitzke &van Loon (1999) showed that the polar vortex tends to beweaker during El Niño winters and stronger during LaNiña. A month-to-month examination of the AO re-vealed considerable intraseasonal variation of the indexduring the winter season, also found by Thompson &Wallace (2000) and Liu et al. (2007), who demonstratedthat the AO typically switches sign in late winter. Thishigh intra-seasonal variability observed in the index ofthe AO can influence month-to-month variation of ENSOteleconnections across the PNA region and thus needs tobe taken into account when assessing the interactionbetween the AO and ENSO during the winter season.
The precise position and strength of the troughs andridges of the mid-tropospheric circulation over thePNA region strongly influence the winter precipitationregimes across the USA (Yarnal & Leathers 1988).More recently, Li et al. (2006) pointed out the impor-tance of the state of the Aleutian Low over the Gulf ofAlaska to the development of an anomalous high overthe USA and the entire Rossby wave train pattern overthe PNA region, along with the manifestation of thesurface weather and climate anomalies during ENSOevents. The results of the present study confirm theseclaims. The most pronounced and influential to the cli-mate of the USA are modifications in atmospheric cir-culation over the mid- and high latitudes of the NorthPacific and the North American continent, specificallythose related to the strength and position of the Aleut-ian Low, the Canadian High, and the Bermuda High.El Niño-related precipitation regimes are more exten-sively affected by the AO than are precipitation pat-terns associated with La Niña. As well, the negativephase of the AO more significantly modifies ENSO-related precipitation and circulation regimes across theeastern USA than does the positive phase of the index.
Wetter-than-expected winters are observed duringEl Niño events along the southeast coast when the AO isin its positive phase. These conditions coincide with aweakened Aleutian Low and a strong ridge over thenortheast USA and the North Atlantic, reflective of awell-developed Bermuda High. At this time, the upperair flow over the study area is dominated by easterlywind flow that advects moist air into the region. Bond &Harrison (2006) found that when the AO is positive, thegeneral circulation flow associated with El Niño is gen-
erally weaker and less meridional in comparison to timeswhen the AO is negative. When the AO is negative,El Niño winters are significantly drier than expectedthroughout large sections of the central Midwest andthe Ohio Valley, while southern Florida is significantlywetter than during El Niño years when the AO is neutral.At this time, the synoptic and surface SPI conditions re-semble those of an enhanced El Niño. Such conditionscoincide with the influx of northwesterly air flow into thenorthern USA and a well-developed subtropical jet, thattogether bring cold and dry air into the mid-section of thestudy area and wet conditions to the south, respectively.These results are in general agreement with those ofBond & Harrison (2006), who found the effects of El Niñoto be much stronger when the AO is in its negativephase. The positive phase of the AO shows little effect onthe expected La Niña SPI and atmospheric circulationregimes over the eastern USA and the PNA region, re-spectively. Significant modifications of the SPI regimesassociated with La Niña months when the AO is nega-tive are limited to the southeastern sections of the Gulfof Mexico, with the atmospheric circulation regimesresembling those of a typical winter.
The present study aimed to isolate the combinedeffects of the AO and ENSO on winter precipitationand atmospheric circulation across the eastern USA. Inaddition, other potentially important modes of winterclimate variability influence the climate during ENSOyears. Among these are the PDO (e.g. Gershunov &Barnett 1998), the AMO (e.g. Enfield et al. 1999), andlong-term climate trends (e.g. Diaz et al. 2001). As aresult the documented precipitation and associatedcirculation patterns in the present study will be influ-enced by other factors as well and cannot be strictlyattributed to the AO alone.
The results of this study display evidence of consider-able interaction between 2 principal modes of extratrop-ical variability, ENSO and the AO. The state of the AOsignificantly influences ENSO-related teleconnectionpatterns and associated precipitation regimes across theeastern USA during winter months. The high month-to-month variability in the index of the AO needs to be con-sidered when assessing its interaction with ENSO. Thisknowledge contributes to our understanding of inter-ENSO variability of remote teleconnections across thePNA region (e.g. Hoerling & Kumar 1997, Hoerling etal. 1997), and, in turn, can have a positive effect on ourability to provide better winter climate forecasts acrossthe eastern USA during ENSO episodes, especially oncethe state of the AO can be forecasted with appreciableskill for a lead time of one or more seasons.
Acknowledgements. The author thanks the anonymous re-viewers for their insightful comments, and Melissa DoughertyO’Hara for assistance with cartography.
15
Clim Res 37: 3–16, 2008
LITERATURE CITED
Baldwin MP, Durkerton TJ (1999) Propagation of the ArcticOscillation from the stratosphere to the troposphere. J Geo-phys Res 104:30,937–30,946
Bond NA, Harrison DE (2006) ENSO’s effect on Alaska duringopposite phases of the Arctic Oscillation. Int J Climatol 26:1821–1841
Bronnimann S, Luterbacher J, Staehelin J, Svendby TM,Hansen G, Svenoe T (2004) Extreme climate of the globaltroposphere and stratosphere in 1940–42 related to El Niño.Nature 431:971–974
Budikova D (2005) Impact of the Pacific Decadal Oscillation onrelationships between temperature and the Arctic Oscilla-tion in the USA in winter. Clim Res 29:199–208
Dethloff K, Rinke A, Benkel A, Koltzow M and others (2006) Adynamical link between the Arctic and the global climatesystem. Geophys Res Lett 33:L03703
Diaz HF, Hoerling MP, Eischeid JK (2001) ENSO variability,teleconnections and climate change. Int J Climatol 21:1845–1862
Enfield DB, Mestas-Nuñez AM, Trimble PJ (2001) The Atlanticmultidecadal oscillation and its relation to rainfall and riverflows in the continental U.S. Geophys Res Lett 28:2077–2080
Frauenfeld OW, Davis RE (2000) The influence of El Niño-Southern Oscillation events on the Northern Hemisphere500 hPa circumpolar vortex. Geophys Res Lett 27:537–540
Frauenfeld OW, Davis RE (2002) Midlatitude circulationpatterns associated with decadal and interannual PacificOcean variability. Geophys Res Lett 29:2221
Gershunov A, Barnett TP (1998) Interdecadal modulation ofENSO teleconnections. Bull Am Meteorol Soc 79:2715–2726
Guttman NB, Quayle RG (1996) A historical perspective of USclimate divisions. Bull Am Meteorol Soc 77:293–303
Hamilton K (1993) An examination of observed Southern Os-cillation effects in the Northern Hemisphere stratosphere.J Atmos Sci 50:3468–3473
Higgins RW, Leetmaa A, Xue Y, Barnston A (2000) Dominantfactors influencing the seasonal predictability of U.S. pre-cipitation and surface air temperature. J Clim 13:3994–4017
Higgins RW, Silva VBS, Shi W, Larson J (2007) Relationshipsbetween climate variability and fluctuations in daily precip-itation over the United States. J Clim 20:3561–3579
Hoerling MP, Kumar A (1997) Why do North American climateanomalies differ from one El Niño event to another? Geo-phys Res Lett 24:1059–1062
Hoerling MP, Kumar A, Zhong M (1997) El Niño, La Niña, andthe nonlinearity of their teleconnections. J Clim 10:1769–1785
Huang JP, Higuchi K, Shabbar A (1998) The relationshipbetween the North Atlantic Oscillation and the El Niño–Southern Oscillation. Geophys Res Lett 25:2707–2710
Kalnay E, Kanamitsu M, Kistler R, Collins W and others (1996)The NCEP/NCAR 40-year reanalysis project. Bull AmMeteorol Soc 77:437–471
Kaplan A, Cane M, Kushnir Y, Clement A, Blumenthal M,Rajagopalan B (1998) Analyses of global sea surface tem-perature 1856–1991. J Geophys Res 103:18,567–18,589
Labitzke K, van Loon H (1999) The stratosphere. Springer,New York
Leathers DJ, Yarnal B, Palecki MA (1991) The Pacific/NorthAmerican teleconnection pattern and United States climate.I: Regional temperature and precipitation associations.J Clim 4:517–528
Li S, Hoerling MP, Peng S, Weickmann KM (2006) The annularresponse to tropical Pacific SST forcing. J Clim 19:1802–1819
Limpasuvan V, Hartmann DL (1999) Eddies and the annularmodes of climate variability. Geophys Res Lett 26:3133–3136
Liu Z, Liu Y, Wu L, Jacob R (2007) Seasonal and long-term
atmospheric responses to reemerging North Pacific Oceanvariability: a combined dynamical and statistical assess-ment. J Clim 20:955–980
Lorenz EN (1951) Seasonal and irregular variations of thenorthern hemisphere sea-level pressure profile. J Meteorol8:52–59
Marshall J, Kushnir Y, Battisti D, Change P and others (2001)North Atlantic climate variability: phenomenon, impactsand mechanisms. Int J Climatol 21:1863–1898
McCabe GJ, Palecki MA, Betancourt JL (2004) Pacific andAtlantic Ocean influences on multidecadal drought fre-quency in the United States. Proc Natl Acad Sci USA101:4136–4141
McKee TB, Doesken NJ, Kleist J (1993) The relationship ofdrought frequency and duration to time scales. In: Proc8th Conf Applied Climatology. American MeteorologicalSociety, Boston, p 179–184
Montroy DL, Richman MB, Lamb PJ (1998) Observed non-linearities of monthly teleconnections between tropicalPacific sea surface temperature anomalies and Central andEastern North American precipitation. J Clim 11:1812–1835
Nakamura T, Tachibana Y, Honda M, Yamane S (2006) Influ-ence of the Northern Hemisphere annular mode on ENSOby modulating westerly wind bursts. Geophys Res Lett 33:L07709
NCDC (1994) Time bias corrected divisional temperature-precipitation-drought index. National Climatic Data CenterDocumentation for dataset TD-9640. Available from DBMB,NCDC, NOAA, Federal Building, 37 Battery Park Ave.,Asheville, NC 28801-2733
New M, Todd M, Hulme M, Jones P (2001) Precipitationmeasurements and trends in the twentieth century. Int J Cli-matol 21:1889–1922
Quadrelli R, Wallace JM (2002) Dependence of the structure ofthe Northern Hemisphere annular mode on the polarity ofENSO. Geophys Res Lett 29
Randel WJ (2004) Wider connections for El Niño. Nature431:920–921
Rodó X, Baert E, Comin FA (1997) Variations in seasonal rain-fall in southern Europe during present century: relation-ships with the North Atlantic Oscillation and the El Niño–Southern Oscillation. Clim Dyn 13:275–284
Ropelewski CF, Halpert MS (1989) Precipitation patterns asso-ciated with the high index phase of the Southern Oscilla-tion. J Clim 2:268–284
Taguchi M, Hartmann DL (2006) Change in occurrence fre-quency of stratospheric sudden warmings with ENSO-likeSST forcing as simulated WACCM. J Clim 19:324–332
Thompson DWJ, Lorenz DJ (2004) The signature of the annularmodes in the tropical troposphere. J Clim 17:4330–4342
Thompson DWJ, Wallace JM (1998) The Arctic Oscillation inthe wintertime geopotential height and temperature fields.Geophys Res Lett 25:1297–1300
Thompson DWJ, Wallace JM (2000) Annular modes in theextratropical circulation. I: Month-to-month variability.J Clim 13:1000–1016
Wallace JM, Gutzler DS (1981) Teleconnections in the geo-potential height field during the northern hemisphere win-ter. Mon Weather Rev 109:784–812
Wilks DS (1995) Statistical methods in the atmospheric sci-ences: an introduction. International Geophysics Series, Vol59. Academic Press, New York
Yarnal B, Leathers DJ (1988) Relationships between inter-decadal and interannual climatic variations and their effecton Pennsylvanian climate. Ann Assoc Am Geogr 78:624–641
Zhang Y, Wallace JM, Battisti DS (1997) ENSO-like inter-decadal variability: 1900–93. J Clim 10:1004–1020
16
Editorial responsibility: Daniel Scott,Waterloo, Ontario, Canada
Submitted: November 19, 2007; Accepted: April 22, 2008Proofs received from author(s): June 25, 2008