Stress induced gene expression: a direct role for MAPKAP kinases ...

East Tennessee State UniversityDigital Commons @ East
Tennessee State University
Electronic Theses and Dissertations Student Works
12-2010
Effect of Stress on Mucin Expression in theGastrointestinal Tract of Mice.Bupe Martha HabiyambereEast Tennessee State University
Follow this and additional works at: https://dc.etsu.edu/etd
Part of the Biology Commons
This Thesis - Open Access is brought to you for free and open access by the Student Works at Digital Commons @ East Tennessee State University. Ithas been accepted for inclusion in Electronic Theses and Dissertations by an authorized administrator of Digital Commons @ East Tennessee StateUniversity. For more information, please contact [email protected].
Recommended CitationHabiyambere, Bupe Martha, "Effect of Stress on Mucin Expression in the Gastrointestinal Tract of Mice." (2010). Electronic Theses andDissertations. Paper 2253. https://dc.etsu.edu/etd/2253

Effect of Stress on Mucin Expression in the Gastrointestinal Tract of Mice _____________________
A thesis
presented to
the faculty of the Department of Biological Sciences
East Tennessee State University
In partial fulfillment
of the requirements for the degree
Master of Science in Biology
_____________________
by
Bupe Martha Habiyambere
December 2010
_____________________
Edward M. Onyango, PhD, Chair
Deling Yin, PhD
Victoria P. Ramsauer, PhD
Keywords: Stress, Mucin Expression, Gastrointestinal Tract

2
ABSTRACT
Effect of Stress on Mucin Expression in the Gastrointestinal Tract of Mice
by
Bupe Martha Habiyambere
This study investigated the effects of chronic stress on mucin expression in the GIT of
mice. Sixteen ICR male mice were randomly divided into treated and control animals.
Restraint stress was applied to the treated group for 21 days. Body weight (BW)
changes and feed consumed (FC) were regularly recorded. After 21 days mice were
euthanized and blood, GIT mucosa, and GIT sections were collected. Serum
corticosterone levels were determined. The GIT sections were fixed, paraffin
embedded, sectioned, and stained with AB-PAS to visualize goblet cells. Mucin
expression was determined using qPCR. As expected stressed mice showed higher
corticosterone than the control animals. BW decreased in the stressed group. Histology
showed a decrease in goblet cells in stressed mice. Muc1 and Muc4 in the colon and
Muc3 in the duodenum were upregulated in stressed animals. These findings suggest
that chronic stress may affect mucin expression in the GIT.

3
AKNOWLEDGEMENTS
I would like to thank my committee chair and advisor Dr Edward Onyango for his
support, guidance, patience, and mentoring during these 3 years. I thank Dr Victoria
Ramsauer and Dr Deling Yin for their support, contributions, and suggestions.
I thank Dr Michelle Duffourc and Rhesa Dykes for their guidance through the
process of running qPCR, Marla Perna for her help in different projects.
I would like also to thank the department of Biological Sciences for their
academic and financial support through a graduate assistantship and covering travel
expenses as well as part of my research budget. Kristi Tipton, I thank you for being
there, always willing to help. I thank my fellow graduate and undergraduate students for
their friendship, support, word of encouragement or smile; many have made an
impression that will last a lifetime.
I thank the graduate school for supporting part of this study through the student
research grant. There are many other friends who helped me and words cannot express
my gratitude toward you, from the bottom of my heart, thank you for holding my hand
during this journey.
Last but not least, I thank my family. My “Sunshine”, you have been the best
cheerleader, your trust and confidence motivated me to excel. This is my way of
reminding you to “Think Big”!

4
DEDICATION
To Tabita and Kemo
5
CONTENTS
Page
ABSTRACT ………………………………………………………………………………….. 2
AKNOWLEDGEMENTS .…………………………………………………………………… 3
DEDICATION ………………………………………………………………………………... 4
LIST OF TABLES …………………………………………………………………………… 9
LIST OF FIGURES ………………………………………………………………………… 10
Chapter
1. INTRODUCTION AND LITERATURE REVIEW ……………………………. 12
Background …………………………………………………………………. 12
Histology of the Gastrointestinal Tract …………………………………... 15
Classification of Mucins ……………………………………………………. 17
Functions and Expression Sites of Mucins …………………………….... 19
Stress Response ………………………………………………………….... 21
Cardiovascular Response to Stress .……………………………… 21
Stress Response in the Gastrointestinal Tract ………………….. 22
Mucins in Disease ………………………………………………………….. 25
Importance of Stress-Related Diseases ……………………………….... 29
Hypothesis ………………………………………………………………….. 30
Objectives …………………………………………………………………… 30

6
2. MATERIALS AND METHODS ……………………………………………….. 31
Experimental Materials .…………………………………………………… 31
Animals ……………………………………………………………... 31
Weighing of Animal and Feed .…………………………………… 31
Blood Collection …………………………………………………… 32
Induction of Stress ………………………………………………… 32
Primers Used in the Study………………………………………… 32
Experimental Methods ……………………………………………………. 32
Stress Hormone Assay or Corticosterone Assay ……………… 32
Determination of Mucin Expression Using Real-Time Polymerase
Chain Reaction qPCR ……………............................................. 35
Collection of Mucosa ..…………………………………………….. 35
RNA Isolation ………………………………………………………. 36
DNase Treatment ………………………………………….. 37
RNA Concentration and Integrity Check ……………….............. 37
Reverse Transcription of RNA …………………………………… 38
Negative Control or Reverse Transcriptase Minus …………….. 38
Generation of Positive Controls ………………………………….. 39
Ligation and Transformation ……………………………… 39
Purification of Plasmids …………………………………… 41
Optimization of Standards ………………......................... 43
Quantitative qPCR Setup and Run ………………………………. 45

7
Histology ……………………………………………………………………. 46
Collection of Tissue Samples …………………………….. 46
Preparation of Histological Sections …………………….. 47
Alcian Blue-Periodic Acid Schiff (AB-PAS) Staining …… 48
Statistical Analysis …………………….………………………….............. 50
Corticosterone Levels …………………………………...... 50
Body Weight Gain and Feed Consumed ……………….. 51
Histological Data …………………………………………... 51
qPCR Data …………………………………………………. 51
3. RESULTS ………………………………………………………………………. 52
Corticosterone Levels in the Serum of Stressed and Control Mice ….. 52
Body Weight (BW) and Feed Consumed (FC) of Stressed and
Control Mice ……………………………………………………….……….. 53
GC Count in the Duodenum, Jejunum, and Ileum of Stressed and
Control Mice ………………….…………………………………………….. 56
Villus Length in the Duodenum, Jejunum, and Ileum of Stressed and
Control Mice ………………………………………………………............. 58
RNA Concentration and Integrity Check using the Agilent ……………. 60
Expression Sites of Muc1, Muc2, Muc3, Muc4, and Muc5ac in the
GIT of Mice …………………………………………………………………. 62
Assay Optimization and Validation of Assay …………………………… 65
Mucin Expression in the GIT of Stressed and Control Mice ………….. 66

8
Muc1 Expression .………………………………………………..... 66
Muc2 Expression ………………………………………………….. 68
Muc3 Expression ………………………………………………...... 69
Muc4 Expression ………………………………………................. 71
Muc5ac Expression ……………………………………………...... 72
4. DISCUSSION AND CONCLUSION ……………………………………........ 74
Discussion ………………………………………………………………….. 74
Conclusions …………………………………………………………………. 80
Future Research …………………………………………………………… 80
REFERENCES …………………………………………………………………………….. 81
VITA ………………………………………………………………………………………… 96

9
LIST OF TABLES
Table Page
1. Corticosterone levels in stressed and control mice after a 6-hour restraint
daily for 21 days …………………………………………………………………….. 55
2. Body weight of stressed and control mice taken twice weekly for 21 days …… 57
3. Cumulative feed consumed by stressed and control mice for the 3-week
study period ……………………………………………………............................... 58
4. Goblet cells (GC) counts in the duodenum, jejunum, and ileum of stressed
and control mice ….………………………………………………………………….. 60
5. Villi length (VL) measurements in the duodenum, jejunum, and ileum of
stressed and control mice ..………………………………………………………… 62
6. Determination of RNA Integrity Number (RIN) using the Agilent ………………. 64
7. Optimization of annealing temperatures the all the genes used in the study …. 69
8. Muc1 expression in the GIT of stressed and control mice ...……………………. 70
9. Muc2 expression in the GIT of stressed and control mice ……………………… 71
10. Muc3 expression in the GIT of stressed and control mice ……………………… 73
11. Muc4 expression in the GIT of stressed and control mice ……………………… 74
12. Muc5ac expression in the GIT of stressed and control mice …………………… 76

10
LIST OF FIGURES
Figure Page
1. Interactions among the mucosal barrier, the immune system, and the
gut microbiota to support the gut protective barrier in the gastrointestinal
tract …………………………………………………………………………………. 13
2. Overview of the steps followed to determine the relative expression of
a gene ………………………………………………………………………………. 36
3. Intestinal epithelium stained with AB-PAS to visualize Goblet cells ...……….. 51
4. Intestinal epithelium stained with AB-PAS to show the villus length ………… 52
5. Corticosterone levels in the sera of stressed and control mice at the end
of the study period ………………………………………..……………………….. 56
6. Body weight (g) change of stressed and control mice during the 3-week
study period ………………………………………………………………………… 58
7. Cumulative feed consumed by stressed and control mice observed during
the study period of 3 weeks ………………………………………………………. 59
8. Goblet cells count in the duodenum, jejunum, and ileum of stressed and
control mice ……………………..…………………………………………………. 61
9. Villi length (mm) measured in the duodenum, jejunum, and ileum of
stressed and control mice ..………………………………………………………. 63
10. Gel showing the RNA integrity captured using the Agilent. The 28S and
18S bands are within the ratio of 2:1 ……………………………………………. 64
11. Agarose gel electrophoresis of Muc1 expression sites in the GIT of stressed
and control mice ………………………………………………………………….... 66

11
12. Agarose gel electrophoresis of Muc2 expression sites in the GIT of stressed
and control mice ………………………………………………………………….... 66
13. Agarose gel electrophoresis of Muc3 expression sites in the GIT of stressed
and control mice …...………………………………………………………………. 67
14. Agarose gel electrophoresis of Muc4 expression sites in the GIT of stressed
and control mice ………………………………………………………………….... 67
15. Agarose gel electrophoresis of Muc5ac expression sites in the GIT of
Stressed and Control mice ……………………………………………………...... 68
16. Overexpression of Muc1 in the colon of stressed mice ……………………….. 70
17. Muc2 expression showing no difference between the stressed and control
mice …………………………………………………………………………………. 72
18. Overexpression of Muc3 in the duodenum of stressed mice …………………. 73
19. Overexpression of Muc4 in the colon of stressed mice ……………………….. 75
20. No significant difference in Muc5ac in the gastrointestinal tract of mice ……. 76
12
CHAPTER 1
INTRODUCTION AND LITERATURE REVIEW
Background
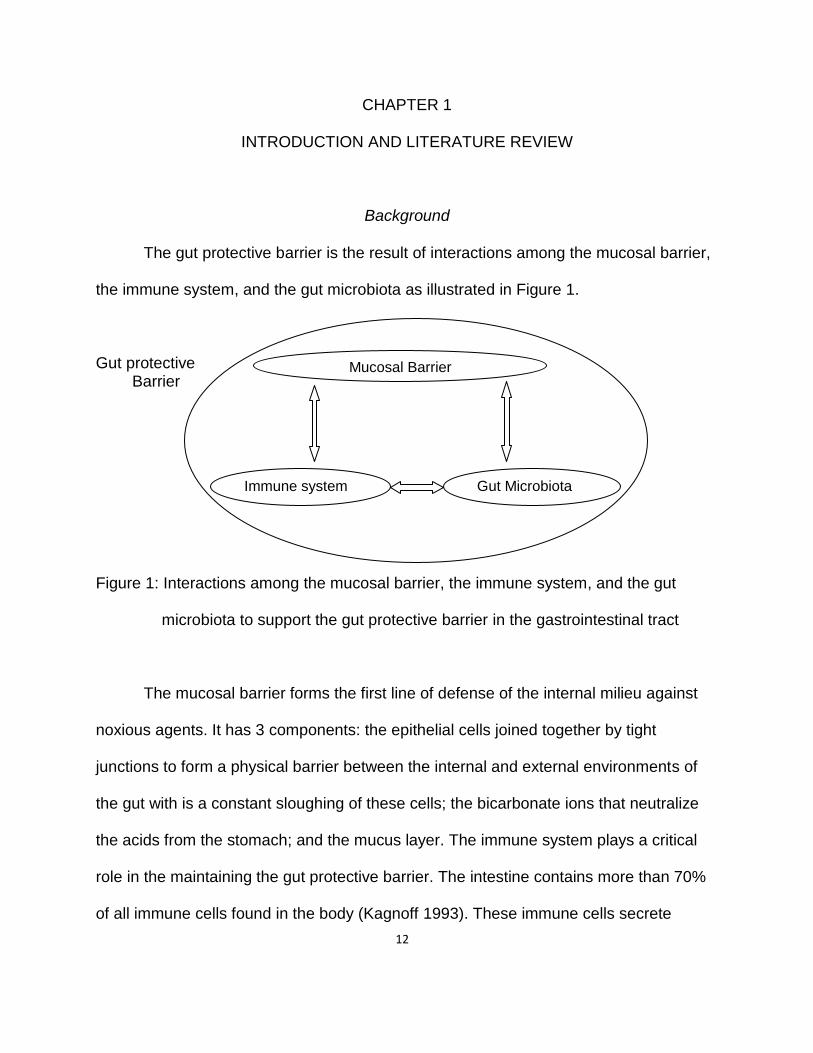
The gut protective barrier is the result of interactions among the mucosal barrier,
the immune system, and the gut microbiota as illustrated in Figure 1.
Gut protective Barrier
Figure 1: Interactions among the mucosal barrier, the immune system, and the gut
microbiota to support the gut protective barrier in the gastrointestinal tract
The mucosal barrier forms the first line of defense of the internal milieu against
noxious agents. It has 3 components: the epithelial cells joined together by tight
junctions to form a physical barrier between the internal and external environments of
the gut with is a constant sloughing of these cells; the bicarbonate ions that neutralize
the acids from the stomach; and the mucus layer. The immune system plays a critical
role in the maintaining the gut protective barrier. The intestine contains more than 70%
of all immune cells found in the body (Kagnoff 1993). These immune cells secrete
Mucosal Barrier
Immune system Gut Microbiota

13
mainly IgA and to a lesser extent IgM and IgG antibodies. The gut microbiota
comprising more than 500 bacterial species plays an important role in fermenting
nondigestible foods and synthesis of biotin and vitamin K among other vitamins. The gut
microbiota affects immune responses and works toward the maintenance of
homeostasis (Camilleri 2008). The 3 components, the mucosal barrier, the immune
system, and the gut microbiota, interact and promote the gut protective barrier. The
apical side of the epithelial cells is covered by the mucus. The mucus covering is mainly
composed by mucins.
Mucins are large heavily glycosylated proteins that form the major component of
mucus. The protein backbones of mucins may vary in size: some mucins are small,
containing only a few hundred amino acid residues, while others are quite large and
contain several thousand amino acid residues (Perez-Vilar and Hill 1999). About 80% of
the mass are carbohydrates to ensure high density and viscosity (Toribara et al. 1991;
Moniaux et al., 2001). Mucin molecules form intertwined networks that form the major
component of the mucus that protects epithelial surfaces of lumens and ducts in the
body (Garrett and Grisham 1999).
Mucins have many functions including lubrication, modulation of water and
electrolyte absorption, protection of the epithelial layer against mechanical and chemical
stress, provide attachment sites for commensal and pathogenic microbes, and serve as
ligand for the targeting of leucocytes to endothelial cells (Chang et al. 2000; Robbe et
al. 2004). Therefore interference with the integrity of the mucus layer may expose
epithelial cells to various insults. The mucus barrier particularly in the stomach is
composed of 2 layers: one loose adherent layer and a firmly adherent layer attached to

14
the gastric mucosa. These 2 layers have different protective functions (Atuma et al.
2001; Phillipson et al. 2008). The firmly adherent layer counteracts the action of
corrosive acids while the loosely adherent layer interacts with the swallowed toxic
substances and releases nitric oxide that stimulates the accumulation of mucus by the
firmly adherent layer (Atuma et al. 2001; Phillipson et al. 2008). The mucus layer does
not have the same thickness throughout the digestive tract but varies along the different
portions as demonstrated by Atuma et al. (2001).
There is growing evidence suggesting that mucins play a role in various other
epithelial cell processes such as adhesion, renewal, differentiation, and signaling
(Andrianifahanana et al. 2006). Moniaux and collaborators (2001) pointed out that
mucins take part in the growth process, fetal development, epithelial integrity,
carcinogenesis, and metastasis. Because mucins seem to be involved in different
complex processes in the body, it is important to understand the factors that regulate
the various aspects of their biology such as synthesis or secretion (Andrianifahanana et
al. 2006). It has also been established that many types of cancers and inflammatory
diseases cause deregulation of mucin expression (Devine and McKenzie 1992; Gendler
and Spicer 1995; Hollingsworth and Swanson 2004; Moniaux et al. 2004; An et al.
2007). Based on these studies, mucins are considered potential markers in early
diagnosis or detection of most tumors and inflammatory conditions in the
gastrointestinal tract and may even be used in the design of mucin-based vaccines
(Mall 2008) as well as in the development of appropriate therapies to correct
abnormalities in their expression (Andrianifahanana et al. 2006).

15
Stress is the body’s nonspecific response to threats to the internal milieu (Selye
1976; Bhatia and Tandon 2005). In humans nausea and diarrhea are instinctive ways to
respond to psychological difficulties and fear respectively. After severe trauma stress
ulcers are a common complication, these are characterized by a disrupted gastric
mucosa and bleeding (Habib et al. 2001).
This study investigated the effect of stress on the production and expression of
mucins in the gastrointestinal tract. Five mucins were examined: 3 membrane-bound
mucins (Muc1, Muc3, and Muc4) and 2 secreted gel-forming mucins (Muc2 and
Muc5ac).
Histology of the Gastrointestinal Tract (GIT)
The stomach is the largest portion of the gastrointestinal tract. It starts at the
cardiac sphincter which is the portion that joins the esophagus to the stomach and ends
at the pyloric sphincter which is its junction to the duodenum. The stomach has high
distention capabilities because of the presence of the rugae or folds of the mucosa and
submucosa. The stomach can be divided into 5 segments: the cardia, the fundus, the
corpus, the antrum, and the pylorus (Yamada et al. 2003) but Martini and Nath (2009)
combine the antrum and pylorus resulting in 4 segments.
The fragmentation or breakdown of ingested food particles that starts in the
mouth continues in the stomach in the presence of digestive juices. The structure of this
organ is adapted to its primary function and has many tubular glands whose secretions
protect the gastric mucosa and facilitate food digestion. Microscopically the stomach is

16
composed of 4 layers: the serosa, muscularis propria (longitudinal, circular, and oblique
muscle layers), the submucosa, and the mucosa (Yamada et al. 2003). The mucosa in
the stomach consists of the 3 layers: the epithelium is a simple columnar secretory
layer; the lamina propria contains nerves, blood, and lymphatic vessels; and the
muscularis mucosae. The gastric wall has openings of mucus-producing, parietal and
chief cells (Yamada et al. 2003; Martini and Nath 2009).
The final digestion, absorption of nutrients and endocrine secretion takes place in
the small intestine. The intestinal tract starts at the pyloric sphincter and ends at the
ileocecal valve for the small intestine, then the large intestine extends to the rectum.
The small intestine is composed of 3 segments: the duodenum, jejunum, and ileum
while the large intestine comprises the cecum, colon, and rectum. In order to increase
the absorption surface, the intestinal tract has the plicae circulares, villi, and microvilli.
The plicae circulares made of mucosal and submucosal invaginations are found mostly
in the duodenum and jejunum (Yamada et al. 2003; Juqueira and Carneiro 2005). The
villi are small fingerlike protrusions of the mucosa with variable appearance; they are
leaf-shaped and large in the duodenum, thin and tall in the jejunum, while they are short
and wide in the ileum (Yamada et al. 2003). The crypts of Lieberkühn found at the base
of the villi are made by the epithelium that extends into the lamina propria. The microvilli
are tiny protrusions that form the brush border on the apical cell membrane (Yamada et
al. 2003).
The small intestine like the stomach presents 4 layers: the mucosa, submucosa,
muscularis propria, and serosa. The mucosa is composed of the epithelium lubricated
by the mucus, lamina propria, and muscularis mucosae; the submucosa consists of a

17
dense connective tissue with blood and lymphatic vessels and nerves; the muscularis
propria is made of a longitudinal and circular muscular layers that control and
synchronize the peristaltic movements, while the serosa is composed of connective
tissue with mesothelial cells (Yamada et al. 2003; Martini and Nath 2009). The
epithelium in the intestine is a simple columnar type and contains the goblet cells that
are responsible for mucus production. The secretions from glands are transported to the
epithelial surface by ducts (Martini and Nath 2009). The lamina propria of the mucosa
harbors blood and lymphatic vessels, smooth muscle cells, nerve endings, and mucus
glands. Peyer’s patches are thickenings of the epithelium specifically the mucosa and
submucosa of the distal portion of the ileum (Yamada et al. 2003); they play an
important role in the gut immune system. The apical surface of the epithelium is covered
by mucus and mucins are the major component of this covering that protects epithelial
surfaces of lumens and ducts in the body (Garrett and Grisham 1999).
The gastric and intestinal epithelial cells are constantly sloughing and being
replaced from the epithelial stem cells (Martini and Nath 2009).
Classification of Mucins
Mucins have a variable number of tandem repeats (TR) rich in proline, threonine,
and serine also called PTS domain that are highly glycosylated (Gendler and Spicer
1995; Lang et al. 2007). Because of their size and complex structure, the classification
of mucins has raised a number of controversies. Classification of mucins poses a
number of questions such as the need to standardize the criteria considered for

18
classification that need to be addressed. For example, what qualifies a given gene to
belong to the mucin family? Is the presence of the TR or the amount of O-glycosides
good enough to determine that a gene belongs to the mucin family? It has been
suggested that the mucin family of genes be renamed in accordance to their sequence
homologies instead of just taking into consideration their extensive O-linked
glycosylation. This is based on the fact that the members of this family are so different
from one another that grouping them under the same entity poses some difficulty
studying them, additionally, their size and structure are very complex (Dekker et al.
2002; Lang et al. 2007). Rose and Voynow (2006) suggested that there should be
consistency in the criteria used to classify mucins. There are more than 20 human
(MUC) and murine (Muc) mucins deposited in GenBank (Rose and Voynow, 2006).
Although the question of how to classify mucins remains controversial, mucins
have nonetheless been classified into 2 main groups in relation to their location: the
membrane-bound or transmembrane and secreted mucins. The membrane-bound
mucins include MUC1, MUC3, MUC4, MUC12, MUC13, MUC16, MUC17, and MUC20
and the secreted mucins include MUC2, MUC5B, MUC5AC, MUC6, MUC7, MUC8,
MUC19, and MUC21 (Perez-Vilar and Hill 1999; Escande et al. 2002; Hollingsworth and
Swanson 2004; Andrianifahanana et al. 2006; Moal and Servin 2006; Lang et al. 2007;
Itoh et al. 2008). The secreted mucins have been further distinguished into gel-forming
such as MUC2, MUC5AC, MUC5B, MUC6, and MUC19, and non-gel forming mucins
include MUC7, MUC8, and MUC9 (Andrianifahanana et al. 2006). This study focused

19
on the expression of 5 murine mucins (Muc): Muc1, Muc2, Muc3, Muc4, and Muc5ac in
the gastrointestinal tract.
Functions and Expression Sites of Mucins
Mucins play a very important role in protection, repair, and lubrication of the
epithelia of ducts and lumens particularly in the respiratory, gastrointestinal, and genital
tracts and accessory organs such as pancreas and gallbladder (Reid and Harris 1998;
Homsi et al. 2007). They protect the underlying tissue from different insults (Robbe et al.
2004; Andrianifahanana et al. 2006). As mentioned earlier, mucins also play a role in
various other epithelial cell processes such as adhesion, renewal, differentiation, and
signaling (Andrianifahanana et al. 2006) as well as in growth, fetal development,
epithelial integrity, carcinogenesis, and metastasis (Moniaux et al. 2001). Mucins
stimulate the presence of high concentration of IgA secretion and lysozyme on the
epithelium and serve as free radical scavenger (Cross et al. 1984; Forstner and
Forstner 1994). Mucins in the gastrointestinal tract play an important role in protecting
the mucosa.
MUC1’s critical role in maintaining the integrity of the mucosal barrier during
infection has already been established. McAuley et al. (2007) suggested that surface
mucins play the role of target to the invading pathogens by limiting the interaction of
pathogens with the epithelium. They demonstrated that following an infection MUC1
was upregulated and that it was highly expressed in the stomach but was low in the
intestine. MUC1 has also a nonclassical expression site in many activated or
nonactivated immune cells (Andrianifahanana et al. 2006). It has been also suggested

20
that MUC1 has the ability to inhibit T cell activation (Chang et al. 2000) as well as play a
role in signaling (Songyang et al. 1994). MUC2 has a major function in maintaining the
integrity of the colon (Homsi et al. 2007) and it has the ability to suppress the
development of gastrointestinal tumors (Velcich et al. 2002). MUC3 (MUC3A and
MUC3B) in the secreted form can inhibit the attachment of enteric pathogens (E. coli) to
the epithelium of the gastrointestinal tract (Mack et al. 2003; Moal and Servin 2006).
Shekels and Ho postulated in 2003 that Muc3 plays an important role in the protection
of the mucosal layer. Homsi and others (2007) suggested that MUC4 together with
MUC1 play a role in the mucus external static barrier such that they are able to limit
pathogen access to the gut. MUC5AC acts as receptor for Helicobacter pylori in the
gastric epithelial tissue (Van de Bovenkamp et al. 2003; Moal and Servin 2006). MUC6
main function is to protect the susceptible epithelia against many harmful agents
(Toribara et al. 1997). The function of MUC11 and MUC12 is not well understood but
evidence seems to suggest their role in mediation of epithelial cell growth and
differentiation (Songyang et al. 1994). MUC12 may play a role in signaling (Songyang et
al. 1994). MUC13 may be a mediator of responses of the epithelia to damage and
infection (Williams et al. 1999). Its function is not clear but it is upregulated in pancreatic
cancer (Moniaux et al., 2004). MUC20 mediates the mesenchymal-epithelial transition
factor (Met) signaling cascade that participates in the inhibition of the Growth factor
receptor-bound protein 2-Ras (Grb2-Ras) pathway (Higuchi et al. 2004). MUC21
regulates immune responses (Itoh et al. 2008).

21
Stress Response
The body responds nonspecifically to a demand placed on it (Selye 1936). Two
axes control sequential and fast events: the hypothalamic-pituitary-adrenal axis and the
sympatho-adrenal axis. Many hormones play a role in this generalized stress response
including corticotrophin-releasing hormone (CRH), arginine vasopressin (AVP),
corticotrophin (ACTH), glucocorticoids (cortisol or corticosterone), catecholamines
(epinephrine, norepinephrine), and endorphins. The hypothalamic-pituitary-adrenal axis
is critical in the initiation of the stress response (Herd 1991; Habib et al. 2001; Caso et
al. 2008).
Cardiovascular Response to Stress
The aim of the cardiac response during stress is to increase the survival of the
organism when threatened in preparation for a “fight or flight” reaction; it is also called
“defense reaction” (Hjemdahl 2000). When exposed to stressful events, the body’s
cardiovascular response is characterized by tachycardia, increase of the blood pressure
and cardiac output due to the action or stimulation of glucocorticoids, and
catecholamines (Hjemdahl 2000; Habib et al. 2001). Catabolism is enhanced to produce
the energy that is channeled to where it is needed to ensure survival. The brain, heart,
and muscles are the recipients of the much needed energy, while other nonessential
functions such as reproduction and growth may be inhibited until homeostasis is re-
established.
Stress triggers in the hypothalamus the release of CRH that stimulates the cells
of the anterior pituitary to produce ACTH. AVP secreted by the posterior pituitary will

22
stimulate the anterior pituitary together with CRH to secrete ACTH as well. AVP alone
does not induce the secretion of ACTH (Habib et al. 2001). Many peptides are produced
in the anterior pituitary by the cleavage of proopiomelanocortin, a large precursor
protein. Among peptides produced are ACTH and β-endorphin. ACTH targets the
adrenal cortex, and the release of β-endorphin is directed toward the adrenal medulla.
The adrenal cortex subsequently stimulates the release of cortisol in humans or
corticosterone in mice, while the adrenal medulla stimulates the release of epinephrine.
The presence of high corticosterone levels in the blood is a clear indication that the
animal is stressed. The CRH acts on the sympathetic nerves to release norepinephrine.
The sympathetic nerves synchronizes with the adrenal medulla to release
catecholamines that in the end result in shunting the blood flow toward the brain, heart,
and muscles in readiness for the "fight or flight" response (Habib et al. 2001). The β-
endorphin released from the anterior pituitary and the brain may have analgesic effect
on the stressed body, regulate hormones, and inhibit reproduction (Lee and Wardlaw
2007).
Stress Response in the Gastrointestinal Tract (GIT)
When exposed to stress the body tries through nonspecific responses to
maintain homeostasis and ensure its survival (Caso et al. 2008). The hypothalamus
stimulates the pituitary gland and the sympathetic nervous system in response to a
stressor’s action (Herd 1991). The bidirectional interactions between the brain and the
gut through the parasympathetic and sympathetic pathways form the brain-gut axis, a
very important regulator of many processes such as gastrointestinal motility, absorption

23
of nutrients, ions transport, and blood flow (Bhatia and Tandon 2005). A stressful event
will trigger a cascade of signals along the brain-gut axis. The brain-gut direct
connections are maintained through the vagal and the splanchnic pathways (Yamada et
al. 2003). Caso and his team (2008) have emphasized the crucial role of the brain-gut
axis in regard to the effects of stress on the gastrointestinal tract. The susceptibility of
the gastrointestinal tract to stress has been studied extensively (Habib et al. 2001;
Gabry et al. 2002; Tsukada et al. 2002; Gareau et al. 2008). If stress is prolonged, the
gastric function among others will be compromised (Söderholm and Perdue 2001).
Bhatia and Tandon (2005) investigated the effect of stress on the gastrointestinal
tract. They used the intestinal tissue as study sample and noted that on one hand, in the
large intestine stress had stimulated intestinal permeability to large antigenic molecules
thus inducing among other things mast cell activation and decrease of mucin production
in the colon. On the other hand, in the small intestine stress had induced water and
electrolytes absorption (Bhatia and Tandon 2005). Reber et al. (2007) studied the
implications and mechanisms of psycho-social stress in mice and noted that there was
a localized loss of goblet cells and crypts and antigen infiltration up to the lamina
muscularis mucosae.
Because of the importance of the brain-gut axis during stress, gastrointestinal
samples were chosen in this study to investigate the effects of chronic stress on mucin
expression in mice to mimic the chronic exposure to stress in humans as suggested by
Gareau et al. (2008). After studying stress for 40 years, Selye suggested 3 conditions
that had characterized a stress response: the enlargement of the adrenal glands,
abnormal development of the thymolymphatic system, and gastric ulceration (Selye

24
1936; 1976). Numerous studies have pointed out that stress has adverse effects on the
normal function of the body. It has been associated with a host of disease conditions
such as hypertension, ulcers, congestive heart failure, and hair loss (Henry et al. 1993;
Ruwof and Van der Laarse 2000; Botchkarev 2003; Zou et al. 2004, Hayoz and
Mazzolai 2007; NIH September 2008; Kim et al. 2008). CRH has an effect on every cell
in the body, thus its upregulation may underlie many disorders such as depression,
anxiety, diabetes mellitus, and gastrointestinal dysfunctions (Habib et al. 2001).
There are controversies in regard to the etiology of ulcers in the gastrointestinal
tract (Werther 2000). Stress in itself does not cause ulcers; it acts as cofactor in the
breaking down of the gastric mucosa (Levenstein 1998). It has been postulated that in
most cases ulcers are a consequence of defects in the mucosal barrier due to
Helicobacter pylori, a spiral-shaped gram negative bacillus, or a prolonged use of
aspirin or nonsteroidal anti-inflammatory drugs (Werther 2000). In the upper
gastrointestinal tract, hydrochloric acid hypersecretion seems to be the cause instead of
the breaking down of the gastric barrier (Werther 2000). Some researchers suggest that
Helicobacter pylori bacterium causes ulcers (Marshall and Warren 1984), while others
point out that Helicobacter pylori may not be as important in the pathogenesis of gastric
ulcers. The vast majority of people infected with Helicobacter pylori are asymptomatic
(Sidebotham et al. 1991; Markesich et al. 1995); for the people who show symptoms of
gastric ulceration when treated, the cure of the Helicobacter pylori infection clears the
ulcer disease (Sidebotham et al. 1991; Markesich et al. 1995). Helicobacter pylori’s
involvement in the development of the disease is not clear. It is possible that
Helicobacter pylori weaken the host’s defense machinery (Sidebotham et al. 1991;

25
Markesich et al. 1995). Studies have shown that stress causes dysfunction of the
gastrointestinal tract system (Gareau et al. 2008), it could be inferred that there may be
a change in the gene expression profile. In case of an infection with H. pylori an
upregulation of MUC1 was noted in the stomach, yet there was very low expression in
the intestine (Andrianifahanana et al. 2006). Tytgat et al. (1993) suggested that when
mucin expression or composition is altered, it could lead to a change in the protective
function of the mucus layer.
Mucins in Disease
It has been established that many types of cancers and inflammatory diseases
cause deregulation of mucin expression (Devine and McKenzie 1992; Gendler and
Spicer 1995; Hollingsworth and Swanson 2004; Moniaux et al. 2004; An et al. 2007).
Buisine et al. (2001) investigated the mucin profile in Crohn’s disease (CD), which is a
chronic relapsing inflammatory bowel disease. They analyzed the mucin expression in
the ileal mucosa of 11 patients suffering from CD and 8 biopsy samples were added,
this raised the total to 19 positive samples and 14 controls. They conducted a
histological study, in situ hybridization, and immunohistochemistry to analyze the
specimens collected. Their findings indicated that in the intact ileal mucosa the
expression of MUC2 and MUC3 was similar to the control profile and MUC1 and MUC4
had a lower expression while MUC5AC, MUC5B, MUC6, and MUC7 were not
expressed. The affected ileal mucosa showed an expression of MUC5AC and MUC6,
but MUC2 was no longer expressed in those affected portions of the ileum. Normally,
MUC5AC and MUC6 are found in the stomach and MUC6 in the duodenum. This team

26
of researchers suggested that MUC5AC and MUC6 might play a role in both the healing
process and protection of the mucosa in bowel inflammatory diseases.
Henke et al. (2004) monitored MU5AC and MUC5B in Cystic Fibrosis (CF) in
which a progressive airway obstruction is the major sign. Their study had 12 patients
with CF and 11 controls. They found a decrease in MUC5B by 70% and MUC5AC by
93% in CF sputum. They suggested that this apparent decrease could be due to the
presence of other components of the CF sputum such as DNA, inflammatory mediators,
bacteria, and cell debris to name a few and also an altered secretion of mucins in CF.
In a review by Rose and Voynow (2006) it is suggested that on one hand in acute
inflammation some mediators are able to initiate mucin hypersecretion as part of the
innate immune defense to protect the airway. The mechanism by which this takes place
is not yet well understood. Mucin overproduction, goblet cells, and glandular hyperplasia
were initially observed and then reverted within days as homeostasis was restored to
the respiratory tract as reported by Folkerts et al. (1998). On the other hand, in chronic
cases mucin overproduction, goblet cells, and glandular hyperplasia that evolved to
cause obstruction of the airways progressing to Asthma, CF, or Bronchitis. Rose and
Voynow also pointed out that there is a susceptibility to allergens and viruses that was
observed in patients with chronic airway conditions that was probably due to
proliferation of goblet cells and secretory glands. These produced more mucins that
resulted in mucus plug formation and airway obstruction thus increasing the morbidity
rate. In the same review it was noted that MUC5AC and MUC5B were highly expressed
in secretions from asthmatic airways than in normal individuals, while MUC2 was found
in traces in asthmatic secretions (Kirkham et al. 2002). Watson et al. (2003) reported

27
the presence of MUC7 in asthmatic children patients but not in the control group.
MUC6, MUC8, and MUC19 might be expressed in asthmatic secretions but no data
have been published yet to validate their presence (Rose and Voynow 2006).
Voynow and Rubin (2009) noted that the expression of mucins is upregulated by
pathogens, inflammatory mediators, and toxins that aggravate chronic inflammatory
conditions: CF, COPD. Chu et al. (2004) used biopsy tissues from asthmatic patients to
investigate the expression of mucins that was induced by Transforming Growth Factor
β1 (TGF- β1) and TGF β2. They reported in their findings that Transforming Growth
Factor β2 (TGF- β2) was able to upregulate mucin expression in cultured cells in control
as well as in asthmatic patients and that Interleukin 13 (IL-13) could induce the release
of TGF- β2 that will in turn stimulate mucin expression in asthmatic patients.
MUC5AC was investigated in gallstone disease by Finzi et al. (2006). They used
specimens obtained from subjects who underwent cholecystectomy. The control group
consisted of subjects without gallstone and primary cultures of gallbladder epithelial
cells. They noted that the mechanisms that set off mucin overproduction are not
known. However, inflammatory processes might be involved based on their findings that
indicated that mucus overproduction was linked to neutrophil infiltration and
upregulation of tumor necrosis factor-α (TNF-α) and epidermal growth factor-receptor
(EGF-R). TNF-α and/ or EGF-R induce an upregulation of MUC5AC, while the
expression of MUC1, MUC3, and MUC5B remains the same in the gallbladder.
Swartz et al. (2002) investigated the expression of MUC4 in pancreatic
carcinoma. They collected specimens from 40 patients and conducted
immunohistochemical analysis. Their findings established that MUC4 was

28
overexpressed in invasive pancreatic adenocarcinomas. They suggested that MUC4
could be used as a screening tool for invasive pancreatic carcinomas. Along the same
line of thought, Moniaux et al. (2004) emphasized the role of MUC1 and MUC4 in
pancreatic cancer. They indicated that these 2 mucins are upregulated and that they
play a role in tumor progression. Thus these mucins could be used in the diagnosis and
prognosis of the disease. Mall (2008) also indicated that mucins could be used in
diagnosis of cancers and other inflammatory diseases.
Babu et al. (2006) analyzed the expression of MUC2, MUC5AC, and MUC6 in
gastric infected epithelia by H. pylori using biopsy specimens. They used antibodies for
immunohistochemical analysis after confirming H pylori infection. They observed that
MUC5AC is present in foveolar cells of the antrum and MUC6 in the gastric glands,
while MUC2 is absent in the stomach. This team of researchers suggested that H pylori
infection may trigger the carcinogenesis cascade and that MUC2 could be used as a
marker in intestinal metaplasia and early diagnosis because of its stable presence.
Velcich et al. (2002) investigated the importance of Muc2 in colorectal cancer
using Muc2 knockout mice (Muc2-/-) and observed the absence of goblet cells in these
mice. The mice were sacrificed at 6 months and 1 year. They observed that knockout
mice had tumors in the gastrointestinal tract. In the 6-month-olds, tumors were only in
the small intestine while in the 1-year-old mice, tumors were present also in the large
intestine but none were found in the stomach because Muc2 is not detected in the
gastric epithelium. Velcich et al. (2002) demonstrated that goblet cells were important in
mucin secretion; their decrease implied a reduction of the product and also noted that
Muc2 might play a role in inhibiting colorectal cancer.

29
Carraway et al. (1999) studied the implication of 2 membrane-bound mucins
(MUC1 and MUC4) in breast cancer. They pointed out that MUC1 is upregulated in most
breast cancers. Because previous studies had suggested that MUC1 might play a role in
cell signaling and adhesion it has the potential to participate in tumor progression. MUC4
is upregulated in the majority of aggressive breast cancers. MUC4 is also a ligand for
receptor tyrosine kinase (ErbB2) that is actively involved in breast cancer. MUC4 has a
role in ErbB2 regulation (Ramsauer et al. 2006) thus its involvement in breast tumor
progression or metastasis (Carraway et al. 1999; Ramsauer et al. 2006; Workman et al.
2009). Chaturvedi et al. (2008) proposed that MUC4 could be used as diagnostic tool as
well as in the design of novel cancer therapies.
In view of the different roles, functions, and regulatory pathways of mucins, it has
been suggested that they could be used in early detection of cancers and inflammatory
diseases.
Importance of Stress-Related Diseases
Stress-related diseases have a worldwide distribution. According to NIH statistics
60 to 70 million people in 1996 suffered from different digestive conditions, 14.5 million
people suffered from peptic ulcers in 2003; 328,000 people were disabled by the
condition (NIH Sept. 2008). Patmore (2006) noted that in the US stress-management
companies report revenue of approximately $18 billion a year. It is estimated that
approximately 25 million Americans will contract peptic ulcers during their lifetime while
NIH suggests that 1 in 10 Americans will suffer from an ulcer during their lifetimes (NIH
Sept. 2008). The understanding of the changes of gastrointestinal mucins under

30
stressful conditions may be helpful in prevention and possibly treatment of
gastrointestinal conditions associated with stress.
In view of the importance of mucins in protecting the mucosa and the potential
negative effects of stress on the gastrointestinal tract, the study focus is on the following
2 questions:
1. Does chronic stress affect the quality of gastrointestinal mucins?
2. Does chronic stress affect the quantity of gastrointestinal mucin?
Hypothesis
Because ulceration affects the integrity of the mucosal barrier of which the mucus
layer is important, it is hypothesized that stress commonly associated with
gastrointestinal ulceration will alter the overall quantity and quality of mucin production
from the gastrointestinal tract.
Objectives
The objective of the study is 2-fold: first to determine the expression of
membrane-bound mucins (Muc1, Muc3, and Muc4) and secreted mucins (Muc2 and
Muc5AC) in stress and nonstress conditions in mice; second to determine histological
changes in the intestinal mucosa of mice exposed to stress and nonstress conditions.

31
CHAPTER 2
MATERIALS AND METHODS
This study focused on delineating the changes in quantity and quality of
gastrointestinal mucins under stressful and nonstressful conditions in the stomach and
the intestine. A portion of the tissue of interest, approximately 2 cm, was removed and
immersed in Methacarn for fixation then the mucosa was immediately separated from
the remaining tissue and homogenized in Trizol®.
Experimental Materials
Experimental Animals
Sixteen 4-week-old male weanling ICR Swiss strain mice were used. The mice
were housed individually in cages and had a 12-hour light-dark cycle. Water and feed
were available ad libitum except when the mice were being tested. The protocol was
approved by the University Committee on Animal Care (UCAC) at East Tennessee
State University, Johnson City, TN.
Weighing of Animals and Feed
Animal feed given was weighed at the beginning of the experiment. During the 3
weeks that followed, the mice and feed were weighed twice each week. At the end of
the 21-day period, data were available to determine the body weight (BW) change
during the study period and feed consumed (FC). A total of 7 repeated measures were
recorded for body weight and 6 for the feed consumed.

32
Blood Collection
At the end of the 21-day period the mice were euthanized using carbon
monoxide, and blood for the corticosterone assay was collected by retro-orbital
puncture. The abdomen was opened and the stomach and the intestine were harvested,
then the mucosa was collected from each segment of the GIT.
Induction of Stress
Stress was induced using a standardized stressor (restraint) as described by
Bonneau et al. (1993). Stress induction was accomplished by restraining the mice for 6
hours daily for 21 days. This was done to simulate chronic stress that humans go
through (Bonneau et al. 1993).
Primers Used in the Study
Specific primers that had been designed by Dr Onyango’s lab for the five mucin
genes of interest and one housekeeping gene, Gapdh, were used to amplify the cDNA
in the Polymerase Chain Reaction (PCR) endpoint and Real-Time Polymerase Chain
Reaction (qPCR).
Experimental Methods
Stress Hormone Assay or Corticosterone Assay
Blood from the mice at the end of the study was collected by retro-orbital
puncture and assayed for the stress hormone corticosterone using the Corticosterone

33
Enzyme Immunoassay kit (Assay design Inc, Ann Arbor, MI, Cat. No 900-097) following
the manufacturer’s protocol. The blood was collected in 2 ml eppendorf tubes, left at
room temperature for 40 minutes to allow coagulation to take place, then the tube was
centrifuged at 1600 x g. The serum was transferred into a new clean tube and put
immediately on ice then stored at -80°C until needed for the assay.
The kit which had been previously stored at 4°C was removed from storage and
left at room temperature for 30 minutes before use. The tubes for the serial dilution of
the 5 standards and the tubes which were going to contain the samples were labeled.
The assay buffer 15, which is a Tris buffered saline with proteins and sodium azide as
preservative, and the wash buffer were prepared by diluting the concentrates, the assay
buffer 1:10, and the wash buffer 1:20 using double distilled water.
The standards were serial diluted by combining for standard 1, 900 µl assay
buffer 15 and 100 µl stock solution to get 20 000 pg/ml corticosterone; for standard 2,
800 µl assay buffer 15 and 200 µl standard 1 to get 4 000 pg/ml corticosterone;
standard 3, 800 µl assay buffer 15 and 200 µl standard 2 to get 800 pg/ml
corticosterone; standard 4, 800 µl assay buffer 15 and 200 µl standard 3 to get 160
pg/ml corticosterone and for standard 5, 800 µl assay buffer 15 and 200 µl standard 4 to
get 32 pg/ml corticosterone. Using the Assay layout sheet showing how the 96 well-
plate could be setup, the number of wells to be used on the 96 well-plate coated with
donkey anti-sheep IgG was determined and the plate was set up.
Nonspecific Binding (NSB) wells received 100 µl of the Assay buffer 15 and
Maximum Binding, (B0) wells then 50 µl in the NSB wells. The NSB wells received a
total of 150 µl of the Assay buffer 15. The standard wells received 100 µl of the

34
standards in duplicate, while the samples wells received samples in quadruplicate. The
conjugate (alkaline phosphatase conjugated with Corticosterone) 50 µl was added to all
the wells except blank and total activity wells. The substrate (antibody) 50 µl, was added
to all the wells except the blank, total activity, and nonspecific binding wells.
The plate was sealed and incubated at room temperature on a shaker at 300
rpm for 2 hours. After the incubation the content of all the wells was dumped, and the
plate was washed thrice using the wash buffer (Tris buffered saline with detergents),
the remaining buffer was carefully blotted out by tapping on a lint-free absorbent paper
towel, (Kimwipes, Kimberly-Clark, Roswell, GA, Cat. No 34256). The conjugate 5 µl,
was added to the TA wells, then 200 µl of the p-nitrophenyl phosphate (pNpp) substrate
was added to all the wells. The plate was incubated at room temperature for 1 hour
without shaking. At the end of the incubation period 50 µl of the stop solution trisodium
phosphate was added to every well. The absorbance was read immediately using the
Benchmark Microplate Reader (Bio-Rad, Hercules, CA) at a wavelength of 405 nm with
a correction between 570 and 590 nm.

35
Determination of Mucin Expression Using Real-Time Polymerase Chain Reaction qPCR
The different steps leading to the quantification of gene expression are presented
in Figure 2.
Collection GIT mucosa ↓
Isolation total RNA ↓
Check RNA Concentration and Integrity ↓
Reverse transcription RNA into cDNA (Reverse Transcriptase)
↓ Generation of Positive and Negative Controls
↓ Optimization of Standards
↓ Quantitative PCR
↓ Calculation of Relative Expression
Figure 2: Overview of the steps followed to determine the expression of a gene
Collection of the Mucosa
All the mice were euthanized using carbon monoxide, and samples were
collected, the mucosa among them. The abdomen was opened and the GIT was
removed divided into different portions. The mucosa was separated from the rest of the
underlying tissues put in a 2 ml eppendorf tube containing 1ml Trizol (Invitrogen Corp.,
Carlsbad, CA, Cat. No 15596-026) and homogenized immediately using an electric
homogenizer (Omni TIP Homogenizing, Omni International, Marietta, GA). The
homogenate was kept on ice then later stored at -80°C until the RNA isolation.

36
RNA Isolation
All the mucosal samples had already been homogenized in Trizol and kept at
-80°C. Total RNA was extracted from intestinal and stomach mucosae from mice using
the Trizol® kit following the manufacturer’s protocol. The mucosa was allowed to thaw
on ice. The samples were incubated at room temperature for 5 minutes to permit a
thorough dissociation of nucleoprotein, then 200 µl of chloroform per 1 ml of Trizol were
added, capped the tube and mixed by vigorous shaking by hand of the tube for 15
seconds.
The mixture was incubated at room temperature for 3 minutes then centrifuged
the tube at 12,000 x g for 15 minutes at 4°C. The mixture separated into 3 phases, a
lower red, phenol-chloroform, a white interphase, and a colorless upper aqueous phase
containing the RNA which represented approximately 60% of Trizol used to homogenize
the tissue. The aqueous phase was carefully transferred to a fresh tube and the rest
was discarded.
RNA was precipitated from the aqueous phase using 500 µl of isopropyl alcohol
then incubated for 10 minutes at room temperature, followed by centrifugation at 12,000
x g for 10 minutes at 4°C and a gel-like pellet formed on the side and bottom of the
tube. The supernatant was decanted into a beaker and the tube was blotted on lint-free
absorbent paper towels (Kimwipes, Kimberly-Clark, Roswell, GA, Cat. No 34256).
The RNA was washed using 1000 µl of 75 % ethanol and mixed using a pipette
because vortexing did not break the pellet to resuspend it then centrifuged the tube at
7,500 x g for 5 minutes at 4°C. The supernatant was quickly dumped into a beaker and
the inverted tube was blotted on lint-free absorbent paper towels. The tube was air-dried

37
by keeping it upside down for 10 minutes. The RNA isolated was resuspended in
RNase-free water then the RNA was incubated at 55°C for 1 minute. The amount of
nuclease-free water used to resuspend the RNA was proportional to the pellet size.
DNase Treatment. The RNA that had been isolated was subjected to a DNase
treatment using the Turbo DNA-free kit (Ambion Inc, Austin, TX, Cat. No 1907) to
ensure that no genomic DNA was carried over to subsequent manipulations according
to the manufacturer’s protocol. To the duodenal and jejunal RNA samples 5 µl of 10X
Turbo DNase Buffer was added while the rest of the sections received 3 µl, then 1 µl
Turbo DNase was added to all RNA samples and mixed well. The mixture was
incubated at 37°C for 30 minutes in a water bath then either 5 or 3 µl of the
resuspended DNase Inactivation Reagent was added depending on the amount of
water used to resuspend the RNA and mixed thoroughly. The tube was flicked twice
during the 5-minute incubation period at room temperature to redisperse the DNase
inactivation reagent. The mixture was centrifuged at 10,000 x g (AccuSpin Micro 17R,
Fisher Scientific, Germany, Cat. No 75002463) for 1.5 minutes, then the cleaned RNA
was transferred to a fresh tube.
RNA Concentration and Integrity Check
The Agilent® 2100 Bioanalyzer (Agilent Technology Inc, Santa Clara, CA) was
used to determine the RNA concentration and RNA integrity number (RIN) value for the
RNA isolated. The total RNA isolated was resuspended in nuclease-free water, and an
aliquot of 2 µl was sent to the Molecular Biology Core Facility (East Tennessee State

38
University, College of Medicine, Johnson City, TN) for analysis to determine the
concentration and the RIN value of the isolated total RNA. The results were sent back in
form of a gel image of the chip, an electropherogram for each sample analyzed, and
chip summary. The chip could hold a maximum of 12 samples. All the RNA samples
analyzed were diluted in nuclease-free water to contain 0.25 µg/µl based on their
determined specific concentration.
Reverse Transcription of RNA
The isolated total RNA was reverse transcribed using qScript into complementary
DNA using the 2-step protocol. The qScript cDNA Synthesis kit (Quanta Biosciences
Inc, Gaitherburg, MD, Cat. No 95047-100) was used to reverse transcribe the RNA into
cDNA. We mixed 12 µl of total RNA, 33 µl of water, 12 µl of 5X reaction mix, and 3 µl of
the Reverse Transcriptase for a total volume of 60 µl per reaction tube. The reaction
tube was placed in the thermal cycler (Master cycler gradient, Eppendorf, Hamburg,
Germany) programmed to run one cycle at 22°C for 5 minutes, one cycle at 42°C for 30
minutes, and one cycle at 85°C for 5 minutes. Then the tube was held at 10°C, until
removed for storage at -20°C.
Negative Control or Reverse Transcriptase Minus
Two samples from each section of the GIT representing the 2 treatments
(stressed and control) were reverse transcribed with no added enzyme, the reverse
transcriptase. A combination of 24 µl nuclease free water, 8 µl 5x reaction mix, and 8 µl
RNA in a eppendorf tube was placed in the thermal cycler programmed to run one cycle

39
at 22°C for five minutes, one cycle at 42°C for 30 minutes, and one cycle at 85°C for 5
minutes just like in the regular reverse transcription described earlier. The cDNA
generated without the enzyme was stored at -20°C. This step was taken to rule out any
genomic DNA contamination during the actual qPCR run.
Generation of Positive Control
Ligation and Transformation. A fresh 50 µl PCR product was prepared by
combining 21 µl of water, 25 µl of AccuStart PCR Supermix (Quanta Biosciences Inc,
Gaitherburg, MD, Cat. No 95060-50), 2 µl of cDNA, 1 µl of forward primer, and 1 µl of
reverse primer. The eppendorf tube containing the 50 µl reaction mix was placed in the
thermal cycler (Master cycler gradient, Eppendorf, Hamburg, Germany), then the
amplified for 40 cycles following a specific program created for each particular gene of
interest.
The PCR product was run on agarose gel to check whether only a single discrete
band characteristic of the amplicon in question would be present.
Luria-Bertani (LB) plates medium with ampicillin at a concentration of 50 µg/ml of
were prepared in advance. The medium for LB plates was prepared by dissolving 5 g of
Tryptone, 2.5 g of Yeast Extract, 2.5 g of Sodium Chloride, and 7.5 g of Agar in 500 ml
of distilled water in a flask. The flask was autoclaved on liquid cycle for 40 minutes then
allowed to cool in a 50°C water bath. When the content of the flask had reached 50°C,
an antibiotic, ampicillin, was added just before pouring the plates. After solidification the
LB plates were stacked and stored in the refrigerator at 4°C until needed. Four LB
plates were placed in the incubator to warm them until needed.

40
LB broth was prepared using the same recipe as the LB plate without the
addition of the Agar, then 5 ml aliquot in 15 ml tubes were made and autoclaved on
liquid cycle as the medium for LB plates. For the LB broth ampicillin was added just
before use to each tube, taking necessary precautions to avoid its contamination using
aseptic techniques.
The cloning reaction was prepared using 2 dilutions 1:1 and 3:1 by mixing 1 µl of
PCR product, 1 µl of vector, 1 µl of salt, and 3 µl of nuclease-free water for the 1:1
dilution while the 3:1 had 3 µl of PCR product and 1 µl of nuclease free water, salt, and
vector were the same as in previous dilution. The vector used was the pCR®2.1-
TOPO® (Invitrogen, Carlsbad, CA, Cat. No 4500-01). After mixing the tubes containing
the cloning reaction were incubated at room temperature for 10 minutes.
During this incubation period 2 tubes of competent cells were thawed on ice
while 4 LB plates were placed in the incubator at 37°C to warm them. Of the 6 µl of
cloning reaction only 2 µl were added to the tube with competent E. coli cells to induce
their transformation. The tubes with cells were mixed carefully by gently flicking them.
The tubes were incubated on ice for 30 minutes.
The cells were subjected to a heat shock for 30 seconds in a water bath set at
42°C then the tubes were placed quickly on ice. To each tube 250 µl of the S.O.C.
medium was added. The tubes were placed horizontally in a small open box and were
incubated at 37°C for one hour on a C25 incubator shaker (New Brunswick Scientific,
Edison, New Jersey) set at 200 rpm.
During this incubation period 30 µl of X-Gal (5-bromo-4-chloro-3-indolyl-beta-D-
galactopyranoside) at a concentration of 50 mg/ml (Promega, Madison, WI, Cat. No

41
V394A) was added on each warm LB plate. The LB plates were labeled to identify the
dilution (1:1 or 3:1) and dosage (10 or 50 µl). For the 10 µl, 30 µl of S.O.C. medium was
added to facilitate the spreading of 10 µl of cells, the 50 µl were spread directly without
addition of S.O.C. medium. The 4 LB plates were incubated overnight for 16 hours at
37°C. The X-Gal was added to the LB plates to allow a quick screening of white and
blue colonies.
After the incubation period the plates were kept at 4°C for 4 to 5 hours to
reinforce the distinction between white and blue colonies. Seven LB broth tubes and
one LB plate were labeled and the LB plate was placed in the incubator to warm it
before adding X-Gal. To each tube containing 5 ml of LB broth, 2.5 µl of ampicillin at a
concentration of 100 mg/ml was added. Six white colonies were picked to inoculate
each one of the first 6 tubes and did a plate streak to keep track of the colonies used on
the designated plot, the last tube was inoculated with a blue colony to serve as control
to check whether the X-Gal worked well. The inoculated tubes were incubated at 37°C
for 16 hours with shaking at 200 rpm using the C25 Incubator shaker (New Brunswick
Scientific, Edison, New Jersey). The overnight culture was then purified using the
PureLink Quick Plasmid Miniprep kit (Invitrogen, Löhne, Germany, Cat. No K 2100-10).
Purification of Plasmids. After a 16-hour incubation period, 2 aliquots of 2 ml of
the overnight culture were made from each colony; the cells were then centrifuged at
4000 x g for 8 minutes. From the overnight culture, 400 µl of the fresh culture were
mixed to an equal amount of 30% glycerol and stored at -80°C for future propagation of
the plasmid.

42
Purification of the plasmid was accomplished using the PureLink Quick Plasmid
Miniprep kit (Invitrogen, Löhne, Germany, Cat. No K 2100-10) by following the
manufacturer’s procedure as outlined here. The supernatant was carefully and
completely removed by pipetting. To the pellet 250 µl of RNase A buffer (R3) were
added and mixed well, then 250 µl of Lysis buffer (L7) were added to the tube with cells,
the tube was capped and mixed by inverting it 5 times then incubated the mixture at
room temperature for 5 minutes. To the tube 350 µl of Precipitation buffer (N4) were
added and homogenized quickly by inverting the tube then centrifuged at 12,000 x g for
10 minutes at room temperature to pellet the debris.
The supernatant was transferred to a labeled spin column that was placed on a 2
ml wash tube and centrifuged at 12,000 x g for 1 minute. The flow through was
discarded in a beaker and placed the column back onto the wash tube. To the wash
tube with the spin column 500 µl of Wash buffer (W10) were added and incubated for 1
minute at room temperature followed by a centrifugation at 12,000 x g for 1 minute.
Once again the flow was discarded and 700 µl Wash buffer (W9) were added to the
column and centrifuged at 12,000 x g for 1 minute and discarded the flow through. The
wash tube was centrifuged again for 1 minute at 12,000 x g to remove any leftover
Wash buffer (W9) then discarded the wash tube and the flow through.
The plasmid DNA was eluted using 10 mM Tris-HCl buffer to avoid any
enzymatic interference in downstream manipulations of the isolated plasmid DNA
(pDNA). The 10mM Tris buffer was prepared by dissolving 3.02 g of Tris in 400 ml of
distilled water. The buffer was brought to pH 8 using hydrochloric acid (HCl).

43
Seventy-five µl of Tri-HCl buffer were directly deposited at the center of the column that
was placed on a collection tube clearly labeled with the clone (colony) number and gene
identification. The collection tube with column was incubated for 1 minute at room
temperature then centrifuged at 12,000 x g for 2 minutes. After the incubation, the
column was discarded and the isolated plasmid DNA (pDNA) was stored at -20°C.
The concentration of the pDNA was determined using a spectrophotometer, the
Eppendorf BioPhotometer (Eppendorf AG, Hamburg, Germany). An aliquot of the
pDNA, at a concentration of 100 µg/µl was sent to the Molecular Biology core facility
(East Tennessee State University, College of Medicine, Johnson City, TN) for
sequencing, to check whether the plasmid had taken in the intended insert. For
sequencing vector specific primers were used, specifically M13 primers. The vector
used in this study was the pCR® 2.1-TOPO® 3.9 kb.
Optimization of Standards. Labeled RNase-free tubes were placed in the clone
zone box (USA Scientific Inc., Ocala, FL) under Ultra Violet light for 20 minutes. The
12.5 ml vial of 2x qPCR Supermix (Invitrogen, Carlsbad, CA, Cat No11730-025) thawed
on ice then 2.5 µl of 20 nM Fluoroscein, a calibration dye used to spike the qPCR
Supermix was added and aliquots were made to avoid constant freezing and thawing. In
a 1.5 ml eppendorf tube, 100 µl 10x Sybr Green was prepared by diluting the stock
solution that was 100x in nuclease-free water. In another 1.5 ml tube the set of primers
to be used in the amplification process were diluted in nuclease-free water to get the
mixed primer set at a concentration of 3 µM and both tubes (Sybr Green and Primer
mix) were kept on ice.

44
Using the Eppendorf BioPhotometer (Eppendorf AG, Hamburg, Germany), the
plasmid DNA (pDNA) concentration of the specific clone was determined. The pDNA
concentration and the plasmid size with insert size were used to calculate the copy
number, one on the parameters used to set a gradient qPCR. Different parameters, the
pDNA stock copy number, and temperature range (4 different temperatures) to be used
in the gradient amplification were programmed on the computer in order to have the
protocol and plate setup.
In the cloning zone 10-fold serial dilutions of the pDNA were made by mixing 3 µl
stock and 27 µl water for the pDNA of 1010 or 109 depending on the copy number
obtained then 108, 107, down to 102 . Enough mixtures for 54 wells was made;
therefore, in a 1.5 ml tube the reaction mixture was made by combining 118.8 µl of
water, 81 µl of Primer mix, 64.8 µl of 10x of Sybr Green, 32.4 µl of Magnesium chloride,
and 405 µl of 2x qPCR Supermix with Fluoroscein. In 6 tubes that had the standards 18
µl of water was placed in the blank tube also called no template control (NTC), and 18
µl of 102 in the second tube, 103 in the third tube, 104 in the fourth, 105 in the fifth, and
106 in the last tube of the pDNA dilutions then 117 µl of reaction mixture was added to
each of the 6 tubes.
The wells of the 96 well-plate were loaded in duplicate with 15 µl of final reaction
mix. Each one of the 6 reaction mixtures (dilutions) had 8 wells corresponding to the 4
different temperatures chosen for the gradient run. The plate was sealed and
centrifuged at 1600 x g (Eppendorf 5840, Eppendorf, Hamburg, Germany) for 1 minute
as many times as needed to get rid of air bubbles. The sealed plate was then placed in
the thermal cycler (IQ5 Multicolor Real-Time PCR Detection System, Bio-Rad,

45
Hercules, CA) that was linked to a computer and the parameters were once again
checked on the computer and the qPCR was set to run for approximately 2 hours and
15 minutes. This gradient run was executed for all the 6 genes used in the study using 4
different temperatures.
The purpose of running a gradient amplification was to determine the optimum
temperature at which the gene in question was best expressed and construction of a
standard curve by paying attention to the efficiency level, the slope of the curve
generated, and presence of a single peak.
Quantitative PCR Setup and Run
Fragments corresponding to the mucins of interest (Muc1, Muc2, Muc3, Muc4,
and Muc5AC) were amplified and quantified by Real-Time PCR to determine the
expression of the 5 mucins. Gapdh, a reference gene, was also amplified and served as
the internal control. After determining the melting temperature for each gene in this
study, each portion of the gastrointestinal tract was run on a separate 96 well-plate to
facilitate a comparison between the treated and the control groups.
Labeled eppendorf tubes were placed under UV light for 20 minutes. Serial
dilutions of the pDNA were made after checking the concentration to determine the copy
number. In a 1.5 ml eppendorf tube 2.2 µl of nuclease-free water, 1.5 µl primer mix, 1.2
µl of Sybr Green, 0.6 µl of MgCl2, 7.5 µl of 2x qPCR Supermix for each well to be used
plus 12 extra wells were mixed when using the robot epMotion 5070 (Eppendorf,
Hamburg, Germany) to dispense the mixtures. The qPCR reaction mix made was
aliquoted in 8 tubes, the standards and the RT minus were placed in front rack and the

46
actual samples in the rear rack in the robot chamber. The robot had already been
programmed to effectively dispense the reaction mixes into the 96-well plate the only
variation would be the column 10 to 12 on the plate that are adapted to the number of
samples placed beyond the 9th column. The samples were loaded in triplicate on the
96-well plate.
On the computer that is linked to the thermal cycler, the protocol and plate setup
were set then the wells were labeled. After the robot had finished the task, the plate was
taken out, sealed, and mixed by centrifugation at 1600 x g for 1 minute in the 5804
Eppendorf centrifuge (Eppendorf, Hamburg, Germany) to bring everything to the bottom
of the wells and remove any air bubbles. The plate was finally placed in the thermal
cycler after checking once again that the protocol and the plate setup were correct. The
machine was set to run for approximately 2 hours and 15 minutes.
Histology
Collection of Tissue Samples
The harvested samples of gastrointestinal tract (2 cm per section) were fixed in
Methacarn ( 60% methanol, 30% chloroform, 10% acetic acid) as described by Putchtler
et al. (1970) for 24 hours. The fixed tissues were subsequently transferred to 70%
Ethanol for holding until further processing.

47
Preparation of Histological Sections
The embedding process was done manually. A small section of the tissue,
approximately 3 mm, was put into a metallic cassette with a label for identification. The
tissue in the cassette was progressively dehydrated, it was immersed in 70% Ethanol
for 30 minutes, then the tissue was transferred to 80% Ethanol for 30 minutes, then to
90% for 30 minutes, then to 95% for 30 minutes, then transferred to 100% for 30
minutes twice.
At this point the clearing agent (Hemo-De, Fisher Scientific, Fair Lawn, NJ, Cat
No 22-143975) was progressively added to the tissue. The cassette containing the
tissue was transferred to 50:50 100% Ethanol:Hemo-De for 30 minutes, then 100%
Hemo-De for 30 minutes. Finally liquid Paraffin wax (TissuePrep, Fisher Scientific, Fair
Lawn, NJ, Cat NoT565) was progressively added to coat the tissue in the oven at 50°C.
The cassette was immersed in 50:50 Hemo-De:liquid Paraffin for 30 minutes, then
transferred into pure liquid paraffin for 60 minutes, and lastly transferred into another
liquid paraffin for 60 minutes. The tissue was then ready to be embedded in fresh
Paraffin.
A metallic mold that had been coated with mold release solution (1:80
glycerin:ethanol 80%) was placed on a warmer at 55°C. A little bit of liquid paraffin was
poured to cover the base of the metallic mold then was quickly placed on ice to start
solidification of the liquid paraffin that served as glue to hold the tissue then the mold
was filled with paraffin after the plastic mold had been put on top of the metallic mold.
The block was allowed to solidify completely and the metallic mold was finally removed
from the embedded sample.

48
Alcian Blue-Periodic Acid Schiff (AB-PAS) Staining
The embedded samples were sectioned, 5 µm slices mounted on slides that
were AB-PAS stained to study the morphological changes of the tissues collected by
quantifying intestinal mucus-secreting goblet cells and measuring the villi length.
Slides were placed on a metallic holder that was immersed into the staining
container with Hemo-De for 5 minutes, then the slides were transferred into a second
container of Hemo-De for 3 minutes. The slides were submerged in 100% ethanol for 2
minutes twice successively, then in 95, 80, and 70% for 2 minutes in each solution
before being rinsed 3 times in double distilled water for 1 minute each time. This
process was progressively rehydrating the tissue on the slide in preparation for the
staining process.
The slides were then transferred into the Alcian blue solution for 30 minutes
followed by 3 rinses in tap water for 2 minutes each. The slides were placed in Periodic
acid solution for 10 minutes followed by 3 rinses in tap water for 1 minute each. The
slides were transferred into a staining container of Schiff reagent for 10 minutes
followed by 3 rinses in lukewarm water; the first 2 rinses were for 3 minutes and the last
one was for 4 minutes.
The slides were progressively dehydrated for 2 minutes in 70, 80, and 95% then
twice in 100% before going into Hemo-De for 3 minutes and finally in the last staining
container of Hemo-De for 5 minutes. A drop of the Permount® (Fisher Scientific, Fair
Lawn, NJ. Cat. No SP15-100) was added and a cover slip was placed on each slide
immediately. The mounted slides were allowed to air dry before being stored in a slide
box.

49
The slides were examined, goblet cells as shown in Figure 3 were counted and
villus length measured as shown in Figure 4. Using a micrometer ocular the slide was
scanned at low magnification to look at the entire structure. Then the villi were
measured at 10x while the goblet cells were counted at 40x. The measurement
obtained was divided by 10 to convert it into millimeters.
Figure 3: Intestinal epithelium stained with AB-PAS to visualize Goblet cells
Goblet cells

50
Figure 4: Intestinal epithelium stained with AB-PAS, arrow shows a villus length
Statistical Analysis
Corticosterone Levels
The data from the corticosterone assay were analyzed by running a one way
ANOVA using PASW (Predictive Analytics SoftWare 17, SPSS Inc., Chicago, IL) to
assess any differences between the treated and control mice at P<0.05.

51
Body Weight Gain and Feed Consumed
The body weight change and feed consumed data were analyzed as repeated
measures using PASW (Predictive Analytics SoftWare 17, SPSS Inc., Chicago, IL). This
analysis was done to investigate whether there were significant differences within
groups at the different times when the data were collected and also between treated
and control groups at a P-value smaller than 0.05 (P<0.05). The individual mouse was
the experimental unit.
Histological Data
Quantitative histological data of the goblet cell count and villus length were
analyzed by one way ANOVA using PASW (Predictive Analytics SoftWare 17, SPSS
Inc., Chicago, IL) to determine whether there was a significant difference between the
treated and control mice.
qPCR Data
The iQ5 software (Bio-Rad) was used to calculate the expression and relative
quantification of each gene in the present study. Data were subsequently analyzed
using SAS (SAS Institute Inc. 2002, Cary, NC).

52
CHAPTER 3
RESULTS
Corticosterone Levels in the Sera of Stressed and Control Mice
Blood collected by retro-orbital puncture from 16 ICR mice that had been
subjected to restraint-stress for 3 weeks was assayed for corticosterone in the serum.
The results presented in Table1 and Figure 3 indicated high levels of the stress
hormone in the treated group. Two mice from the treated group had extremely high
levels of corticosterone, the rest ranged from 3274 to 7293 pg/ml of serum for the
treated mice, while in the control mice ranged from 44 to 2971 pg/ml. Without the
outliers, the means ± SD were 5082 ± 1975 pg/ml for the stressed and 1565 ± 1236
pg/ml for the control mice (Table 1; Figure 5). There were highly significant differences
between the stressed and control mice at a P-value of 0.001 (Table 1).
Table 1: Corticosterone levels in stressed and control mice after a 6-hour restraint
period daily for 21 days
Variable Treatment Mean SD P-value
Corticosteronea Stress 5282 1975 0.001
Control 1565 1236
a significant difference

53
Figure 5: Corticosterone levels in the sera of stressed and control mice at the
end of the study period
Body Weight (BW) and Feed consumed (FC) of Stressed and Control mice
The weight of the stressed mice at the beginning of the experiment ranged from
31.2 to 34.2 g for the stressed group with an average of 31.8 g, while the control mice
weighed from 28.9 to 36.8 g with an average of 33.7 g (Table 2). After the initial
exposure to stress, the stressed mice weighed on average 30.9 g. After the study period
of 3 weeks, the final average weight for the stressed mice was 32.8 g and 35.7 g for the
control mice. As expected the control mice increased their weight consistently
throughout the 3 weeks. There was an increase in weight in both groups even though
the control group weighed more than the stressed mice (Table 2; Figure 6).

54
The total feed consumed by the stressed mice during 21-day period ranged from
105.1 to 125.9 g with a final average of 115.2 g, while the control mice consumed feed
ranging from 93.1 to 121.2 g showing a final average of 110.2 g ( Table 3). It was noted
that the stressed mice ate slightly more than the control mice even though the latter
gained more weight that the former group. The increase in feed consumption was not
linear. The statistical analysis of the feed consumed indicated no significant difference
was noted between the stressed and control mice at P-value smaller than 0.05, but they
were differences between measurements within treatment (Table 3; Figure 7).
Table 2: Body Weight (g) of Stressed and Control Mice taken twice weekly for 21 days
Day of Study Period Treatment
Stressed Not Stressed
0 32.6 31.8
4 30.9 33.1
7 31.5 33.4
11 31.5 33.6
14 30.6 34.4
17 32.8 35.2
21 32.8 35.7

55
Figure 6: Body Weight (g) change of stressed and control mice during the
21-day study period. P-value: within treatment: 0.000
between treatments: 0.053
Table 3: Cumulative Feed Consumed by stressed and control mice for the 3-week study
period
Day of Study Period Treatment
Stressed Not Stressed
D4 20.1 23.1
D7 38.2 40.1
D11 62.0 60.3
D14 78.3 75.2
D17 100.0 96.6
D21 115.2 110.2

56
Figure 7: Cumulative Feed Consumption by stressed and control mice observed for the
study period of 3 weeks
Goblet Cells Count in the Duodenum, Jejunum, and Ileum of Stressed and Control Mice
The Goblet cells count in the control group was higher than in the stressed
group. They ranged from 5 to 16 cells in the duodenum with an average of 8 for the
stressed and 14 for the control mice and a standard deviation of 2. In the jejunum the
mean was 7 for the stressed and 14 for the control with a standard deviation of 1 in both
groups, while in the ileum they ranged from 7 to 14 goblet cells with an average of 9 for
the stressed mice and 11 for the control (Table 4; Figure 8). The goblet cells counts
were highly significant different between the stressed and control mice for all the 3
sections that were examined at P < 0.001 (Table 4).
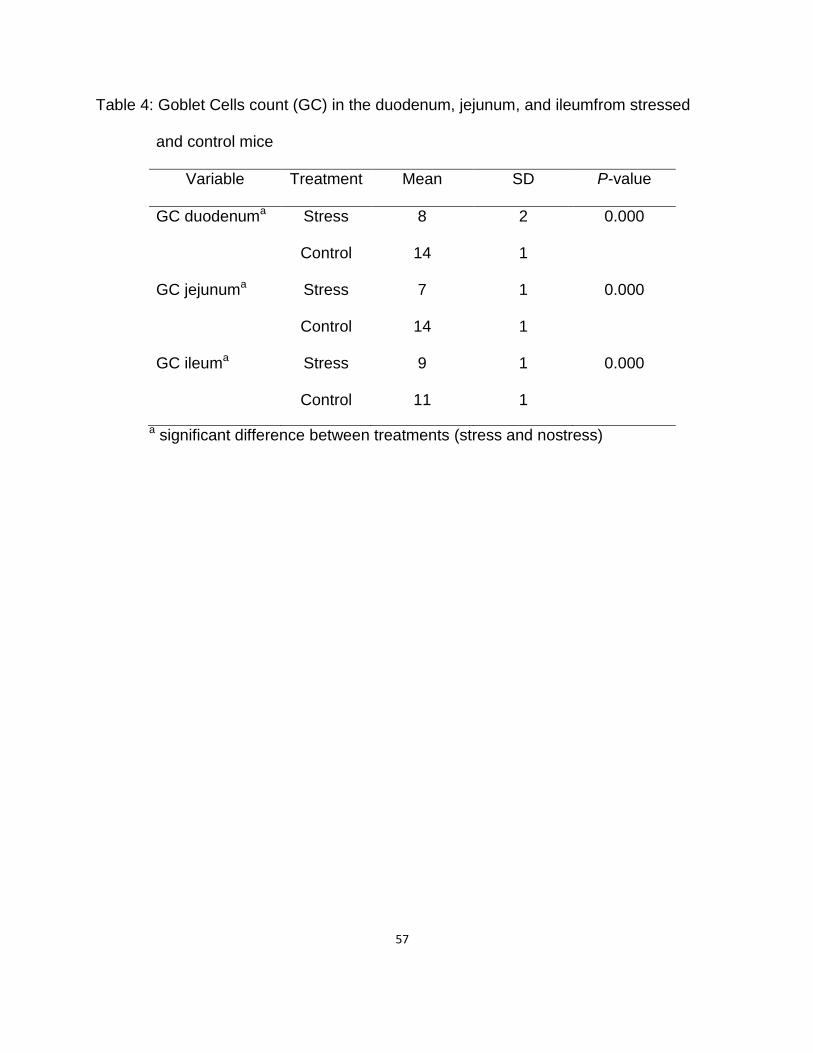
57
Table 4: Goblet Cells count (GC) in the duodenum, jejunum, and ileumfrom stressed
and control mice
Variable Treatment Mean SD P-value
GC duodenuma Stress 8 2 0.000
Control 14 1
GC jejunuma Stress 7 1 0.000
Control 14 1
GC ileuma Stress 9 1 0.000
Control 11 1
a significant difference between treatments (stress and nostress)

58
Figure 8: Goblet cells average count in the duodenum, jejunum, and ileum of
stressed and control mice
Villus Length in the Duodenum, Jejunum, and Ileum of Stressed and Control Mice
The villus length average measurements ranged from 0.320 mm for the stressed
mice to 0.430 mm for the control group with a standard deviation of 0.082 and 0.073
respectively in the duodenum; in the jejunum, they ranged from 0.260 mm for the
stressed mice to 0.360 mm for the control group with a standard deviation of 0.073 and
0.035 respectively, while in the ileum they ranged from 230 mm for the stressed group
to 250 mm for the control mice with a standard deviation of 0.047 and 0.035 (Table 5;
Figure 9). Statistically, there were significant differences in villus length between the 2

59
groups only in the duodenum and jejunum. The ileum did not show significant
differences between the stressed and control mice (Table 5).
Table 5: Villus Length (VL) in the duodenum, jejunum, and ileum from stressed and
control mice
Variables Treatment Mean SD P-value
VL duodenuma Stress 0.32 0.08 0.012
Control 0.43 0.07
VL jejunuma Stress 0.26 0.07 0.003
Control 0.58 0.04
VL ileum Stress 0.23 0.02 0.446
Control 0.25 0.01
a significant difference between treatments (stress and nostress)

60
Figure 9: Villus length (mm) measured in the duodenum, jejunum, and ileum of
stressed and control mice
RNA Concentration and Integrity Check using the Agilent
The RNA isolated had good yield and was of good quality. The concentration that
ranged from 58.7 to 1119.2 ng/µl for the stressed mice while the control mice had 19.8
to 2874 ng/µl as their RNA concentration. From a total of 80 samples, 10 showed some
degree of degradation. The RIN values ranged from 9.6 to 3 for the stressed mice while
the control mice ranged from 3.2 to 9.8. Three samples had no RIN value determined by
the software used (Table 6).
The gel image showed some degradation of the duodenum treated 7 (DT7) RNA
with a RIN value of 5.1 while the rest of the sample had higher RIN value.

61
The 28S/18S ratio was more or less 2:1 in most RNA samples loaded on this
chip except Duodenum Treated 7 (7 DT) sample (Figure 10).
Table 6: Determination of RNA Integrity Number (RIN) using the Agilent
Section Treatment RNA Integrity Number (RIN) using the Agilent Animal Number
1 2 3 4 5 6 7 8
Stomach treated 8.4 8.6 8.2 9 8.4 9.2 8.9 9.6
control 8.4 8.2 8.3 8.4 8.5 8.9 8.1 7.5
Duodenum Treated 8.0 6.7 7.3 - 5.7 4.9 5.1 4.4
control 7.1 5.6 6.1 - 5.6 9.4 7.0 8.5
Jejunum treated 8.6 9.3 9.2 7.6 9.6 9.4 7.4 9.6
control 9.3 7.2 5.4 7.6 8.2 7.5 8.4 8.7
Ileum treated 9.6 - 9.5 8.5 9.1 9.3 9.7 9.2
control 9.8 9.1 8.9 9.3 9.2 9.5 8.7 8.7
colon treated 9.5 3.0 7.4 9.3 9.4 9.3 9.0 8.8
control 9.6 3.2 8.7 9.2 8.3 8.9 7.7 3.7

62
Figure 10: Gel showing the RNA integrity captured using the Agilent. The 28S and 18S
bands are within the ratio of 2:1
Expression Sites of Muc1, Muc2, Muc3, Muc4, and Muc5ac in the GIT
Before qPCR the primers that had been designed were tested to verify whether a
single product would be amplified. The results of the endpoint PCR showed a single
amplicon specific to each one of the target genes. Next, a mucin distribution in the GIT
was assessed using endpoint PCR in order to have a general idea of the expression
sites of the different mucins used in the present study as presented in the following gel
images. Because the target mucins have small amplicons (below 100 bp) except Muc3

63
that has 125 bp, 2 different ladders were used. The first ladder on the left of the gel
image started at 25 bp, while the second ladder on the right of the gel started at 100 bp.
Muc1 was expressed predominantly in the stomach of both stressed and control
mice and in the colon of stressed and a little less in the control mice. Muc2 and Muc3
were found in the intestinal tract, but Muc2 was not expressed in the stomach of both
groups of animals. Muc4 was predominantly expressed in the colon but found in all the
intestinal tract. Muc5ac was expressed only in the stomach of stressed and control
mice.
Figure 11: Expression sites of Muc1 in Figure 12: Expression sites of Muc2 in
the GIT of mice. The arrow shows the the GIT of mice. The arrow shows
Muc1 amplicon of 93 bp. the Muc2 amplicon of 62 bp.

64
Lane 1: ladder 1 Lane 2: Stomach stressed Lane 3: Stomach control Lane 4: Duodenum stressed Lane 5: Duodenum control Lane 6: Jejunum stressed Lane 7: Jejunum control Lane 8: Ileum stressed Lane 9: Ileum control Lane 10: Colon stressed Lane 11: Colon control Lane 12: ladder 2
Figure 13: Expression sites of Muc3 in the Figure 14: Expression sites of Muc4 in
GIT of mice. The arrow shows the Muc3 the GIT of mice. The arrow shows the
amplicon of 125 bp. Muc4 amplicon of 71 bp.
Figure 15: Expression sites of Muc5ac in the gastrointestinal tract of mice. The arrow
shows the Muc5ac amplicon of 68 bp.

65
Assay Optimization and Validation
The annealing temperatures were optimized for every target gene and reference
gene in the study. The temperatures ranged from 58.5 to 61.5°C. A serial dilution of the
specific plasmid for each gene was run to determine the optimal temperature that gave
the highest efficiency and the best slope as summarized in Table 7.
Table 7: Optimization of annealing temperatures of all the genes investigated in the
study
Gene ID Annealing Temperature (°C)
Muc1 60.5
Muc2 60.5
Muc3 61.2
Muc4 59.0
Muc5ac 59.2
Gapdh 61.5
66
Mucin Expression in the GIT of Stressed and Control Mice
Muc1 Expression
Muc1 in the stomach had an expression (mean ± SD) of 0.3949 ± 0.2323 for the
stressed mice and 0.2517 ± 0.2323 for the control mice(Table 8). In the duodenum
Muc1 had an expression of 0.0018 ± 0.0049 for the stressed mice and 0.0026 ± 0.0049
for the control mice. In the jejunum Muc1 had an expression of almost 0.0010 ± 0.0001
for both groups of mice. In the ileum Muc1 had an expression of 0.1370 ± 0.2641 for the
stressed mice and 0.1453 ± 0.2641 for the control mice. In the colon Muc1 had an
expression of 0.0465 ± 0.0151 for the stressed mice and 0.0302 ± 0.0151 for the control
mice. Muc1 expression was the lowest in the jejunum while it was the highest in the
stomach as expected. The expression of Muc1 was significantly different between the 2
groups in the colon at P<0.05 (Table 8). The other intestinal sections did not exhibit any
significant differences between the treatments (Figure 16). There was an increase in
expression of Muc1 in the colon of stressed than in control animals.

67
Table 8: Muc1 expression in the GIT of stressed and control mice
GIT Section Variable Nostress Stress Pooled SD P-value
Stomach Expression 0.2517 0.3949 0.2323 0.2379
Duodenum Expression 0.0026 0.0018 0.0049 0.7393
Jejunum Expression 0.0009 0.0010 0.0001 0.6667
Ileum Expression 0.1453 0.1370 0.2641 0.9506
Colon Expressiona 0.0302 0.0465 0.0151 0.0484
a significant difference
Figure 16: Overexpression of Muc1 in the colon of stressed mice
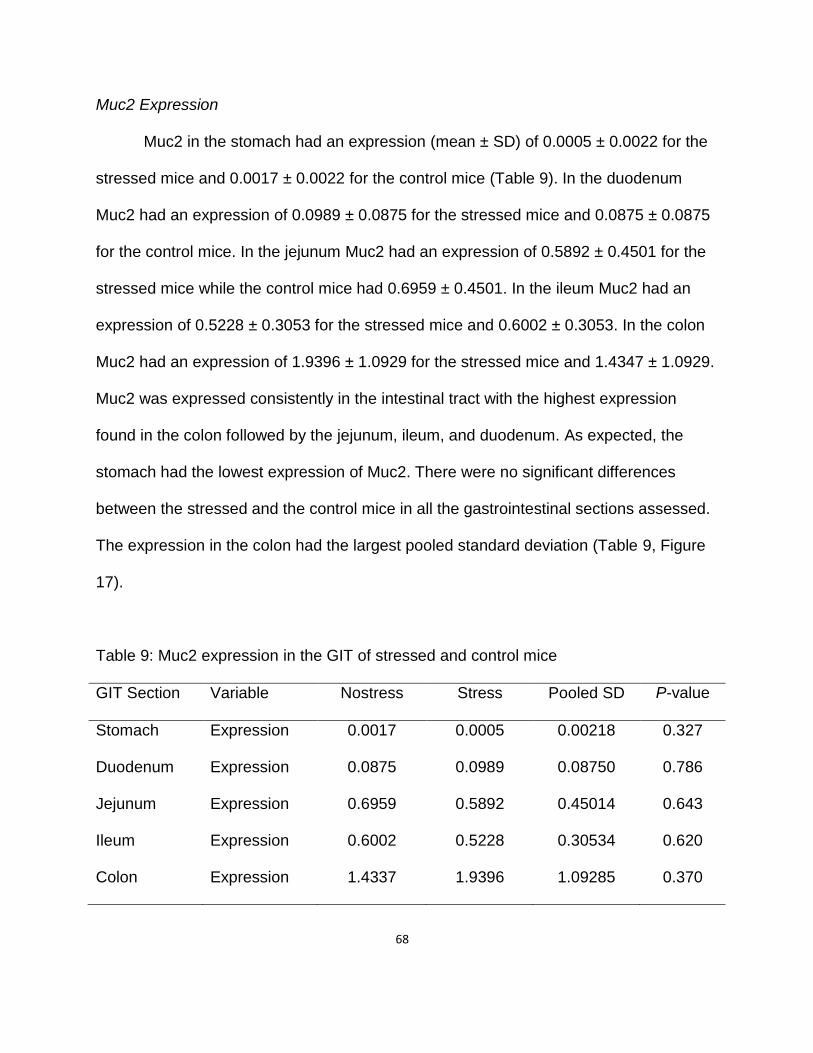
68
Muc2 Expression
Muc2 in the stomach had an expression (mean ± SD) of 0.0005 ± 0.0022 for the
stressed mice and 0.0017 ± 0.0022 for the control mice (Table 9). In the duodenum
Muc2 had an expression of 0.0989 ± 0.0875 for the stressed mice and 0.0875 ± 0.0875
for the control mice. In the jejunum Muc2 had an expression of 0.5892 ± 0.4501 for the
stressed mice while the control mice had 0.6959 ± 0.4501. In the ileum Muc2 had an
expression of 0.5228 ± 0.3053 for the stressed mice and 0.6002 ± 0.3053. In the colon
Muc2 had an expression of 1.9396 ± 1.0929 for the stressed mice and 1.4347 ± 1.0929.
Muc2 was expressed consistently in the intestinal tract with the highest expression
found in the colon followed by the jejunum, ileum, and duodenum. As expected, the
stomach had the lowest expression of Muc2. There were no significant differences
between the stressed and the control mice in all the gastrointestinal sections assessed.
The expression in the colon had the largest pooled standard deviation (Table 9, Figure
17).
Table 9: Muc2 expression in the GIT of stressed and control mice
GIT Section Variable Nostress Stress Pooled SD P-value
Stomach Expression 0.0017 0.0005 0.00218 0.327
Duodenum Expression 0.0875 0.0989 0.08750 0.786
Jejunum Expression 0.6959 0.5892 0.45014 0.643
Ileum Expression 0.6002 0.5228 0.30534 0.620
Colon Expression 1.4337 1.9396 1.09285 0.370

69
Figure 17: Muc2 expression showing no difference between the stressed and
control mice
Muc3 Expression
Muc3 in the stomach had an expression (mean ± SD) of 1.2239 ± 0.6488 for the
stressed mice and 1.5649 ± 0.6488 for the control mice (Table 10). In the duodenum
Muc3 had an expression of 0.5469 ± 0.2491 for the stressed mice and 0.2198 ± 0.2491
for the control mice. In the jejunum Muc3 had an expression of 3.5001 ± 2.2744 for the
stressed mice while the control mice had 3.0356 ± 2.2744. In the ileum Muc3 had an
expression of 1.1081 ± 1.0781 for the stressed mice and 1.0769 ± 1.1081 for the control
mice. In the colon Muc3 had an expression of 1.2239 ± 0.6488 for the stressed mice
and 1.5649 ± 0.6488 for the control mice. Muc3 was expressed in the whole
gastrointestinal tract. The jejunum had the highest expression with a quite elevated

70
pooled standard deviation. The duodenum exhibited significant differences in Muc3
expression between the 2 treatments at P=0.03. The stressed mice showed a 2-fold
expression increase in comparison to the control mice (Table 10, Figure 18).
Table 10: Muc3 expression in the GIT of stressed and control mice
GIT Section Variable Nostress Stress Pooled SD P-value
Stomach Expression 1.5649 1.2239 0.6488 0.328
Duodenum Expressiona 0.2198 0.5469 0.2491 0.032
Jejunum Expression 3.0356 3.5001 2.2744 0.700
Ileum Expression 1.0767 1.1081 1.0781 0.954
Colon Expression 1.5649 1.2239 0.6488 0.328
a significant difference
Figure 18: Overexpression of Muc3 in the duodenum of stressed mice

71
Muc4 Expression
Muc4 in the stomach had an expression (mean ± SD) of 0.0245 ± 0.0132 for the
stressed mice and 0.0325 ± 0.0132 for the control mice. In the duodenum Muc4 had an
expression of 0.0072 ± 0.0079 for the stressed mice and 0.0090 ± 0.0079 for the control
mice. In the jejunum Muc4 had an expression of 0.1460 ± 0.1478 for the stressed mice
while the control mice had 0.1854 ± 0.1478. In the ileum Muc4 had an expression of
0.0544 ± 0.0316 for the stressed mice and 0.0421 ± 0.0316 for the control mice. In the
colon Muc4 had an expression of 1.0570 ± 0.4020 for the stressed mice and 0.4837 ±
0.4020 for the control mice. Muc4 expression in the colon showed highly significant
differences between the 2 groups at P=0.013 (Table 11). Muc4 showed a more than 2-
fold expression increase in the stressed mice than the control group (Figure 19).
Table 11: Muc4 expression in the GIT of stressed and control mice
GIT Section Variable Nostress Stress Pooled SD P-value
Stomach Expression 0.0325 0.0245 0.0132 0.245
Duodenum Expression 0.0090 0.0072 0.0079 0.650
Jejunum Expression 0.1854 0.1460 0.1478 0.603
Ileum Expression 0.0421 0.0544 0.0316 0.450
Colon Expressiona 0.4837 1.0570 0.4020 0.013
a significant difference

72
Figure 19: Overexpression of Muc4 in the colon of stressed mice
Muc5ac Expression
Muc5ac in the stomach had an expression of 0.0107 ± 0.0065 for the stressed
mice and 0.0106 ± 0.0065 for the control mice. In the duodenum Muc5ac had an
expression of 3E-5 ± 4E-5 for the stressed mice and 1E ± 4E-5 for the control mice. In
the jejunum Muc5ac had an expression of 2E-5 for the stressed mice while the control
mice had 1E-5. In the ileum Muc5ac had an expression of 0.0012 ± 0.0037 for the
stressed mice and 0.0020 ± 0.0037 for the control mice. In the colon Muc5ac had an
expression of 0.0001 ± 0.0001 for the stressed mice and 3E-5 ± 0.0001 for the control
mice. Muc5ac had very low expression in the colon, duodenum and jejunum. The
stomach had the highest expression of Muc5ac followed by the ileum (Table 12) without
showing any significant difference between the 2 treatments (Figure 20).
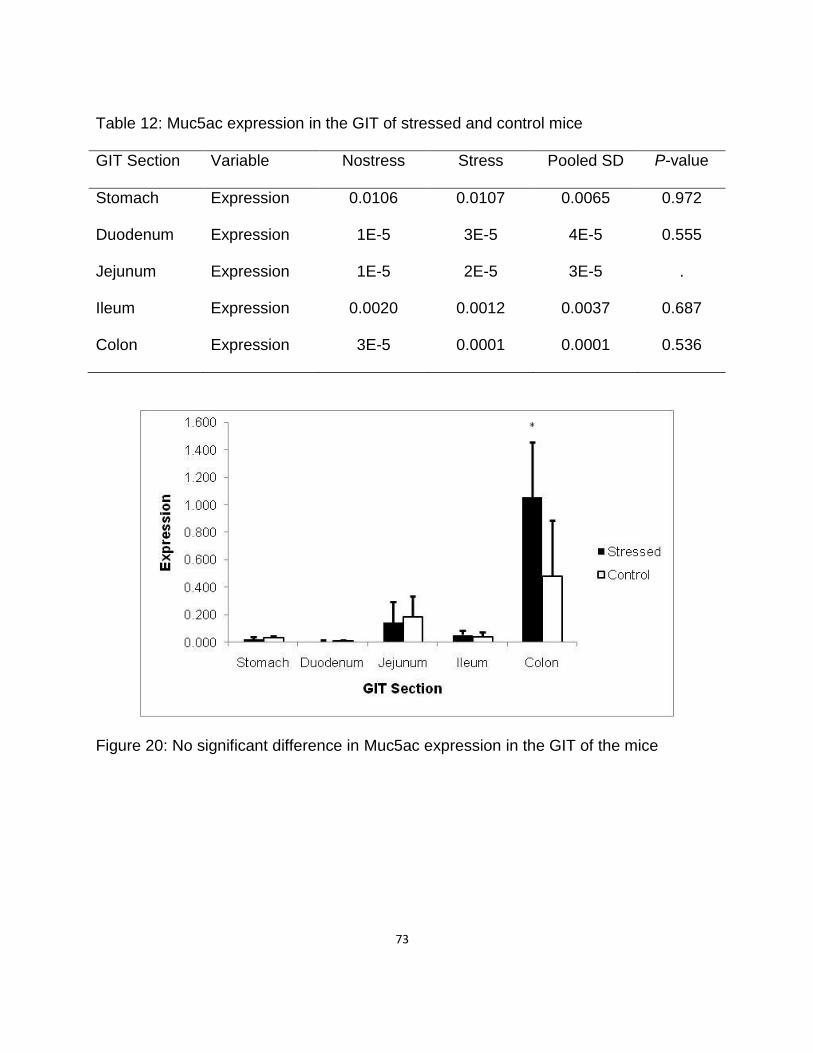
73
Table 12: Muc5ac expression in the GIT of stressed and control mice
GIT Section Variable Nostress Stress Pooled SD P-value
Stomach Expression 0.0106 0.0107 0.0065 0.972
Duodenum Expression 1E-5 3E-5 4E-5 0.555
Jejunum Expression 1E-5 2E-5 3E-5 .
Ileum Expression 0.0020 0.0012 0.0037 0.687
Colon Expression 3E-5 0.0001 0.0001 0.536
Figure 20: No significant difference in Muc5ac expression in the GIT of the mice

74
CHAPTER 4
DISCUSSION AND CONCLUSION
Discussion
Restraint as noted by Kvetnansky and Mikulaj (1970) is a stressful process for
animals. Restraint-stress, to which the experimental mice were subjected for 6 hours
daily for 3 weeks, was used to mimic chronic life stress that humans go through. To
assess the effect of this stressor on the experimental mice required to determine first
and foremost the corticosterone level in the serum of the mice.
The restraint-stress applied on the tested mice induced high corticosterone levels
in the serum. Two mice T1 and T2 were more agitated and always resisted being
restrained more than the other mice. Consistent with the observed behavior, the
corticosterone assay results indicated that their stress hormone levels were very high
and were considered outliers. The control mice had elevated levels of corticosterone
probably due to the method used to euthanize the animals at the end of the study. A
quick decapitation might have had less stressful impact than the use of carbon dioxide.
Because all the mice were sacrificed the same way, the method used would not make
any notable difference, it just caused a shift of the baseline.
The detection of high corticosterone levels in the serum or plasma could be an
indication of stress. Findings in this study were consistent with Gu et al. (2009) when
they analyzed the serum corticosterone levels of their stressed and control mice. A
study that was conducted by Rich and Romero (2005) noted that in chronic stress the
level of corticosterone was less than in acute stress. This could be attributed to some

75
degree of adaptation as suggested by Kvetnansky and Mikulaj (1970). The goal of the
corticosterone assay was to validate that the protocol used was effective in inducing
stress in the mice as demonstrated by the levels of corticosterone in the serum.
Mice were weighed regularly to assess whether stress would impact their body
weight during the study period depending on the treatment they were subjected to. It
was noted that from measurement to measurement there was a difference in body
weight. The control mice as expected gained weight consistently throughout the
experimental period. In the beginning the stressed mice lost weight, then they started to
regain some weight and stayed somewhat on that trend. This could be due to some
adaptation mechanism to cope with the stressor. There were significant differences in
body weight between the 2 groups of mice. The findings in this study are consistent with
Gu et al. (2009) who conducted a study in which they compared the body weight of
control and stressed mice. The protocol used to induce chronic mild stress combined
period of continuous illumination, mice in cage with 45° tilt, and mice in dirty cages.
They noted that the body weight increased in both groups even though the stressed
mice weighed less than the control mice over time. Stress had an effect on body weight.
It has been postulated that stress triggered the hunger hormone, called ghrelin.
Zigman and Lutter (https://www.sciencedaily.com/release/2008/06/080615142252.htm)
suggested that mice that are subjected to chronic stress have high levels of ghrelin that
induces among other things an increase in feed consumed and body weight. The
protocol followed in the present study mice had free access to feed except during the 6-
hour restraint period and it was noted that there was no difference between the stressed

76
and control mice in terms of the amount of feed they ate. As expected, mice consumed
more feed as they grew.
Mucin-producing cells play a very crucial role in maintaining the mucus protective
layer that covers the epithelium of lumen and ducts. There was need to assess whether
chronic stress had any bearing on the mucin-producing cells (goblet cells). When
comparing the goblet cells in the duodenal, jejunal, and ileal sections of the
gastrointestinal tract of stressed and control mice, it was noted that there were
significant differences in the GC count of the 3 sections that were investigated. There
was a decrease in GC counts in the stressed animals. These findings were consistent
with Castagliuolo and his colleagues (1996; 1998) whose findings also support the
findings of the present study. They found that rats that were subjected to immobilization-
stress had an increased mucin secretion in the colon while the goblet cells were
decreased in number. Pfeiffer et al. (2001) also noted that repeated exposure to
restraint-stress induced reduction of mucin secretion as well as the number of goblet
cells in the colon. Rubio et al. (1991) investigated the effect of stress on the mucus of
the colon in rats. They observed an initial drop in goblet cells followed by a
hyperproduction of mucin-producing cells.
Duodenal, jejunal, and ileal sections stained with AB-PAS were also examined to
assess any difference in the morphology of the epithelium of stressed and control mice.
The results revealed that there were significant differences in the heights of villi in the
duodenum and jejunum of stressed and control mice. There was a decrease in height of
villi of stressed mice. Nevertheless, in the ileum no significant difference was noted

77
between the 2 groups. This is consistent with the findings of Burkholder et al. (2008)
who noted that stress did not affect significantly the villus length of tissues from birds.
After showing that the protocol used was effective in inducing stress and
assessing the effect of stress on body weight, feed consumed, and histology of
intestinal tissues, the next step was to investigate whether stress had effect on gene
expression of mucins in the GIT.
The quality of the RNA extracted was in general good as indicated by the ratio
between the 28S and 18S bands of 2:1.
In the present study Muc1 was one of the predominant mucins expressed in the
stomach and colon under normal physiological conditions. The findings in the present
study were consistent with those of Audie et al. (1993), Cao et al. (1997), Corfield et al.
(2000), and Wang and Fang (2003). These researchers found the same expression
sites in normal conditions. Muc1 had also a moderate expression in the ileum of
stressed and control mice in the present study with no significant differences between
the 2 groups. Muc1 was highly expressed in the stomach with no significant differences
noted between the stressed and control mice. The colon showed significant differences
between the 2 groups in the present study. Corfield et al. (2000) found that mucins such
as MUC1, MUC2, MUC3, and MUC4 were expressed in the colon under physiological
conditions. Hoebler et al. (2006) noted an upregulation of Muc1 and Muc4 in the colon
during acute colitis then diminished in chronic colitis in mice. The findings of the present
study may suggest that some inflammation or pathology was going on in the colon
where the 2 mucins were overexpressed in the chronically stressed mice. Wang and

78
Fang (2003) in their study of MUC1 and MUC3 expression in gastric carcinoma
observed that MUC1 expression was associated with smaller tumor while the
expression of MUC3 was linked to larger tumor and metastasis.
Muc2 was expressed in the entire intestinal tract of stressed and control mice. No
significant differences were noted between the 2 groups of mice. Ho et al. (1995)
indicated in their study that MUC2 was not expressed in the normal gastric tissue, but
the present study noted a low expression of this mucin in stomach of the control mice.
Ho et al. (1995) noted that MUC2 was expressed in the stomach of patients with
intestinal tumors. The lowest expression was in the stomach, while the highest
expression site was the colon. These findings confirmed what was observed earlier
when the expression sites of each mucin in the study were determined. Similar
distribution was noted by Audie et al. (1993) and Corfield et al. (2000). Muc2 was mainly
secreted by goblet cells and was one of the major proteins that secreted the mucus
layer that protected and lubricated the epithelia of ducts and lumens (Rhaka et al.
2005). Because Muc2 was the major intestinal mucin, it was surprising to note that there
were no significant differences in its expression between the control and stressed mice.
Restraint-stress in the present study did not significantly alter the expression of Muc2 in
the GIT probably because it was not able to trigger the specific signaling pathway
through which Muc2 was controlled in this body system.
Muc3 was expressed throughout the gastrointestinal tract with the highest
expression in the jejunum (Audie et al. 1993; Corfield et al. 2000). In the present study
significant differences were noted in Muc3 expression in the duodenum between the 2

79
treatments. There was an upregulation in the stressed mice of more than 2-fold in the
present study.
Leroy et al. (2003) conducted a study on MUC3 and VEGF in renal carcinoma.
Their findings were comparable to Wang and Fang (2003) in regard to MUC3
implication in carcinogenesis. Shekels and Ho (2003) have pointed out that growth
factors and cytokines had the ability to control the secretion of Muc3 in the GIT.
Therefore an overexpression of Muc3 should be monitored closely whether in the GIT or
the kidneys.
Muc4 was expressed to some extent in all the gastrointestinal tract of both
groups of mice. Under physiological conditions Andrianifahanana et al. (2006) and
Corfield et al. (2000) suggested similar expression sites. In the colon Muc4 expression
showed highly significant differences between the stressed and control mice. Muc4
expression was upregulated in the stressed group compared to the control group.
Moniaux et al. (2007) suggested that MUC4 facilitated tumor formation by allowing
cancer cells to proliferate. MUC4 upregulation has been observed in many cancers
(Moniaux et al. 2007; Senapati et al. 2008).
Muc5ac was expressed in the stomach of stressed and control mice with no
significant differences. Song et al. (2003) suggested that MUC5AC was overexpressed
in the airway epithelium under cytokines regulation but the mechanisms were not fully
understood.

80
The data obtained in the present study suggest that the profile that emerged after
chronic stress in mice was the initial stage of uncontrolled expression of mucins (Muc1,
Muc3, and Muc4) that would lead to carcinogenesis in the intestinal tract. Mucins play
an important role in wound healing (Buisine et al. 2001) and if no wound is present that
requires repair, intact cells might proliferate uncontrolled and probably lead to
carcinogenesis. The colon seems to be the most susceptible site in this study.
Conclusions
From the results of the present study, the following conclusions may be drawn:
Chronic restraint-stress induces increased serum corticosterone level in mice.
Stress significantly influences the body weight of mice.
Chronic stress has an effect on the goblet cells by decreasing their count in the
intestinal tract of mice.
Chronic stress causes an increase in expression of Muc1 and Muc4 in the colon
and Muc3 in the duodenum of mice.
Future Research
Determine the function of the mucins of interest by using knockout mice.
Elucidate the signaling pathways that stress triggers in the gastrointestinal tract
so that mucins could be used effectively as targets in designing therapies or as
screening tools.

81
REFERENCES
An G, Wei B, Xia B, McDaniel JM, Ju T, Cummings RD, Braun J, Xia L. 2007. Increased
susceptibility to colitis and colorectal tumors in mice lacking core 3-derived O-
glycans. JEM. 204 (6): 1417-1429.
Andrianifahanana M, Moniaux N, Batra SK. 2006. Regulation of mucin expression:
Mechanistic aspects and implications for cancer and inflammatory diseases.
BBA. 1765(2):189-222.
Atuma C, Strugala V, Allen A, Holm L. 2001. The adherent gastrointestinal tract mucus
gel layer: thickness and physical state in vivo. Am J Physiol Gastrointest Liver
Physiol 280: G922-G929.
Audie JP, Janin A, Porchet N, Copin MC, Gosselin B, Aubert JP. 1993. Expression of
Human mucingenes in respiratory, digestive tracts ascertained by in situ
hybridization. J Histochem Cytochem. 41 (10): 1479-1485.
Babu SD, Jayanthi V, Devaraj N, Reis CA, Devaraj H. 2006. Expression profile of
mucins (MUC2, MUC5AC, and MUC6) in Helicobacter pylori infected pre-
neoplastic human gastric epithelium. Mol Cancer 5: 10 doi: 10.1186/1476-4598-
5-10
Bhatia V, Tandon RK. 2005. Stress and the gastrointestinal tract. J Gastroenterol Hep
20: 332-39.

82
Bonneau RH, Sheridan JF, Feng N, Glaser R. 1993. Stress-induced modulation of the
primary cellular immune response to herpes simplex virus infection is mediated
by both adrenal-dependent and independent mechanisms. J Neuroimmunol.
42(2): 167-176.
Botchkarev VA. 2003. Stress and hair follicle: exploring the connections. Am. J. Pathol.
162 (3): 709-712.
Buisine M-P, Desreumaux P, Leteurtre E, Copin M-C, Colombel J-F, Porchet N, Aubert
J-P. 2001. Mucin gene expression in intestinal epithelial cells in Crohn’s disease.
Gut 49: 544-551.
Burkholder KM, Thompson KL, Applegate TJ, Patterson JA. 2008. Influence of stressors
on normal intestinal microbiota, intestinal morphology, and susceptibility to
Salmonella enteritidis colonization in broilers. Poultry Scien 87:1734-1741. doi:
10.3382/ps.2008-00107.
Cao Y, Blohm D, Ghadimi BM, Stosiek P, Xing P-X, Karsten U. 1997. Mucins (MUC1
and MUC3) of the gastrointestinal and breast epithelia reveal different and
heterogeneous Tumor-associated aberrations in glycosylation. J Histochem
Cytochem 45 (11): 1547-1557.
Camilleri M. 2008. Probiotics and Irritable Bowel Syndrome: Rationale, Mechanisms,
and Efficacy. J Clin Gastroenterol 42: S123-S125.

83
Carraway KL, Price-Schiavi SA, Zhu X, Komatsu M. 1999. Membrane mucins and
Breast Cancer. Cancer Control 6(6): 613-614.
Caso JR, Leza JC, Menchén L. 2008. The Effects of Physical and Psychological Stress
on the Gastrointestinal Tract: Lessons from Animal Models. Curr Mol Med 8:299-
312.
Castagliuolo I, Wershil BK, Karalis K, Pasha A, Nikulasson ST, Pothoulakis C. 1998.
Colonic mucin release in response to immobilization stress in mast cell
dependent. Am J Physiol Gastrointest Liver Physiol 274:1094-1100.
Castagliuolo I, Leeman SE, Bartolak-Suki E, Nikulasson S, Qiu B, Carraway RE
Pothoulakis C. 1996. A neurotensin antagonist, SR 48692, inhibits colonic
responses to immobilization stress in rats. Proc Natl Acad Sci 93:12611-12615.
Chang JF, Zhao HL, Phillips J, Greenburg G. 2000. The epithelial mucin, MUC1, is
expressed on resting T lymphocytes and can function as a negative regulator of
T cell activation. Cell Immunol 20: 83-88.
Chaturvedi P, Singh AJ, Batra SK. 2008. Structure, evolution, and biology of the MUC4
mucin. FASEB J. 22:966-981.
Chu HW, Balzar S, Seedorf GJ, Westcott JY, Trudeau J B, Silkoff P, Wenzel SE. 2004.
Transforming growth factor β2 induces bronchial epithelial mucin expression in
asthma. Am J. Pathol 165: 1097-1106.

84
Corfield AP, Myerscough N, Longman R, Arul S, Pignatelli M. 2000. Mucins and
mucosal protection in the gastrointestinal tract: new prospects for mucins in the
pathology of gastrointestinal disease. Gut 47: 589-594.
Cross CE, Halliwell B, Allen A. 1984. Anti-oxidant protection: a function of
tracheobronchial and gastrointestinal mucus. Lancet 16: 1328-1330.
Dekker J, Rossen JWA, Büller HA, Einerhand AWC. 2002. The MUC family: an
obituary. Trends Biochem. Scien. 27(3): 126-131.
Devine PL, McKenzie IF. 1992. Mucins: structure, function, and association with
malignancy. Bioessays 14(9) :619-625.
Escande F, Porchet N, Aubert J-P, Buisine M-P. 2002. The mouse Muc5B mucin gene:
cDNA and genomic structures, chromosomal localization and expression.
Biochem. J. 363: 589-598.
Finzi L, Barbu V, Burgel P-R, Mergey M, Kirkwood KS, Wick EC, Scoazec J-Y,
Peschaud F, Paye F, Nadel JA et al. 2006. MUC5AC, a gel-Forming Mucin
Accumulating in Gallstone Disease, Is Overproduced via an Epidermal Growth
Factor Receptor pathway in the Human Gallblsddes. Am J pathol. 169: 6 : 2031-
2041
Folkerts G, Busse WW, Nijkamp F, Sorkness R, Gern JE. 1998. Virus-induced airway
hyprresponsiveness and asthma. Am J Respir Crit Care Med. 157: 1707-1720.

85
Forstner JF, Forstner GG. 1994. Gastrointestinal mucus. In: Physiology of the
gastrointestinal tract. 3rd Ed. Johnson L.R. (Ed). New York: Raven. 1255-1284.
Gabry KE, Chrousos GP, Rice KC, Mostafa RM, Sternberg E, Negrao AB, Webster EL,
McCann SM, Gold PW. 2002. Marked suppression of gastric ulcerogenesis and
intestinal responses to stress by a novel class of drugs. Mol Psych 7: 474-84.
Gareau MG, Silva MA, Perdue MH. 2008. Pathophysiological Mechanisms of Stress-
Induced Intestinal Damage. Curr Mol Med. 8: 274-281.
Garrett RH, Grisham CM. 1999. Biochemistry. Saunders Publ., Sec. Ed. 284-286.
Gendler SJ, Spicer AP. 1995. Epithelial Mucin Genes. Ann. Rev. Physiol. 57:607-634.
Gu H, Tang C, Peng K, Sun H, Yang Y. 2009. Effects of Chronic Stress on the
Development of Artherosclerosis and Expression of Toll-Like Receptor 4
Signaling Pathway in Adolescent Apolipoprotein E Knockout Mice. J Biomed.
Biotechnol. Doi:10.115/2009/613879.
Habib KE, Gold PW, Chrousos GP. 2001. Neuroendocrinology of stress. Endocrinol.
Metabol. Clin NA. 30(3): 695-728.
Hayoz D, Mazzolai L. 2007. Endothelial function, mechanical stress and
artherosclerosis. Karger, 44: 62-75.
Hjemdahl P. 2000. Cardiovascular system and stress. In: Encyclopedia of stress. Vol 1
Ed. Fink, G. Academic Press. San Diego, CA. 389-403.

86
Henke MO, Renner A, Huber RM, Seeds MC, Rubin BK. 2004. MUC5AC and MUC5B
mucins are decreased in cystic fibrosis airway secretions. Am. J. Respir. Cell Mol.
Biol. 31: 86–91
Herd JA. 1991. Cardiovascular response to stress. Physiol Rev. 71: 305-330.
Henry JP, Lui YY, Nadra WE, Qia CG, Mormede P, Lemaire V, Ely D, Hendley ED.
1993. Psychosocial stress can induce chronic hypertension in normotensive
strains of rats. Am Heart Ass. 21: 714-723
Higuchi T, Orita T, Katsuya K, Yamasaki Y, Akiyama K, Li H, Yamamoto T, Saito Y,
Nakamura M. 2004. MUC20 Suppresses the Hepatocyte Growth Factor-Induced
Grb2-Ras Pathway by Binding to a Multifunctional Docking Site of Met. Mol Cell
Biol 24(17): 7456–7468.
Ho SB, Niehans GA., Lyftogt C, Yan PS, Cherwitz DL, Gum ET, Dahiya R, Kim YS.
1993. Heterogeneity of mucin gene expression in normal and neoplastic tissues.
Cancer Res 53:641-651.
Hoebler C, Gaudier E, De Coppet P, Rival M, Cherbut, C. 2006. MUC genes are
differently expressed during onset and maintenance of inflammation in dextran
sodium sulfate-treated mice. Digest Dis Sciences 51 (2): 381-389.
Hollingsworth MA, Swanson BJ. 2004. Mucins in cancer: protection and control of the
cell surface. Nat. Rev. Cancer 4(1): 45-60.

87
Homsi ME, Ducroc R, Claustre J, Jourdan G, Gertler A, Estienne M, Bado A, Scoazec
J-Y, Plaisancié P. 2007. Leptin modulates the expression of secreted and
membrane-associated mucins in colonic epithelial cells by targeting PKC, PI3K,
and MAPK pathways. Am J Physiol Gastrointest Live Physiol 293: G365-G373.
Itoh Y, Kamata-Sakurai M, Denda-Nagai K, Nagai S, Tsuiji M, Ishii-Schrade K, Okada
K, Goto A, Fukayama M, Irimura T. 2008. Identification and Expression of Human
Epiglycanin/MUC21: a Novel Transmembrane Mucin. Glycobiol. 18(1): 74-83.
Junqueira LC, Carneiro J. 2005, Basic Histology text & atlas 11thed. New York:
McGraw Hill, 298-316.
Kagnoff M.F. 1993. Immunology of the intestinal tract. Gastroenterol 105(5): 1275-
1280.
Kim HG, Kim JY, Gim MG, Lee JM, Chung DK. 2008. Mechanical stress induces tumor
necrosis factor-{alpha} production through Ca2+ release-dependent TLR2
signaling. Am J Physiol 295: 432- 439.
Kirkham S, Sheehan JK, Knight D, Richardson PS, and Thornton DJ. 2002.
Heterogeneity of airway mucus: variations in the amounts and glycoforms of the
major oligomeric mucins MUC5AC and MUC5B. Biochem J 361: 537-546.
Kvetnansky S, Mikulaj, L. 1970. Adrenal and urinary catecholamines in rats during
adaptation to repeated immobilization stress. Endocrinol. 87:738-743.

88
Lang T, Hansson GC, Samuelsson T. 2007, Gel-forming mucins appeared early in
metazoan evolution. Nat. Acad. Scien. USA, 104(41):16209-16214.
Lee M, Wardlaw SL. 2007 Beta-Endorphins. In: Encyclopedia of Stress. 2nd ed. 332-
335.
Leroy X, Gouyer V, Ballereau C, Zerimech F, Huet G, Copin M-C, Aubert J-P, Porchet
N. 2003. Quantitative RT-PCR assay for MUC3 and VEGF mRNA in renal clear
cell carcinoma: relationship with nuclear grade and prognosis.Urology 62 (4):
771-775.
Levenstein S. 1998. Stress and Peptic Ulcer: Life beyond Helicobacter. BMJ. 316: 538-
541.
Mall AS. 2008. Analysis of mucins: role in laboratory diagnosis. J. Clin Pathol. 61: 1018-
1024.
Markesich DC, Anand BS, Lew GM, Graham DY. 1995. Helicobacter pylori infection
does not reduce the viscosity of human gastric mucus gel. Gut, 36: 327-329.
Marshall BJ, Warren J.R.1984 Unidentified curved bacilli in the stomach patients with
gastritis and peptic ulceration. Lancet 1(8390): 1311-1315.
Martini FH, Nath JL. Fundamentals of Anatomy & Physiology. 8thed. San Francisco:
Pearson Benjamin Cummings 874-882.

89
McAuley JL, Linden SK, Png CW, King RM, Pennington HL, Gendler SJ, Florin TH, Hill
GR, Korolik V, McGuckin MA. 2007. MUC1 cell surface mucin is a critical
element of the mucosal barrier to infection. J Clin Invest. 117: 2313-2324.
Moal VL-L, Servin AL. 2006. The front line of enteric host defense against unwelcome
Intrusion of harmful microorganisms: antimicrobial peptides and microbiota. Clin.
Microbiol. Rev. 19(2): 315-337.
Moniaux N, Escande F, Porchet N, Aubert J-P, Batra, S.K. 2001. Structural organization
and classification of the human mucin genes. Front. Biosci. 6: D1192-D1206.
Moniaux N, Andrianifahanana M, Brand RE, Batra, S.K. 2004. Multiple roles of mucins
in pancreatic cancer, a lethal and challenging malignancy. Brit. J. Cancer. 91:
1633-1638.
Moniaux N, Chaturvedi P, Vashney GC, Meza JL, Rodriguez-Sierra JF, Aubert J-P,
Batra SK. 2007. Human MUC4 mucin induces ultra-structural changes and
tumorigenicity in pancreatic cancer cells. Brit J Cancer 97: 345-357.
NIH 9.29.2008. H pylori and Peptic Ulcer.
Patmore A. 2006. The truth about stress. Atlantic Books, London.
Perez-Vilar J, Hill RL. 1999. The structure and assembly of secreted mucins. J Biol
Chem 274(45): 31751-31754.

90
Pfeiffer CJ, Qiu B, Lam SK. 2001. Reduction of colonic mucus by repeated short-term
stress enhances experimental colitis in rats. J. Physiol Paris 95: 81-87.
Phillpson M, Johansson MEV, Henriksnäs J, Petersson J, Gendler SJ, Sandler S
Persson AEG, Hansson GC, Holm L. 2008. The gastric mucus layers:
constituents and regulation of accumulation. Am J Physiol Gastrointest Liver
Physiol. 295:806-812.
Puchtler H, Waldrop F S Meloan S N, Terry M S, Conner HM. 1970. Methacarn
(Methanol-Carnoy) fixation. Practical and theoretical considerations. Histoch.
21:97- 116.
Rakha EA, Boyce RWG, El-Rehim DA, Kurien T, Green AR, Paish EC, Robertson JFR,
Ellis IO. 2005. Expression of mucins (MUC1, MUC2, MC3, MUC4, MUC5AC and
MUC6) and their prognostic significance in human breast cancer. Mod Pathol
18:1295-1304.
Ramsauer VP, Pino V, Farooq A, Carraway CAC, Salas PJI and Carraway KL. 2006.
Muc4–ErbB2 Complex Formation and Signaling in Polarized CACO-2 Epithelial
Cells Indicate That Muc4 Acts as an Unorthodox Ligand for ErbB2. Mol Biol Cell.
17: 2931–2941.
Reber SO, Birkeneder L, Veenema AH, Obermeier F, Falk W, Straub RH, Neumann ID.
2007. Adrenal Insufficiency and Colonic Inflammation after a Novel Chronic

91
Psycho-Social Stress Paradigm in Mice: Implications and Mechanisms.
Endocrinol 148(2): 670-682.
Reid CJ, Harris A. 1998. Developmental expression of mucin genes in the human
gastrointestinal system. Gut 42: 220-226.
Rich EL and Romero LM 2005. Exposure to chronic stress downregulates
corticosterone responses to acute stressors. Am J Physiol 288: R1628-R1636.
Robbe C, Capon C, Coddeville B, Michalski J-C, 2004. Structural diversity and specific
distribution of O-glycans in normal human mucins along the intestinal tract.
Biochem. J. 384: 307-316.
Rose CM, Voynow JA. 2006. Respiratory tract mucin genes and mucin glycoproteins in
health and disease. Physiol. Rev. 86: 245-278.
Rubio CA, Huang, CB, Porwitt A, Kock Y, Stenling R. 1991. Quantification of the colonic
mucous cell population during protracted stress in rats. doi:
1002/smi.2460070304
Ruwhof C, Van der Laase A. 2000. Mechanical stress-induced cardiac hypertrophy:
mechanisms and signal transduction pathways. Cardiovasc. Res. 47: 23-37.
Selye H. 1976. Forty years of stress research: principal remaining problems and
misconceptions. Can. Med. Assoc. J. 115: 53-55.
Selye H. 1936. A syndrome produced by diverse nocuous agents, Nature. 138: 32.

92
Senapati S, Chaturvedi P, Sharma P, Venkatrman G, Meza JL, El-Rifai W, Roy HK,
Batra SK. 2008. Deregulation of MUC4 in gastric adenocarcinomas: potential
pathological implication in poorly differentiated non-signet ring cell type gastric
cancer. Brit J Cancer 99: 949-956.
Sidebotham RL, Batten JJ, Karim QN, Spencer J, Baron JH. 1991. Breakdown of
gastric mucus in presence of Helicobacter pylori. J Clin Pathol. 44: 52-57.
Shekels LL, Ho SB. 2003. Characterization of the mouse Muc3 membrane bound
intestinal mucin 5’ coding and promoter regions: regulation by inflammatory
cytokines. B B A 1627: 90-100.
Söderholm JD, Perdue MH. 2001. Stress and the Gastrointestinal Tract. II. Stress and
intestinal barrier function. Am J Physiol Gastrointest Liver Physiol 280: G7–G13.
Song KS, Lee W-J, Chung KC, Koo JS, Yang EY, Choi JY, Yoon J-H. 2003. Interleukin-
1β and Tumor Necrosis Factor-α induce MUC5AC overexpression through a
mechanism involving ERK/p38 mitogen-activated protein kinases-MSK1-CREB
activation in human airway epithelial cells. J Biol Chem 278 (26): 23243-23250.
Songyang Z, Shoelson S E, McGlade J, Olivier P, Pawson T, Bustello XR, Barbacid M,
Sabe H, Hanafusa H, Yi T, Ren R. et al. 1994. Specific motifs recognized by the
SH2 domains of Csk, 3PB2, fps/fes, GRB2, HCP, SHC, Syk and Vav. Mol Cell
Biol, 14: 2777-2785.

93
Swartz MJ, Batra SK, Varshney GC, Hollingsworth MA, Yeo CJ, Cameron JL, Willentz
RE, Hruban RH, Argani P. 2002. MUC4 expression increases progressively in
pancreatic intraepithelial neoplasia (PanIN). Am J Clin Pathol 117: 791–796.
Toribara NW, Ho SB, Gum E, Gum JR Jr, Lau P, Kim YS. 1997. The Carboxyl-terminal
sequence of the human secretory mucin, MUC6 analysis of the primary amino
acid sequence. J Biol Chem. 272: 16398–16403.
Toribara NW, Gum JR, Culhane PJ, Lagace RE, Hicks JW, Petersen GM, Kim YS.
1991. MUC-2 human small intestinal mucin gene structure. Repeated Arrays and
polymorphism. J Clin Invest Inc. 88: 1005-1013.
Tsukada F, Sawamura K, Kohno H, Ohkubo Y. 2002. Mechanism of Inhibition of Small
Intestinal Motility by Restraint stress Differs from That with Norepinephrine
Treatment in Rats. Biol.Pharm. Bull. 25(1): 122-24.
Tytgat K M, Dekker J, Büller HA. 1993. Mucins in inflammatory bowel disease. Eur J
Gastroenterol Hepatol. 5: 119-128.
Van de Bovenkamp JHB, Mahdavi J, Korteland-Van Male AM, Büller HA, Einerhand
AWC, Borén T, Dekker J. 2003. MUC5AC glycoprotein is the primary receptor for
Helicobacter pylori in the stomach of humans. Helicobacter 8(5): 521-532.
Velcich A, Yang W, HeyerJ, Fragale A, NicholasC, Viani S, Kucherlapati R, Lipkin M,
Yang K, Augenlicht L. 2002. Colorectal cancer in mice genetically deficient in the
mucin Muc2. Science 295: 1726-1729.

94
Voynow J, Rubin BK. 2009. Mucins, Mucus, and Sputum. Chest: 135; 505-512.
Voynow J, Gendler SJ, Rose M.C. 2006. Regulation of Mucin genes in chronic
Inflammatory Airway Diseases. Am J Respir Cell and Molec Biol: 34; 661-665.
Wang R-Q, Fang, D-C. 2003. Alterations of MUC1 and MUC3 expression in gastric
carcinoma: relevance too patient clinicopathological features. J Clin Pathol 56:
378-384.
Watson AM, Troxler RF, Pena M, Kandil A, Berger J, Rose M.C. 2003. Muc7 mucin
glycoprotein is present in airway secretions of asthmatic, but not control, patients
(Abstract) Am J Respir Crit Care Med. 167: A465.
Werther JL. 2000. The gastric mucosal barrier. Mount Sinai J Med. 67(1): 41-53.
Williams SJ, McGuckin MA, Gotley DC, Eyre HJ, Sutherland GR, Antalis TM. 1999.
Two Novel Mucin Genes Down-Regulated in Colorectal Cancer Identified by
Differential Display. Cancer Res 59: 4083-4089.
Workman HC, Miller JK, Ingalla EQ, Kaur RP, Yamamoto DI, Beckett LA, Young LJT,
Cardiff RD, Borowsky AD, Carraway KL, et al. 2009. The membrane mucin
MUC4 is elevated in breast tumor lymphnode metastases relative to matched
primary tumors and confers aggressive properties to breast cancer cells. Breast
Cancer Research 2009, 11/5:R70 (doi:10.1186/bcr2264).

95
Yamada T, Alpers DH, Kaplowitz N, Laine L, Owyang C, Powell DW. editors. 2003,
Gastroenterology. Vol.1 4th ed. Philadelphia: Lippincott Williams & Wilkins. 1466-
1473.
Zigman J, Lutter M. 2008. Hunger hormone increases during stress, may have
antidepressant effect. ScienceDaily. Retrieved June 17, 2010 from
http://www.sciencedaily.com/release/2008/06/080615142252.htm
Zou Y, Akazawa H, Qin Y, Sano M, Takano H, Minamino T, Makita N, Iwanaga K, Zh
W, Kudoh S. et al.. 2004. Mechanical stress activates angiotensin II type 1
receptor without the involvement of angiotensin II. Nat. Cel. Biol. 6 (6): 499-506.

96
VITA
BUPE MARTHA HABIYAMBERE
Personal data: Date of birth: October 27, 1960
Place of birth: Lubumbashi, Congo DR
Marital status: Married
Education: Wema High School (Lubumbashi, Congo DR)
University of Lubumbashi (Congo DR): DVM, 1986
East Tennessee State University, Johnson City, TN
MS Biology, 2010
Professional
Experience: Research Assistant, James H. Quillen School of medicine,
East Tennessee State University, Department of Pharmacology,
Johnson City, TN. July 2010 - present
Graduate Assistant, East Tennessee State University, Department
of Biological Sciences, Johnson City, TN. January 2008 - May 2010
Research Assistant East Tennessee State University, Department
of Health Sciences, Johnson City, TN. May 2008 - July 2010
Research Assistant Appalachian State University, Department of
Biology, Boone, NC. August 2006- July 2007

97
Practiced veterinary medicine in Congo July 1986 – 1998
Awards: FASEB – MARC Travel Award
Graduate Student Research Grant
Graduate & Professional Student Association Travel Award (GPSA)
Teaching Assistant Grant
Best student performance Grant
Publications: Habiyambere, B. M. and Onyango, E. M. 2010. Effect of Stress on
mucin-producing cells in the intestinal tract of mice. FASEB J. 2010
24: 1013.4
Habiyambere, B. M. and Onyango, E. M. 2009. Source and Level of
Protein fed to Mice may affect their intestinal mucin production.
FASEB J. 23: 977.8
Chishimba N Mowa, Christina L Montavon, Subrina Jesmin, Ginger
Hindman, Martha B Habiyambere, and Guichuan Hou. Estrogen
enhances penile healing and VEGF expression in rats. FASEB J.
2007 21:710.5
Subrina Jesmin, Chishimba N Mowa, Martha B Habiyambere,
Sohel Zaedi, Nobutake Shimojo, Naoto Yamaguchi, Takashi
Miyauchi, and Satoshi Gando. Chronological expression of

98
Endothelin-1 and TNF-α in Acute Liver Injury and its amelioration
by PAR2 Blockade in a septic Rat Model. FASEB J. 2007 21:710.8