Effect of Sodium Phenobarbital Bilirubin Metabolism Infant ......Bilirubin-'H was administered twice...
14
Effect of Sodium Phenobarbital on Bilirubin Metabolism in an Infant with Congenital, Nonhemolytic, Unconjugated Hyperbilirubinemia, and Kernicterus JoHN F. CRIGLER, JR. and NORMAN I. GOLD From the Department of Medicine (Endocrine Division), The Children's Hospital Medical Center, and the Department of Pediatrics, Harvard Medical School, Boston, Massachusetts 02115 A B S T R A C T Sodium phenobarbital and various hor- mones, compounds capable of hepatic enzyme induction, were given to an infant boy with congenital, nonhemo- lytic, unconjugated, hyperbilirubinemia and severe kernicterus for prolonged periods between the ages of 2 and 25 months to determine their effect on serum bili- rubin concentrations. Phenobarbital, 5 mg/day orally, on two occasions decreased serum bilirubin concentra- tions approximately threefold over a period of 30 days. Withdrawal of phenobarbital after the first study re- sulted in a gradual (30 days) return of serum bilirubin to pretreatment levels. The lower serum bilirubin con- centrations observed when phenobarbital therapy was reinstituted were maintained for 61 days on 2.5 mg/kg per day of the drug. Orally administered L-triiodothyro- nine, 0.05-0.1 mg/day for 71 days, intramuscular human growth hormone, 1 mg/day for 21 days, and testosterone propionate, 0.1 mg/day for 9 days, did not decrease se- rum bilirubin levels below lowest control values of 18 mg/100 ml. Bilirubin-'H was administered twice before and once with bilirubin-"C during phenobarbital therapy to study the kinetics of bilirubin metabolism. Results of the first and second control studies and of the bilirubin-'H and bilirubin-"C phenobarbital studies, respectively, were as follows: tptal body bilirubin pools, 200, 184, 73, and 72 mg; half-lives, 111, 84, 37, and 39 hr; and turnover, 30, 37, 33, and 31 mg/day. The data show that the ap- proximate threefold decrease in serum bilirubin concen- This work was presented in part at the annual meetings of The American Society for Clinical Investigation, Inc., Atlantic City, N. J., May 1966 and May 1967. Received for publication 4 March 1968 and in revised form 28 August 1968. tration and total body pool resulted from a comparable decrease in bilirubin half-life without a significant change in turnover. In vitro histological (electron microscopy) and en- zymological studies of liver obtained by surgical biop- sies before and during phenobaribtal administration showed that both the hepatocyte content of agranular endoplasmic reticulum (AER) and the ability of liver homogenate to conjugate p-nitrophenol were signifi- cantly increased during phenobarbital treatment. The observations suggest that phenobarbital affects bilirubin metabolism by the induction of an enzyme(s) with a slow rate(s) of degradation (or rapid rate of degradation with limited capacity). INTRODUCTION In recent years, investigations in many animal species, including man, have shown that a variety of polycyclic hydrocarbons, insecticides, drugs, and hormones enhance the activities of microsomal and soluble enzymes and increase hepatic agranular endoplasmic reticulum (AER). Results of these investigations have been sum- marized by early workers in this field (1-6). The fre- quency of this pharmacological response is emphasized in a compilation by Conney (5) in 1965 which showed that stimulation of drug-metabolizing enzymes had been observed with over 100 drugs and other compounds. Catz and Yaffe (7) and Arias, Gartner, Furman, and Wolfson (8) first demonstrated that the in vivo ad- ministration of various drugs and chemicals increased in vitro activity of the uridine diphosphate glucuronic acid transglucuronylase (UDPGA transferase) system for bilirubin in rats, rabbits, and mice. However, Arias 42 The Journal of Clinical Investigation Volume 48 1969
Transcript of Effect of Sodium Phenobarbital Bilirubin Metabolism Infant ......Bilirubin-'H was administered twice...

Effect of Sodium Phenobarbital on
Bilirubin Metabolism in an Infant with
Congenital, Nonhemolytic, Unconjugated
Hyperbilirubinemia, and Kernicterus
JoHN F. CRIGLER, JR. and NORMANI. GOLD
From the Department of Medicine (Endocrine Division), The Children'sHospital Medical Center, and the Department of Pediatrics, Harvard MedicalSchool, Boston, Massachusetts 02115
A B S T R A C T Sodium phenobarbital and various hor-mones, compounds capable of hepatic enzyme induction,were given to an infant boy with congenital, nonhemo-lytic, unconjugated, hyperbilirubinemia and severekernicterus for prolonged periods between the ages of 2and 25 months to determine their effect on serum bili-rubin concentrations. Phenobarbital, 5 mg/day orally,on two occasions decreased serum bilirubin concentra-tions approximately threefold over a period of 30 days.Withdrawal of phenobarbital after the first study re-sulted in a gradual (30 days) return of serum bilirubinto pretreatment levels. The lower serum bilirubin con-centrations observed when phenobarbital therapy wasreinstituted were maintained for 61 days on 2.5 mg/kgper day of the drug. Orally administered L-triiodothyro-nine, 0.05-0.1 mg/day for 71 days, intramuscular humangrowth hormone, 1 mg/day for 21 days, and testosteronepropionate, 0.1 mg/day for 9 days, did not decrease se-rum bilirubin levels below lowest control values of 18mg/100 ml.
Bilirubin-'H was administered twice before and oncewith bilirubin-"C during phenobarbital therapy to studythe kinetics of bilirubin metabolism. Results of the firstand second control studies and of the bilirubin-'H andbilirubin-"C phenobarbital studies, respectively, wereas follows: tptal body bilirubin pools, 200, 184, 73, and72 mg; half-lives, 111, 84, 37, and 39 hr; and turnover,30, 37, 33, and 31 mg/day. The data show that the ap-proximate threefold decrease in serum bilirubin concen-
This work was presented in part at the annual meetingsof The American Society for Clinical Investigation, Inc.,Atlantic City, N. J., May 1966 and May 1967.
Received for publication 4 March 1968 and in revised form28 August 1968.
tration and total body pool resulted from a comparabledecrease in bilirubin half-life without a significantchange in turnover.
In vitro histological (electron microscopy) and en-zymological studies of liver obtained by surgical biop-sies before and during phenobaribtal administrationshowed that both the hepatocyte content of agranularendoplasmic reticulum (AER) and the ability of liverhomogenate to conjugate p-nitrophenol were signifi-cantly increased during phenobarbital treatment.
The observations suggest that phenobarbital affectsbilirubin metabolism by the induction of an enzyme(s)with a slow rate(s) of degradation (or rapid rate ofdegradation with limited capacity).
INTRODUCTION
In recent years, investigations in many animal species,including man, have shown that a variety of polycyclichydrocarbons, insecticides, drugs, and hormones enhancethe activities of microsomal and soluble enzymes andincrease hepatic agranular endoplasmic reticulum(AER). Results of these investigations have been sum-marized by early workers in this field (1-6). The fre-quency of this pharmacological response is emphasizedin a compilation by Conney (5) in 1965 which showedthat stimulation of drug-metabolizing enzymes had beenobserved with over 100 drugs and other compounds.
Catz and Yaffe (7) and Arias, Gartner, Furman, andWolfson (8) first demonstrated that the in vivo ad-ministration of various drugs and chemicals increasedin vitro activity of the uridine diphosphate glucuronicacid transglucuronylase (UDPGA transferase) systemfor bilirubin in rats, rabbits, and mice. However, Arias
42 The Journal of Clinical Investigation Volume 48 1969

et al. (8), in exploring the potential use of these drugsto accelerate the formation of bilirubin glucosiduronatein man, showed that the administration of chloroquineto pregnant women, for 1-8 wk before delivery, wasunable to alter the hyperbilirubinemia present in theirnewborn infants.
The ability of phenobarbital to stimulate the trans-formations of drugs (9) and steroid hormones in vari-ous animals (10) and man (11) and our current use ofthis drug in studies of steroid hormone metabolism led usto investigate the effect of phenobarbital on the bilirubinmetabolism of an infant with marked congenital, non-hemolytic, unconjugated hyperbilirubinemia, who hadsuffered severe, irreversible neurological damage dur-ing the 1st month of life. This paper reports changesobserved in serum bilirubin concentrations and in thekinetics of bilirubin turnover before and during pheno-barbital administration to this infant (12, 13). Coinci-dent with these studies, Yaffe, Levy, Matsuzawa, andBaliah (14) described a similar effect of phenobarbitalon serum bilirubin concentrations in an infant with con-genital nonhemolytic jaundice and reported a drug-in-duced increase in the capacity to conjugate salicylamideas glucosiduronate.
METHODSClinical course and study periods. T. U. was hospitalized
from 2 to 23 months of age and for 2 wk at 25 months ofage. He was the seventh child of a 42 yr old gravida 7, para7 woman. One day of bleeding occurred in the 2nd monthof pregnancy. At 7 months, premature rupture of mem-branes was accompanied by a febrile illness of unknowncause which responded to antibiotics. Birth weight was 2.06kg. Jaundice during the 1st wk of life was thought to bephysiological. However, when he was seen at 2 months ofage because of an umbilical hernia, marked jaundice waspresent.
The patient's maternal grandmother had intermittent,indirect hyperbilirubinemia (serum bilirubin, 1.7 mg/100 ml).She had been studied at another hospital, and no evidenceof hemolysis or liver disease had been found. The patient'soldest brother had been jaundiced in the newborn period.
At 2 months of age, T. U. was 135 cm in length andweighed 4.38 kg. His skin was orange-yellow in color, andhe had marked clinical evidence of kernicterus. There wasa small umbilical hernia. The liver and spleen were notenlarged.
Initial laboratory studies were as follows: hemoglobin 12.7g/100 ml, hematocrit 39.5%o, reticulocytes 1.0%, and WBC7000/mm3 with a normal differential. Urinalysis was normaland was negative for bilirubin (Ictotest, Ames Co., Inc.,Elkhart, Ind.) and urobilinogen (15). Serum bilirubin (16)was usually between 17 and 25 mg/100 ml, virtually allindirect reacting. Values from 35 to 39 mg/100 ml wereobserved after an exchange transfusion 7 days before hisfirst admission and after surgery for liver biopsies (Table Ifootnotes). Other liver function tests 1 including total serum
1Liver function tests were performed in the ClinicalLaboratories of The Children's Hospital Medical Center.Total serum protein was measured using an ultra micro
protein and serum protein electrophoresis, cephalin-choles-terol flocculation (19), thymol flocculation and turbidity(19), prothrombin time, and serum alkaline phosphatase (20)were within normal limits. Serum glutamic oxalacetic andglutamic pyruvic transaminase activities were increased andranged from 105 to 180 and 75 to 95 U/ml, respectively.Lactic dehydrogenase activity, measured only on one occa-sion, was 265 U/ml, an elevated value. The explanationfor these elevated serum enzyme activities in this patientwith marked neuromuscular as well as hepatic dysfunctionis not known.
Liver biopsies for histological and enzymatic studies wereobtained at surgery before (age 83 and 551 days) andduring L-triiodothyronine (age 132 days) and phenobarbital(age 677 days) administration. Nitrous oxide-oxygen andhalothane (2-bromo-2-chloro-1, 1, 1-trifluoroethane) anes-thesia was administered after a 9 hr fast.
The various study periods during the patient's two hos-pitalizations are outlined in Table I, and the mean andstandard deviation of serum bilirubin concentrations aregiven for each period. Serum bilirubin concentrations weremeasured once or twice daily on capillary blood (16) through-out the course of observation.
Kinetic studies of bilirubin metabolism were done at 496,522, and 608 days of age (Table I, periods 15 and 16).During the first two studies, control 1 and control 2, thepatient had intermittent fever with otitis media and leftmastoiditis. Nasogastric tube feedings, required because ofdefective swallowing associated with kernicterus, led toreoccurring upper respiratory obstruction and infections. Hereceived ampicillin from days 3 to 15 of the first bilirubin-3Hstudy (control 1) and nafcillin 4 days before and during thefirst 12 days of the second study (control 2). In spite ofnafcillin therapy, he remained intermittently febrile withincreased serum bilirubin concentrations during the secondbilirubin-3H study (control 2). On the 16th day of the latterstudy, 3 days after nafcillin was discontinued, his feverincreased to 105°F, and a left mastoiditis was radiologicallyevident. This infection responded promptly to intravenousoxacillin and kanamycin. 12 days later (age 551 days), agastrostomy was done to facilitate feedings. The third liverbiopsy was obtained at this time. No further respiratoryillnesses occurred during the period of study.
Kinetic studies. The general plan of these studies wasbased on observations of bilirubin metabolism in a similarpatient originally reported by Schmid and Hammaker (21).
Preparation of bilirubin-3H and bilirubin-`C. Crystallinebilirubin was treated with tritium gas according to theprocedure of Wilzbach (22). The crude product was washedwith methanol and the methanol removed by evaporation.The residue was crystallized several times from hot pyri-dine (23). After addition of unlabled bilirubin, the prepara-
adaptation of the methods of Kingsley (17) and Gornall,Bardawill, and David (18) and protein electrophoresis car-ried out on a Beckman Model R paper electrophoresissystem by procedure B described in the Instruction Manual(November, 1957). The Quick prothrombin time was doneusing the test procedure described by Hyland DivisionTravenol Laboratories, Inc., Los Angeles, Calif., who pre-pared the thromboplastin. Serum glutamic oxalacetic trans-aminase (SGOT), glutamic pyruvic transaminase (SGPT),and lactic dehydrogenase (LDH) were determined usingreagent tubes (Determatubes) prepared by the WorthingtonBiochemical Corp., Freehold, N. J., with slight modifications.Normal values in units per milliliter for infants are 10-40for SGOT, 10-60 for SGPT, and 40-100 for LDH.
Bilirubin Metabolism: Effect on Phenobarbital 43
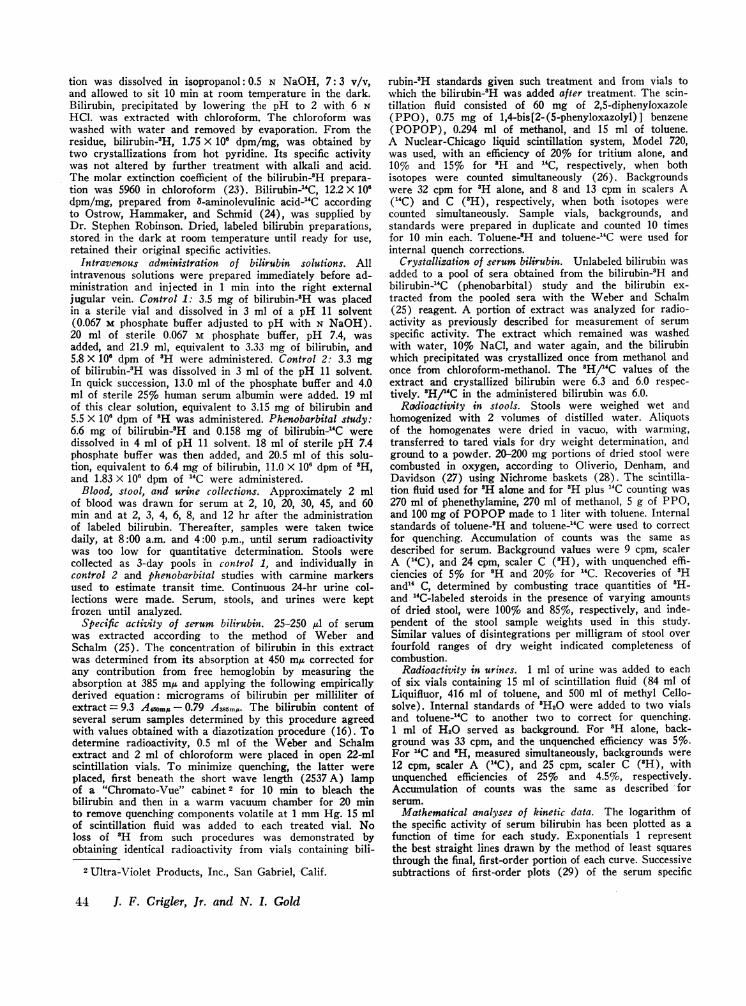
tion was dissolved in isopropanol: 0.5 N NaOH, 7: 3 v/v,and allowed to sit 10 min at room temperature in the dark.Bilirubin, precipitated by lowering the pH to 2 with 6 NHCL. was extracted with chloroform. The chloroform waswashed with water and removed by evaporation. From theresidue, bilirubin-2H, 1.75 X 10⁶ dpm/mg, was obtained bytwo crystallizations from hot pyridine. Its specific activitywas not altered by further treatment with alkali and acid.The molar extinction coefficient of the bilirubin-'H prepara-tion was 5960 in chloroform (23). Bilirubin-'4C, 12.2 X 10⁶dpm/mg, prepared from 8-aminolevulinic acid-14C accordingto Ostrow, Hammaker, and Schmid (24), was supplied byDr. Stephen Robinson. Dried, labeled bilirubin preparations,stored in the dark at room temperature until ready for use,retained their original specific activities.
Intravenous administration of bilirubin solutions. Allintravenous solutions were prepared immediately before ad-ministration and injected in 1 min into the right externaljugular vein. Control 1: 3.5 mg of bilirubin-'H was placedin a sterile vial and dissolved in 3 ml of a pH 11 solvent(0.067 M phosphate buffer adjusted to pH with N NaOH).20 ml of sterile 0.067 M phosphate buffer, pH 7.4, wasadded, and 21.9 ml, equivalent to 3.33 mg of bilirubin, and5.8 X 10' dpm of 'H were administered. Control 2: 3.3 mgof bilirubin-'H was dissolved in 3 ml of the pH 11 solvent.In quick succession, 13.0 ml of the phosphate buffer and 4.0ml of sterile 25% human serum albumin were added. 19 mlof this clear solution, equivalent to 3.15 mg of bilirubin and5.5 X 10' dpm of 'H was administered. Phenobarbital study:6.6 mg of bilirubin-'H and 0.158 mg of bilirubin-14C weredissolved in 4 ml of pH 11 solvent. 18 ml of sterile pH 7.4phosphate buffer was then added, and 20.5 ml of this solu-tion, equivalent to 6.4 mg of bilirubin, 11.0 X 10' dpm of 'H,and 1.83 X 10' dpm of 14C were administered.
Blood, stool, and urine collections. Approximately 2 mlof blood was drawn for serum at 2, 10, 20, 30, 45, and 60min and at 2, 3, 4, 6, 8, and 12 hr after the administrationof labeled bilirubin. Thereafter, samples were taken twicedaily, at 8:00 a.m. and 4:00 p.m., until serum radioactivitywas too low for quantitative determination. Stools werecollected as 3-day pools in control 1, and individually incontrol 2 and phenobarbital studies with carmine markersused to estimate transit time. Continuous 24-hr urine col-lections were made. Serum, stools, and urines were keptfrozen until analyzed.
Specific activity of serum bilirubin. 25-250 Al of serumwas extracted according to the method of Weber andSchalm (25). The concentration of bilirubin in this extractwas determined from its absorption at 450 mu corrected forany contribution from free hemoglobin by measuring theabsorption at 385 mu and applying the following empiricallyderived equation: micrograms of bilirubin per milliliter ofextract = 9.3 Aaomx- 0.79 A385m,. The bilirubin content ofseveral serum samples determined by this procedure agreedwith values obtained with a diazotization procedure (16). Todetermine radioactivity, 0.5 ml of the Weber and Schalmextract and 2 ml of chloroform were placed in open 22-mlscintillation vials. To minimize quenching, the latter wereplaced, first beneath the short wave length (2537A) lampof a "Chromato-Vue" cabinet 2 for 10 min to bleach thebilirubin and then in a warm vacuum chamber for 20 minto remove quenching components volatile at 1 mmHg. 15 mlof scintillation fluid was added to each treated vial. Noloss of 'H from such procedures was demonstrated byobtaining identical radioactivity from vials containing bili-
2 Ultra-Violet Products, Inc., San Gabriel, Calif.
rubin-3H standards given such treatment and from vials towhich the bilirubin-'H was added after treatment. The scin-tillation fluid consisted of 60 mg of 2,5-diphenyloxazole(PPO), 0.75 mg of 1,4-bis[2- (5-phenyloxazolyl)] benzene(POPOP), 0.294 ml of methanol, and 15 ml of toluene.A Nuclear-Chicago liquid scintillation system, Model 720,was used, with an efficiency of 20% for tritium alone, and10% and 15% for 'H and 14C, respectively, when bothisotopes were counted simultaneously (26). Backgroundswere 32 cpm for 'H alone, and 8 and 13 cpm in scalers A(14C) and C ('H), respectively, when both isotopes werecounted simultaneously. Sample vials, backgrounds, andstandards were prepared in duplicate and counted 10 timesfor 10 min each. Toluene-'H and toluene-'4C were used forinternal quench corrections.
Crystallization of serum bilirubin. Unlabeled bilirubin wasadded to a pool of sera obtained from the bilirubin-'H andbilirubin-14C (phenobarbital) study and the bilirubin ex-tracted from the pooled sera with the Weber and Schalm(25) reagent. A portion of extract was analyzed for radio-activity as previously described for measurement of serum
specific activity. The extract which remained was washedwith water, 10% NaCl, and water again, and the bilirubinwhich precipitated was crystallized once from methanol andonce from chloroform-methanol. The 'H/fC values of theextract and crystallized bilirubin were 6.3 and 6.0 respec-tively. 'H/"C in the administered bilirubin was 6.0.
Radioactivity in stools. Stools were weighed wet andhomogenized with 2 volumes of distilled water. Aliquotsof the homogenates were dried in vacuo, with warming,transferred to tared vials for dry weight determination, andground to a powder. 20-200 mg portions of dried stool were
combusted in oxygen, according to Oliverio, Denham, andDavidson (27) using Nichrome baskets (28). The scintilla-tion fluid used for 'H alone and for 3H plus `4C counting was270 ml of phenethylamine, 270 ml of methanol, 5 g of PPO,and 100 mg of POPOPmade to 1 liter with toluene. Internalstandards of toluene-'H and toluene-14C were used to correctfor quenching. Accumulation of counts was the same asdescribed for serum. Background values were 9 cpm, scalerA (14C), and 24 cpm, scaler C ('H), with unquenched effi-ciencies of 5% for 'H and 20%o for 14C. Recoveries of 'Hand14 C, determined by combusting trace quantities of 'H-and 14C-labeled steroids in the presence of varying amountsof dried stool, were 100% and 85%, respectively, and inde-pendent of the stool sample weights used in this study.Similar values of disintegrations per milligram of stool overfourfold ranges of dry weight indicated completeness ofcombustion.
Radioactivity in urines. 1 ml of urine was added to eachof six vials containing 15 ml of scintillation fluid (84 ml ofLiquifluor, 416 ml of toluene, and 500 ml of methyl Cello-solve). Internal standards of 'H20 were added to two vialsand toluene-"C to another two to correct for quenching.1 ml of H20 served as background. For 'H alone, back-ground was 33 cpm, and the unquenched efficiency was 5%0.For 1'C and 'H, measured simultaneously, backgrounds were
12 cpm, scaler A ("4C), and 25 cpm, scaler C ('H), withunquenched efficiencies of 25% and 4.5%, respectively.Accumulation of counts was the same as described -forserum.
Mathematical analyses of kinetic data. The logarithm ofthe specific activity of serum bilirubin has been plotted as a
function of time for each study. Exponentials 1 representthe best straight lines drawn by the method of least squaresthrough the final, first-order portion of each curve. Successivesubtractions of first-order plots (29) of the serum specific
44 1. F. Crigler, Jr. and N. I. Gold

activity curves of both control and phenobarbital studiesresulted in three first-order slopes, exponentials 1, 2, and 3.The subtractions for exponentials 2 and 3 were performedgraphically. Each curve, therefore, is described by thegeneral equation, v = aoe-it + a2e-'-t + a3e-s3t (29), whereiv is serum bilirubin specific activity at time, t, and a,, a2,and a3 the bilirubin specific activities at t = 0 of the respec-tive slopes Xi, X2, and X3.
The slope, X1, and its intercept a1, which are considered torepresent steady-state values after complete mixing, wereused to calculate total body pool and turnover of bilirubin(29). The additional exponentials of the general equationdescribe, at least, two other biological compartments of bili-rubin which are distinguished readily by the marked differ-ences in their rates of mixing (X2 and X3) with the plasmapool. A compartmental analysis of the data, however, is notattempted in this paper.
In vitro liver studies
Electron microscopy. 1-mm cubes of liver obtained bybiopsy before (age 551 days) and during (age 677 days)
phenobarbital therapy were fixed either in 5% glutaralde-hyde-sodium cacodylate buffer, followed by washing andfurther fixation in Dalton's chrome-osmium solution, ordirectly, in Dalton's chrome-osmium solution. Tissues wereprocessed for electron microscopy as described by Uzman,Foley, Farber, and Lazarus (30). 1-it sections of severalblocks of each specimen were examined by phase microscopyand appropriate areas selected for thin sectioning and elec-tron microscopic examination. Two types of analyses weredone to establish whether or not phenobarbital treatmentsignificantly altered the amount of AER in the hepatocytepopulation. First, several blocks of each specimen were cutand random electron micrographs taken and blind-sorted onthe basis of the amount of AER present. Second, the amountof AER in hepatocytes adjacent to portal areas of the tissueobtained during phenobarbital therapy was compared to thatof hepatocytes near the central part of the lobule of thespecimen obtained before phenobarbital administration. Thelatter comparison was made as, perhaps, the most demandingtest of the effect of phenobarbital on AER proliferationsince Burger and Herdson (31) and Becker and Lane (32)
TABLE IStudy Periods and Serum Bilirubin Concentrations in an Infant Boy with Congenital, Nonhemolytic,
Unconjugated Hyperbilirubinemia and Kernicterus
Total serumbilirubin mg '100 ml
Period Age Test substance No. Mean 4sD
days
1 68-96 None 25 26.3 ±4.7*2 97-114 L-Triiodothyronine, 0.05 mg/day, oral 16 18.4 41.73 115-140 L-Triiodothyronine, 0.075 mg/day, oral 17 24.9 ±3.0+4 141-158 L-Triiodothyronine, 0.1 mg/day, oral 16 24.4 ±1.55 159-167 L-Triiodothvronine, 0.1 mg/day, oral plus 9 21.5 ±1.8
human growth hormone, 1 mg/day, i.m.6 168-179 Human growth hormone, 1 mg/day, i.m. 11 27.2 ±2.87 180-185 None 6 30.0 ±1.58 186-191 Phenobarbital, 15 mg 2X day, oral 9 24.3 +1.89 192-197 Phenobarbital, 15 mg 2X day, oral plus 9 18.2 ±3.0
testosterone propionate, 0.1 mg/day, i.m.10 198-209 Testosterone propionate, 0.1 mg/day, i.m. 21 13.5 ±1.511 210-227 None 32 17.7 ±1.512 228-236 Testosterone propionate, 0.1 mg/day, i.m. 14 18.3 ±1.213 237-266 Testosterone propionate, 0.1 mg/day, i.m. 58 12.1 +4.1
plus phenobarbital, 15 mg 2 X day, oral14 267-308 Phenobarbital, 15 mg 2X day, oral 77 8.9 ±2.015 309-567 None 298 22.7 ±4.0§16 568-699 Phenobarbital, 20 mg 2X day, p.g.fl 104 6.7 ±1.2¶
700 Discharged on phenobarbital, 10 mg 2 X day, p.g.
17 755-761 Phenobarbital, 10 mg 2X day, p.g. 11 7.1 ±0.418 762-768 Phenobarbital, 8 mg/day, p.g. 14 6.6 ±0.9
*Admitted to The Children's Hospital Medical Center on 68th day of age. Serum bilirUbin increased to 34 mg/100 ml after500 ml exchange transfusion on 61st day of age and to 38 mg/100 ml after liver biopsy on 83rd day of age. Sertim bilirubin17 mg/100 ml on the 96th day of age.I Values obtained for 9 days after liver biopsy not included.§ Values of first 30 days off phenobarbital (see Fig. 2) not included.
I! Per gastrostomy.¶ Values of first 30 days on phenobarbital (see Fig. 1 B) not included.
Bilirubin Metabolism: Effect on Phenobarbital 45

CONTROLLEVEL A
; AGE237 days (t00)* WT 5.8 kg
00 ~ ~ 0
0
lo19C S1.239- 0.0125t
0~~~~0~~~~
0 ~ ~
.PHENOBARBITAL, 5mg/kg/doyATESTOSTIERONE, a.gdyI,,-~~~~~. I: L 7 .d ,CA,*,..:.--
l~ ~~ -iIILO I0 20 30 40 0
da ys
have shown that in rats induction of AER occurs more
slowly and to a lesser extent in the portal area of the liverlobule. Statistically valid lobular analyses of AER contentof hepatocytes of the liver biopsies of this patient were notpossible because of limitations of sample size.
Conjugation of p-nitrophenol (PNP). Liver obtainedfrom the patient during L-triiodothyronine (age 132 days)and phenobarbital (age 677 days) therapy and from a 10month old girl with idiopathic hypoglycemia who had re-ceived only human growth hormone and epinephrine duringthe previous 2 months was assayed for its ability to conju-gate PNP in vitro.3 The livers were homogenized at 00Cwith two times their volume of 0.25 M sucrose in a Potter-Elvehjem homogenizer fitted with a Teflon pestle. The crudehomogenate was centrifuged at 00C and 9000 g for 15 min,and the supernatant was used as the homogenate for incuba-tions similar to those described by Isselbacher, Chrabas, andQuinn (33). Each incubation, performed in air at 370C, was2 ml in volume and contained 5 umoles of Tris buffer, pH7.4, 1.5 /Lmoles of nicotinamide adenine dinucleotide phosphate(NADP), 0.5 U of glucose-6-phosphate dehydrogenase, 20Amoles of glucose-6-phosphate, 5 /tmoles of MgCl2, 1 Amoleof uridine disphosphoglucuronic acid, 0.6 Amole of uridinediphospho-AT-acetyl glucosamine (34), 2 /Lmoles of PNP,and 0.2 ml of homogenate, the latter equivalent to 67 mgwet weight of liver. The reaction was stopped by saturationwith (NH4)2SO4 and by the addition of 2 ml of ethanol.After adjustment of the contents to 50 ml with 0.1 N NaOH,the absorbance of a filtered portion was determined at 400my (33, 34), and the quantity of unconjugated PNP remain-ing was calculated from its molar extinction coefficient of 18.
RESULTS
Effect of various hormones on serum bilirubin, con-
centration. Before the demonstration of the ability ofphenobarbital to lower the concentration of serum bili-rubin, the patient was given L-triiodothyronine (T.) for71 days and growth hormone and testosterone proprio-
3 A similar in vitro assay of the conjugation of PNP,carried out on liver obtained from the patient before anydrug or hormonal therapy (age 83 days), was technicallyunsatisfactory.
FIGURE 1 Decrease in serum bilirubinconcentration with phenobarbital therapyin two study periods. Each point repre-sents the mean of two analyses. Similarrate of decrease in concentration, c, instudies A and B are evident from theidentical slopes of the first-order plots(see Appendix I). Testosterone, in studyA, did not lower the control level or aug-ment the phenobarbital effect.
nate alone and with T3 and phenobarbital, respectively,for shorter periods (Table I, periods 2-6, 9-10, and12). These hormones failed to decrease serum bilirubinlevels.
Effect of phenobarbital on serum bilirn bin concentra-tion. The ability of sodium phenobarbital, 5 mg/kg perday, to reduce serum bilirubin concentration from ap-
proximately 20 mg/100 ml to levels of about 6 mg/100ml at two ages, is shown in Fig. 1. On both occasions,approximately 30 days of treatment were required toreach the new steady-state level. Maintenance of the de-creased serum concentration of bilirubin was inter-rupted in the first study by withdrawal of therapy, butwas maintained for the duration of our observations, a
period of 200 days after reintroducing phenobarbitaltherapy (Table I, periods 16-18). Reducing the dose ofphenobarbital to 2.5 mg and to 1 mg/kg per day for thelast 68 days of observation did not change serum bili-
20 30 40days
FIGURE 2 Increase in serum bilirubin concentration on dis-continuing phenobarbital. Each point represents the mean oftwo analyses. The absolute rate of increase in concentration,c, is similar to its rate of decrease upon initiation of pheno-barbital therapy (Fig. 1 and Appendix I).
46 J. F. Crigler, Jr. and N. I. Gold
2C
E00
Ez
Ix
a:
-j
iD-0
m
IJ
1098
7
6
BAGE 568 days (two)WT 7.5 kg
0
0.~~~
0
*f 0
0 LEVEL WITHrod PHENOBAR-
BITAL1og Canl.270-0.0127 t 3
PHENOBARBITAL, 5mg/kg/day* Ir/5
10 20 30 40 " 102

rubin concentrations (Table I, periods 17 and 18).Withdrawal of phenobarbital (Fig. 2), however, ledto a gradual increase in serum bilirubin concentrationuntil the pretreatment level was reestablished.'
4 In Fig. 2, the bilirubin concentrations of 10.5 mg/100 ml,observed for approximately 30 days before discontinuingphenobarbital administration, and of 22-24 mg/100 ml, notedafter phenobarbital withdrawal, are somewhat higher thanthose observed during the periods illustrated in Fig. 1.The difference in bilirubin concentrations is assumed to bedue to a change in the "steady-state" conditions of the
E
*0
CONTROL 1 (496 days)TOTAL POOL 2(29 ma
60 i -' III hr50 TURNOVER 34 mg/doy40
3O0
20 ¾
10 a
7 a I 1i Is I I
0 48 96 144 192 240
Serum bilirubin concentrations in Figs. 1 and 2 wereplotted logarithmically as a function of time with beststraight lines drawn by the method of least squares toobtain slopes characterizing the processes of changeduring phenobarbital administration and withdrawal.These plots serve only as a convenient means of mathe-matical description and are not meant to imply that thekinetics of this change are known to be first order. In
patient resulting from a persistent, low-grade respiratoryinfection during the interval shown in Fig. 2 (see Methods).
5040
30
20
10
8
65
R- buNTROI| L e (522 days) -
ITOTAL POOL184 mgttV2 84 hrTURNOVER 37 mg/doy
0
I -I I I I I I-0 48 96 144 192 240
hours
0I
E0l.
_j 21 1 I I ' I I I I II2 0 2 4 6 8 10 12
hours
FIGURE 3 Turnover of bilirubin-3H during two control periods. A' and B' represent ex-pansions of the early portions of A and B. Values: measured 0 0; extrapolated fromfirst-order lines ---; by difference X X. Equations (see Methods) : Control 1,v = 29e' ± 18eO 4t + 12e3 8t; Control 2, y = 30e' 08t + 16e'Iat ± 16ehlt, where y = dis-integrations per minute per microgram, and t = hour.
Bilirubin Metabolism: Effect on Phenobarbital 47
A .F^ I --- 1-0

TABLE I IEffect of Phenobarbital on Bilirubin Metabolism in an Infant Boy with Congenital, Nonhemolytic,
Unconjugated Hyperbilirubinemia and Kernicterus
Control 1 Control 2 Phenobarbital*
496 days 522 days 608 days7.3 kg 7.3 kg 7.4 kg
Distribution factors 3H 3H 3H 14C
Sertim bilirubin, mg/100 ml 20 23 6.7dpm of bilirubin administered X 10-6 5.8 5.5 11 1.83Bilirubin turnover, mg/dayj 30 37 33 31Bilirubin half-life, hr
Exponentials 1 111 84 37 392 1.5 1.6 4.2 4.83 0.18 0.17 0.40 0.48
Bilirubin poolsTotal, nmg§ 200 184 73 72Vascular, mgll 83 96 28 28Extravascular, mgT 117 88 45 44Extravasctular/vascular 1.4 0.9 1.6 1.6
Turnover constant, kt, per day** 0.15 0.20 0.45 0.43
* 5 mg/kg per day, per gastrostomy.t Total pool X 0.693/tj X 24.§ Disintegrations per minute administered/a,; a,, bilirubin specific activity at t = 0, was obtained by extrapolation of expolnen-tial 1 to t = 0.Il Serum concentration X plasma volume, the latter estimated as 5.7%O of body weight.¶ Total pool minus vascular pool.** kt = 0.693/t1 X 24 for exponential 1; kt = Xi, see text.
spite of considerable variation in the approximation ofthe data to first-order kinetics, the absolute values ofthe slopes describing the over-all rates of decrease ofserutm bilirubin on introduction of phenobarbital andof increase on withdrawal were identical (Figs. 1, 2).The equations for these lines are given in the figures,and the highly significant statistical similarity of theirslopes is shown in Appendix I.
Effect of phenobarbital on bilirubin metabolism asdetermined from studies using bilirubin-3H and biliru-bin-15C. Serum. Bilirubin specific activities as func-tions of time for both control studies (Fig. 3) and forthe phenobarbital study (Fig. 4) adhered to first-orderkinetics after 24 hr.
Controls 1 and 2. The following equations describethe serum bilirubin specific activity curves shown inFig. 3: control 1, 3 = 29e-°5 t + 18e-°456 + 12e-3.56; con-trol 2. y = 30e-0t + 16e5°436 + 16eq.t, where y = dis-integrations per minute per microgram and t = hours.The slopes of the initial portions of the control curves(Figs. 3A' and B') are similar. The early distributionand metabolism of bilirubin-3H therefore, appear to bethe same whether the labeled bilirubin is injected in abuffered aqueous solution (control 1) or in 5% humanserum albumin (control 2).
The turnover data for the control studies (Table II)showed, unexpectedly, that the higher serum concentra-
tion of unconjugated bilirubin in control 2, 23 mg/100 mlvs. 20 mg/100 ml, was associated with a significant de-crease in bilirubin half-life, 84 hr vs. 111 hr, a slightdecrease in total body bilirubin pool, 184 mg vs. 200mg, and a moderate increase in bilirubin turnover, 37mg/day vs. 30 mg/day. It is not possible to assign anysignificance to the apparent differences in the vascularand extravascular pools, expressed in Table II by theextravascular pool: vascular pool ratios. Variations be-tween the two control studies are thought to be due tobiological changes in the patient which resulted frominfection that began during the first study and per-sisted, in spite of antibiotic therapy. throughout thesecond study (see Methods).
Phenobarbital therapy. The specific activity curvesfor bilirubin-3H and bilirubin-'4C plotted in Fig. 4 aredescribed by the following equations: 3H, y = 15le°°'+ 85e-5t5' + l5le1-73t; 14C, y = 25e4°18t + 4e1"44t +25e'4 , where y = disintegrations per minute per micro-gram and t = hours. A difference in the early distribu-tion and metabolism of bilirubin-3H- and bilirubin-_4C,suggested by differences in the half-life values calculatedfrom the slopes of exponentials 2 and 3 and detectable inthe 3H/14C of sequential serum bilirubin samples andstools, was not sufficient to influence significantly theturnover and body distributions of bilirubin calculatedfrom the kinetic data for each isotope (Fig. 4, Table II).
48 J. F. Crigler, Jr. and N. I. Gold

PHENOBARBITALTREATMENT (608 days)o 3H 14CO TOTAL POOL, mg 73 72O. j t92, hr 37 39
O p TURNOVERmg/day 33 31>\sMBILIRUBIN mg/100 ml 6.7
h o u r s
B
D 0
\ Expo. I) t, -37hr
x Expo. 24 \ . tv,-4.2hr
2 | tq,2=0.40 hr
o 2l I I I I I I0 2 4 6 8
\~~~~ E c~~~~~~-
Expo.o1Fx\ t42 39 hr
\4, \ Expo. 2"I. t ,. 4.8 hr
Xx 3 x
2\g0.48 hr
I f I I I%
I0 2 4 6 8
h o u r s
FIGURE 4 Turnover of bilirubin-3H and bilirubin-14C during phenobarbital therapy.B and C are expansions of the early portions of the 3H and "4C curves, respectively,of A. Curve construction is identical with Fig. 3. Equations (see Methods): y1 (3H)= 151e-o19t + 85eol165t + 151e-1 73t; y (14C) = 25e'-l"t + 4eO-1t + 25e-1 44t.
In addition, the 3H/'4C value of bilirubin crystallizedfrom a pool of the sera was the same as that of the ad-ministered labeled bilirubins (see Methods).
The decreased mean serum bilirubin concentration,6.7 mg/100 ml, during phenobarbital administration was
accompanied by a comparable reduction in total biliru-
bin pool without a significant change in extravascularpool:vscular pool ratio or in bilirubin turnover (TableII). The change in the total body bilirubin pool, there-fore, resulted from a two- to threefold decrease in bili-rubin half-life.
Stool and urine. The rate of excretion of 3H or "C
Bilirubin Metabolism: Effect on Phenobarbital 49
IU
0'
I..
EcL
I70
K;m
0-
o
E.
5040
30
20
ICC.
U0108
6
4
2
504C
3c
2C

CONTROLS 1(-) AND2A) 80
600
b 40x30
IV
00a'O4-
0
E
06
a,
Ir0,
20
108
6
4
3
21
oN PHENOBARBITAL' ---SLOPES OF
E \ SERUM BILIRUBIN\ SPECIFIC ACTIVITY
o CURVES
' \0\* \°
* , ,,o
0 4 8 12 16 20 0 4 8 12days d oys
FIGURE 5 Rate of excretion of radioactivity in stool compared with that in serum. Eachpoint represents either total radioactivity per 3-day collection (control 1, 0 ) or persingle stool (control 2, A; phenobarbital: "4C, 0; 3H, CD) and are plotted vs. timeallowing 24 hr for transit through the intestines (measured repeatedly using carminemarkers). Slopes of serum bilirubin specific activity curves are plotted to demonstratehow closely data approach those expected under steady-state conditions.
0
0
0
T
0
a,
0.
E
06
m
60
50-6 CONTROL240 \ - -SLOPES OF
i%\ SERUMBILIRUBIN30 \ SPECIFIC ACTIVITY
2444\4 CURVES
200\*-%
10 \PH ENOBARBITAL
8-
6-
5 .4-
2a
0 2 4 6 8 10
d a y s
FIGURE 6 Rate of excretion of radioactivity in urine com-pared with that in serum. Each point represents total radio-activity from bilirubin-3H excreted per 24 hr in urine duringcontrol 2 (0) and phenobarbital (0) studies. Data forcontrol 1 were not obtained. Slopes of serum bilirubin specificactivity curves are plotted to demonstrate how closely dataapproach those expected under steady-state conditions.
in stool (Fig. 5) and 3H in urine (Fig. 6) during con-trol and phenobarbital studies was similar to the rate ofdecrease of serum bilirubin specific activities in the re-spective studies, an observation consistent with steady-state conditions. Cumulative recovery of 'H and 14Cfrom stool and urine for the three studies is shown inTable III. Most of the radioactivity, as expected, isfound in stool with only 7% of the injected dose ex-creted in urine in times equivalent to 4 or more half-lives of bilirubin. No explanation for the 48% recoveryof total radioactivity in control 1 is evident since early
TABLE IIICumulative Recovery of 3H and '4C
from Stools and Urines
Stools Urines
Cumulative CumulativePeriod of study period 3H 14C period 3H
days %of dose days %of dose
Control 1 16 48 7 3Control 2 14 73 14 7Phenobarbital* 12 84 90 7 7
* Urinary contentdetermination.
of 14C was inadequate for quantitative
50 J. F. Crigler, Jr. and N. I. Gold
1001
80170601
* 50104j
IC
30
20
040-to
E0.
xin
\ ---SLOPES OF SERUMBILIRUBIN SPECIFIC
- ACTIVITY CURVES-
A ~~~\-
A\ \
" A\
- *4%~~~\ I II
4 10
2 8x7
65
O'D
\0'
_~~~~~~~~~~~~~~~~~~~~~~~~~~~~~~~

values of serum specific activity exclude a significanterror in measuring the injected dose, and no error in theanalyses of the stool and urine radioactivity was detected.
Effect of phenobarbital on liver structure. Examina-tion of the liver biopsies obtained before and duringphenobarbital administration by light microscopy, car-ried out by Dr. Gorden Vawter, showed no significantdifferences and no pathological abnormalities. Electronmicroscopy (Fig. 7) performed by Dr. B. G. Uzman,however, revealed a marked increase in AER afterphenobarbital administration, a drug-induced change inhepatic cells described in other animal species (6, 31,32, 35, 36) but not previously documented in man.The changes in AER content of hepatocytes werereadily distinguished by blind-sorting of electron micro-graphs from specimens before vs. those during pheno-barbital therapy and were clearly evident when cellsfrom the portal area of the tissue removed during pheno-barbital therapy were compared to centrally locatedhepatocytes of the pretreatment specimen (Fig. 7 a and bvs. c and d). The latter analysis was based on studiesin rats (31, 32) which showed that phenobarbital-in-duced increases of AER occurred more slowly and to alesser extent in the portal area of the liver lobule.
Conjugation of PNP. The rate of conjugation ofPNP, presumably as glucosiduronate (33), was calcu-lated from the zero-order kinetics of the first 30 minof incubation with all three liver homogenates (Fig. 8).The number of millimicromoles of PNP conjugated pergram of wet weight of liver per minute was greatest.232, during phenobarbital administration to T.U. andlowest, 130, for T.U. when he was receiving T3 but notreceiving the barbiturate. An intermediate rate of 175was observed in P.M. who was not receiving pheno-barbital.
DISCUSSION
Attempts to alter conjugation or to affect other meta-bolic transformations of bilirubin with T3 did not re-sult in lowered serum bilirubin levels or decreased clini-cal jaundice, although observations by others (37) andby us (38) suggest that excess thyroid hormone aug-ments glucosiduronate conjugation of steroid hormonesin human beings, and neonatal hypothyroidism is knownto be associated with increased unconjugated hyperbili-rubinemia (39, 40). Human growth hormone and testos-terone propionate were given because testosterone andother anabolic steroids in some animals stimulate glu-cosiduronate formation (41) and augment the responseof enzyme systems to drugs (41-43). Serum bilirubinconcentrations of the patient, however, were not de-creased by human growth hormone or testosterone (Ta-ble I, periods 5, 6, and 12).
The detailed data on bilirubin metabolism reportedin this paper were obtained to elucidate independent
observations originally described by us (11, 12) and byYaffe et al. (14) of the ability of phenobarbital tomarkedly reduce serum bilirubin concentrations to twoinfants with congenital, nonhemolytic, unconjugatedhyperbilirubinemia. Serum bilirubin concentrations inboth infants decreased over a period of 3-4 wk to 3 and7 mg/100 ml, values approximately one-third of those ob-served before phenobarbital was begun. and returned topretreatment levels at a similar rate when the drugwas discontinued. The fall in serum bilirubin concen-tration was associated with a significant decrease inclinical jaundice, suggesting either decreased bilirubinturnover, increased fractional turnover (decreased ti),or sequestration of bilirubin in a nonvisible compartment.The reduction in serum bilirubin concentration duringphenobarbital therapy was not due to a decrease in therate of bilirubin formation since this was normal in con-trol studies and was not significantly affected by pheno-barbital (Table II) .' Although there was a slight in-crease in the proportion of total body bilirubin in theextravascular pool during phenobarbital administration(Table II), a finding which might reflect some altera-tion in the binding of bilirubin to plasma proteins (45,46), the major effect of phenobarbital was on bilirubinhalf-life which was decreased two- to threefold. Thus,phenobarbital increased the rate of removal of bilirubinfrom the body pool and, thereby, proportionally di-minished the amounts of both vascular and extravascu-lar bilirubin.
,.Seyeral Distinctive properties of the manner in whichphenobarbital lowers the serum bilirubin concentrationare evident. First, the approximately 30 days requiredto reach a new level of 5-7 mg of bilirubin per 100 mlof serum under phenobarbital treatment is several timeslonger than would be expected if the fractional turn-over rate (Xi) determined during phenobarbital adminis-tration had been established soon after introduction ofthe drug (see Appendix II). The long interval re-quired to reach the lower level of serum bilirubin con-centration appears more consistent with an action ofphenobarbital governed by a slow, rate-limiting steprather than by one involving only a rapid process suchas a change in the binding constant of albumin to bili-rubin (45, 46). Second, the rate at which the serum bili-rubin concentration increases after withdrawal of pheno-barbital is essentially the same rate at which it falls afterinitiating therapy (Figs. 1 and 2 and Appendix I).
5 Schmid and Hammaker (22), using bilirubin-'4C, havepreviously demonstrated a normal turnover of bilirubin in a41 year old boy with congenital, nonhemolytic, hyperbili-rubinemia. Since bilirubin turnover was essentially unalteredin our patient during phenobarbital treatment, it is assumedthat any increase in bilirubin production from nonerythroidsources, claimed to occur in this patient during pheno-barbital administration (44), was small in comparison tothe total bilirubin turnover.
Bilirubin Metabolism: Effect on Phenobarbital 51

*.*
6'*.'' *. N.I
h., . **,
I
I"!: <,
'4,k
*A~~~~~~~~~~~~~~A
0@0
ON
~ -
>''ck, #tI4
'A... .
iA 'A
:8
FIGURE 7 Electron micrographs of liver biopsies of patient T. U. obtained before (a and b, age 551 days) and during(c and d, age 677 days) phenobarbital administration. Black bars represent 1 A. Fig. 7a, X5800; b, X20,000; c, X5800;d, X20,000. Photomicrographs a and b, obtained before phenobarbital administration, show hepatocytes from central portionof lobule selected by trimming block after phase microscopic examination of adjacent thick section. Note large, "empty" spaces
52 J. F. Crigler, Jr. and N. I. Gold
.,K
.'4' IL It .A

10 135
X
0.;
0.
minutes
FIGURE 8 Conjugation of p-nitrophenol (PNP) by homoge-nates of liver obtained surgically from patient T. U. before(age 132 days receiving 0.075 mg/day of L-triiodothyronine[T31) and during phenobarbital (age 677 days) administra-tion and from a 10 month old girl, P. M., with idiopathichypoglycemia (control, no phenobarbital). The homogenateswere the supernatants obtained by homogenizing 1 volumeof tissue with 2 volumes of 025 M sucrose and centrifugingat 00C for 15 mmn at 9000 g. See Methods for details of theincubation. 0-0. T. U., 132 days, T3, no phenobarbital;X-x, P. M., no phenobarbital; *- *, T. U., 677 days,phenobarbital, 5 mg/kg per day. The millimicromoles ofPNP conjugated per gram of wet weight of liver per minutewas greater during phenobarbital, 232, than in the two con-trol incubations, T. U. (132 days), 130, and P. M., 175.
This suggests that the same, slow, rate-limiting stepmay also be the dominant factor in controlling the rateof increase in serum bilirubin concentration upon with-drawal of phenobarbital.
Observations in Gunn rats and in patients with con-genital nonhemolytic jaundice suggest that the elevatedlevel of serum bilirubin is the result of a deficiency inthe enzymatic system converting bilirubin to its readilyexcretable glucosiduronate (47). These considerations,together with the findings that phenobarbital and similardrugs can stimulate or induce the in vivo formation ofenzyme systems accelerating various aspects of themetabolism of drugs and hormones, including conjuga-tion as glucosiduronate (9, 10, 41, 48, 49), imply thatthe action of phenobarbital has been to induce the for-mation of a bilirubin-metabolizing enzyme system. Sucha concept is supported by the findings of Yaffe et al.(14) that phenobarbital therapy was able to return adeficient glucosiduronate-conjugating capacity for sa-licylamide to normal in their patient, and by the observa-
tions of increased AER (Fig. 7) and rate of glucosidu-ronate conjugation of PNP (Fig. 8) of liver obtainedfrom our patient during phenobarbital administration.Recently, several infants with marked congenital, non-hemolytic, unconjugated hyperbilirubinemia have beenreported to show no change in serum bilirubin concen-tration with phenobarbital treatment.6 In addition, De-Leon, Gartner, and Arias (49) have shown that ho-mozygous rats (Gunn) genetically incapable of formingbilirubin glucosiduronate have no change in bilirubin me-tabolism when phenobarbital is given in amounts suffi-cient to increase AER and to induce drug-metabolizingenzymes. The latter authors have suggested that suchdifferences in responsiveness to phenobarbital may helpdelineate the extent of the inherited deficiency ofUDPGAtransferase.
If phenobarbital has induced the formation of a bili-rubin-metabolizing enzyme system, presumably UDPGAtransferase, then we propose that the rate of increaseof serum bilirubin concentration upon phenobarbitalwithdrawal was limited by the slow rate of degrada-tion of the induced enzyme(s) (or rapid rate of degra-dation with limited capacity) (50).7 In turn, this canimply that the fall in bilirubin concentration with phe-nobarbital administration is the result of a rapidly andmaximally induced increase in a bilirubin-metabolizingenzyme characterized by a slow rate of degradation (ora rapid rate of degradation with limited capacity), thelatter being the rate-limiting reaction which makes therates of increase and decrease in serum bilirubin simi-lar. Further experimental evidence is needed to eluci-date and to establish the validity of these speculationson the mechanism of action of phenobarbital.
APPENDIX
1. Similarity in the absolute values of the slopes of Fig. 1(onset of phenobarbital therapy) to that of Fig. 2 (with-drawal of phenobarbital therapy) can be shown by thefollowing statistical evaluation:
A. Determination of the pooled residual variances aboutthe slopes of Figs. 1 a, 1 b, and 2.
[2 [Y2] - [XY]2/[X2]N -2
6 Discussion at the presentation of a portion of this work(12).
7 The turnover of phenobarbital is assumed to be rapid(51) compared to the degradation of the bilirubin-metabo-lizing enzyme system.
(G) due to partial loss of glycogen. Granular endoplasmic reticulum in the cytoplasmic aggregates in b is cut in profileor obliquely. Little agranular endoplasmic reticulum (AER) is present.
Photomicrographs c and d, obtained during phenobarbital administration, show hepatocytes from the peripheral portionof the lobule selected by trimming block after phase microscopy of adjacent thick sections. Note separation of the glycogenrosettes into small masses by a large population of agranular microsomal vesicles. Profiles of dilated granular endo-plasmic reticulum (g) are intermixed with AER.
Bilirubin Metabolism: Effect on Phenobarbital 53

where s2 = residual variance of values about a singleslope, and [y2] = 2Y2 - (2Y)2/N
[X2] = 2X2 - (2X)2/NEXY] = MXY- (IX) (2Y)/N
Y = log serum bilirubin concentration;X = days; and N = number of samples defining asingle slope.
Let subscripts a, b, and c refer to values from theFigs. 1 a, 1 b, and 2, respectively, and A, B, and C= (N - 2)s2 for the same respective figures.
Then s = N + N + N -6' where sp2 = pooled
residual variances for the three studies.B. Student's t test applied to the slopes of Figs. 1 a and 1 b.
slopes - slopeb= slope,, - +lope1, = 0.17 (P > 0.5).
v1 (i+X [x2]C )
This result indicates no significant difference betweenslopes.
C. Student's t test applied to the slopes of Fig. 2 and themean of the slopes of Figs. 1 a and 1 b.
let m = mean of Fig. 1 slope = [EX2] + [X2]b
[X2]¢E [X2] for Fig. 2.
Then t = m - (- slope.)
I 2([X2]a [X2]b+ [X2])(P > 0.1).This result indicates no significant difference betweenthe mean slope of Fig. 1 and that of Fig. 2.
II. The time required to decrease total body bilirubin pool tohalf the control value assuming that the maximum pheno-barbital effect on bilirubin half-life is induced immedi-ately can be calculated in the following manner:
Let N = bilirubin pool size at any time, t, then dN/dt= ktN + 33 (see Table II for values) where kt = 0.45/
day = turnover constant during phenobarbital therapyand 33 = bilirubin turnover in milligrams per day, avalue which was essentially unchanged by phenobarbitaltherapy.Integrate, setting N = 200 mg (control pool of bilirubin)when t = 0, to obtain the following equation:
t 1 l33 -200kt
kt 33-ktNFor N = 100 mg, half value of the control bilirubin pool,t = 3.5 days. However, from Fig. 1, about 25 days wererequired to reduce serum bilirubin concentrations (pre-sumably reflecting total body bilirubin pool) to half-value.
It, therefore, appears unreasonable to assume that bili-rubin half-life was changed immediately to the value ob-served in the kinetic study done during phenobarbitaltherapy.
ACKNOWLEDGMENTSThe authors are indebted to Dr. L. K. Diamond for theopportunity to study the patient; to Dr. B. G. Uzman, TheChildren's Cancer Research Foundation, Boston, for herkindness in preparing and commenting upon the electronmicrographs of the liver specimens; to Dr. G. F. Vawter,
Department of Pathology, The Children's Hospital MedicalCenter, Boston, for comments on liver histology by lightmicroscopy; to Prof. T. Colton, Department of PreventiveMedicine, Harvard Medical School, for his guidance in thestatistical evaluation of the rate of change in serum bili-rubin concentrations, Appendix I; to Dr. S. H. Robinson,Beth Israel Hospital, Boston, for a contribution of bili-rubin-"C; and to Drs. S. H. Robinson and R. Lester,Department of Medicine, Boston University School of Medi-cine, for constructive discussion. Human growth hormonewas obtained from the National Pituitary Agency, Baltimore,Md. Wewish, especially, to express our gratitude to the staffof the Clinical Research Center for the superb care thepatient received during the prolonged hospitalization requiredfor the study.
This work was supported by grants AM-08365, FR-05482,and FR-00128 from the National Institutes of Health, U. S.Public Health Service, Bethesda, Md., and the John A.Hartford Foundation, New York.
REFERENCES
1. Conney, A. H., and J. J. Burns. 1962. Factors influ-encing drug metabolism. In Advances in Pharmacology.S. Garattini and P. A. Shore, editors. Academic PressInc., New York. 1: 31.
2. Gillette, J. R. 1963. Metabolism of drugs and other for-eign compounds by enzymatic mechanisms. In Progressin Drug Research. E. Jucker, editor. Birkhduser Verlag,Basel. 6: 13.
3. Gillette, J. R. 1966. Biochemistry of drug oxidation andreduction by enzymes in hepatic endoplasmic reticulum.In Advances in Pharmacology. S. Garattini and P. A.Shore, editors. Academic Press Inc., New York. 4: 219.
4. Remmer, H. 1965. The fate of drugs in the organism. InAnnual Review of Pharmacology. W. C. Cutting, R. H.Dreisbach, and H. W. Elliott, editors. Annual ReviewsInc., Palo Alto. 5: 405.
5. Conney, A. H. 1965. Enzyme induction and drug toxicity.In Drugs and Enzymes. Proceedings of the Second Inter-national Pharmacology Meeting. B. B. Brodie and J. R.Gillette, editors. Pergamon Press Ltd., Oxford. 4: 277.
6. Fouts, J. R., and L. G. Hart. 1965. Hepatic drugmetabolism during the perinatal period. Ani. N. Y. Acad.Sci. 123: 245.
7. Catz, C., and S. J. Yaffe. 1962. Pharmacologic modifica-tion of bilirubin conjugation in the newborn. Amer. J.Dis. Child. 104: 516.
8. Arias, I. M., L. Gartner, M. Furman, and S. Wolfson.1963. Effect of several drugs and chemicals on hepaticglucuronide formation in newborn rats. Proc. Soc. Exp.Biol. Med. 112: 1037.
9. Burns, J. J., S. A. Cucinell, R. Koster, and A. H. Con-ney. 1965. Application of drug metabolism to drugtoxicity studies. Anm. N. Y. Acad. Sci. 123: 273.
10. Conney, A. H., K. Schneidman, M. Jacobson, and R.Kuntzman. 1965. Drug-induced changes in steroid me-tabolism. Ann. N. Y. Acad. Sci. 123: 98.
11. Crigler, J. F., Jr., and N. I. Gold. 1966. Sodium pheno-barbital-induced decrease in serum bilirubin in an infantwith congenital non-hemolytic jaundice and kernicterus.J. Clin. Invest. 45: 998.
12. Crigler, J. F., Jr., and N. I. Gold. 1967. Effect of sodiumphenobarbital on the metabolism of bilirubin-8H and "Cin an infant with congenital non-hemolytic jaundice andkernicterus. J. Clin. Invest. 46: 1047.
13. Burstein, S., and E. L. Klaiber. 1965. Phenobarbital-induced increase in 6p-hydroxycortisol excretion: clue to
54 1. F. Crigler, Jr. and N. I. Gold

its significance in human urine. J. Clin. Endocrinol. Metab.25: 293.
14. Yaffe, S. J., G. Levy, T. Matsuzawa, and T. Baliah. 1966.Glucuronide-conjugating capacity in a hyperbilirubinemicinfant due to apparent enzyme induction by pheno-barbital. N. Engl. J. Med. 275: 1461.
15. Wallace, G. B., and J. S. Diamond. 1925. The significanceof urobilinogen in the urine as a test for liver functionwith a description of a simple quantitative method for itsestimation. Arch. Intern. Med. 35: 698.
16. Malloy, H. T., and K. A. Evelyn. 1937. Determination ofbilirubin with the photoelectric colorimeter. J. Biol.Chem. 119: 481.
17. Kingsley, G. R. 1939. The determination of serum totalprotein, albumin, and globulin by the biuret reaction.J. Biol. Chem. 131: 197.
18. Gornall, A. G., C. J. Bardawill, and M. M. David. 1949.Determination of serum proteins by means of the biuretreaction. J. Biol. Chem. 177: 751.
19. Gellis, S. S., and D. Y.-Y. Hsia. 1955. Liver functiontests in infants and children. In Pediatric Clinics ofNorth America. Symposia on unusual infections ofchildhood; laboratory tests and special procedures. W. B.Saunders Company, Philadelphia. 177.
20. Bodansky, A. 1933. Phosphatase studies. II. Determina-tion of serum phosphatase. Factors influencing theaccuracy of the determination. J. Biol. Chem. 101: 93.
21. Schmid, R., and L. Hammaker. 1963. Metabolism anddisposition of C"-bilirubin in congenital nonhemolyticjaundice. J. Clin. Invest.42: 1720.
22. Wilzbach, K. E. 1957. Thitium-labeling by exposure oforganic compounds to tritium gas. J. Amer. Chem. Soc.79: 1013.
23. Clarke, J. T. 1965. Purification and analysis of bilirubin.Clin. Chem. 11: 681.
24. Ostrow, J. D., L. Hammaker, and R. Schmid. 1961.The preparation of crystalline bilirubin-C". J. Clin. In-vest. 40: 1442.
25. Weber, A. Ph., and L. Schalm. 1962. Quantitativeseparation and determination of bilirubin and conj u-gated bilirubin in human serum. Clin. Chim. Acta. 7: 805.
26. Okita, G. J., J. J. Kabara, F. Richardson, and G. V.Leroy. 1957. Assaying compounds containing H3 and C".Nucleonics. 15: 111.
27. Oliverio, V. T., C. Denham, and J. D. Davidson. 1962.Oxygen flask combusion in the determination of C"and H' in biological materials. Anal. Biochem. 4: 2054.
28. Conway, W. D., A. J. Grace, and J. E. Rogers. 1966.Simplification of oxygen-flask combustion procedure forpreparation of samples for liquid scintillation counting.Anal. Biochem. 14: 491.
29. Solomon, A. K. 1960. Compartmental methods of kineticanalysis. In Mineral Metabolism. C. L. Comar and F.Bronner, editors. Academic Press Inc., New York. IA:138.
30. Uzman, B. G., G. E. Foley, S. Farber, and H. Lazarus.1966. Morphologic variations in human leukemic lympho-blasts (CCRF-CEM cells) after long-term culture andexposure to chemotherapeutic agents. Cancer. 19: 1725.
31. Burger, P. C., and P. B. Herdson. 1966. Phenobarbital-induced fine structural changes in rat liver. Amer. J.Pathol. 48: 793.
32. Becker, F. F., and B. P. Lane. 1968. Regeneration ofthe mammalian liver. VI. Retention of phenobarbital-induced cytoplasmic alterations in dividing hepatocytes.Amer. J. Pathol. 52: 211.
33. Isselbacher, K. J., M. F. Chrabas, and R. C. Quinn. 1962.The solubilization and partial purification of a glucuronyl
transferase from rabbit liver microsomes. J. Biol. Chem.237: 3033.
34. Pogell, B. M., and L. F. Leloir. 1961. Nucleotide activa-tion of liver microsomal glucuronidation. J. Biol. Chem.236: 293.
35. Jones, A. L., and D. W. Fawcett. 1966. Hypertrophy ofthe agranular endoplasmic reticulum in hamster liverinduced by phenobarbital (with review on the functionsof this organelle in liver). J. Histochem. Cytochem. 14:215.
36. Orrenius, S., J. L. E. Ericsson, and L. Ernster. 1965.Phenobarbital-induced synthesis of the microsomal drug-metabolizing enzyme system and its relationship to theproliferation of endoplasmic membranes. J. Cell Biol.25: 627.
37. Brown, H., E. Englert, and S. Wallach. 1958. Metabo-lism of free and conjugated 17-hydroxycorticosteroidsin subjects with thyroid disease. J. Clin. Endocrinol.Metab. 18: 167.
38. Gold, N. I., and J. F. Crigler, Jr. 1963. Influence ofL-triiodothyronine on steroid hormone metabolism: Stud-ies in a patient with adrenal hyperplasia (Cushing'sSyndrome). J. Clin. Endocrinol. Metab. 23: 156.
39. Akerren, Y. 1954. Prolonged jaundice in the newbornassociated with congenital myxedema. Acta Paediat.Scand. 43: 411.
40. MacGillivray, M. H., J. D. Crawford, and J. S. Robey.1967. Congenital hypothyroidism and prolonged neonatalhyperbilirubinemia. Pediatrics. 40: 283.
41. Inscoe, J. K., and J. Axelrod. 1960. Some factors affect-ing glucuronide formation in vitro. J. Pharmacol. Exp.Ther. 129: 128.
42. Quinn, G. P., J. Axelrod, and B. B. Brodie. 1958.Species, strain and sex differences in metabolism of hexo-barbitone, amidopyrine, antipyrine, and aniline. Biochem.Pharmacol. 1: 152.
43. Booth, J., and J. R. Gillette. 1962. The effect of anabolicsteroids on drug metabolism by microsomal enzymes inrat liver. J. Pharmacol. Exp. Ther. 137: 374.
44. Robinson, S. H., R. Lester, J. F. Crigler, Jr., and M.Tsong. 1967. Early-labeled peak of bile pigment in man;studies with glycine-"C and delta-aminolevulinic acid-3H.N. Engl. J. Med. 277: 1323.
45. Odell, G. B. 1959. Dissociation of bilirubin from albuminand its clinical implications. J. Pediat. 55: 268.
46. Ostrow, J. D., and R. Schmid. 1963. Protein-binding of"C-bilirubin in human and murine serum. J. Clin. Invest.42: 1286.
47. Schmid, R. 1966. Hyperbilirubinemia. In The MetabolicBasis of Inherited Disease. J. B. Stanbury, J. B. Wyn-gaarden, and D. S. Frederickson, editors. McGraw-Hill Book Company, New York. 2nd edition. 871.
48. Zeidenberg, P., S. Orrenius, and L. Ernster. 1967. In-crease in levels of glucuronylating enzymes and associatedrise in activities of mitochondrial oxidative enzymesupon phenobarbital administration in the rat. J. CellBiol. 32: 528.-
49. DeLeon, A., L. M. Gartner, and I. M. Arias. 1967. Theeffect of phenobarbital on hyperbilirubinemia in glu-curonyl transferase deficient rats. J. Lab. Clin. Med. 70:273.
50. Schimke, R. I. 1966. Studies on the roles of synthesisand degradation in the control of enzyme levels in ani-mal tissues. Bull. Soc. Chim. Biol. 48: 1009.
51. Lous, P. 1954. Plasma levels and urinary excretion ofthree barbituric acids after oral administration to man.Acta Pharmacol. Toxicol. 10: 147.
lilirubin Metabolism: Effect on Phenobarbital 55