Effect of Sodium Dodecyl Sulfate - The Journal of General Physiology
14
THE ACTION OF SODIUM DODECYL SULFATE ON THE CHLOROPHYLL-PROTEIN COMPOUND OF THE SPINACH LEAF* B~¢ EMIL L. SMITH** (From the Laboratory of Biophysics, Columbia University, New York, and the Molteno Institute, University of Cambridge, England) (Received for publication, December 19, 1940) I INTRODUCTION Evidence has been presented that in the green leaf chlorophyll is bound to protein by true chemical linkage (Smith, 1941). In order to elucidate additional properties of this compound, the effect of sodium dodecyl sulfate was studied. Sreenivasaya and Pirie (1938) demonstrated that the tobacco mosaic virus protein is split by sodium dodecyl sulfate into fragments of smaller size than the initial virus preparation, and at the same time, the nucleic acid is separated from the protein. Anson (1939) observed that various detergents including some which contain sodium dodecyl sulfate denature hemoglobin and egg albumin. Keilin and Hartree (1940) found that cytochrome c is reversibly changed by sodium dodecyl sulfate ap- parently affecting the linkage of the heine group to the protein since the absorption spectrum is modified. II Effect of Sodium Dodecyl Sulfate When a solution of sodium dodecyl sulfate (SDS) I is added to an alkaline leaf extract, every trace of opalescence disappears and a briUiantly clear green solution is obtained. SDS thus has a similar action to digitonin or bile salts (Smith, 1941), but differs from these in its much greater effective- ness. The SDS clarified preparations show a clear red fluorescence which appears to be greater than that of the untreated leaf extract, but have a * Part of this work has already been presented in a preliminary communication (Smith, 1940 a). ** John Simon Guggenheim Memorial Fellow (1938-1940). 1 The SDS used in these experiments was part of a gift to Professor D. Keilin from Imperial Chemical Industries. 583 The Journal of General Physiology on April 11, 2019 jgp.rupress.org Downloaded from http://doi.org/10.1085/jgp.24.5.583 Published Online: 20 May, 1941 | Supp Info:
Transcript of Effect of Sodium Dodecyl Sulfate - The Journal of General Physiology
THE ACTION OF SODIUM DODECYL SULFATE ON THE CHLOROPHYLL-PROTEIN COMPOUND OF THE
SPINACH LEAF*
B~¢ EMIL L. SMITH**
(From the Laboratory of Biophysics, Columbia University, New York, and the Molteno Institute, University of Cambridge, England)
(Received for publication, December 19, 1940)
I
INTRODUCTION
Evidence has been presented that in the green leaf chlorophyll is bound to protein by true chemical linkage (Smith, 1941). In order to elucidate additional properties of this compound, the effect of sodium dodecyl sulfate was studied. Sreenivasaya and Pirie (1938) demonstrated that the tobacco mosaic virus protein is split by sodium dodecyl sulfate into fragments of smaller size than the initial virus preparation, and at the same time, the nucleic acid is separated from the protein. Anson (1939) observed that various detergents including some which contain sodium dodecyl sulfate denature hemoglobin and egg albumin. Keilin and Hartree (1940) found that cytochrome c is reversibly changed by sodium dodecyl sulfate ap- parently affecting the linkage of the heine group to the protein since the absorption spectrum is modified.
II
Effect of Sodium Dodecyl Sulfate When a solution of sodium dodecyl sulfate (SDS) I is added to an alkaline
leaf extract, every trace of opalescence disappears and a briUiantly clear green solution is obtained. SDS thus has a similar action to digitonin or bile salts (Smith, 1941), but differs from these in its much greater effective- ness. The SDS clarified preparations show a clear red fluorescence which appears to be greater than that of the untreated leaf extract, but have a
* Part of this work has already been presented in a preliminary communication (Smith, 1940 a).
** John Simon Guggenheim Memorial Fellow (1938-1940). 1 The SDS used in these experiments was part of a gift to Professor D. Keilin from
Imperial Chemical Industries.
583
The Journal of General Physiology
on April 11, 2019jgp.rupress.org Downloaded from http://doi.org/10.1085/jgp.24.5.583Published Online: 20 May, 1941 | Supp Info:

584 A C T I O N O F S O D I U ~ D O D E C Y L S U L F A T E
much smaller fluorescence than an equivalent concentration of free chioro- phyll in acetone or ether.
The most striking action of the SDS is that in addition to clarifying the solution, magnesium is eliminated from the chlorophyll converting it to phaeophytin. The reaction is extremely rapid in weakly acid solutions
/.O
\
~ d
t~4t
~O
1, l/
FIG. 1. The absorption spectra of the chloroplast pigment in SDS solutions at pH 8.90 (Curve a) and pH 5.30 (Curve b). In the short wave region of the spectrum, the curves have been plotted at a tenth of the measured density values. The data are given in Table I.
and takes place slowly in more alkaline solutions. This change is apparent by the striking color change from the original brilliant green first to an olive green and finally to a yellow or brown depending on the concentration of the pigment. In Fig. 1 are shown the absorption spectra of two solutions identical in all respects except that a was buffered at pH 8.9 and b at pH 5.3. The spectrum of the alkaline solution was measured immediately after addition of the SDS. No significant change occurred during the course of the measurements. After addition of the SDS solution to the acid buffered

~. T.. s~trrr 585
solution (b), it was allowed to stand overnight to permit the reaction to go to completion.
The spectrum of the chlorophyll-protein compound even in the alkaline SDS solution shows striking changes. The maximum of the main red band which is at 678 in the leaf extract is shifted to 670 m~t. The prominent bands in the blue at 470 and 437 mg are reduced in the SDS treated solution to slight inflections, as the entire curve appears to rise towards a maximum in the ultraviolet.
The spectrum of the acid SDS solution is plotted on the same density scale as the alkaline one. I t shows a decided decrease in density at the red maximum which remains at 670 mg, a pronounced shift of the entire blue absorption region towards the ultraviolet, and the appearance of three new absorption bands at 610, 540, and 510 m#. The absorption minima are at 632.5, 583, 527.5, and 490 mg. The actual measurements of both spectra are given in Table I. Comparison of the acid spectrum with the absorption spectrum of phaeophytin a in dioxane (Stern and Wenderlein, 1936) shows that phaeophytin, the magnesium-free derivative of chlorophyll, has been formed. In dioxane, the band maxima are from 1 to 5 mg further towards the blue end of the spectrum than for the pigment in aqueous solution.
Ultrafiltration of a clarified extract through a 3 per cent Bechold collodion membrane or dialysis does not result in any loss of chiorophyll or carotenoid pigment showing that these pigments remain attached to large molecules. After prolonged dialysis against alkaline buffer solutions, the SDS may be nearly completely removed. The solution remains clear. The pigment and protein are precipitated by acidifying with dilute acetic acid, and can be redissolved with alkali. The complex is precipitated from solution by a tenth saturation with ammonium sulfate. This precipitate cannot be re- dissolved in water or neutral buffer, but is readily dissolved in SDS solution. The low concentration of salt required and its subsequent insolubility indi- cate that the protein is denatured by SDS. This is true for the protein compound whether the prosthetic group is phaeophytin or chlorophyll. No separation of the pigment from the protein can be obtained by fractional precipitation.
SDS readily dissolves the protein denatured by boiling. However, in these preparations, phaeophytin is formed much more rapidly than in control preparations buffered at the same pH. In one experiment, two 3 ml. samples of a leaf extract were strongly buffered at pH 8. One was boiled for 5 minutes, cooled to room temperature, and 1 ml. of 5 per cent SDS added to both solutions. In the boiled solution, phaeophytin formation

586 ACTION OF SODIUM DODECYL SULFATE
w a s c o m p l e t e in less t h a n 3 hours , whi le t he con t ro l so lu t ion s t i l l showed
some g reen color a n d i n c o m p l e t e p h a e o p h y t i n f o r m a t i o n a f t e r 20 hours .
TABLE I The Effect of Sodium Dodecyl Sulfate on the A bsorption Spectrum of the Chloroplast Pigment.
Data of Fig. 1 Measurements were made with the spectrophotometer of Shlaer (1938).
m~
750 740 730 720 710 700 690 685 680 675 672 671 670 669 668 665 660 650 640 635 632.5 630 625 620 612 610 608 600 590 585 583 580 570
Density a t pH 8.90
0.0244 0.0260 0.0244 0.0260 0.0319 0.0462 0.1327 0.2369 0.4116 0.5855 0.6426
0.6712 0.6712 0.6695 0.6375 0.5158 0.3721 0.2545
0.2302 0.2302 0.2302
0.2134
0.1873 0.1722
0.1537 0.1336
Density at pH 5.30
0.0052 0.0088 0.0096 0.0116 0.0152 0.0216 0.0576 0.1156 0.2508 0.4172 0.4744 0.4848 0.4872 0.4848
0.4232 0.3312 0.1636 0.0944 0.0840 0.0824 0.0840
0.1108 0.1308 0.1320 O. 1304 0.0984 0.0664 0.0616 0.0604 0.0624 0.0784
560 550 542 541 540 538 530 527.5 525 520 511 510 509 500 495 490 485 480 475 470 465 460 455 45O 445 44O 435 430 425 420 415 410
Density a t pH 8.90
0.1168 0.1127
0.1151
0.1134
0.1268
0.1772
0.3066
0.5359
0.7619
0.8854
0.9408
1.1567
1.4860
1.5750
1.7302
1.8287
Density at pH 5.30
0.0964 0.1220 0.1612 0.1628 0.1628 0.1600 0.1304 0.1284 0.1288 0.1372 0.1612 0.1616 0.1612 0.1436 0.1316 0.1276 0.1320 0.1404 0.1480 0.1592 0.1808 0.2324 0.3188 0.4304 0.5684 0.6768 0.6904 0.7612 0.9280 1.0836 1,1252
T h i s sugges t s t h a t t h e a c t i o n of t he S D S t a k e s p l ace a t s eve ra l d i f fe ren t
l i n k a g e s in t h e c h l o r o p h y l l - p r o t e i n c o m p o u n d . A n s o n has shown t h a t
D u p o n o l W A , wh ich cons is t s m o s t l y of SDS , r e a d i l y d e n a t u r e s h e m o g l o b i n
w i t h l i b e r a t i o n of s u l f h y d r y l g roups . S i m i l a r l y i t a p p e a r s t h a t S D S de-

E. L. s~a_IT~r 5 8 7
natures the chlorophyll-protein compound splitting linkages which facilitates the removal of magnesium from the molecule. When denaturation is first accomplished by heating, the magnesium is rapidly removed.
I t should be emphas ized t h a t SDS removes m a g n e s i u m f rom the
ch lorophyl l -pro te in c o m p o u n d in neu t ra l and in s l ight ly alkaline solutions.
Here tofore , acid has been used to remove m a g n e s i u m f rom chlorophyl l
dissolved in organic solvents. SDS is w i thou t effect on ch lorophyl l dis-
solved in acetone. M a g n e s i u m is r e m o v e d b y SDS f rom colloidal
ch lorophyl l suspended in neu t ra l solut ions b u t a t a slower ra te t h a n f r o m
the ch lorophyl l -pro te in compound .
III
Kinetics
1. Methods and Procedure.--All of the measurements were made with unpurified extracts of spinach leaves prepared as already described (Smith, 1941). The conversion of the pigment from chlorophyll to phaeophytin is readily observed spectrophotometri- eally because of the pronounced differences in the absorption spectra of the two pigments. The changes were followed at three separate wave lengths: at 670 m#, the principal maximum in the red where a large decrease in density takes place (Fig. 1), similarly at 610 m~, the maximum of a phaeophytin absorption band; and at 540 m# where an in- crease in density takes place and a new absorption band appears. The measurements were made using the sensitive photoelectric spectrophotometer of Shlaer (1938).
Mter several preliminary experiments, all of the experiments were carried out over a period of 6 days on a single extraction which was kept in the refrigerator; no sensible change occurred in the extract during this period. Measurements were made at five pH values and at six different concentrations of sodium dodecyl sulfate, making ten runs in all since one run served for both series. The experiments of both series were made in random order.
The procedure was as follows: A sample of the extract was removed from the refrigera- tor and allowed to come to room temperature. To 0.5 ml. of extract were added 1.0 ml. of the appropriate sodium phosphate buffer (in one experiment sodium acetate buffer was used), a quantity of water where it was necessary to bring the solution to the final volume of 3 ml., and finally the sodium dodecyl sulfate solution. The final buffer concentrations were always tenth molar. The solution was mixed rapidly and pipetted into an absorption cell of 5 nun. optical thickness. Measurements were then carried out as rapidly as possible at the three wave lengths. In all cases, the pI-I of a sample of the reaction mixture was measured with the glass electrode. The measurements were made at room temperature (22-24°C.).
2. Effect o/p// .--The change in density at 670 m# at different pH's is shown in Fig. 2 and the data are given in Table II. For the data of pH 7.96, the correct time values are twice those in the figure. I t is apparent that there is a large change in the rate of the reaction depending on the pH of the solution. At pH 7.96 nearly 5 hours (294 min.) are required for haft

588 ACTION OF SODIUm DODECYL SULFATE
Og
0.7 v A
I I e ~ 4 6 e 6..0,5 ® ~ ' 0 • 6 6 8 o ~ .96
0 ~'0 I00 150 ~00
Ti l ~ e -- l'~ iOl l tes
FIo. 2. Density changes at 670 m# in solutions of different pH. For the data of pH 7.96 the plotted time values should be doubled. The numerical values are in Table II .
0.I~"
f
. . ~ " • ~0,~"
" o 7 9 6
0 ~ 0 I 0 0 ISO
Ti t~e .--. t~ i~ qtes FIo. 3. Density changes at 540 m# in solutions of different pH. For the data of
pH 7.96 double the plotted time values. The data are given in Table I I I .
v.. L. SMITH 589
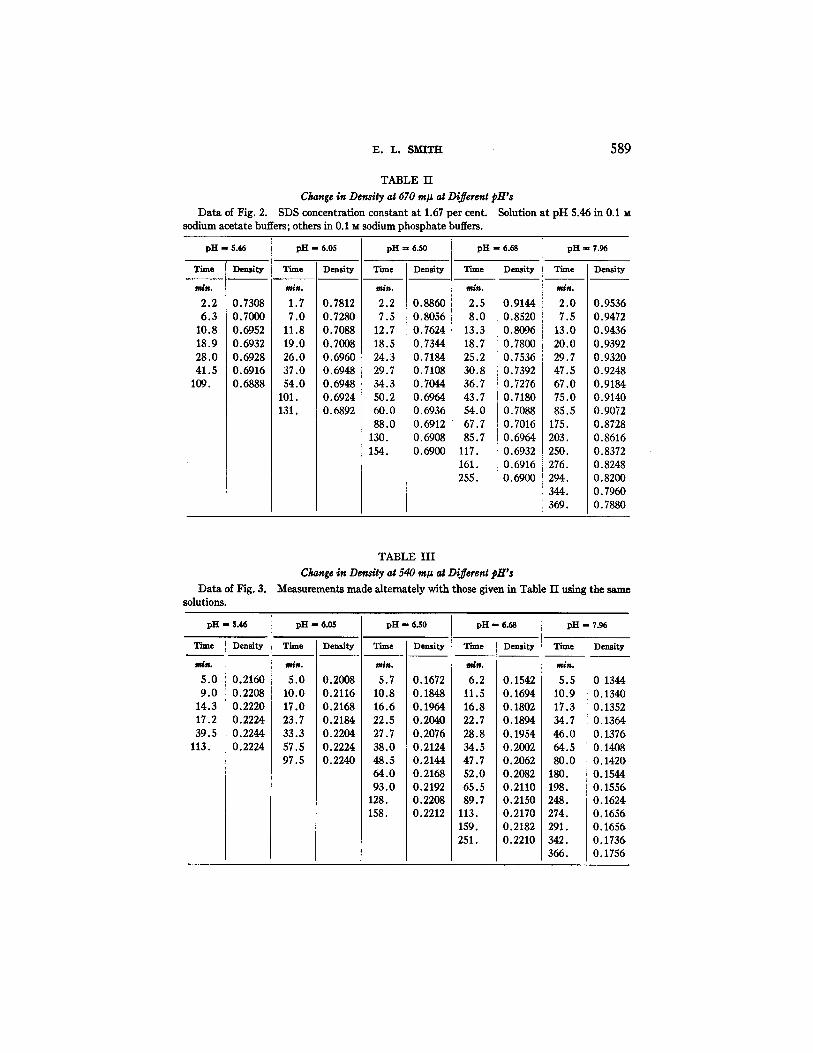
TABLE H
Change in Density at 670 ra# at Different pH's Data of Fig. 2. SDS concentration constant at 1.67 per cent. Solution at pH 5.46 in 0.1 M
sodium acetate buffers; others in 0.1 M sodium phosphate buffers.
p H - 5.46
Time Density
m/s.
2.2 0.7308 6.3 0.7000
10.8 0.6952 18.9 0.6932 28.0 0.6928 41.5 0.6916
109. O. 6888
p H - 6.05
T ~ e
1. 7.
11. 19. 26. 37. 54.
101. 131.
Density
O. 7812 0.7280 O. 7088 0.7008 0.6960 O. 6948 0.6948 0.6924 0.6892
pH ~ 6.50
Time Density
m/n.
2.2 0.8860 7.5 O. 8056
12.7 O. 7624 18.5 O. 7344 24.3 0.7184 29.7 0.7108 34.3 0.7044 50.2 0.6964 60.0 O. 6936 88.0 0.6912
130. O. 6908 154. 0.6900
p H - 6.68
rain.
2.5 8.0
13.3 18.7 25.2 30.8 36.7 43.7 54.0 67.7 85.7
117. 161. 255.
Density
0.9144 0.8520 0.8096 0.7800 0.7536 0.7392 0.7276 0.7180 0.7088 0.7016 0.6964 0.6932 0.6916 0.6900
pH - 7.96
Tilne
m/n.
2.0 7.5
13.0 20.0 29.7 47.5 67.0 75.O 85.5
175. 203. 250. 276. 294. 344. 369.
Density
0.9536 0.9472 0.9436 0.9392 0.9320 0.9248 0.9184 0.9140 0.9072 O.8728 0.8616 0.8372 0.8248 0.8200 0.7960 0.7880
Data of Fig. 3. solutions.
TABLE H I
Change in Density at 540 m# at Different pH's Measurements made alternately with those given in Table I I using the same
pH R 5.46 pH -- 6.05 pH - 6.50 pH - 6.68 pH - 7.96
Time Density Time Density
m/m.
5.0 0.2160 9.0 0.2208
14.3 0.2220 17.2 0.2224 39.5 0.2244
113. 0.2224
Time Density
mls.
5.0 0.2008 10.0 0.2116 17.0 0.2168 23.7 0.2184 33.3 0.2204 57.5 0.2224 97.5 O. 2240
Time Density
5.7 0.1672 10.8 0.1848 16.6 0.1964 22 .,5 0.2040 27.7 0.2076 38.£ 0.2124 48.5 0.2144 64.£ 0.2168 93.¢ 0.2192
128. 0.2208 158. 0.2212
Time Density
mi~.
6.2 0.1542 11.5 0.1694 16.8 0.1802 22.7 0.1894 28.8 O. 1954 34.5 O. 2002 47.7 O. 2062 52.0 0.2082 65.5 0.2110 89.7 0.2150
113. 0.2170 159. 0.2182 251. 0.2210
5. 10. 17. 34. 46. 64. 80.
180. 198. 248. 274. 291. 342. 366.
0 1344 O. 1340 O. 1352 O. 1364 O. 1376 0.1408 O. 1420 O. 1544 O. 1556 O. 1624 O. 1656 O. 1656 O. 1736 O. 1756
590 ACTION O F S O D I U M D O D E C Y L SULFATE
of the total density change. On the other hand, at pH 5.46 the reaction is practically complete in 10 minutes. I t has not been feasible to measure the rate in more acid solutions because of the time required for mixing and transferring the solutions to the spectrophotometer.
In Fig. 3 and Table I I ! are presented the data which were obtained on the same solutions at 540 m#. The character of the data is exactly the same as those at 670 m# except that they show an increase in density instead of a decrease. The precision of the measurements with the spectrophotom- eter used is well illustrated by these data since the density changes at this
-!
- - . . l J
-:N
K i l l / la "~"
l
i
A i i c
i INI i
, I 6 7 8
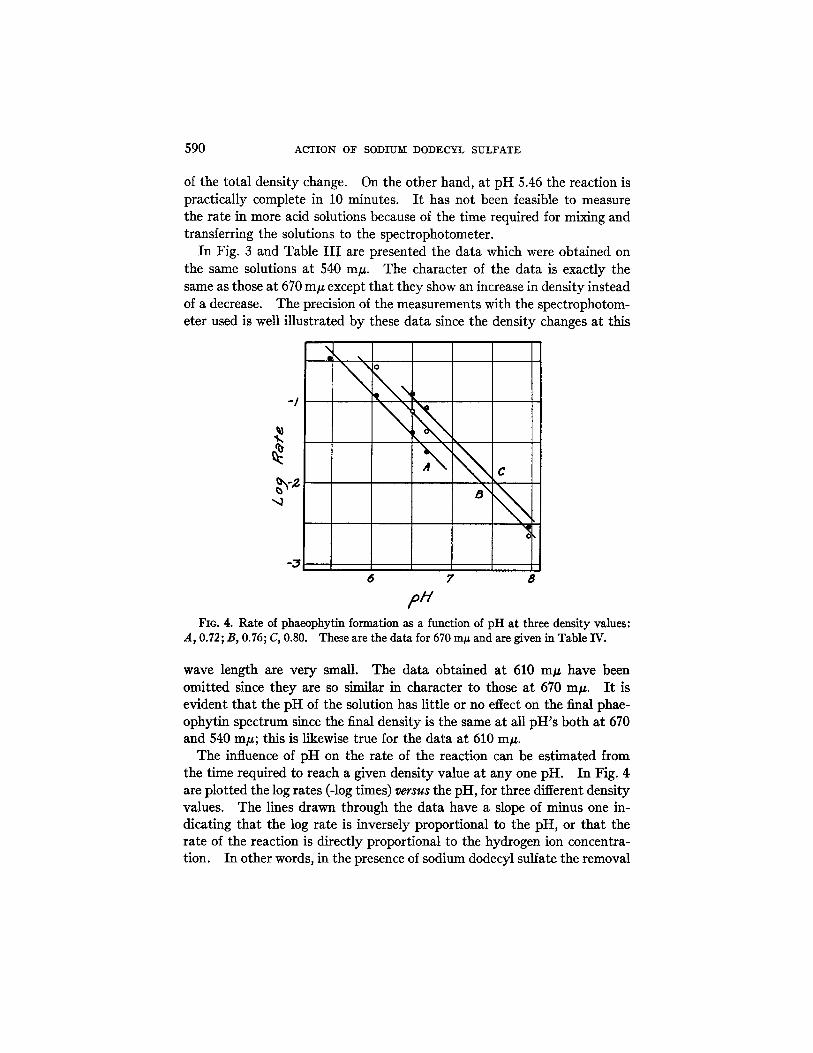
,oh, FIG. 4. Rate of phaeophytin formation as a function of pH at three density values:
A, 0.72; B, 0.76; C, 0.80. These are the data for 670 mp and are given in Table IV.
wave length are very small. The data obtained at 610 m# have been omitted since they are so similar in character to those at 670 m#. I t is evident that the pH of the solution has little or no effect on the final phae- ophytin spectrum since the final density is the same at all pH's both at 670 and 540 mtz; this is likewise true for the data at 610 m/~.
The influence of pH on the rate of the reaction can be estimated from the time required to reach a given density value at any one pH. In Fig. 4 are plotted the log rates (-log times) versus the pH, for three different density values. The lines drawn through the data have a slope of minus one in- dicating that the log rate is inversely proportional to the pH, or that the rate of the reaction is directly proportional to the hydrogen ion concentra- tion. In other words, in the presence of sodium dodecyl sulfate the removal

~ . L. S ~ a T ~ 5 9 1
of magnesium of the chloroplast pigment appears to be influenced by a simple hydrogen ion catalysis. The data in Fig. 4 are given in Table IV together with the data obtained from the measurements at 540 m#. The effect of hydrogen ion concentration is identical at the three measured wave lengths.
3. Effect of Sodium Dodecyl Sulfate Concentration.--In Fig. 5 and Table V are presented the data obtained for the change in density at 670 m#. The
TABLE IV
Rate of Plu~ophytin Formation As a Function of pH The data of 670 m/~ are shown graphically in Fig. 4. These values were obtained by inter-
polation from the measurements given in Tables II and III. The value in brackets was ob- tained by extrapolation.
Wave length
m/z
670
540
pH
5.46 6.05 6.50 6.68 7.96
Density~0.7200
Time --log t ime
rain.
2.7 --0.431 8.4 --0.924
24.0 -- 1.380 41.4 --1.617
Density =0.2200
Densi ty ~ 0.7600
Time --log time
rain.
3 .7 --0.568 13.1 --1.117 23.3 --1.367
[440.1 [--2.644]
Densi ty = 0.1700
Density ** 0.800
Time --log t ime
rain.
8.0 --0.903 15.0 --1.176
340. --2.532
Time
rain.
5.46 8.2 6.05 30.8 6.50 105. 6.68 217. 7.96
--log tlme Time --log time
--0.914 --1.489 --2.021 --2.337
6.3 11.7
314.
--0.799 -- 1.068 --2.497
plotted time values should be doubled for the data at the lowest SDS con- centration (0.0209 per cent). The solutions were all buffered at pH 6.50. The curves show a marked effect of SDS concentration when the concen- tration is low. With these solutions there was no noticeable difference in character or rate of clarification of the solutions. When SDS was added to make the final concentration 0.01 per cent, or half that of the lowest concentration given in Fig. 5, no clarification of the solution was obtained. I t was not possible to measure this solution spectrophotometrically. There seems to be a fairly abrupt transition below the least effective concentration of SDS indicating a threshold effect.
Relative rates of phaeophytin formation as a function of SDS concentra-

0 9
~ o~
i )
] \ I
I o O . ~ O g • 0 . 0 0 ~
, i • 0 .167" • a 3 ~
o 0 . . 6 6 7 ® / . 6 7 '
11_
o.71 .~_-.-.. ,~+ "~. r - - ~.
i
0 50 /0O 15"0
7"i~e - ~i~ute+~ FzG. 5. Density changes at 670 m# at different SDS concentrations, and at a constant
pH of 5.50. For the data of 0.0209 per cent SDS, the correct time values are twice those plotted. The data are given in Table V.
O C
-10 / o / _ • •
/ / _
/2 / - + p' Q
,-+ ///, / # ~ / / / /
°/j -z~ 7
- l , 5 " - l O - 0 ~ 0 . 0
/.o7 ,S'L~O Colic.
FxG. 6. Rate of phaeophytin formation as a function of SDS concentration at three different density values: A, 0.80; B, 0.75; C, 0.72. The data are given in Table VI.
592
:E. L. SMITH 593
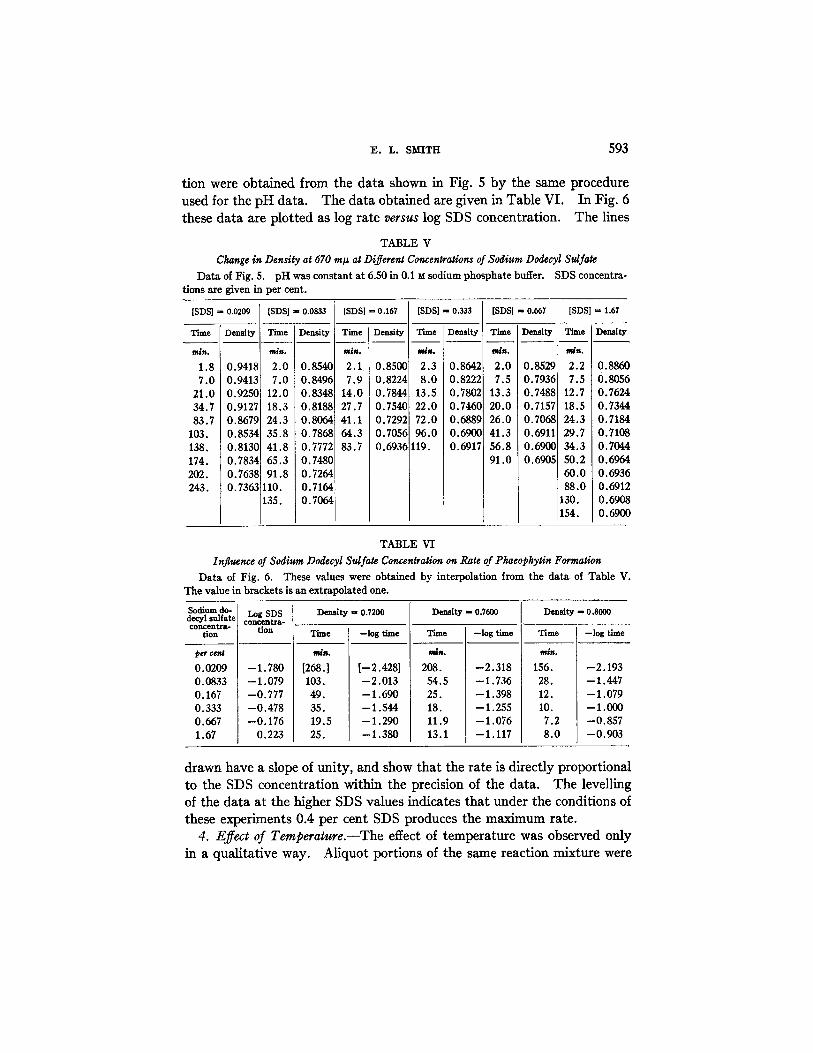
tion were obtained from the data shown in Fig. 5 by the same procedure used for the pH data. The data obtained are given in Table VI. In Fig. 6 these data are plotted as log rate versus log SDS concentration. The lines
TABLE V
Ckange in Density at 670 m# at Different Concentrations of Sodium Dodecyl Sulfate Data of Fig. 5. pH was constant at 6.50 in 0.1 M sodium phosphate buffer. SDS concentra-
tions are given in per cent.
[SDS] -- 0.0209
Time Density
rolls.
1.8 0.9418 7.0 0.9413
21.0 0.925C 34.7 0.9127 83.7 0.8679
103. 0.8534 138. 0.813C 174. 0.7834~ 202. 0.7638! 243. 0.7363!
[SDS] ~ 0.0833
Time Density
mln.
2.0 0.854C 7.0 0.8496
12.0 0.8348 18.3 0.8188 24.3 0.8064 35.8 0.7868 41.8 0.7772 65.3 0.7480 91.8 0.7264
110. 0.7164 135. 0.7064
[SDS] s 0.167
Time Density
mtn.
2.1 0.8500 7.9 0.8224
14.0 0.7844 27.7 0.7540 41.1 0.7292 64.3 0.7056 83.7 0.6936
[SDS] = 0.333
"r~ine
2.3 8.0
13.5 22.0 72.0 96.0
119.
Density
0.8642 0.8222 0.7802 0.7460 0.6889 0.6900 0.6917
[SDS] - 0.667
Time
f~N.
2.0 7.5
13.3 20.0 26.0 41.3 56.8 91.0
Density
0.8529 0.7936 0.7488 0.7157 0.7068 0.6911 0.6900 0.6905
[SDS] = 1.67
Time Densil
mln.
2.2 0.886 7.5 0.805
12.7 0.762 18.5 0.734 24.3 0.71~ 29.7 0.71( 34.3 0.704 50.2 0.69~ 60.0 0.69~ 88.0 10.691
130. 0.69( 154. O. 69(
TABLE VI
Influence of Sodium Dodecyl Sulfate Concentration on Rate of Pkaeopkytin Formation Data of Fig. 6. These values were obtained by interpolation from the data of Table V.
The value in brackets is an extrapolated one.
Sodium do- Density m 0.7200 Density -- 0.7600 Density ~ 0.8000 decyl sulfate concentra-
tion --log time
0.0209 0.0833 0.167 0.333 0.667 1.67
Log SDS [
- 1 . 780 --1.079 -0 .777 -0 .478 -0 .176
0.223
Time -log time
mln.
[268.] [--2.428] 103. --2.013
--1.690 --1.544 --1.290 --1.380
Time --|ogtlme
~dn.
208. --2.318 54.5 --1.736 25. --1.398 18. --1.255 11.9 --1.076 13.1 --1.117
49. 35. 19.5 25.
Ti me
mln.
156. 28. 12. 10. 7.2 8.0
- - 2 . 1 9 3
--1.447 --1.079 --1.000 --0.857 --0.903
drawn have a slope of unity, and show that the rate is directly proportional to the SDS concentration within the precision of the data. The levelling of the data at the higher SDS values indicates that under the conditions of these experiments 0.4 per cent SDS produces the maximum rate.
4. Effect of Temperature.--The effect of temperature was observed only in a qualitative way. Aliquot portions of the same reaction mixture were

594 ACTION 0]~ SODIUM DODECYL SULFATE
taken, exposed to different temperatures, and the color changes of the solutions observed visually. Temperature has an extremely large effect on the rate of the reaction. For the region between 20 and 30°C., the Q~0 may be as high as 4 or 5. The high temperature coefficient may be only the usual high Q~0 for protein denaturation since prior denaturation by boiling increases the rate of SDS action as described in Part II of this paper.
IV
DISCUSSION
The experiments of ultrafiltration, dialysis, and fractional precipitation show that the prosthetic group remains attached to the protein regardless of the presence or absence of magnesium in the molecule. This has been confirmed by an ultracentrifugal study of the solutions which showed in addition that the protein is split into particles of low molecular weight (Smith, 1940 b; Smith and Pickels, 1941). The action of SDS on the chlorophyll-protein compound differs from its action on the virus of tobacco mosaic disease; in the latter case, Sreenivasaya and Pirie showed not only a splitting of the protein, but also a separation of the prosthetic group (nu- cleic acid) from the protein.
The effect of SDS on cytochrome c (Keilin and Hartree) shows some similarity to the present experiments. Here also the prosthetic group remains attached to the protein, and it is the linkage of the metal, iron, which is apparently modified. However, with cytochrome c the effect was found to be reversible on removal of the SDS, while with the chlorophyll- protein compound, no reversal could be obtained.
The effect of pH shows that the lability of the magnesium atom is in- creased by the splitting and denaturing action of the SDS, and that it may not be the SDS itself which causes the removal of the metal. This is similar to the effect found by Inman and Crowell (1939) who observed that when trypsin is allowed to act on a leaf extract, the formation of phaeophytin by acid is enhanced. Nevertheless, when the chlorophyll- protein compound is split by digitonin or bile salts, no phaeophytin forma- tion takes place even at pH 4.5. I t appears that the SDS attacks different linkages in the molecule than those affected by digitonin or bile salts.
Since phaeophytin remains attached" to the protein, it seems as though magnesium can play little part in binding the prosthetic group to the smaller protein units. On the other hand, the change in the spectrum produced by SDS at pH 9.0 indicates some modification, unless this effect can be ascribed wholly or in part to the solvent action of the SDS. The chlorophyll groups are probably oriented to the hydrophobic part of the SDS molecule

~. T.. s~o~ 595
dissolving the chlorophyll in what may be considered an organic solvent. This may explain the shift of the red band from 678 m# to 670 m#, and also the modification of the absorption spectrum in the blue where the caro- tenoids as well as the chlorophyll would tend to disperse in the paraffin groups of the SDS.
It is too early to speculate much concerning the exact linkage of the chlorophyll to the protein. Linkages appear to be possible through the formyl group of chlorophyll b, the vinyl group, the labile hydrogen atoms of Stoll, and the magnesium. From the SDS action, it seems likely that the magnesium plays no r61e in binding chlorophyll to the smaller protein fragments, although it may be concerned in binding the intact molecule. This is indicated by the extreme lability of the magnesium in the presence of SDS and its stability in the presence of other detergents which also split the protein.
SIYM~A.R¥
1. Sodium dodecyl sulfate (SDS) attacks the chlorophyll-protein com- pound modifying its protein properties and absorption spectrum.
2. In the presence of SDS, chlorophyll is quantitatively converted to phaeophytin; i.e., magnesium is removed from the molecule. This reaction, measured spectrophotometrically, proceeds at a rate directly proportional to the hydrogen ion concentration. At constant pH, the rate is propor- tional to the SDS concentration until a maximum rate is achieved.
3. The chlorophyll or phaeophytin (depending on the pH) remains attached to the protein, since the prosthetic group cannot be separated by ultrafiltration, dialysis, or fractional precipitation.
4. This suggests that the magnesium plays no part in binding chlorophyll to the split protein fragments, but may be concerned in binding the larger units, since the metal becomes extremely labile when the protein is split.
BIBLIOGRAPHY
Anson, M. L., The denaturation of proteins by synthetic detergents and bile salts, J. Gen. Physiol., 1939, 23, 239.
lnman, O.L., and Crowell, M.L., Condition of chlorophyll in the leaf, Plant Physiol., 1939, 14, 388.
KeUin, D., and tX~rtree, E. F., Properties of cytochrome c, Nature, 1940, 145, 934. Shlaer, S., A photoelectric transmission spectrophotometer for the measurement of
photosensitive solutions, J. Opt. Soc. America, 1938, 23, 18. Smith, E. L., Chlorophyll as the prosthetic group of a protein in the green leaf, Science,
1940 a, 91, 199. Smith, E. L., An ultracentrifugal study of the action of some detergents on the chloro-
phyll-protein compound of spinach, Am. J. Physiol., 1940 b, 129,466.

596 ACTION 0]? SODIUM DODECYL SULFATE
Smith, E. L., The chlorophyll-protein compound of the green leaf, Y. Gen. Physiol., 1941, P/t~ 565.
Smith, E. L., and Pickels, E. G., The effect of detergents on the chlorophyll-protein compound of spinach as studied in the ultracentrifuge, unpublished.
Sreenivasaya, M., and Pirie, M. W., The disintegration of tobacco mosaic virus prepa- rations with sodium dodecyl sulphate, Biochem. ]., London, 1938, 32, 1707.
Stern, A., and Wenderlein, H., l~ber die Lichtabsorption der Porphyrine. IV, Z. phys. Chem., 1936, Abt. A, 175, 405.