Effect of sliding friction on gear noise based on a ... et al... · Effect of sliding friction on...
12
Effect of sliding friction on gear noise based on a refined vibro-acoustic formulation Song He a) , Rajendra Singh b) and Goran Pavić c) (Received: 3 January 2008; Revised: 5 May 2008; Accepted: 5 May 2008) An improved source-path-receiver model of a single mesh geared system is developed and validated to quantify the effect of sliding friction between gear teeth on the structure-borne whine noise. The source sub-system of a spur gear pair predicts interfacial bearing forces in the line-of-action and off line-of-action directions for two whine excitations (static transmission error and sliding friction). Next, a finite element model of the gearbox with embedded bearing stiffness matrices is developed to characterize the structural paths and to calculate the surface velocity distributions. Predictions are first validated by comparing with structural modal tests and transfer function measurements from gear mesh to the housing plates. Radiated noise is then estimated by using two approximate methods, namely the Rayleigh integral method and a substitute source technique. The overall vibro-acoustic model is validated by comparing radiated sound pressure calculations with measured noise data over a range of operating torques. The proposed formulation provides an efficient analytical and computational tool to quantify the relative contribution of sliding friction to the structure-borne noise, which is found to be significant when the transmission error is minimized say via tooth modifications. © 2008 Institute of Noise Control Engineering. Primary subject classification: 11.1.3; Secondary subject classification: 75 1 INTRODUCTION Most gear noise researchers 1–3 have assumed that the static transmission error (STE) is the main source of whine (steady state noise at gear mesh frequencies and side-bands). Consequently, transmission errors are minimized in a methodical manner via tooth modifica- tions. However, high precision gears are still noisy in many applications. One plausible explanation is that the sliding friction becomes a potential noise source, especially in spur gears at certain torques or tribologi- cal conditions 4–7 . Accordingly, we consider two concur- rent excitations, namely the unloaded static transmis- sion error and sliding friction, to a geared system, as shown in Fig. 1. Objectives of this article are: (1) Develop a refined source-path-receiver model that characterizes the structural paths in two directions; also, propose analytical and efficient computational tools to predict noise radiated from the gearbox panels. (2) Quantify the relative contributions of transmission error versus sliding friction noise to the overall whine noise, and validate predictions of the structural transfer functions and sound pressure with measurements for one example case (NASA gearbox with spur gears). 2 LITERATURE REVIEW AND PROBLEM FORMULATION The literature on the vibro-acoustic models of the entire geared system 2,3,8 is rather sparse. For the inter- nal geared system, only a few investigators have incor- porated the torsional and translational motions in both line-of-action (LOA) and off line-of-action (OLOA) directions 4–7 although many lumped parameter models have been developed over the last four decades 1–3 . The vibration transmission path through bearings has been well described by the stiffness matrix that was analyti- cally formulated by Lim and Singh 9 . Rook and Singh 10 analyzed the gearbox using the mobility synthesis method and derived a procedure of calculating narrow- band vibratory power flows, which recognizes rolling a) Acoustics and Dynamics Laboratory, The Ohio State Uni- versity, 201 West 19th Avenue, Columbus OH 43210 USA; email: [email protected] b) Acoustics and Dynamics Laboratory, The Ohio State Uni- versity, 201 West 19thAvenue, Columbus OH 43210 USA; email: [email protected] c) Laboratoire Vibrations Acoustique, Institut National des Sciences Appliquées de Lyon, Bâtiment Saint-Exupéry, 25 bis, avenue Jean Capelle, F-69621 Villeurbanne Cedex FRANCE; email: [email protected] 164 Noise Control Eng. J. 56 (3), May-June 2008
Transcript of Effect of sliding friction on gear noise based on a ... et al... · Effect of sliding friction on...
Effect of sliding friction on gear noise based on a refined vibro-acousticformulation
Song Hea), Rajendra Singhb) and Goran Pavićc)
(Received: 3 January 2008; Revised: 5 May 2008; Accepted: 5 May 2008)
An improved source-path-receiver model of a single mesh geared system isdeveloped and validated to quantify the effect of sliding friction between gearteeth on the structure-borne whine noise. The source sub-system of a spur gearpair predicts interfacial bearing forces in the line-of-action and off line-of-actiondirections for two whine excitations (static transmission error and slidingfriction). Next, a finite element model of the gearbox with embedded bearingstiffness matrices is developed to characterize the structural paths and tocalculate the surface velocity distributions. Predictions are first validated bycomparing with structural modal tests and transfer function measurementsfrom gear mesh to the housing plates. Radiated noise is then estimated by usingtwo approximate methods, namely the Rayleigh integral method and asubstitute source technique. The overall vibro-acoustic model is validated bycomparing radiated sound pressure calculations with measured noise data overa range of operating torques. The proposed formulation provides an efficientanalytical and computational tool to quantify the relative contribution of slidingfriction to the structure-borne noise, which is found to be significant when thetransmission error is minimized say via tooth modifications. © 2008 Institute ofNoise Control Engineering.
Primary subject classification: 11.1.3; Secondary subject classification: 75
1 INTRODUCTION
Most gear noise researchers1–3 have assumed that thestatic transmission error (STE) is the main source ofwhine (steady state noise at gear mesh frequencies andside-bands). Consequently, transmission errors areminimized in a methodical manner via tooth modifica-tions. However, high precision gears are still noisy inmany applications. One plausible explanation is thatthe sliding friction becomes a potential noise source,especially in spur gears at certain torques or tribologi-cal conditions4–7. Accordingly, we consider two concur-rent excitations, namely the unloaded static transmis-sion error and sliding friction, to a geared system, asshown in Fig. 1. Objectives of this article are: (1)
a) Acoustics and Dynamics Laboratory, The Ohio State Uni-versity, 201 West 19th Avenue, Columbus OH 43210 USA;email: [email protected]
b) Acoustics and Dynamics Laboratory, The Ohio State Uni-versity, 201 West 19th Avenue, Columbus OH 43210 USA;email: [email protected]
c) Laboratoire Vibrations Acoustique, Institut National desSciences Appliquées de Lyon, Bâtiment Saint-Exupéry, 25bis, avenue Jean Capelle, F-69621 Villeurbanne CedexFRANCE; email: [email protected]
164 Noise Control Eng. J. 56 (3), May-June 2008
Develop a refined source-path-receiver model thatcharacterizes the structural paths in two directions;also, propose analytical and efficient computationaltools to predict noise radiated from the gearbox panels.(2) Quantify the relative contributions of transmissionerror versus sliding friction noise to the overall whinenoise, and validate predictions of the structural transferfunctions and sound pressure with measurements forone example case (NASA gearbox with spur gears).
2 LITERATURE REVIEW AND PROBLEMFORMULATION
The literature on the vibro-acoustic models of theentire geared system2,3,8 is rather sparse. For the inter-nal geared system, only a few investigators have incor-porated the torsional and translational motions in bothline-of-action (LOA) and off line-of-action (OLOA)directions4–7 although many lumped parameter modelshave been developed over the last four decades1–3. Thevibration transmission path through bearings has beenwell described by the stiffness matrix that was analyti-cally formulated by Lim and Singh9. Rook and Singh10
analyzed the gearbox using the mobility synthesismethod and derived a procedure of calculating narrow-band vibratory power flows, which recognizes rolling

element bearings as a multi-dimensional compliant anddissipative connection. Moreover, the vibration behav-ior of the gearbox housings has been examined byusing finite element analysis (FEA)11,12, experimentalmodal analysis13 and statistical energy analysis(SEA)14 methods. For instance, Lim and Singh11 devel-oped a finite element model of flexible casing to predictbearing and mount transmissibilities in a simple gearedsystem. Van Roosmalen12 reported that the naturalfrequencies from a finite element analysis correlatedwell with modal tests for a simple gearbox at lowerfrequencies. Lim and Singh14 developed a twosub-system SEA model which included an analyticaldescription of the coupling loss factor associated withthe vibration transmission through rolling elementbearings.
To predict sound radiation from the gearbox, priorresearchers have relied on either simple radiationefficiency models or large scale numerical codes (suchas the boundary elements). However, a combination offinite and boundary element models often requiresextensive computational time while yielding minimalinsight. Jacobson et al.15 predicted the radiationefficiency of a gearbox plate using ideal radiators likemonopole, dipole, cylinder and the like but achievedlimited success when compared with in-situ radiationmeasurements. Such simplified models yield onlyglobal trends and do not adequately describe the modalradiation characteristics of a gearbox. Kartik andHouser16 proposed a semi-empirical frequency-response based model to predict noise radiation fromgearbox housings with a multi-mesh gear set. Also,they utilized the broad-band radiation efficiency modelof a rectangular plate; again their model yields onlybroad trend over a range of gear mesh frequencies.Recently, Singh et al.17 developed a semi-empiricalmodel for predictions of the radiated whine noise bycombining a linear time-invariant model of the internal
Fig. 1—Vibro-acoustic model of a simplifiedgeared system with two excitations at thegear mesh, structure-borne paths throughbearings and then radiation from thegearbox. Here, LOA is the line-of-actionand OLOA is the off-line-of-action.
Noise Control Eng. J. 56 (3), May-June 2008
geared system with measured vibro-acoustic transferfunctions of the structural paths (from gear/pinionmotions in two directions to the radiated sound). Theyalso found that the friction force dictates the OLOAdynamics and it significantly influences the maximumforce in the LOA direction. Overall, the abovementioned studies do not provide a tractable analyticalor computational vibro-acoustic system model and allhave included only the transmission error as the sourceexcept Singh et al.17 who included sliding friction aswell. We propose to overcome this deficiency in ourarticle though we focus on a single mesh spur gear setin a simple gearbox.
In our formulation (as conceptually shown in Fig. 1),the pinion and gear of the internal spur gear pairsub-system are modeled as rigid disks, and the elasticdeformations of the shaft and bearings are modeledusing lumped elements. Vibratory angular motions aresmall in comparison to the mean motion, and the meanload is assumed to be high such that the dynamic loadis not sufficient to cause tooth separations18; this leadsto a linear time-varying system formulation. Thoughboth excitations are interrelated, they are assumed to bemost dominant in LOA and OLOA directions, respec-tively. Hence, only corresponding structural paths inthese two directions are considered by neglecting themoment transfer elements in the bearing stiffnessmatrices. Also, by assuming the housing mass is muchlarger than the gears and shafts, an impedancemismatch is created with a rigid boundary condition atthe bearing location2. Thus, the internal geared systemcould be modeled separately and its resulting forcedresponse provides force excitations to the structuralpaths. Further, we analytically or numerically describethe entire system model, unlike Kartik and Houser16 orSingh et al.17, who included empirical transferfunctions. Finally, for the sake of illustration, we applyour formulation to the NASA test facility gearbox13
and it is assumed that the top plate is the main radiatordue to its relatively high mobility as well as the way itis constructed.
3 SOURCE SUB-SYSTEM MODEL WITHTWO EXCITATIONS
The source sub-system is described by a recentlydeveloped 6DOF, linear time-varying spur gear pairmodel19 that incorporates the sliding friction and realis-tic mesh stiffness, which is calculated by an accuratefinite element/contact mechanical code20. Rigidbearings are assumed as boundary conditions due to theimpedance mismatch at the interface of shafts andbearings. Overall, the system formulations are summa-rized as follows. The governing equations for thetorsional motions � �t� and � �t� of pinion and gear are:
p g165

Jp�p�t� = Tp + �i=0
n
Xpi�t�Fpfi�t� − �i=0
n
rbpNpi�t� �1�
Jg�g�t� = − Tg + �i=0
n
Xgi�t�Fgfi�t� + �i=0
n
rbgNgi�t� �2�
where n=floor��� in which the “floor” function roundsoff the contact ratio � to the nearest integer (towards alower value); Jp and Jg are the polar moments of inertiaof the pinion and gear; Tp and Tg are the external andbraking torques; rbp and rbg are base radii of the pinionand gear; and, Npi�t� and Ngi�t� are the normal loadsdefined as follows:
Npi�t� = Ngi�t� = ki�t��rbp�p�t� − rbg�g�t� + xp�t� − xg�t��
+ ci�t��rbp�p�t� − rbg�g�t� + xp�t� − xg�t�� �3�
where ki�t� and ci�t� are the realistic mesh stiffness andviscous damping profiles; xp�t� and xg�t� denote theLOA displacements of pinion and gear centers. Thesliding friction forces Fpfi�t� and Fgfi�t� as well as theirmoment arms Xpi�t� and Xgi�t� of the ith meshing pairare derived as:
Fpfi�t� = µi�t�Npi�t� , �4a�
Fgfi�t� = µi�t�Ngi�t� �4b�
Xpi�t� = LXA + �n − i�� + mod��prbpt,�� , �5a�
Xgi�t� = LYC + i� − mod��grbgt,�� �5b�
where the sliding friction is formulated by µi�t�=µ0sgn�mod��prbpt ,��+ �n− i��−LAP�; � is the basepitch; “sgn” is the sign function; the modulus functionmod�x ,y�=x−y · floor�x /y�, if y�0; �p and �g are thenominal speeds (in rad/s); and, LAP, LXA and LYC aregeometric length constants19. The governing equationsfor xp�t� and xg�t� motions in the LOA direction are:
mpxp�t� + 2�pSx�KpSxmpxp�t� + KpSxxp�t� + �
i=0
n
Npi�t� = 0
�6�
mgxg�t� + 2�gSx�KgSxmgxg�t� + KgSxxg�t� + �
i=0
n
Ngi�t� = 0
�7�
Here, mp and mg are the masses of the pinion andgear; KpSx and KgSx are the effective shaft stiffnessvalues in the LOA direction, and �pSx and �gSx are thedamping ratios. Likewise, the translational motionsy �t� and y �t� in the OLOA direction are governed by:
p g166 Noise Control Eng. J. 56 (3), May-June 2008
mpyp�t� + 2�pSy�KpSympyp�t� + KpSyyp�t� − �
i=0
n
Fpfi�t� = 0
�8�
mgyg�t� + 2�gSy�KgSymgyg�t� + KgSyyg�t� − �
i=0
n
Fgfi�t� = 0
�9�
Finally, the dynamic forces at the bearings are as:
FpBx�t� = − KpSxxp�t� − 2�pSx�KpSxmpxp�t� ,
�10a�
FpBy�t� = − KpSyyp�t� − 2�pSy�KpSympyp�t� ,
�10b�
FgBx�t� = − KgSxxg�t� − 2�gSx�KgSxmgxg�t� ,
�11a�
FgBy�t� = − KgSyyg�t� − 2�gSy�KgSymgyg�t� .
�11b�
Both LOA and OLOA bearing forces are predictedfor the example case (unity-ratio NASA spur gear pairwith tip relief) with parameters of the pinion/gear givenas follows19: number of teeth=28; outsidediameter=3.738 in; root diameter=3.139 in; diametralpitch=8 in−1; center distance=3.5 in; pressureangle=20°; face width=0.25 in; tooththickness=0.191 in; and elastic modulus=30�106 psi.Predictions are then converted from time domain intofrequency domain by using the fast Fourier transform(FFT) analysis method; comparisons at the first threegear mesh frequencies are given in Fig. 2 over a rangeof the pinion torque Tp. Observe that the frictiondominated OLOA dynamic responses are less sensitiveto a variation in Tp. Dynamic interactions between thesliding friction and profile modifications (embedded inthe effective mesh stiffness k) may be analyzed infuture work21.
4 STRUCTURAL PATHS ANDCONTRIBUTION FROM SLIDINGFRICTION
4.1 Bearing and Housing Models
Predicted bearing forces by the source sub-systemprovide excitations to the multi-input, multi-output(MIMO) structural paths for the gearbox of Fig. 3(a).Force excitations are coupled at each bearing via a stiff-ness matrix �K�Bm (of dimension 5) that is calculated byusing the algorithm proposed by Lim and Singh9.Nominal shaft loads and bearing preloads are assumed

to ensure a time-invariant �K�Bm. In order to focus onthe transmission error and sliding friction paths in theLOA and OLOA directions respectively, �K�Bm is inten-tionally reduced into a 2 by 2 matrix by neglecting themoment transfer terms10 and assuming that no axialforce is generated by the spur gear sub-system. Calcu-lated nominal bearing stiffness elements9 are KBx
=KBy=2.8�106 lb/ in at the mean operating condition;these are much larger than the shaft stiffness of 1.29�105 lb/ in. This confirms the impedance mismatchassumption made regarding the shaft/bearing interface.
The implementation of �K�Bm into the finite elementgearbox model of Fig. 3(b) requires specialattention11,22. At high excitation (mesh) frequencies(say up to 5 kHz), the geometric dimensions of thebearings are comparable to the plate flexuralwavelength. Hence the holes may significantly alter the
Fig. 2—Dynamic bearing forces predicted under arange of Tp given �p=4875 RPM and140 °F. (a): LOA bearing force; (b)OLOA bearing force. Key: m is the gearmesh frequency index. Key: �—, m=1; �—,m=2; �—, m=3.
Noise Control Eng. J. 56 (3), May-June 2008
plate dynamics and such effects must be modeled22. Arigid (with Young’s modulus 100 times the casing steel)and massless beam element (with density 1% of thecasing steel) is used to model the interface from shaftto the bearings. Only a small beam is selected in orderto ensure that none of the beam resonances is found inthe frequency range of interest. The shaft (beam)element is connected to the central bearing nodethough orthogonal foundation stiffness elements (KBx
and KBy) in the LOA and OLOA directions, respec-tively. The central node is then connected to thecircumferential bearing nodes by 12 rigid and masslessbeams (one at each rolling element’s angular position)which form a “star” configuration, such that the
Fig. 3—(a) Schematic of the NASA gearbox; (b)Finite element model of the NASA gear-box with embedded bearing stiffness ma-trices.
167

displacement of the plate around the bearing hole areequal to the “housing node” at the center.
4.2 Experimental Studies and Validation ofStructural Model
The finite element model of Fig. 3 is created byusing I-DEAS23 for the NASA gearbox with bearingholes, embedded stiffness matrices �K�Bm, stiffeningplates as well as clamped boundary conditions at fourrigid mounts. Although the internal sub-system withgear pair and shafts is not included, it has been shown11
that an “empty” gearbox tends to describe the globaldynamics of the entire system. Table 1 confirms that thenatural frequencies predicted by the finite elementmodel correlate well with measurements reported byOswald et al.24 despite minor structural modificationsmade to the gearbox. Mode shape predictions alsomatch well with modal tests; Fig. 4 gives a typicalcomparison of structural mode at the 8th naturalfrequency �fn=2962 Hz�.
In order to validate the structural paths, severaltransfer functions were measured for the NASAgearbox by assuming that the quasi-static systemresponse is similar to the response under non-resonantrotating conditions. The gearbox was modified to allowcontrolled excitations to be applied to the gear-meshand measured25. Brackets were welded to the bedplateof the gear-rig to mount shakers in the LOA and OLOAdirections outside the gearbox, as shown in Fig. 5(a).Stinger rods were connected from the shakers throughtwo small holes in the gearbox and attached to a collaron the input shaft. Two mini accelerometers werefastened to a block behind the loaded gear tooth tomeasure the LOA and OLOA mesh accelerations.Band-limited random noise signals were then used asexcitation signals and tests were done with only oneshaker activated at a time with a 600 lb-in static
Table 1—Comparison of measured natural fre-quencies and finite element predictions ofthe NASA gearbox24.
Gearbox modeindex
Measurements24
(Hz)Finite element
predictions (Hz)1 658 6502 1049 9883 1709 18594 2000 19405 2276 23286 2536 25667 2722 27628 2962 2962
168 Noise Control Eng. J. 56 (3), May-June 2008
preload (design load for the gears). Dynamic responseswere measured to generate vibro-acoustic transferfunctions. Sensor # 1 of Fig. 5(a) is a tri-axial acceler-ometer mounted on the output shaft bearing cap tomeasure the LOA, OLOA, and axial vibrations. Sensors#2 and #3 are unidirectional accelerometers mountedon the top and back plates, respectively.
The transfer function of the combined source-pathsub-systems is predicted as:
HS−P��� = HS��� · HP��� = HS��� ·Yplate���
Ybearing����12a�
Yplate��� =Vplate���
Fbearing���, �12b�
Ybearing��� =Vbearing���
Fbearing����12c�
where Yplate��� and Ybearing��� are the transfer anddriving point mobilities for the (top) plate and thebearing; these are derived from the finite elementmodel of the gearbox by using the modal expansionmethod with 1% structural damping for all modes.
Further, HS��� is the motion transmissibility from gearmesh to translational bearing responses (in LOA orOLOA direction) by using the 8DOF lineartime-invariant spur gear model17,25. Note that such alumped model is insufficient to capture the bending andflexural modes of the gear blanks and shafts. Figure5(b) shows that the measured motion transmissibility(OLOA direction) from gear mesh to the bearing
compares well with predicted �HS���� based on thelinear time-invariant model25. In Fig. 5(c), the predicted
motion transmissibility �HS−P���� from gear mesh tothe top plate correlates reasonably well with measure-ment given the complexity of the system. The highestfrequency is chosen such that the shortest wave-lengthis 4 times larger than the model element dimension onthe top plate. Recall that interactions between the shaftand bearings/casing were neglected in our model byimposing the impedance mismatch condition. Conse-quently, an empirical weighting function
20 log10 �W��� � =10 dB is added (uniformly over the
entire frequency range) to “tune” the �HP���� predic-tion in Fig. 5(c) for better comparison. Further work isneeded to quantify this effect; Karthik and Houser16
had also noted this issue.

4.3 Comparison of Structural Paths in LOAand OLOA Directions
First, assume that (i) the bearing forces predicted bythe source model19 are in phase at either bearing endfor the pinion (or gear) shaft; (ii) the bearing forces ofpinion and gear are same in magnitude but opposite indirections due to the symmetry of unity ratio gear pair.Second, the overall structural paths are derived for the
Fig. 4—Comparison of one elastic deformation moresult24; (b) finite element prediction.
Noise Control Eng. J. 56 (3), May-June 2008
transmission error controlled LOA (or x) path and thefriction dominated OLOA (or y) path in terms of the
combined (effective) transfer mobilities Ye,x��� and
Ye,y���:
Ye,x��� = �n
Wp,x,nYp,x,n��� − �n
Wg,x,nYg,x,n���
�13a�
f the gearbox (at 2962 Hz): (a) modal experiment
de o169

Ye,y��� = �n
Wp,y,nYp,y,n��� − �n
Wg,y,nYg,y,n���
�13b�
where W is the empirical weighting function (10 dBapplied over the spectrum); and the subscript n is theindex of the two ends of pinion/gear shafts. Figure 6
compares the magnitudes of Ye,x��� and Ye,y��� at thesensor location on the top plate. Different peaks areobserved in the LOA and OLOA paths spectra. Thisimplies that at certain frequencies (e.g. 650 and1700 Hz), the OLOA path (and thus the frictionaleffects) could be dominant over the LOA path (and thusthe transmission error effects) given comparable forceexcitation levels. The proposed method thus providesan efficient tool to quantify and evaluate the relativecontribution of structural path due to sliding friction.
500 1000 1500 2000 2500 3000 3500-80
-60
-40
-20
0
20
40
Frequency (Hz)
|H|OLOA(dB)
(b)
500 1000 1500 2000 2500 3000 3500-60
-40
-20
0
20
40
Frequency (Hz)
|H|topplate(dB)
(c)
(a)
Fig. 5—(a) Experiment used to measure the struc-tural transfer functions; (b) Comparisonof the transfer function magnitudes fromgear mesh to bearings; (c) Comparison ofthe transfer function magnitudes fromgear mesh to a sensor on the top plate(gearbox). Key: —, measurements; �, pre-dictions, —.
170 Noise Control Eng. J. 56 (3), May-June 2008
The top plate velocity distribution Vtop��� could then
be predicted by using Eqn. (14), where Fp,B,x��� and
Fp,B,y��� are the pinion bearing forces predicted by thesource model in the LOA and OLOA directions. Figure7(a) shows the surface interpolated velocity distribu-tions on the top plate, as define below, at three meshharmonics �m=1,2 ,3� given Tp=500 lb-in and �p
=4875 RPM:
Vtop��� =1
2Fp,B,x���Ye,x��� +
1
2Fp,B,y���Ye,y���
�14�
5 PREDICTION OF RADIATED NOISEAND CONTRIBUTION FROMSLIDING FRICTION SOURCE
5.1 Sound Pressure Prediction UsingRayleigh Integral Technique
Since the rectangular top plate is the main radiator24
of the gearbox due to its relatively high mobility,Rayleigh integral26 is used to approximate the soundpressure by assuming that the top plate is placed in aninfinite rigid baffle and each elementary plate surface isan equivalent point source in a rigid wall. The soundpressure amplitude at frequency � (rad/s) is given as
follows where � is the air density, Qi���= Vi���Si isthe source strength of ith equivalent point source witharea Si, k��� is the wave number and ri is the distancefrom the ith source to the receiver:
Fig. 6—Magnitudes of the structural path mobili-ties in the OLOA and LOA directions.Response for each (due to excitation atthe gear mesh) is calculated at the sensorlocation on the top plate (gearbox). Key:—, mobility of the OLOA path; - · -·, mo-bility of the LOA path.

: m
P��� =j��
2�
i
Qi���ri
e−jk���ri �15�
For the calculation of whine noise, � is chosen tocoincide with first three gear mesh frequencies of inter-est; Si is chosen such that its dimension (on the topplate) is smaller than 1/4 of the wave-length at the
12 3
4
5
67
8 9
10
11
12
13
1415 13
910
14
1e-5
3e-5
5e-5
30
210
60
240
90
270
120
300
150
330
180 0
210
240
120
150
180
Fig. 7—Comparison of the normal surface velocityunder Tp=500 lb-in and �p=4875 RPM. ((b) Line 2: simplified 2D gearbox model wvelocity magnitude; �, surface velocity matute sources. (c) Line 3: substitute source sgear mesh frequency index m=1; Column 2
Noise Control Eng. J. 56 (3), May-June 2008
highest gear mesh frequency. The overall noise is thencalculated by combining the contributions of allequivalent sources (using Eqn. (15)) at the receiver.Compared with conventional boundary element analy-sis, Rayleigh integral approximates sound pressure in afraction of the computation time26. Hence, it is moresuitable for parametric design studies. Although some
4
6 7
8 11
12
1315
12
3 4
56
7 8
9
10
1112
131415
5e-6
1e-5
1.5e-5
30
60
300
330
0
5e-6
1e-5
1.5e-5
30
210
60
240
90
270
120
300
150
330
180 0
nitudes and substitute source strength vectorsine 1: interpolated surface velocity on top plate;5 substitute source points; Key: �, original surfaceude by substitute sources; *, locations of substi-ths in complex plane for 2D gearbox. Column 1:
=2; Column 3: m=3.
(a)
2
5
(b)
90
270
(c)
maga) Lith 1gnittreng
171

researchers27 have pointed out that Rayleigh integralmay give large errors for sound pressure prediction ifapplied to strongly directional, three dimensional (3D)fields, such errors are not significant in our applicationdue to a flat top plate and favorable surroundings (suchas rigid side plates and the anechoic chamber).
5.2 Sound Pressure Prediction UsingSubstitute Source Method
As an alternative to the Rayleigh integral techniqueor the boundary element method, a newly developedalgorithm based on the substitute source approach28 isused to compute the radiated or diffracted sound field.It is conducted by removing the gearbox and introduc-ing acoustic sources within the liberated space whichyield the desired boundary conditions at the boxsurface (Neumann problem). Solutions are obtained interms of the locations and/or the strengths of the substi-tute sources by minimizing the error function betweenoriginal and estimated particle velocity normal to theinterface surface28.
Since the surface velocity distributions on thegearbox plate(s) are essentially symmetric along thecenter lines due to geometric symmetry, velocity distri-butions in Fig. 3(b) along the border lines of EFGHplane are chosen to simplify the 3D gearbox into a 2Dradiation model for simpler data representation as wellas faster computation. Zero (negligible) velocity distri-bution is assumed along lines EF, FG and HE since themicrophone (receiver) is positioned above the center ofmajor radiator, i.e. the top plate. A 2D line sourceuniformly pulsating with unit-length volume velocityQ� is chosen as the substitute source. Its radiation fieldis the same in any plane perpendicular to the source
line. Amplitudes of the sound pressure �P� and radial
velocity �Vr� of such source are given by the following,where Hv
�2� is the Hankel function of second kind andorder v.
P��� =k����c
4Q����H0
�2��k���r� , �16a�
Vr��� = − jk���
4Q�H1
�2��k���r� �16b�
A “greedy search” algorithm is used to search for“optimal” substitute sources: First, a large number ofcandidate source positions within the vibrating bodyare defined, e.g. at the vertices of a square grid. Second,a single position is first found which allows the pointsource to produce the smallest possible deviationbetween the original and estimated normal surfacevelocities. The estimation is then subtracted from theoriginal velocity to get a velocity residual. Third,
172 Noise Control Eng. J. 56 (3), May-June 2008
among the rest of candidate points, a new position isfound which makes the second source maximallyreduce the velocity residual of the first step. Oncefound, the source strengths of both sources are adjustedfor a best fit of the original surface velocity and a newresidual velocity. Each subsequent step defines a newoptimum source position among the ones not alreadyused28. The source strengths are curve-fit by minimiz-ing the root-mean-square (RMS) value of the velocity
error. The vector of complex-valued source strength Q�
is related (as shown below) to the vector Vn ofcomplex-valued normal surface velocity at control
points via the source-velocity transfer matrix T=
whererij= �r�i−r�j� and �ij is the angle between vector r�i−r� andthe outer normal to the surface.
Q���� = T=
−1���Vn��� , �17a�
Tij��� = − jk���
4H1
�2��k���rij�cos��ij� �17b�
To minimize the impact of an ill-conditioned matrix,the number of control points is kept well above that ofindependent source points. Minimization of the RMSerror using pseudo-inverse yields the following, wherethe asterisk signifies the conjugate transpose:
Q���� = �T=
���*T=
����−1T=
���*Vn��� �18�
The difference between synthesized and originalsurface normal velocities is:
V��� = �=���Vn��� , �19a�
�=
��� = T=
����T=
���*T=
����−1T=
���* − I=��� �19b�
where I=��� is the identity matrix. The matrix �
=���
appears as a velocity error matrix. The RMS velocityerror is normalized by using the RMS value of originalvelocity as:
eRMS��� =ERMS���
Vn,RMS���=�Vn���*�
=���*�=
���Vn���
Vn���*Vn���
�20�
This search algorithm described28 is based onengineering “common sense” rather than a rigorousmathematical optimization of the substitute sourcepositions. Consequently, it may not necessarily lead tooptimum positioning, i.e. to the solution which givesthe smallest possible RMS velocity error. The overalladvantage is in its simplicity of application as well as inproviding solutions that are much better than thoseobtained via an arbitrary selection of the source

positions. Note that the substitute source technique aselaborated above could be applied to solve other radia-tion problems. This also permits an evaluation of theacoustic source properties.
5.3 Noise Prediction vs. Measurements
Figure 7(a) shows predictions of surface interpo-lated velocity distribution on the top plate at the firstthree mesh harmonics under Tp=500 lb-in and �p
=4875 RPM. Note that predictions at higher frequen-cies (e.g. mesh index m=3) are less “reliable” due tothe limitation of element dimensions as compared thewave length. The symmetry of surface velocity distri-bution leads to the simplification into a 2D gearboxmodel of Fig. 7(b). To ensure necessary accuracy foracoustic radiation, selected (central) lines of the 2Dplane should capture the dominant structural modes ofFig. 7(a). Also, the structural wavelength along thecentral line should be higher than the acousticwavelength of interest to ensure the validity of the 2Dapproach.
The source points of Fig. 7(b) are chosen from amesh grid of candidate points not too close to theboundary to prevent a generation of steep gradients insurface pressure. Observe that only 15 substitutesources tend to predict well the surface distribution ofvelocity magnitude at the gear mesh harmonics. Figure7(c) illustrates the predicted source strengths of thesubstitute sources (in the complex plane) for evaluationof the acoustic source properties. A single dominantsubstitute source is observed at the first mesh harmonic(monopole-like acoustic source); however, severaldominant substitute sources are present and these aremore equally distributed in the complex plane at higherharmonics (multi-pole acoustic sources).
A simplification from 3D into 2D gearbox modelrequires an examination of the surface (structural)modes and a careful selection of representative plane,which poses additional limitations to its application asa more “universal” method. However, once applicable,the substitute source method provides several benefits.First, it enables an efficient evaluation of the acousticsource characteristics for whine noise. Second, unlikethe Rayleigh integral technique which assumes that thetop plate is placed in an infinite rigid baffle, it takes thebody shape into account and thus reduces the errorsespecially in the lower frequency range. This alsoallows a straight forward synthesis of the radiation fieldfor all sources by using a simple superposition as longas diffraction from the sources does not take place.Finally, compared with boundary element analysis, itdoes not suffer from the problems of singularities or
Noise Control Eng. J. 56 (3), May-June 2008
uniqueness of solution. Nonetheless, it is an engineer-ing (approximate) method and must be judiciouslyapplied.
Figure 8 compares the sound pressure measured atthe microphone 6 inch above the top plate to predic-tions by using both the Rayleigh integral as well as thesubstitute source methods over a range of pinion torquegiven �p=4875 RPM and 140 °F. Finally, it is worth-while to notice that the second mesh harmonic, whichis most susceptible to the sliding friction, becomesincreasingly more dominant at higher torques for ourexample case.
6 CONCLUSION
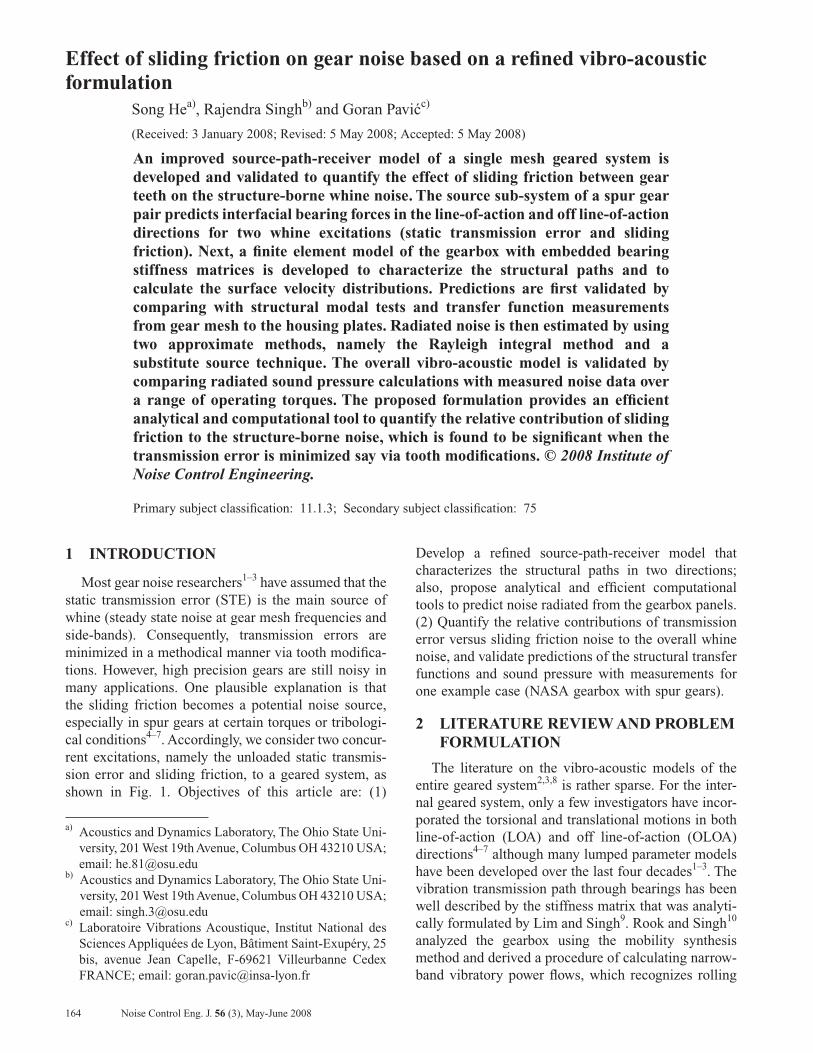
A refined source-path-receiver model has beendeveloped which characterizes the sliding frictioninduced structural path and associated noise radiation.Proposed Rayleigh integral method and substitutesource technique are capable of calculating the acousticfield and quantifying the frictional noise. For instance,Fig. 9 compares the sound pressure level predictedgiven �p=4875 RPM and 140 °F under Tp
=500 lb-in (close to the “optimal” load where trans-mission error is minimized) and under high torque withTp=800 lb-in. At each gear mesh frequency, individualcontributions of transmission error (via the LOA path)and frictional effects (via the OLOA path) arecompared to the overall whine noise. Observe in Fig.
Fig. 8—Sound pressures (Pa) at the first threegear mesh frequencies (with speed �p=4875 RPM) over a range of torque Tp at140 °F. Key: —, measurements (6� abovethe top plate); �, Rayleigh integral predic-tions; �, substitute source predictions.Color code: Blue, gear mesh frequencyindex m=1; red, m=2; black, m=3.
173
9(a) that near the “optimal” load, sliding frictioninduced noise is comparable to the transmission errorinduced noise (especially for the first two meshharmonics); thus sliding friction should be consideredas a significant contributor to the whine noise.However, at “non-optimal” torques in Fig. 9(b), frictioninduced noise is overwhelmed by the transmissionerror noise, thus sliding friction could be negligibleunder such conditions. This confirms that the slidingfriction should be viewed as a potential contributor tostructure-borne noise for high precision, high powerdensity geared systems.
Despite the complexity of the geared system andmany assumptions made during the modeling process(such as neglecting the moment transfer elements at thebearings and a simplification of the 3D gearbox into 2Dproblem), predictions correlate well with measure-
Fig. 9—Overall sound pressure levels (dB re2e-5 Pa) and their contributions predictedat 6� above the top plate under�p=4875 RPM and 140 °F. (a) Meanload Tp=500 lb-in (optimal load for mini-mum transmission error); (b) mean loadTp=800 lb-in.
174 Noise Control Eng. J. 56 (3), May-June 2008
ments in terms of trends and relative magnitudes at firstthree gear mesh harmonics. This result suggests apromising start to the substitute source technique.Further work is needed to extend the substitute sourcemethod and its variants (such as multi-pole sources29)in predicting the noise from a more complicatedgearbox in 3D space, as well to quantify the acousticsource strengths and directivity. As part of the ongoingwork, the approximate sound radiation methods will becompared with the boundary-element techqiue30 whichcould also be applied to the problem.
7 ACKNOWLEDGEMENTS
We gratefully acknowledge the Marie Curie Fellow-ship of the European Commission for financiallysupporting this research. V. Asnani and F. Oswald of theNASA Glenn Research Center are thanked for conduct-ing the experiments. We acknowledge Dr. T. Rook ofGoodrich Co. and Dr. R. Gunda of Advanced Numeri-cal Solutions Inc. for their comments and suggestions.Dr. T. Lim from the University of Cincinnati is thankedfor providing the bearing stiffness software.
8 REFERENCES
1. H. N. Ozguven and D. R. Houser, “Mathematical models usedin gear dynamics - a review”, J. Sound Vib., 121, 383–411,(1988).
2. G. Steyer, “Influence of gear train dynamics on gear noise”,NOISE-CON 87 Proc., 53–58, (1987).
3. A. Parey and N. Tandon, “Spur gear dynamic models includingdefects: A review”, Shock Vib. Dig. 35(6), 465–478, (2003).
4. P. Velex and V. Cahouet, “Experimental and numerical investi-gations on the influence of tooth friction in spur and helical geardynamics”, ASME J. Mech. Des., 12 (4), 515–522, (2000).
5. O. Lundvall, N. Strömberg and A. Klarbring, “A flexible multi-body approach for frictional contact in spur gears”, J. SoundVib.278(3), 479–499, (2004).
6. D. R. Houser, M. Vaishya and J. D. Sorenson, “Vibro-acousticeffects of friction in gears: An experimental investigation”, SAE,Paper #2001- 01-1516, (2001).
7. J. Borner and D. R. Houser, “Friction and bending moments asgear noise excitations”, SAE, Paper #961816, (1996).
8. T. C. Lim and R. Singh, “A review of gear housing dynamicsand acoustics literature”, NASA Tech. Memo., 89-C-009,(1989).
9. T. C. Lim and R. Singh, “Vibration transmission through rollingelement bearings. Part I: Bearing stiffness formulation”, J.Sound Vib. 139(2), 179–199, (1990).
10. T. E. Rook and R. Singh, “Mobility analysis of structure-bornenoise power flow through bearing in gearbox-like structures”,Noise Control Eng. J., 44(2), 69–78, (1996).
11. T. C. Lim and R. Singh, “Vibration transmission through rollingelement bearings. Part II: System studies”, J. SoundVib. 139(2),201–225, (1990).
12. A. Van Roosmalen, “Design tools for low noise gear transmis-sions”, Ph.D. Dissertation, Eindhoven University of Technol-ogy, 76-100, (1994).
13. F. K. Choy, Y. F. Ruan, J. J. Zakrajsek and F. B. Oswald, “Modalsimulation of gearbox vibration with experimental correlation”,NASA-TM-105702, (1992).
14. T. C. Lim and R. Singh, “Statistical energy analysis of a gearboxwith emphasis on the bearing path”, Noise Control Eng. J.,

37(2), 63–69, (1991).15. M. F. Jacobson, R. Singh and F. B. Oswald, “Acoustic radiation
efficiency models of a simple gearbox”, ASME Design Eng.Conf. DE 88, 597–601, (1996).
16. V. Kartik and D. R. Houser, “An investigation of shaft dynamiceffects on gear vibration and noise excitation”, SAE Trans., 112,1737–1746, (2003).
17. R. Singh, A. Lake, V. Asnani and S. He, “Vibro-acoustic modelof a geared system including friction excitation”, INTER-NOISE 2007, Paper #663296, 28–31 Aug, Istanbul, TURKEY,(2007).
18. G. W. Blankenship and A. Kahraman, “Steady state forced re-sponse of a mechanical oscillator with combined parametric ex-citation and clearance type non-linearity”, J. Sound Vib. 185(5),743–765, (1995).
19. S. He, R. Gunda and R. Singh, “Effect of sliding friction on thedynamics of spur gear pair with realistic time-varying stiff-ness”, J. Sound Vib. 301, 927–949, (2007).
20. External2D (CALYX software), A contact mechanics/finite ele-ment (CM/FE) tool for spur gear design, ANSOL Inc. �www.an-sol.com , Hilliard, OH, (2002).
21. S. He and R. Singh, “Dynamic interactions between sliding fric-tion and tip relief in spur gears”, 10th Int. Power Trans. andGearing Conf., Paper #DETC 2007-34077, Las Vegas, NE,(2007).
Noise Control Eng. J. 56 (3), May-June 2008
22. T. E. Rook and R. Singh, “Structural intensity calculations forcompliant plate-beam structures connected by bearings”, J.Sound Vib., 211(3), 365–388, (1998).
23. I-DEAS, Online tutorials, SDRC Inc., Milford, MI, (1998).24. F. B. Oswald, A. F. Seybert, T. W. Wu and W. Atherton, “Com-
parison of analysis and experiment for gearbox noise”, NASA-TM-105330, (1992).
25. R. Singh, “Dynamic analysis of sliding friction in rotorcraftgeared systems,” Technical report submitted to the Army Re-search Office, Grant number DAAD19-02-1-0334, (2005).
26. L. Cremer and M. Heckl, Sound Radiation from Structures,Chapter 6 on “Structure-borne Sound,” Springer-Verlag, NewYork, (1973).
27. D. W. Herrin, F. Martinus, T. W. Wu and A. F. Seybert, “A newlook at the high frequency boundary element and Rayleigh inte-gral approximations”, SAE, Paper #03NVC-114, (2003).
28. G. Pavić, “An engineering technique for the computation ofsound radiation by vibrating bodies using substitute sources”,Acta Acust., 91, 1–16, (2005).
29. G. Pavić, “A technique for the computation of sound radiationby vibrating bodies using multipole substitute sources”, ActaAcust. (Beijing), 92, 112–126, (2006).
30. R. Gunda and S. Vijayakar, “Application of the Fast MultipoleMethod (FMM) for acoustic analysis”, NOISE-CON 2007, Pa-per #196, 22-24 Oct., Reno, NE, (2007).
175