
Regeneration: Evolution, Model Organisms, And Unanswered Questions
Upload
william-crawfordCategory
view
214download
0
Effect of Shear Flow on Polymer Demixing- the
unanswered questions
H. GERARD, J. T. CABRAL, J. S. HIGGINS
Department of Chemical Engineering
Imperial College, London
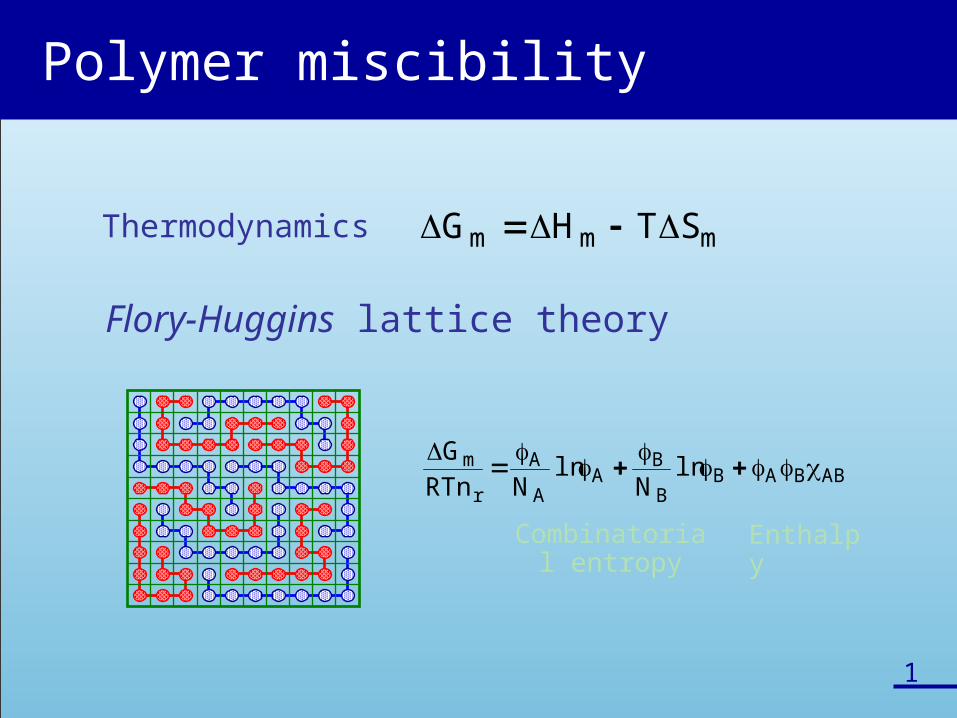
Thermodynamics
Flory-Huggins lattice theory
mmm STHG
Combinatorial entropy
Enthalpy
ABBABB
BA
A
A
r
m lnN
lnNRTn
G
Polymer miscibility
1
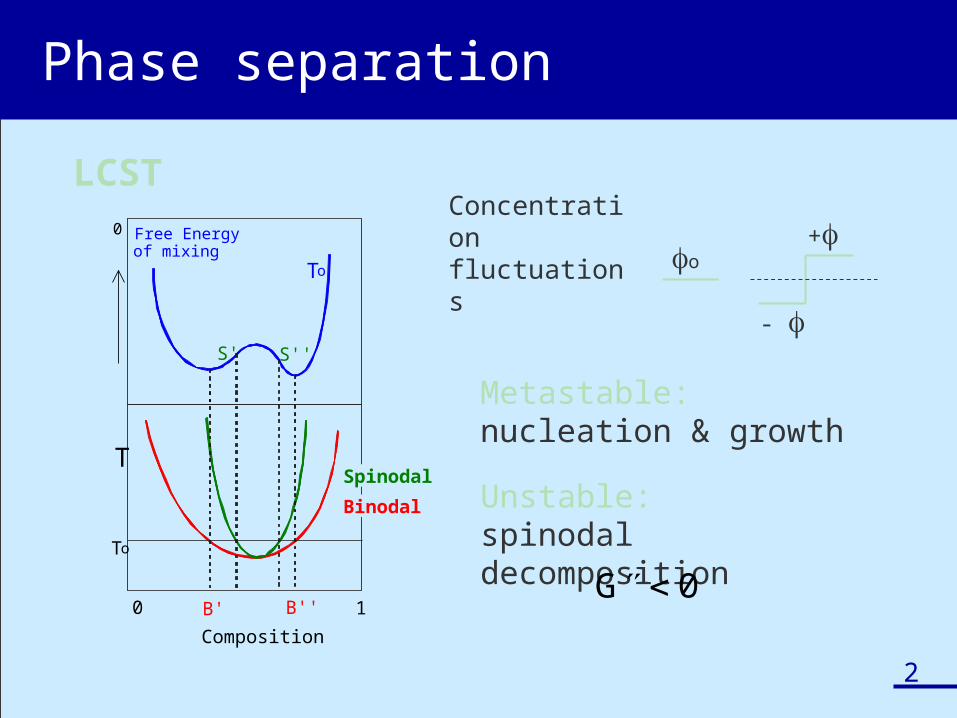
Phase separation
2
0 1B' B''
S' S''
Composition
Spinodal
Binodal
To
T
To
Free Energyof mixing
0
LCSTConcentration fluctuations
o+
-
Metastable:nucleation & growth
Unstable: spinodal decomposition
G 0

Free Energyof mixing
CompositionC 0
B'
B''T0
Spinodal decomposition
3
EARLY LATER FINAL
distance
C0
B'
B''80 m
Optical microscopy
4
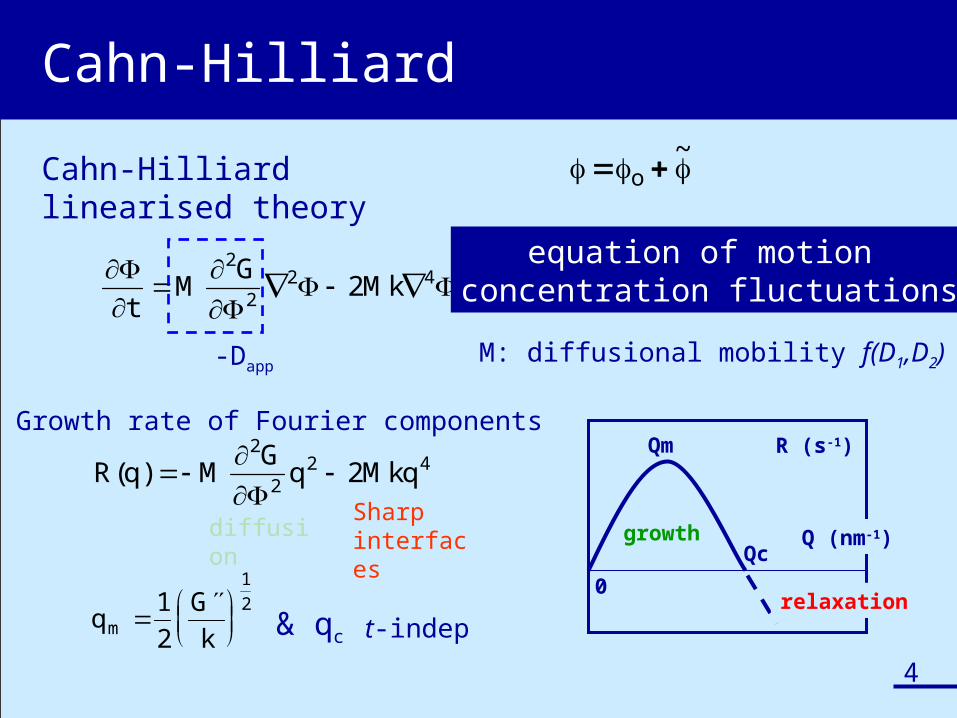
Cahn-Hilliard
t
MG
Mk 2
22 42
Cahn-Hilliard linearised theory
equation of motion concentration fluctuations
-DappM: diffusional mobility f(D1,D2)
~o
R q MG
q Mkq( )
2
22 42
qG
km
1
2
1
2
& qc
Growth rate of Fourier components
t-indep
diffusionSharp interfaces
Qm
Qc
R (s-1)
growth
relaxation
Q (nm-1)
0
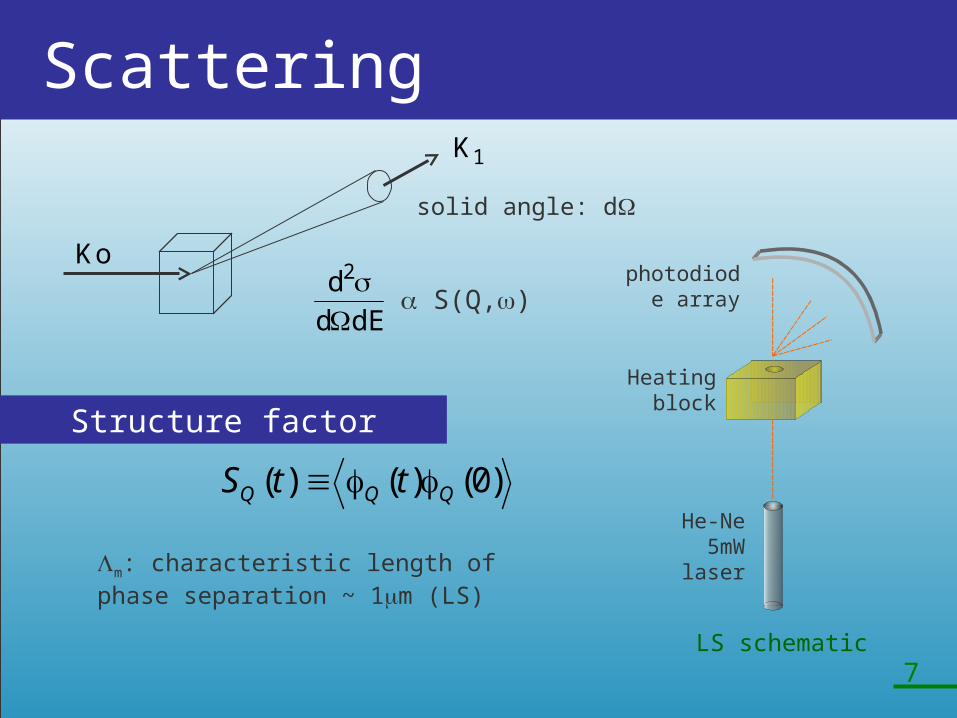
Scattering
photodiode array
Heating block
He-Ne 5mW laser
)0()()( QQQ ttS
m: characteristic length of phase separation ~ 1m (LS)
Structure factor
oK
1K
solid angle: d
dEd
d2
S(Q,)
LS schematic7

1.36
E-0
3
4.60
E-0
3
7.80
E-0
3
1.09
E-0
2
1.39
E-0
2
1.67
E-0
2
0
100
200
300
400
500
Time (s)0 300 600 900 1200 1500
Inte
nsity
(au)
0
5
10
15
20
25
30q=0.00124 A-1
deep quench
shallowquench
LS
0
2000
1000
time (s)
q (nm-1)
I (au)
Light scattering
8
TMPC/PS 50:50Tjump=240.6oC
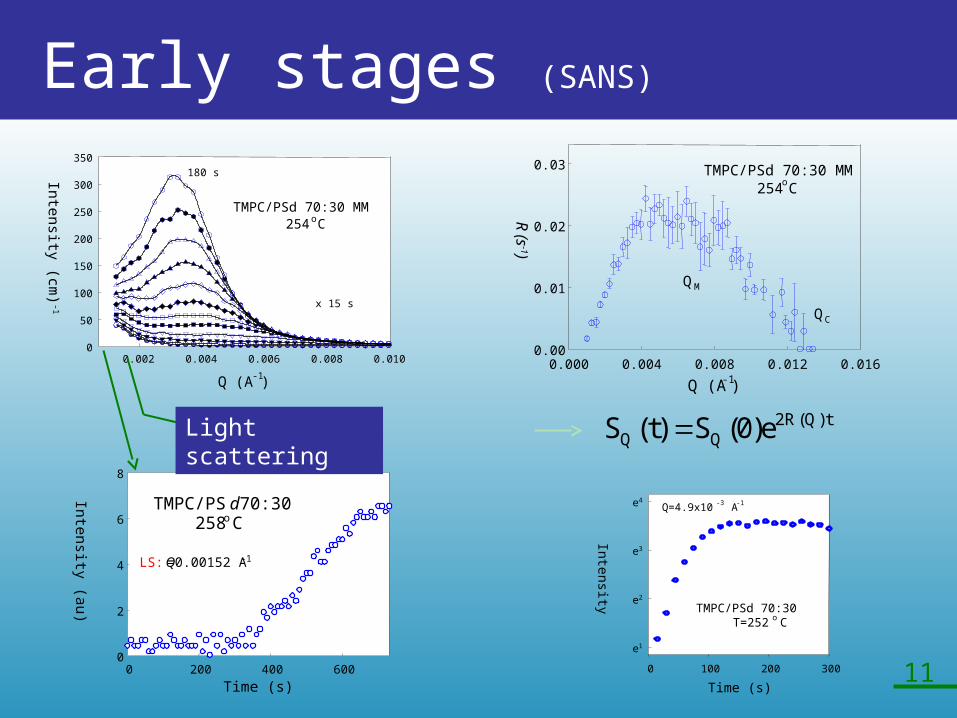
TMPC/PSd 70:30 MM254 oC
Q (A -1)
0.002 0.004 0.006 0.008 0.010
Intensity (cm)
-1
0
50
100
150
200
250
300
350180 s
x 15 s
TMPC/PSd 70:30258oC
Time (s)0 200 400 600
Intensity (au)
0
2
4
6
8
LS: Q=0.00152 A -1
Light scattering
Q (A-1)0.000 0.004 0.008 0.012 0.016
R (s
-1)
0.00
0.01
0.02
0.03 TMPC/PSd 70:30 MM254
oC
QC
QM
Time (s)
0 100 200 300
Intensity
e1
e2
e3
e4Q=4.9x10
-3 A
-1
TMPC/PSd 70:30T=252 o C
t)Q(R2QQ e)0(S)t(S
Early stages (SANS)
11

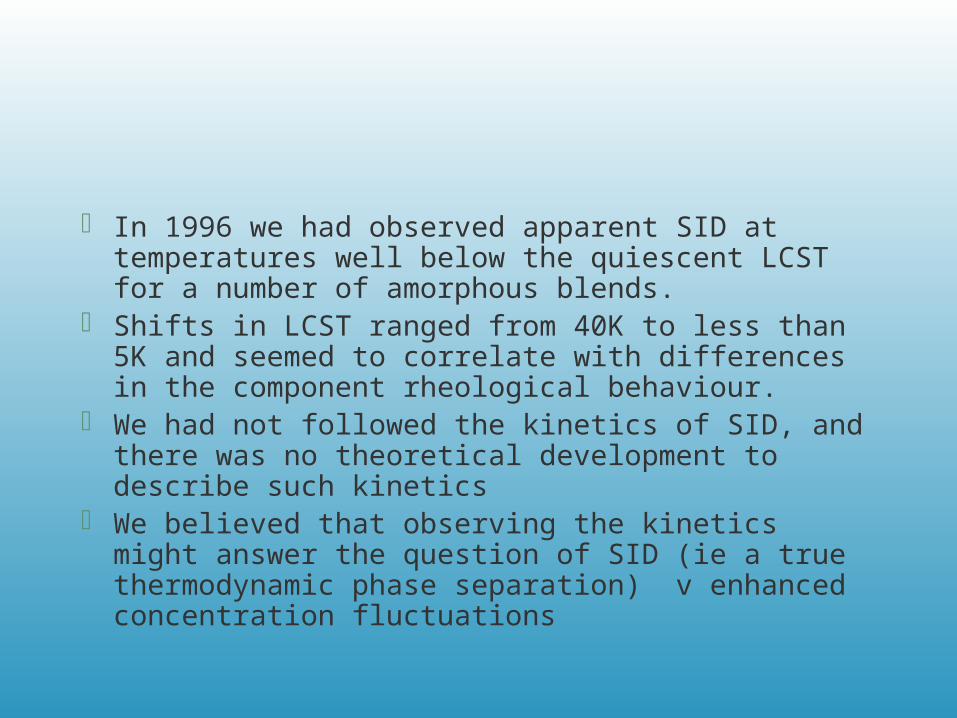
In 1996 we had observed apparent SID at temperatures well below the quiescent LCST for a number of amorphous blends.
Shifts in LCST ranged from 40K to less than 5K and seemed to correlate with differences in the component rheological behaviour.
We had not followed the kinetics of SID, and there was no theoretical development to describe such kinetics
We believed that observing the kinetics might answer the question of SID (ie a true thermodynamic phase separation) v enhanced concentration fluctuations
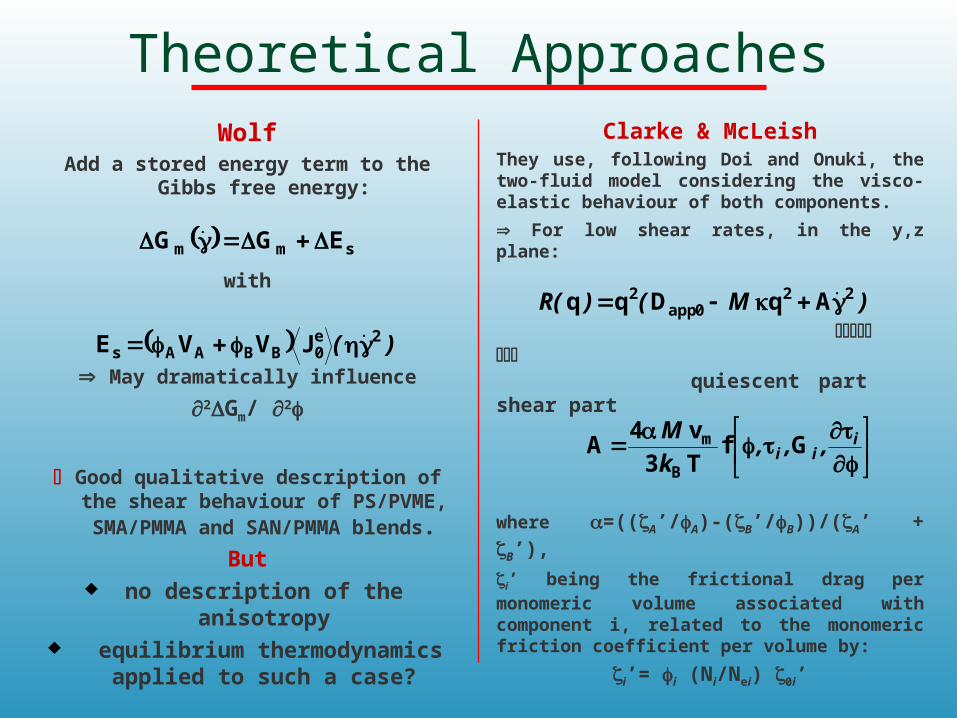
Theoretical ApproachesWolf
Add a stored energy term to the Gibbs free energy:
with
May dramatically influence
2Gm/ 2
Good qualitative description of the shear behaviour of PS/PVME, SMA/PMMA and
SAN/PMMA blends.
But no description of the anisotropy
equilibrium thermodynamics applied to such a case?
Clarke & McLeishThey use, following Doi and Onuki, the two-fluid model considering the visco-elastic behaviour of both components.
For low shear rates, in the y,z plane:
quiescent part shear part
where =((A’/A)-(B’/B))/(A’ + B’),
i’ being the frictional drag per monomeric volume associated with component i, related to the monomeric friction coefficient per volume by:
i’= i (Ni/Nei) 0i’
smm EGG
)( 2e0BBAAs JVVE
)M()R( 220app
2 AqDqq
iii ,,,
k
MGf
T3
v4A
B
m
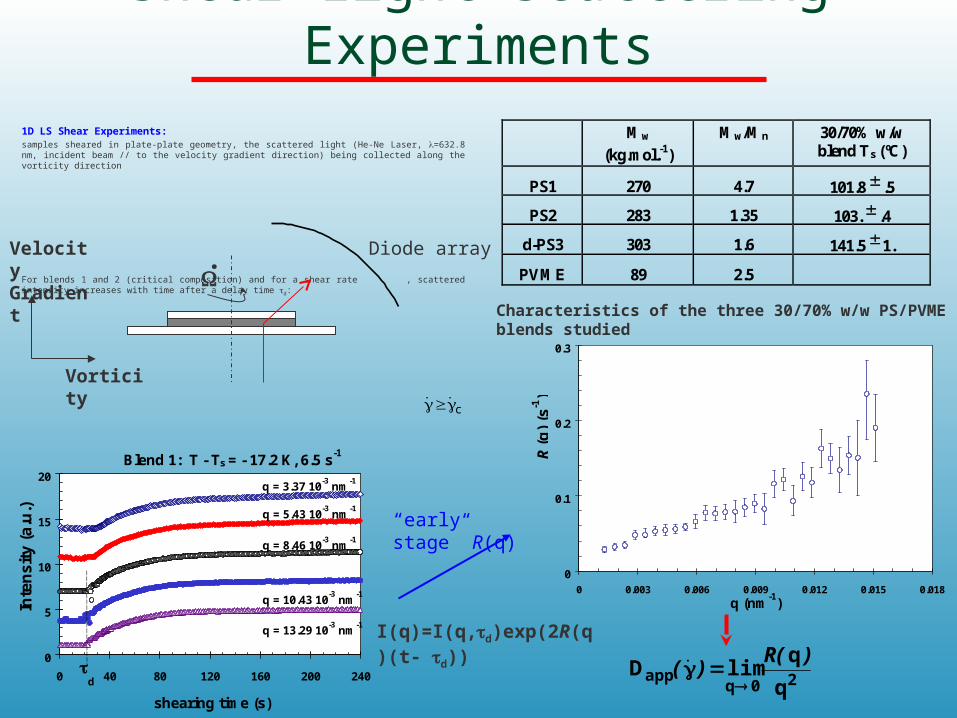
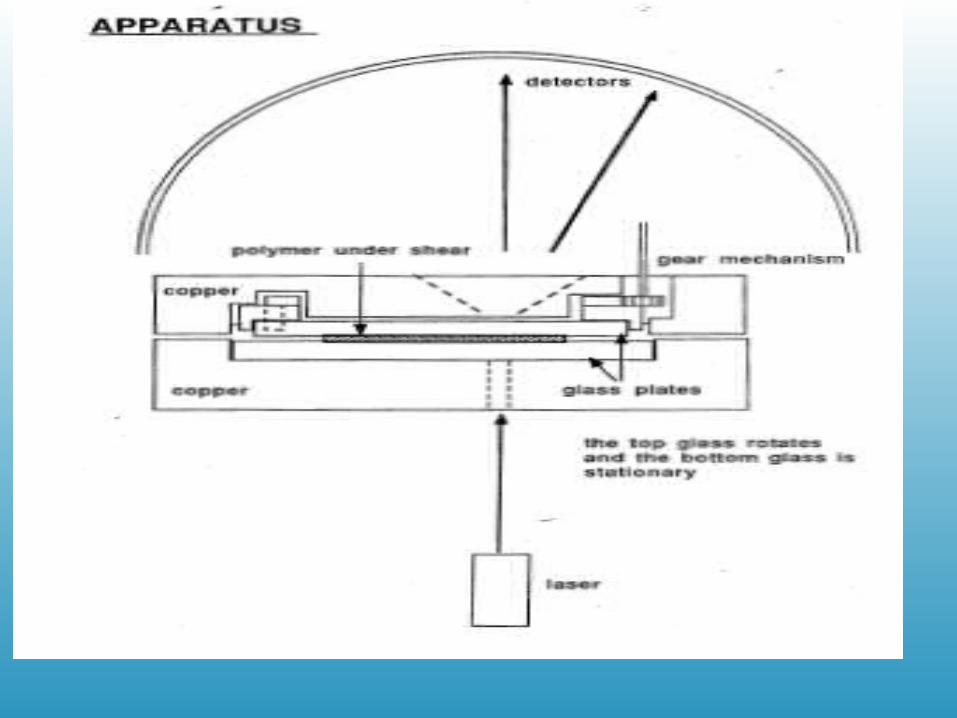
Shear Light Scattering Experiments1D LS Shear Experiments:
samples sheared in plate-plate geometry, the scattered light (He-Ne Laser, =632.8 nm, incident beam // to the velocity gradient direction) being collected along the vorticity direction
For blends 1 and 2 (critical composition) and for a shear rate , scattered intensity increases with time after a delay time d:
Mw
(kg.mol.-1)
Mw/Mn 30/70% w/wblend Ts (ºC)
PS1 270 4.7 101.8 .5
PS2 283 1.35 103. .4
d-PS3 303 1.6 141.5 1.
PVME 89 2.5
Diode array
c
0
5
10
15
20
0 40 80 120 160 200 240
shearing time (s)
d
q = 10.43 10-3
nm-1
q = 3.37 10-3
nm-1
q = 8.46 10-3
nm-1
q = 5.43 10-3
nm-1
q = 13.29 10-3
nm-1
Inte
ns
ity
(a
.u.)
Blend 1: T - Ts = - 17.2 K, 6.5 s-1
20qapp
q
qlimD
)R()(
I(q)=I(q,d)exp(2R(q)(t- d))
“early stage” R(q)
0
0.1
0.2
0.3
0 0.003 0.006 0.009 0.012 0.015 0.018
q (nm-1
)
R(q
) (s
-1)
Velocity Gradient
Vorticity
Characteristics of the three 30/70% w/w PS/PVME blends studied
.

- D
app (
10-1
3 cm
2 s-1)
0.1
1
10
100
1000
0.1 1 10shear rate (s-1)
Blend 1, -22.3 K
Blend 1, -17.2 K
Blend 1, - 8. K
Blend 2, -24.6 K
Blend 2, -14.9 K
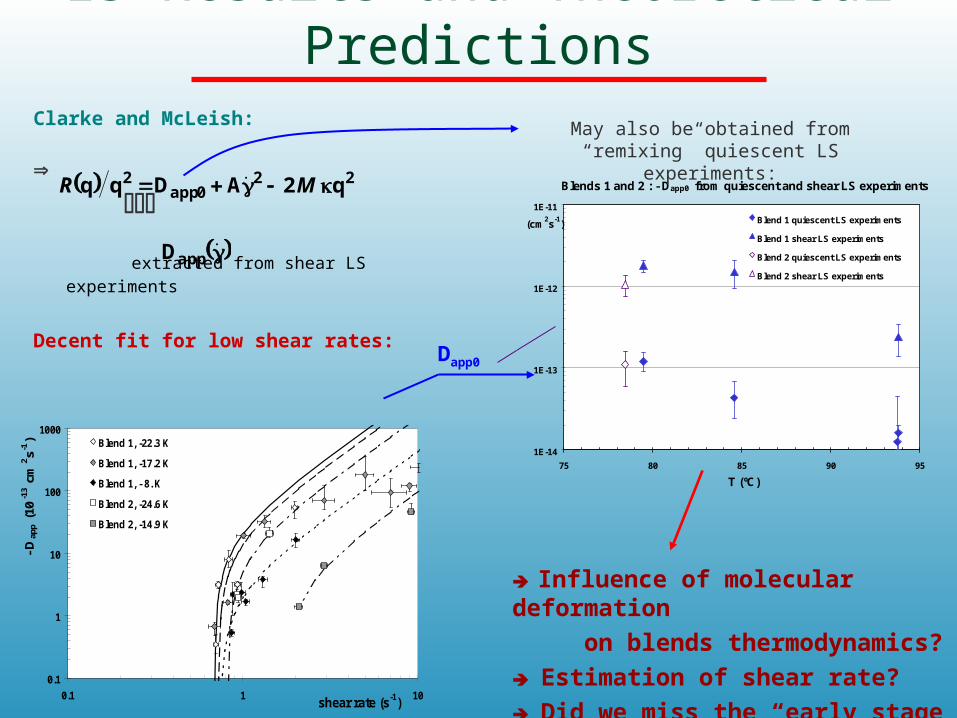
Clarke and McLeish:
extracted from shear LS experiments
Decent fit for low shear rates:
LS Results and Theoretical Predictions
appD
220app
2 q2ADqq MR Blends 1 and 2 : - Dapp0 from quiescent and shear LS experiments
1E-14
1E-13
1E-12
1E-11
75 80 85 90 95
T (ºC)
Blend 1 quiescent LS experiments
Blend 1 shear LS experiments
Blend 2 quiescent LS experiments
Blend 2 shear LS experiments
(cm2s-1)
Dapp0
May also be obtained from “remixing” quiescent LS experiments:
Influence of molecular deformation
on blends thermodynamics?
Estimation of shear rate?
Did we miss the “early stage”?
- Dap
p (1
0-1
3 c
m2s-1
)
0.1
1
10
100
1000
0.1 1 10shear rate (s-1)
Blend 1, -22.3 K
Blend 1, -17.2 K
Blend 1, - 8. K
Blend 2, -24.6 K
Blend 2, -14.9 K

Small Angle Neutron Scattering – the aim is to look at much smaller size scale and “catch” the early stages
One component is deuterated to give contrast - this may shift the LCST.
We had no shear cell for SANS and had to use quenched samples.
The neutron beam is much larger than the laser beam so we were averaging over a range of shear rates
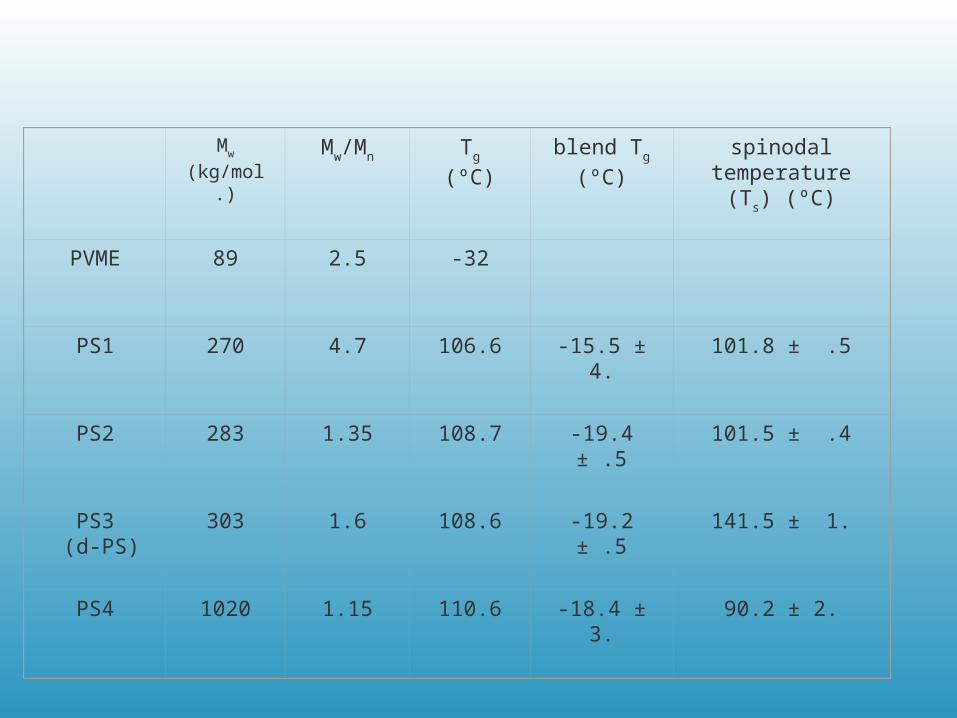
Mw
(kg/mol.)Mw/Mn
Tg (ºC) blend Tg
(ºC)
spinodal temperature (Ts) (ºC)
PVME 89 2.5 -32
PS1 270 4.7 106.6 -15.5 ± 4. 101.8 ± .5
PS2 283 1.35 108.7 -19.4 ± .5 101.5 ± .4
PS3 (d-PS)
303 1.6 108.6 -19.2 ± .5 141.5 ± 1.
PS4 1020 1.15 110.6 -18.4 ± 3. 90.2 ± 2.
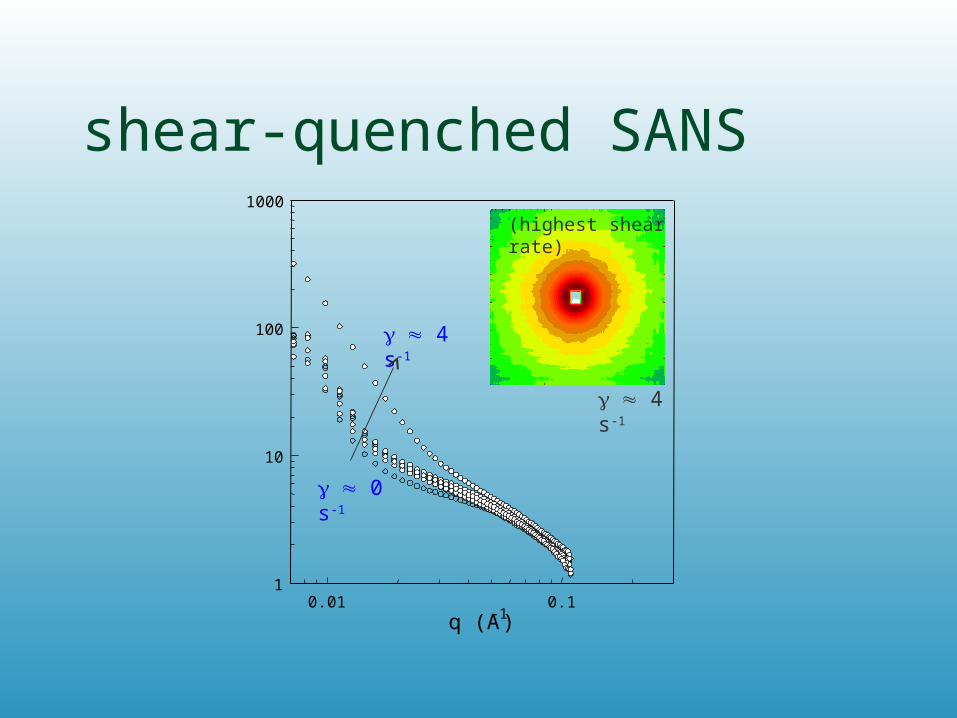
shear-quenched SANS
q (A-1)0.01 0.1
1
10
100
1000
0 s-1
4 s-1
4 s-1
(highest shear rate)
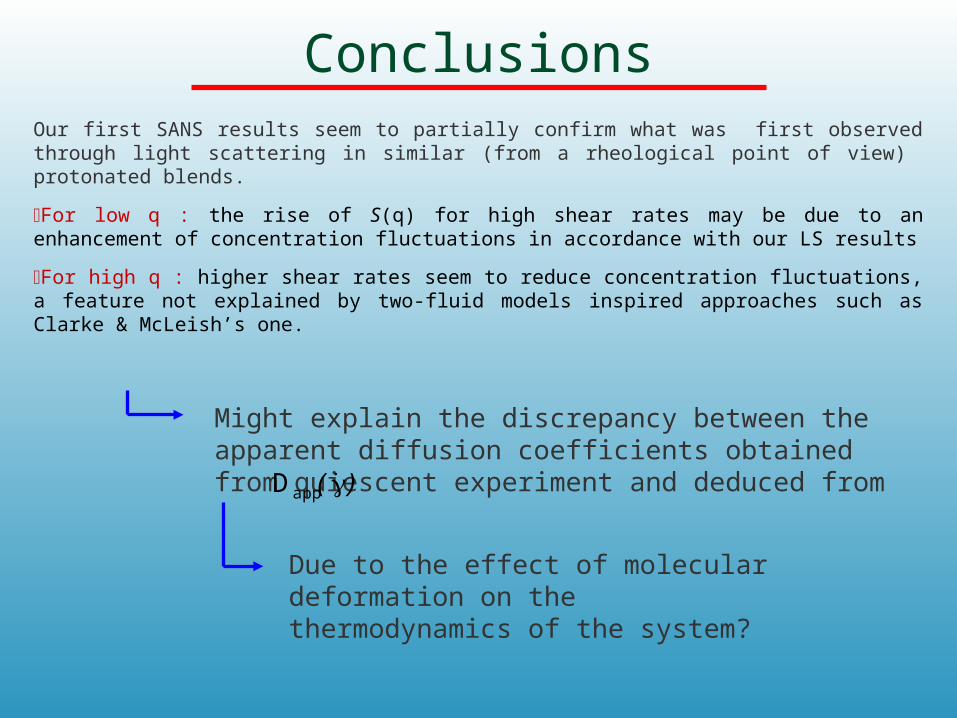
ConclusionsOur first SANS results seem to partially confirm what was first observed through light scattering in similar (from a rheological point of view) protonated blends.
For low q : the rise of S(q) for high shear rates may be due to an enhancement of concentration fluctuations in accordance with our LS results
For high q : higher shear rates seem to reduce concentration fluctuations, a feature not explained by two-fluid models inspired approaches such as Clarke & McLeish’s one.
Might explain the discrepancy between the apparent diffusion coefficients obtained from quiescent experiment and deduced from )( appD
Due to the effect of molecular deformation on the thermodynamics of the system?

The Unanswered Questions
Is the D from SID really different from the D obtained in re-mixing experiments?-experiments first and if confirmed theory needs some thought.
Would a more sophisticated statistical mechanics description of the free energy help? We have been having considerable success in quiescent systems using a version of BGY which includes compressibility and non-random mixing.
What happens in the early stages of SID? – can we find a system where deuteration does not have such a large effect on LCST? – or can we use another technique, eg AFM on quenched samples?
All these Qs aimed at the “big” one –is this SID or just enhanced concentration fluctuations?


Parameters which characterize the pure fluid
iiri v
strength of nearest-neighbour interaction number of contiguous
lattice sites per molecule
volume per mole of lattice sites
…and the mixture
g = ij/(ii jj)1/2
characterizes the deviation from the geometric mean approximation
Lattice Born-Green-Yvon (BGY) theory links the microscopic
character of a polymer/blend to its thermodynamic properties
Macromolecules 36, 2977 (2003)
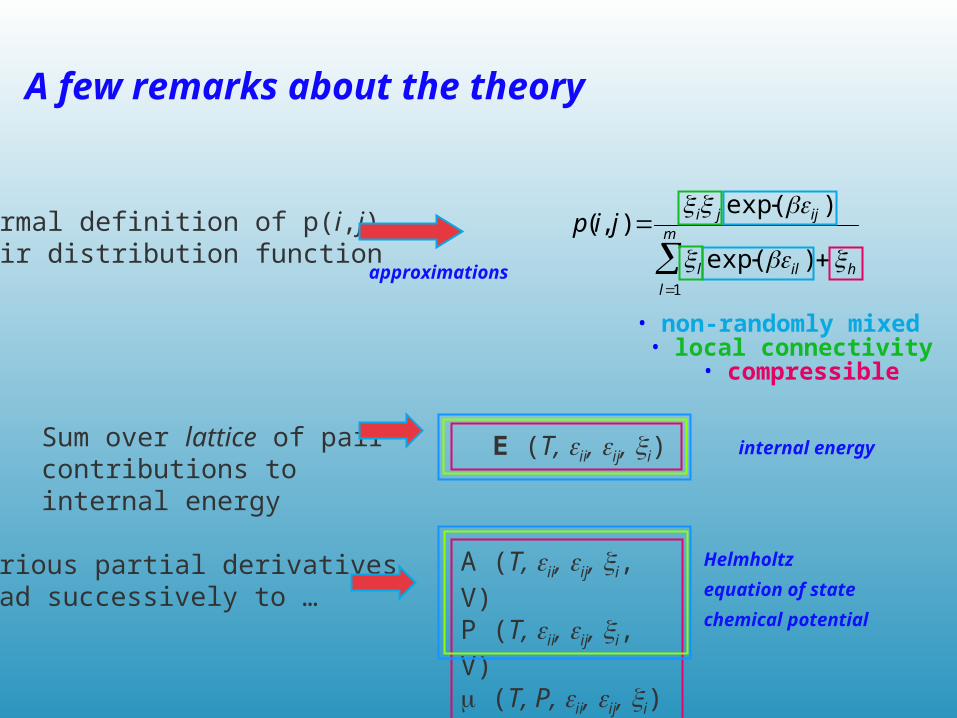
Formal definition of p(i,j),pair distribution function
approximations
p(i, j) i j exp( ij )
l exp( il )h
l1
m
• non-randomly mixed
• local connectivity• compressible
A few remarks about the theory
Sum over lattice of pair contributions to internal energy
E (T, ii, ij, i) internal energy
Various partial derivativeslead successively to …
A (T, ii, ij, i, V)P (T, ii, ij, i, V) (T, P, ii, ij, i)
Helmholtz
equation of state
chemical potential

Polymer Blend Parameters
Blend11
(J/mol)22
(J/mol)
(11 22)(J/mol) gexp-1 Tc,exp (K) notes
PS/PB -2062.0 -1988.3 73.7 -0.00480 362.9 pure PVT & Tc
PE/PEP -1977.5 -2000.0 22.5 -0.00031 421.0 pure PVT & Tc
PP/hhPP -2040.7 -2027.8 12.9 -0.00015 303.0 pure PVT & Tc
PMB/PEB -2239.6 -2285.9 46.3 -0.00050 313.0 pure PVT & Vmix
PpMS/PS -2282.6 -2251.1 31.5 -0.00022 413.0 pure PVT, NS & Tc
PEMS/PDMS -1808.2 -1744.2 64.0 -0.00019 334.0 pure PVT & Tc
PS/PVME -2251.1 -2000.9 250.2 0.00230 437.1 NSPS/TMPC -2105.5 -2209.5 104.0 0.00028 508.4 NS
PS/PCS -2228.2 -2409.5 181.3 0.00241 423.0 pure PVT & Tc
PS/PPO -2131.1 -2477.6 346.5 0.00380 miscible blend PVT
gexp=exp/(
When (gexp-1) is negative/positive the geometric mean is over/underestimating the strength of the 1-2 interaction

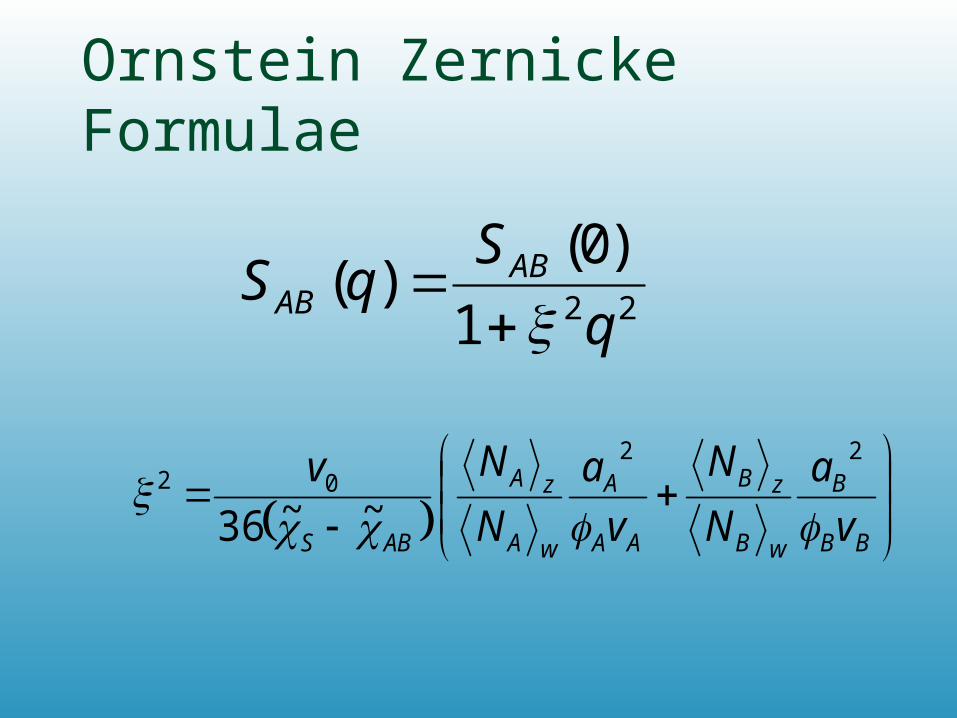
Ornstein Zernicke Formulae
BB
B
wB
zB
AA
A
wA
zA
ABS v
a
N
N
v
a
N
Nv
2202
~~36
221
)0()(
q
SqS AB
AB

q (A-1)0.01 0.1
I coh
(cm
-1)
1
10
100
1000
q2 (A-2)
0.0005 0.0010 0.0015
1/I (cm)
0.1
0
47oC
88oC
110oC
122oC
135oC
135oC
47oC
q (A-1)0.01 0.1
I coh
(cm
-1)
1
10
100
1000
q2 (A-2)
0.0005 0.0010 0.0015
1/I (cm)
0.1
0
47oC
88oC
110oC
122oC
135oC
135oC
47oC
q (A-1)0.01 0.1
I coh
(cm
-1)
1
10
100
1000
q2 (A-2)
0.0005 0.0010 0.0015
1/I (cm)
0.1
0
47oC
88oC
110oC
122oC
135oC
135oC
47oC
q (A-1)0.01 0.1
I coh
(cm
-1)
1
10
100
1000
q2 (A-2)
0.0005 0.0010 0.0015
1/I (cm)
0.1
0
47oC
88oC
110oC
122oC
135oC
135oC
47oC
q (A-1)0.01 0.1
I coh
(cm
-1)
1
10
100
1000
q2 (A-2)
0.0005 0.0010 0.0015
1/I (cm)
0.1
0
47oC
88oC
110oC
122oC
135oC
135oC
47oC

delay time d (s)
1
10
100
1000
10000
100000
0.1 1 10 100shear rate (s-1)
Blend 1, -22.3 K
Blend 1, -17.2 K
Blend 1, - 8. K
Blend 2, -24.6 K

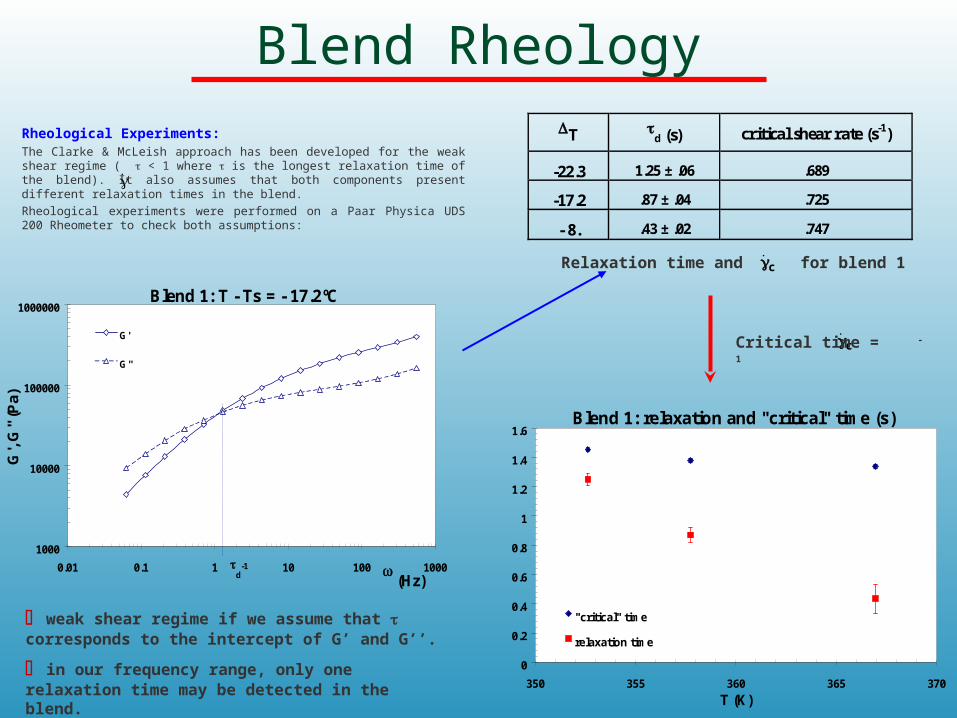
Blend Rheology
Rheological Experiments:
The Clarke & McLeish approach has been developed for the weak shear regime ( < 1 where is the longest relaxation time of the blend). It also assumes that both components present different relaxation times in the blend.
Rheological experiments were performed on a Paar Physica UDS 200 Rheometer to check both assumptions:
Relaxation time and for blend 1
Blend 1: T - Ts = - 17.2ºC
1000
10000
100000
1000000
0.01 0.1 1 10 100 1000 (Hz)
G',
G''
(Pa)
G'
G''
d
-1
Blend 1: relaxation and "critical" time (s)
0
0.2
0.4
0.6
0.8
1
1.2
1.4
1.6
350 355 360 365 370
T (K)
"critical" time
relaxation time
weak shear regime if we assume that corresponds to the intercept of G’ and G’’.
in our frequency range, only one relaxation time may be detected in the blend.
c
cCritical time = -1
T d (s) critical shear rate (s-1)
-22.3 1.25 ± .06 .689
-17.2 .87 ± .04 .725
- 8. .43 ± .02 .747

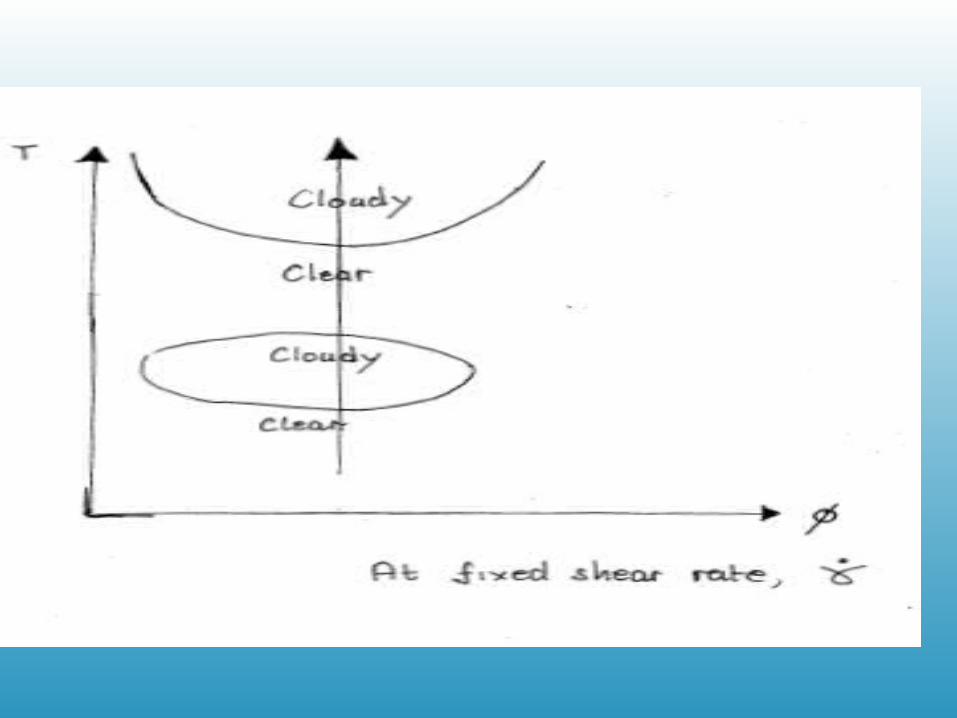
Concentration Fluctuations in Polymer Blends
Effect of shear flow:• shear (dispersed phase) droplet break-up (Taylor) • influence on thermodynamics (Wolf)• stress/concentration fluctuations coupling (Doi, Onuki)
T
one phaseDapp < 0
two-phase(unstable)Dapp > 0
spinodal Ts BinodalDapp < 0
glass transition Tg
Concentration fluctuations enhancement (for the early stage inside the spinodal line) and decays (for the “late stage” in the one phase region) may be described Cahn-Hilliard theory, giving an expression for their growth rate R(q):
with the apparent diffusion coefficient
)()R( 2app
2 qM2Dqq
2
m2
app
GMD
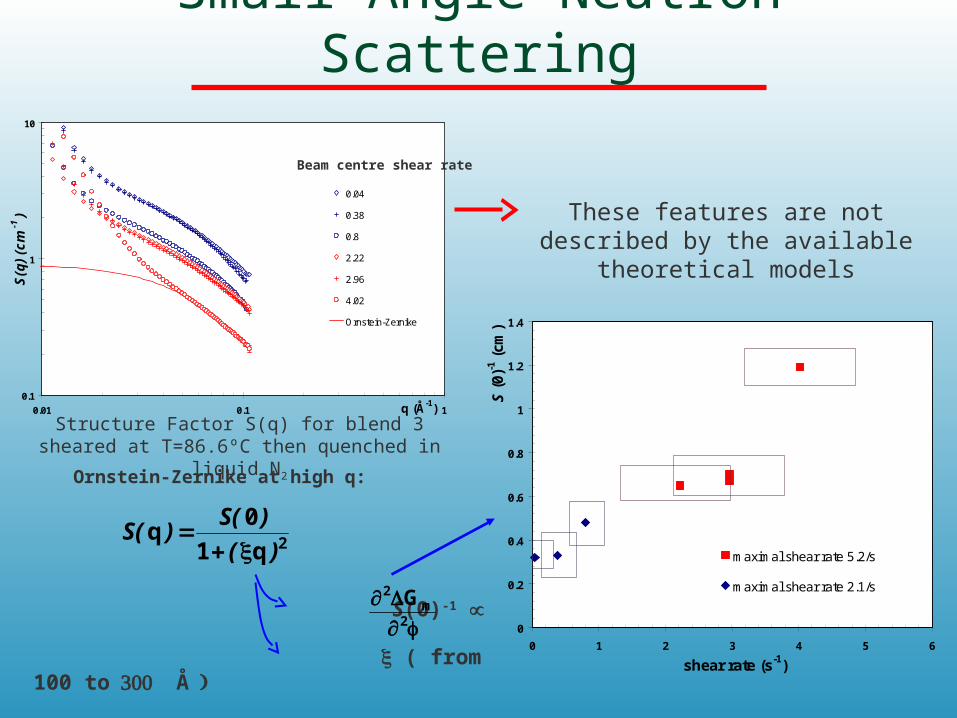
Small Angle Neutron Scattering
Ornstein-Zernike at high q:
S(0)-1
( from 100 to Å
2q1
0q
)(
)S()S(
2m
2 G
S(q
) (c
m-1
)
0.1
1
10
0.01 0.1 1q (Å-1)
0.04
0.38
0.8
2.22
2.96
4.02
Ornstein-Zernike
Structure Factor S(q) for blend 3 sheared at T=86.6ºC then quenched in liquid N2
Beam centre shear rate
These features are not described by the available theoretical models
S(0
)-1 (
cm)
0
0.2
0.4
0.6
0.8
1
1.2
1.4
0 1 2 3 4 5 6
shear rate (s-1)
maximal shear rate 5.2/s
maximal shear rate 2.1/s
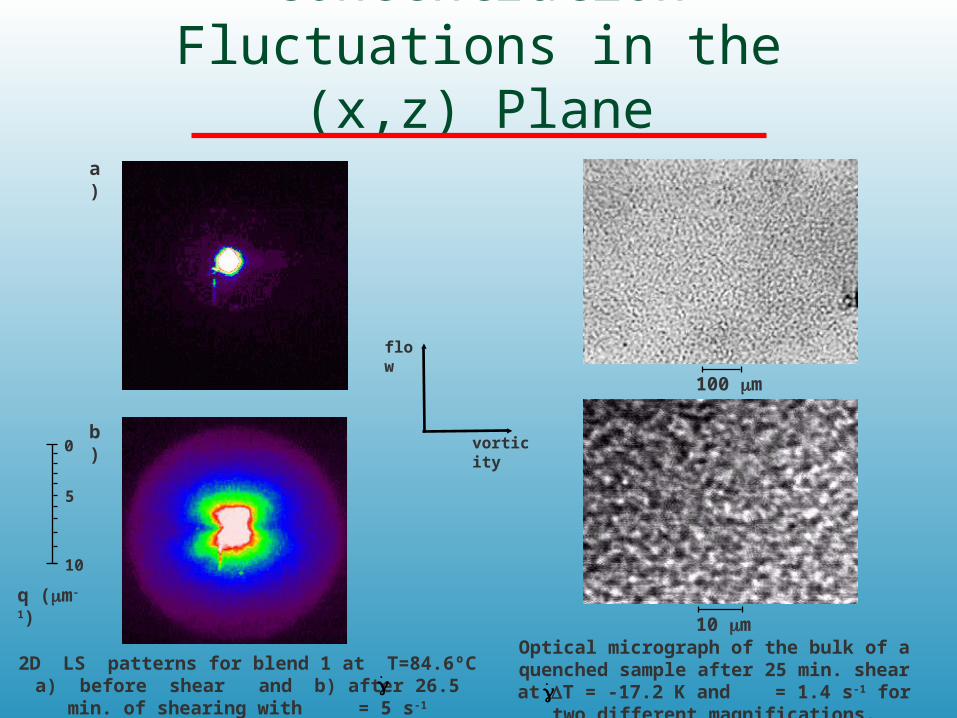
Enhancement of Concentration Fluctuations in the (x,z) Plane
q (m-1)
0
5
10
2D LS patterns for blend 1 at T=84.6ºC a) before shear and b) after 26.5 min. of shearing with = 5 s-1
a)
b)
Optical micrograph of the bulk of a quenched sample after 25 min. shear at T = -17.2 K and
= 1.4 s-1 for two different magnifications.
10 m
100 m
flow
vorticity

Small Angle Neutron ScatteringBlend 3: deuterated PS/PVME blend sheared at T = 86.6ºC ( T = - 54 K)
Two samples with maximal (2.1 and 5.2 s-1) but similar maximal strain ( Rheological steady state is reached with no change in LS patterns
The shearing is then stopped and the sample quenched in liquid N2
SANS (on D22 under cryostat at the ILL, Grenoble):
No obvious anisotropy in our q range (7. 10-3 to 1.1 10-1 Å-1)
High q (> 4 10-2 Å-1): S(q) with
reduction of small wavelength concentration
fluctuations with shear
S(0)-1 obtained from high q fits is increasing with “Shear Induced Mixing”
Low q (< 4 10-2 Å-1): S(q) then with
intermediate scale structure growing (as seen in PS/DOP)? “Shear Induced Demixing”?
But similar low q high scattering for unsheared blend!
Effect of quench?
But we are scanning local flow directions:
incident beam


