EFFECT OF RELATIVE HUMIDITY OF REACTANT GASES ON …
139
EFFECT OF RELATIVE HUMIDITY OF REACTANT GASES ON PROTON EXCHANGE MEMBRANE FUEL CELL PERFORMANCE A THESIS SUBMITTED TO THE GRADUATE SCHOOL OF NATURAL AND APPLIED SCIENCES OF MIDDLE EAST TECHNICAL UNIVERSITY BY BURCU ÖZSAN IN PARTIAL FULFILLMENTS OF THE REQUIREMENTS FOR THE DEGREE OF MASTER OF SCIENCE IN CHEMICAL ENGINEERING MAY 2012
Transcript of EFFECT OF RELATIVE HUMIDITY OF REACTANT GASES ON …

EFFECT OF RELATIVE HUMIDITY OF REACTANT GASES
ON PROTON EXCHANGE MEMBRANE FUEL CELL PERFORMANCE
A THESIS SUBMITTED TO
THE GRADUATE SCHOOL OF NATURAL AND APPLIED SCIENCES OF
MIDDLE EAST TECHNICAL UNIVERSITY
BY
BURCU ÖZSAN
IN PARTIAL FULFILLMENTS OF THE REQUIREMENTS FOR
THE DEGREE OF MASTER OF SCIENCE IN
CHEMICAL ENGINEERING
MAY 2012

Approval of the thesis
EFFECT OF RELATIVE HUMIDITY OF REACTANT GASES ON PROTON EXCHANGE MEMBRANE FUEL CELL
PERFORMANCE Submitted by BURCU ÖZSAN in partial fulfillment of the requirements for the degree of Master of Science in Chemical Engineering Department, Middle East Technical University by, Prof. Dr. Canan Özgen Dean, Graduate School of Natural and Applied Sciences Prof. Dr. Deniz Üner Head of Department, Chemical Engineering Dept. Prof. Dr. İnci Eroğlu Supervisor, Chemical Engineering Dept., METU Examining Committee Members: Prof. Dr. Saim Özkar Chemistry Dept., METU Prof. Dr. İnci Eroğlu Chemical Engineering Dept., METU Prof. Dr. Gülsün Gökağaç Chemistry Dept., METU Prof.Dr. Gürkan Karakaş Chemical Engineering Dept., METU Assistant Prof. Dr. Serkan Kıncal Chemical Engineering Dept., METU
Date: 22.05.2012

iii
I hereby declare that all information in this document has been obtained and presented in accordance with academic rules and ethical conduct. I also declare that, as required by these rules and conduct, I have fully cited and referenced all material and results that are not original to this work.
Name, Last Name : Burcu ÖZSAN
Signature :

iv
ABSTRACT
EFFECT OF RELATIVE HUMIDITY OF REACTANT GASES ON PROTON
EXCHANGE MEMBRANE FUEL CELL PERFORMANCE
Özsan, Burcu
M.Sc., Department of Chemical Engineering
Supervisor: Prof. Dr. İnci Eroğlu
May 2012, 119 pages
Fuel cells are expected to play a major role in the economy of this century and for
the foreseeable future. The use of hydrogen and fuel cells can address critical
challenges in all energy sectors like commercial, residential, industrial, and
transportation. Fuel cells are electrochemical devices that convert energy of a
chemical reaction directly into electrical energy by combining hydrogen fuel with
oxygen from air. If hydrogen is used as fuel, only byproducts are heat and water.
The objective of this thesis is to investigate the effect of operating temperature
and relative humidity (RH) of reactant gases on proton exchange membrane
(PEM) fuel cell performance by adjusting the operation temperature of the fuel
cell and humidification temperature of the reactant gases.
In this study, the effect of the different operating parameters on the performance
of single proton exchange membrane (PEM) fuel cell have been studied
experimentally using pure hydrogen on the anode side and air on the cathode side.
Experiments with different fuel cell operating temperatures, different air and
hydrogen humidification temperatures have been carried out. The experimental
results are presented in the form of polarization curves, which show the effects of
the various operating parameters on the performance of the PEM fuel cell. The
polarization curves data have been fit to a zero dimensional model, and the effect

v
of the fuel cell operation and humidification temperatures on the kinetic
parameters and the cell resistance have been determined.
The fuel cell has been operated with 1.2 and 2 stoichiometry ratio for hydrogen
and air, respectively. Fuel cell performance was detected at different fuel cell
operation temperatures changing from 60 to 80 ºC, and relative humidity of the
entering gases changing from 20 to 100 % for air and 50 % and 100 % for
hydrogen. Tests were performed in a PEM fuel cell test station.
The highest performance of 275 mA/cm2 at 0.6 V and 650 mA/cm2 at 0.4 V was
obtained for 50 % RH air with a constant 100 % relative humidity of hydrogen
for working at atmospheric pressure and 60 oC fuel cell temperature. However,
the highest performance of 230 mA/cm2 at 0.6 V for 50 % RH of air with a
constant 100 % relative humidity of hydrogen and the highest performance of 530
mA/cm2 at 0.4 V for both 70 % RH and 100% RH air with a constant 100 %
relative humidity of hydrogen was obtained for working at atmospheric pressure
and 70 oC fuel cell temperature. Besides, the highest performance of 200 mA/cm2
at 0.6 V and 530 mA/cm2 at 0.4 V was obtained for 100 % RH air with a constant
100 % RH of hydrogen for working at atmospheric pressure and 80 oC fuel cell
temperature.
Keywords: Proton exchange membrane, fuel cell, zero-D model, polarization
curve, water management, membrane electrode assembly

vi
ÖZ
REAKTANT GAZLARIN BAĞIL NEMİNİN PROTON DEĞİŞİM ZARLI
YAKIT PİLİ PERFORMANSI ÜZERİNDEKİ ETKİSİ
Özsan, Burcu
Yüksek Lisans., Kimya Mühendisliği Bölümü
Tez Yöneticisi: Prof. Dr. İnci Eroğlu
Mayıs 2012, 119 sayfa
Yakıt hücrelerinin bu yüzyılın ekonomisinde ve öngörülebilir gelecekte önemli bir
rol oynaması beklenmektedir. Hidrojen ve yakıt pillerinin kullanımı ticari, konut,
sanayi ve ulaşım gibi tüm enerji sektörlerinde kritik sorunların çözümünde
alternatif olarak düşünülebilir. Yakıt hücreleri, havadaki oksijen ile hidrojen
yakıtını birleştirerek kimyasal enerjiyi doğrudan elektrik enerjisine dönüştüren
elektrokimyasal cihazlardır. Hidrojen yakıt olarak kullanılır ise, tek yan ürün
olarak ısı ve su açığa çıkmaktadır.
Bu tezin amacı, yakıt pili işletim sıcaklığı ve reactant gazların bağıl neminin yakıt
pili performansı üzerindeki etkilerini, yakıt pili ve reaktant gazların nemlendirilme
sıcaklıklarını ayarlayarak incelemektir.
Bu çalışmada, tek hücreli proton değişim zarlı (PEM) yakıt hücresinde, anot
tarafında yakıt olarak hidrojen, katot tarafında ise hava kullanılarak farklı
işletim parametrelerinin etkisinin hücre performansı üzerindeki etkisi deneysel
olarak incelenmiştir. Farklı hücre işletim sıcaklığı, farklı anot ve katot
nemlendirme sıcaklıkları denemeleri gerçekleşirilmiştir. Deneysel sonuçlar, farklı
işletim parametrelerinin etkisini gösterebilmek adına polarizasyon eğrileri
şeklinde gösterilmiştir. Polarizasyon eğrisi verileri sıfırıncı dereceden bir modele

vii
uydurulmuş ve yakıt hücresi işletim ve nemlendirme sıcaklıklarının, kinetik
parametreler ve hücre direnci üzerindeki etkisi belirlenmiştir.
Yakıt hücresinde sırasıyla hidrojen için 1.2 ve hava için 2 stokiyometrik oranı
kullanılmıştır. Yakıt hücresi performansı 60 ile 80 ºC arasında değişen hücre
işletim sıcaklıklarında ve hava tarafı için 20 ile 100 % arasında değişen ve
hidrojen tarafı için ise % 50 ve % 100 nemlilik derecelerinde yakıt hücresi test
istasyonunda deneyler gerçekleştirilmiştir.
60 oC hücre işetim sıcaklığı ve atmosferik basınçta en yüksek performans hidrojen
tarafı % 100 bağıl nemlilik derecesinde iken, akım yoğunluğu 0.6 V’da 275
mA/cm2 ve 0.4 V’da 650 mA/cm2 olarak % 50 hava bağıl nemlilik dercesinde
elde edilmiştir. Bunun yanında, en yüksek performans hidrojen tarafı yine % 100
bağıl nemlilik derecesinde iken, akım yoğunluğu 0.6 V’da 230 mA/cm2 olarak %
50 hava bağıl nem oranında, 0.4 V’da ise 530 mA/cm2 olarak hem % 70 hemde %
100 hava nemlilik derecelerinde elde edilmiştir. 80 oC hücre işletim sıcaklığında
ise en yüksek performans % 100 hidrojen nemlilik derecesinde, akım yoğunluğu
0.6 V’ da 200 mA/cm2 ve 0.4 V’da 530 mA/cm2 olarak % 100 hava nemlilik
derecesinde elde edilmiştir.
Anahtar Kelimeler: Proton değişimli membran, yakıt pili, 0-D model,
polarizasyon eğrisi, su yönetimi, membran elektrot grubu

viii
To my family

ix
ACKNOWLEDGMENTS
I would like to express my sincere gratitude to my supervisor Prof. Dr. İnci Eroğlu
for her guidance, criticism, encouragements and also sharing her immense
knowledge with me throughout the research. Also, I’m grateful for her support in
completing my study.
I thank Dr. Berker Fıçıcılar for helping me to gain abilities on fuel cell testing,
emphasizing very strong discussions on fuel cell engineering approaches and
guiding on problem solving. Also, I’m grateful for his encouragements even in my
hard times.
This study was supported by TR Teknoloji. I would like to thank for their
financial support. I would like to express thanks to friends, and colleagues for
their understanding and support.
Many thanks to Şefika Can for her support and encouragement.
I am very grateful to my family for their infinite support and help. I am forever
grateful for the support and motivation from my family. I owe it all to my mother
Fatma, my father İsmail and my brother Utku for inspiring me to get to where I
am today.

x
TABLE OF CONTENTS
ABSTRACT ........................................................................................................... iv
ÖZ .......................................................................................................................... vi
ACKNOWLEDGMENTS ....................................................................................... ix
TABLE OF CONTENTS ......................................................................................... x
LIST OF TABLES ................................................................................................ xiii
LIST OF FIGURES ...............................................................................................xiv
LIST OF SYMBOLS ......................................................................................... .xivii
LIST OF ABBREVIATIONS .................................................................................xx
CHAPTERS
1 INTRODUCTION ........................................................................................... 1
2 LITERATURE SURVEY ................................................................................ 4
2.1 Fuel Cells .................................................................................................. 4
2.2 PEM Fuel Cells .......................................................................................... 7
2.3 PEM Fuel Cell Components ....................................................................... 8
2.3.1 Membrane........................................................................................ 8
2.3.2 Electrodes ........................................................................................ 9
2.3.3 Gas Diffusion Layer ......................................................................... 9
2.3.4 Bipolar Plates ..................................................................................10
2.4 Fuel Cell Electrochemistry and Polarization Curve ...................................10
2.4.1 Open Circuit Voltage ......................................................................10
2.4.2 Polarization Curve and Voltage Losses............................................11
2.4.2.1 Polarization Curve ..............................................................11
2.4.2.2 Voltage Losses ...................................................................12
2.5 Fuel Cell Operating Conditions .................................................................13
2.5.1 Operating Pressure ..........................................................................14
2.5.2 Operating Temperature....................................................................14
2.5.3 Reactants Flow Rate ........................................................................14
2.5.4 Reactant Humidity ..........................................................................15
xi
2.6 Water Management ...................................................................................16
2.6.1 Water Transport and Balance ..........................................................17
2.6.1.1 Electro Osmotic Drag ........................................................20
2.6.1.2 Back Diffusion ..................................................................23
2.6.1.3 Pressure Driven Hydraulic Permeation ...............................23
2.6.2 Net Water Drag ...............................................................................24
2.6.3 Humidification Effect on Net Water Transport ................................27
2.7 Fuel Cell Modeling ...................................................................................29
2.7.1 Zero-D Model .................................................................................34
3 EXPERIMENTAL ..........................................................................................41
3.1 Materials ...................................................................................................41
3.2 Experimental Setup ...................................................................................41
3.2.1 Fuel Cell Test Station ......................................................................41
3.2.2 Fuel Cell Testing Unit .....................................................................46
3.2.3 Membran Electrode Assembly (MEA) ............................................47
3.3 Experimental Procedure ............................................................................48
3.3.1 Performance Procedure ...................................................................49
3.3.2 Polarization Curve Procedure ..........................................................49
3.4 Scope of the Experiments..........................................................................49
4 RESULTS AND DISCUSSION ......................................................................52
4.1 Performance of PEM Fuel Cell at Different Temperatures ........................52
4.1.1 Performance at 60 °C.......................................................................52
4.1.2 Performance at 70 °C ......................................................................55
4.1.3 Performance at 80 °C ......................................................................61
4.1.4 Performance Comparison at 70 °C and 80 °C ...................................65
4.1.5 Water Balance .................................................................................65
4.2 Comparison of Performance Curve with Zero-D (Butler-Volmer) Model ..73
5 CONCLUSION AND RECOMMENDATIONS .............................................85
REFERENCES .......................................................................................................87
APPENDICES
A EXPERIMENTAL DATA..............................................................................93
B MODELING RESULTS .................................................................................98

xii
C SAMPLE CALCULATIONS ....................................................................... 107

xiii
LIST OF TABLES
TABLES
Table 2.1 Comparison of fuel cell types (Barbir, 2005) ............................................ 5
Table 2.2 Comparison of the selected EOD coefficients in PEMFCs .......................22
Table 2.3 Comparison of selected net drag coefficients in PEMFCS .......................26
Table 2.4 Comparison of recent mathematical models .............................................33
Table 3.1 Description of the heaters shown in schematic representation of fuel cell
test station ...............................................................................................................41
Table 3.2 Commercial PEM MEA (Paxitech) specifications....................................48
Table 3.3 Test conditions of performed experiments with commercial PEM MEA,
H2 flow rate 0.3 slpm, air flow rate 1slpm ...............................................................50
Table 4.1 OCV values at 60 °C PEMFC, air flow rate 1 slpm, H2 flow rate 0.3
slpm ........................................................................................................................53
Table 4.2 OCV values at 70 °C PEM fuel cell, air flow rate 1 slpm, H2 flow rate
0.3 slpm ..................................................................................................................55
Table 4.3 OCV values at 80 °C PEM fuel cell, air flow rate 1 slpm, H2 flow rate
0.3 slpm ..................................................................................................................62
Table 4.4 Inlet and outlet water flow rates ...............................................................72
Table 4.5 Model parameters ....................................................................................79
Table A.1 Polarization curve data obtained at 60 °C ................................................93
Table A.2 Polarization curve data obtained at 70 °C ................................................94
Table A.3 Polarization curve data obtained at 80 °C ................................................96

xiv
LIST OF FIGURES
FIGURES
Figure 2.1 A single PEM fuel cell configuration (Ji and Dai, 2009) ...................... 8
Figure 2.2 Typical polarization curve of PEM fuel cell ..................................... 11
Figure 2.3 PEM fuel cell polarization curve ....................................................... 13
Figure 2.4 Membrane proton conductivity as a function of gas humidification at
different temperatures for Nafion membrane (Schmidt-Rohr and Chen, 2008) ... 18
Figure 2.5 Water transport mechanisms in PEMFCs (Dai et al., 2009) ............... 20
Figure 3.1 Schematic representation of fuel cell test station................................ 43
Figure 3.2 Photo of PEM fuel cell test station.................................................... 45
Figure 3.3 The screen shot of data logging software ........................................... 45
Figure 3.4 The screen shot of data logging software ........................................... 46
Figure 3.5 Photo of test PEM fuel cell (PaxiTech) .............................................. 47
Figure 3.6 Commercial PEM MEA (Paxitech) ................................................... 48
Figure 4.1 Cell potential vs. current density at 60 o C cell temperature, 100 % RH
of H2 .................................................................................................................. 53
Figure 4.2 Power density vs. current density at 60 oC cell temperature, 100 % RH
of H2 .................................................................................................................. 54
Figure 4.3 Current density vs. cell potential at 70 oC cell temperature and 100 %
RH of H2 ............................................................................................................ 57
Figure 4.4 Power density vs. current density at 70 oC cell temperature and 100 %
RH of H2 ............................................................................................................ 57
Figure 4.5 Current density vs. cell potential at 70 oC cell temperature, 70 % RH of
air ...................................................................................................................... 60
Figure 4.6 Current density vs. power density at 70 oC cell temperature, 70 % RH
of air .................................................................................................................. 61
Figure 4.7 Current density vs. cell potential at 80 oC cell temperature, 100 % RH
of H2 .................................................................................................................. 63
xv
Figure 4.8 Power density vs. current density at 80 oC cell temperature, 100 % RH
H2 ...................................................................................................................... 63
Figure 4.9 Current density vs. cell potential at 80 oC cell temperature, 100 % RH
air and 50-100 % RH H2 .................................................................................... 64
Figure 4.10 Current density vs. power density at 80 oC cell temperature, 100 %
RH air and 50-100 % RH H2 .............................................................................. 65
Figure 4.11 Polarization curves for different fuel cell temperatures. The H2 and air
are fully saturated .............................................................................................. 66
Figure 4.12 Polarization curves for different fuel cell temperatures. The H2 and
air humidification temperatures are equal to the fuel cell temperature ................ 66
Figure 4.13 Comparison of the modeling results with the experimental data for
polarization curve at 70 °C, 100 % RH air, 100 % RH H2 ................................. 75
Figure 4.14 Comparison of the modeling results with the experimental data for
polarization curve at 70 °C, 70 % RH air, 50 % RH H2 ..................................... 76
Figure 4.15 Internal resistances at different cell temperatures and relative
humidity of reactants.......................................................................................... 81
Figure 4.16 Transfer coefficients at different cell temperatures and relative
humidity ............................................................................................................ 82
Figure 4.17 Limiting current density at different cell temperatures and relative
humidity ............................................................................................................ 83
Figure B.1 Comparison of the model with experimental polarization data obtained
at 60 oC, 30 % RH air, 100 % RH H2 ................................................................. 99
Figure B.2 Comparison of the model with experimental polarization data obtained
at 60 oC, 50 % RH air, 100 % RH H2 ............................................................... 100
Figure B.3 Comparison of the model with experimental polarization data obtained
at 70 oC, 20 % RH air, 100 % RH H2 ............................................................... 100
Figure B.4 Comparison of the model with experimental polarization data obtained
at 70 oC, 30 % RH air, 100 % RH H2 ............................................................... 101
Figure B.5 Comparison of the model with experimental polarization data obtained
at 70 oC, 50 % RH air, 100 % RH H2 ............................................................... 101
Figure B.6 Comparison of the model with experimental polarization data obtained
at 70 oC, 70 % RH air, 100 % RH H2 ............................................................... 102

xvi
Figure B.7 Comparison of the model with experimental polarization data obtained
at 70 oC, 100 % RH air, 100 % RH H2 ............................................................. 102
Figure B.8 Comparison of the model with experimental polarization data obtained
at 80 oC, 20 % RH air, 100 % RH H2 ............................................................... 103
Figure B.9 Comparison of the model with experimental polarization data obtained
at 80 oC, 30 % RH air, 100 % RH H2 ............................................................... 103
Figure B.10 Comparison of the model with experimental polarization data
obtained at 80 oC, 50 % RH air, 100 % RH H2 ................................................. 104
Figure B.11 Comparison of the model with experimental polarization data
obtained at 80 oC, 70 % RH air, 100 % RH H2 ................................................. 104
Figure B.12 Comparison of the model with experimental polarization data
obtained at 80 oC, 100 % RH air, 100 % RH H2 ............................................... 105
Figure B.13 Comparison of the model with experimental polarization data
obtained at 70 oC, 70 % RH air, 50 % RH H2 ................................................... 105
Figure B.14 Comparison of the model with experimental polarization data
obtained at 80 oC, 100 % RH air, 50 % RH H2 ................................................. 106
Figure C.1 Polarization curve obtained from Paxitech ...................................... 119

xvii
LIST OF SYMBOLS
Latin Letters
CB : Bulk concentration of reactant mol/cm3
Cox : Surface concentration of the reacting species mol /cm3
CRd : Surface concentration of reacting species mol/cm3
Cs : Surface concentration of reactant on catalyst mol/cm3
E : Potential Volt
F : Faraday’s constant C/mol
h : Planck's constant m2kg/s
I : Current Amper
iL : Limiting current density A/cm2
io : Exchange current density A/cm2
j : Flux of reactant per unit area mols-1cm-2
kb : Backward reaction (oxidation) rate coefficient
Kb : Boltzmann's constant
kf : Forward reaction (reduction) rate coefficient
mi : Mass flow rate of reactant I g/ min
Mi : Molecular weight of species i g/mol
n : Number of electrons transferred in the overall reaction
P : Pressure kPa
PH2O : Partial pressure of water vapor kPa
PH2Osat : Saturation pressure of water vapor kPa
Pν : Water vapor pressure kPa
Pνs : Saturation vapor pressure kPa
R : Universal gas constant j/molK
Ri : Total cell internal resistance Ωcm2
slpm : Standard liter per minute
sml : Standard mili liter

xviii
T : Temperature oC
V : Volt
Vi : Volumetric flow rate of reactant i slpm
Greek Letters
∆G : Gibbs free energy J/mol
∆H : Enthalpy change of reaction J/mol
∆S : Entropy change of reaction J/molK
ηa : Anode over potential V
ηc : Cathode over potential V
λ : Water content in the electrolyte
ρg : Density of gas phase g/cm3
ρw : Density of the liquid water g/cm3
φ : Relative humidity
φan : Relative humidity of anode
φca : Relative humidity of cathode
ξ : Electro osmotic drag coefficient
β : Back diffusion coefficient
α : Transfer coefficient
β : Symmetry factor
ν : Stoichiometry number
Superscripts
an : Anode
ca : Cathode
sat : Saturation
Subscripts
B : Bulk
b : Backward

xix
Ch : Chemical component of the Gibbs free energy
f : Forward
g : Gas phase
I : Gas or liquid species
l : Liquid phase
ox : Oxidation
Rd : Reduction
s : Saturation
w : Liquid water
vs : Saturated vapor

xx
LIST OF ABBREVIATIONS
ABBREVIATIONS
AFC Alkaline fuel cells
BD Back diffusion
DMFC Direct methanol fuel cell
EOD Electro osmotic drag
GDL Gas diffusion layer
HOR Hydrogen oxidation reaction
HTR Heater
KOH Potassium hydroxide
MCFC Molten carbonate fuel cells
MEA Membrane electrode assembly
NDC Net drag coefficient
OCV Open circuit voltage
OFC Solid oxide fuel cells
ORR Oxygen reduction reaction
PAFC Phosphoric acid fuel cells
PEM Polymer electrolyte membrane
PEMFC Polymer electrolyte membrane fuel cells
PTFE Polytetrafluoroethylene
RH Relative humidity

1
CHAPTER 1
INTRODUCTION
Energy has been predicted as one of the main problem that humanity must face in
the future. Nowadays, primary energy sources in the world consist of fossil fuels
including petroleum, coal and natural gas. However, there are some problems with
continued use of fossil fuels. They are limited in amount and someday will be
depleted. They are causing serious environmental problems, such as global
warming, climate changes, acid rains, air pollution, ozone layer depletion, and so
on. For these reasons, alternative energy sources are needed. In these sense
combined with fuel cells hydrogen energy systems is a good alternative.
Hydrogen is a perfect energy carrier with many unique properties. Together with
hydrogen, fuel cells have been getting a lot of attention because they directly and
efficiently convert chemical energy of reactants into electrical energy.
Fuel cell is an electrochemical device that convert a chemical reaction energy
directly into electrical energy by combining hydrogen with oxygen. In these
chemical reactions, only byproducts are heat and water. Fuel cells have many
advantages over conventional systems that produce electricity. They have higher
efficiency than conventional system.
Within many types of fuel cells, proton exchange membrane (PEM) fuel cells are
spectacular because of its compactness, light weight, high power and low cost
(Rodríguez et al., 2009). They have been noticed as the most promising power
generating device candidates in portable electronic, automotive and distributed
power generation applications in future (Ceraolo et al., 2003).

2
In recent years, research and development activities in fuel cells have been
accelerated. Although, there are significant improvements in the technology of
proton exchange membrane, the performance, stability, and reliability is not
sufficient to replace internal combustion engines and the cost of fuel cell
systems is still too high to become acceptable commercial products. The most
important problems to be overcome are improvement of their performance and
reduction of their cost (Youssef et al., 2010).
In PEM fuel cells, hydrogen and air humidification may be required in order
to prevent the fuel cell membrane from dehydration. At high current flow, there
is ohmic heating causing drying problems in the polymer membrane and slows
ionic transport through the membrane. Because of water generation at the air
side, in some fuel cell stacks, humidification is not required. In general fuel cell
systems, humidification is required for either the air or hydrogen or both the air
and hydrogen at the fuel cell inlets. Water content is very important for the
protonic conductivity in proton exchange membranes. If membrane dehydration
or drying occurs, the electrical performance decreases due to significant ohmic
losses (Zawodzinski et al., 1993).
In METU Chemical Engineering Fuel Cell Technology Laboratory Research
Group, development of different carbon support for proton exchange membrane
fuel cell electro catalysts (Güvenatam et al., 2012) preparation and performance of
membrane electrode assemblies with Nafion and alternative polymer electrolyte
membranes (Devrim et al., 2012) electro catalyst development (Bayrakçeken et
al., 2008a), effect of components of membrane electrode assembly on PEM fuel
cell performance (Bayrakçeken et al., 2008b) and modeling of nonisothermal two-
phase flow for PEM fuel cells (Fıçıcılar et al., 2010) were investigated. However,
in these studies reactant gases were saturated so the effect of relative humidity of
reactant gases on PEM fuel cell performance has not been studied.
The objective of this thesis is to investigate the effect of operating temperature
and relative humidity (RH) of reactant gases on proton exchange membrane

3
(PEM) fuel cell performance by setting the operation temperature of the fuel cell
and humidification temperature of the reactant gases. In this study, performance
of a single proton exchange membrane (PEM) fuel cell have been studied
experimentally using pure hydrogen and air on the anode and cathode side,
respectively. Experiments with different fuel cell operating temperatures, different
air and hydrogen humidification temperatures have been carried out. The
experimental data are presented in the form of polarization curves, which show
the effects of the various operating parameters on the performance of the PEM
fuel cell. The experimental data have been fit to a zero dimensional model, and
the effect of the fuel cell operation and humidification temperatures on the kinetic
parameters and the cell resistance have been determined.

4
CHAPTER 2
LITERATURE SURVEY
2.1 Fuel Cells
Fuel cell is an electrochemical device that convert chemical energy of reactants
directly into electrical energy. In some ways a fuel cell is similar to a battery. It
has an electrolyte with negative and positive electrodes. Unlike in a battery, a fuel
cell generates DC electricity by electrochemical reactions as long as the fuel and
oxidant are supplied (Barbir, 2005).
In 1839, Sir William Grove first discovered the operating principle of the typical
fuel cell and stated that gaseous fuels could generate electricity (Barbir, 2005).
Comparison of fuel cell types are listed in Table 2.1.

Table 2.1 Comparison of fuel cell types (Barbir, 2005)
Type PEMFC AFC PAFC MCFC SOFC DMFC
Electrolyte Ion exchange membrane
Mobilized or Immobilized Potassium Hydroxide
Mobilized Liquid Phosphoric Acid
Mobilized Liquid Molten Carbonate Ceramic Ion exchange
membrane
Mobile ion H+ OH- H+ CO32- O2- H+
Fuel H2, reformate H2 H2, reformate H2, CO, CH4, H2, CO, CH4, Methanol,
ethanol Catalyst Platinum Platinum Platinum Nickel Perovskites Platinum
Operating temperature 60-80 ºC 65-225 ºC ~ 200 ºC ~ 650 ºC 800-1000ºC 80 ºC
Efficiency 25-35% 32-40% 35-45% 40-60% 45-55% ~ 20% Power density 3.8-2.6 W/cm2 0.7-8.1 W/cm2 0.8-1.9 W/cm2 0.1-1.5 W/cm2 1.5-2.6 W/cm2 ~ 0.6 W/cm2 Startup times sec-min Min Hours Hours Hours sec-min
Applications Electric utility portable power transportation
Military space Electric utility transportation Electric utility Electric utility Portable power
transportation
Stage of development
Commercially available In use since 1960s Commercially
available Demonstration Prototype Prototype
Advantages Low corrosion low temperature Quick
startups
Air reaction is faster in alkaline
electrolyte
Impure H2 acceptable Less Pt
needed
No noble metals needed Efficiency is improved
Less Pt needed Low corrosion Fuel flexibility
High eff.
Direct feed of fuel Zero emission
Disadvantages Cost of catalyst
sensitivity to fuel impurities
Expensive removal of CO2
from fuel
Cost of catalyst Low power Large
size
Thermal effects on cell component Corrosion
low power
Thermal effects on cell component
Higher system complexity
5
6
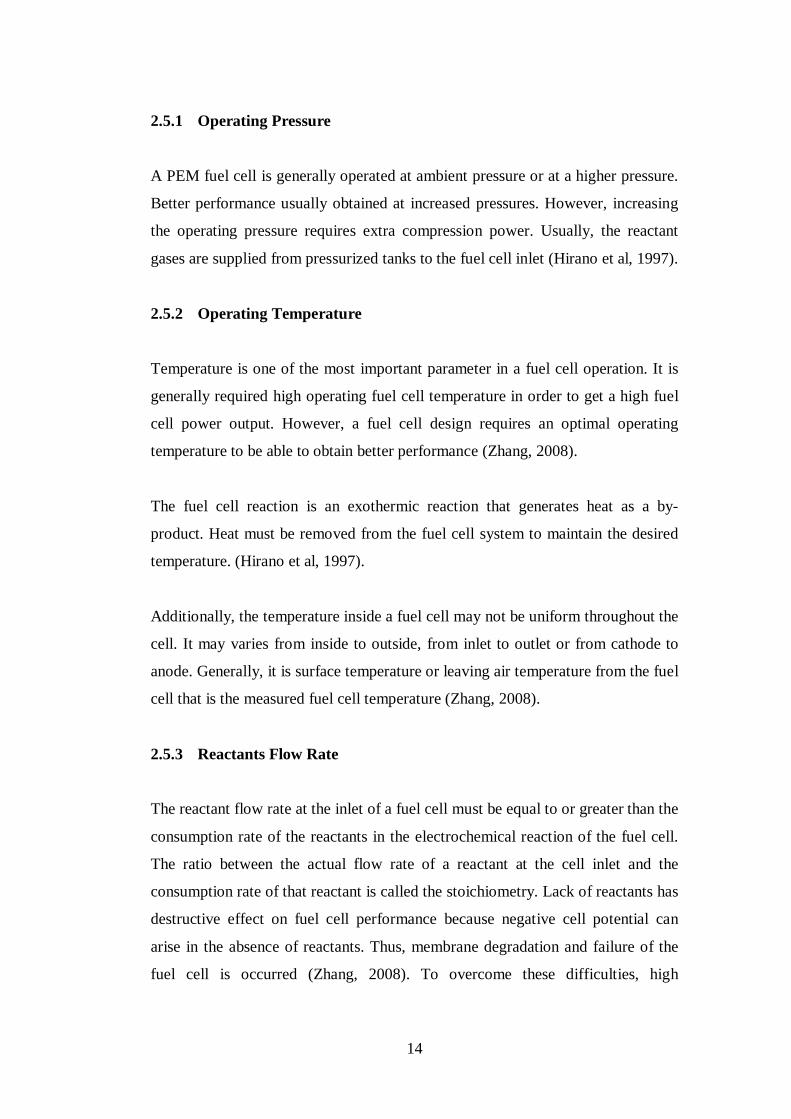
Fuel cells are grouped according to type of electrolyte used in, namely (Zhang,
2008):
Proton Exchange Membrane Fuel Cells (PEMFC): A thin polymeric membrane is
used as electrolyte. Typically, platinum catalyst supported on carbon is used with
loadings of about 0.3 mg/cm2. Generally operating temperature is between 60 °C
and 80 ˚C. PEM fuel cells are used mainly in automotive applications together
with portable and small scale distributed stationary power generation
applications.
Alkaline fuel cells (AFC): Concentrated KOH is used as electrolyte for high
operation temperature (250 ˚C) and less concentrated (30-50 wt %) for lower
operation temperature (<120 ˚C). A wide range of catalysts like
Ag, Ni, noble metals and metal oxides can be used with an electrolyte matrix that
is usually asbestos. It is not tolerant to CO2 existing in either fuel or oxidant.
Alkaline fuel cells have been used in the space program (Apollo and Spave
Shuttle) since the 1960.
Molten carbonate fuel cells (MCFC): Combination of alkali (K, Na, Li)
carbonates, which is preserved in a ceramic matrix of LiAlO2 is used as
electrolyte. Operating temperature is generally quite high between 600 °C and 700
˚C where the carbonates form a highly conductive molten salt, with carbonate ions
providing ionic conduction. It is in the demonstration stage for stationary power
applications.
Solid oxide fuel cells (SOFC): Solid, nonporous metal oxide, usually Y2O3-
stabilized ZrO2 (YSZ) is used as the electrolyte. This type of fuel cells operate at
800 to 1000 ˚C where ionic transport actualized. Like MCFC, these fuel cells are
in the demonstration stage for stationary power generation, although smaller units
are being developed for portable power and auxiliary power in automobiles.

7
Phosphoric acid fuel cells (PAFC): Concentrated phosphoric acid used as the
electrolyte. Usually, electro catalyst for both H2 and air is platinum. Operating
temperature is generally between 150 and 220 ˚C. They are already semi
commercially available in container packages (200 kW) for stationary electricity
generation.
2.2 PEM Fuel Cells
Due to PEM fuel cells’ high-energy density at low operating temperatures, zero
emissions and quick start-up, proton exchange membrane fuel cells (PEMFC) are
considered as a possible solution to environmental and energy problems, and are
expected to become the most promising energy supplier for automotive, stationary
and portable applications (Ji and Dai, 2009).
Figure 2.1 shows a process schematic of a PEMFC. Hydrogen is supplied from
anode side to the fuel cell as fuel. When it contact with the anode catalyst layer it
oxidized to electrons flowing through the external circuit and protons flowing
through fuel cell membrane to the cathode side where they combine with the
oxidant O2 to produce water and heat (Ji and Dai, 2009).

8
Figure 2.1 A single PEM fuel cell configuration (Ji and Dai, 2009)
2.3 PEM Fuel Cell Components
The design of the components and properties of materials must accommodate the
above-listed processes with minimum obstruction and losses. Because in some of
the components more than one process takes place, very often with conflicting
requirements, the properties and the design must be optimized. Although a fuel
cell seems to be a very simple device, numerous processes take place
simultaneously. It is therefore important to understand those processes, their
mutual interdependence, and their dependence on components design and
materials properties (Barbir, 2005).
2.3.1 Membrane
In PEM fuel cells, membrane mainly transport protons from the anode to the
cathode; sulfuric group in polymeric membrane activate the transport of protons.

9
Membrane also keeps the hydrogen and air separated, so this prevents mixing of
the gases. That means, the ideal membrane must have sufficient proton
conductivity, thermal and chemical stability, low gas permeability, strength, water
drag, good availability and cost. The membranes are generally polymers modified
to contain ions, such as sulfuric groups. These hydraulic groups allows proton
transport across the membrane. Additionally, determining the lifetime of the fuel
cell, the lifetime of the membrane is very important. Although thinner membrane
increases proton conductivity and so improves the fuel cell performance,
membrane mechanical resistance is weaker and cause degradation problems
(Zhang, 2008).
2.3.2 Electrodes
A fuel cell electrode is a thin catalyst layer pressed between porous, electrically
conductive substrate and the polymer membrane where the electrochemical
reactions take place. Electrons travel through electrically conductive substrate,
including the catalyst. Protons travel through polymer membrane and the reactant
gases travel only through voids (Barbir, 2005).
2.3.3 Gas Diffusion Layer
One of the main components in proton exchange membrane fuel cells is gas
diffusion layer. Its primary function is to diffuse the gases. Effective diffusion of
each reactant gases to the catalyst layer is facilitated by the porous structure of the
backing material. Its material is generally carbon cloth or carbon paper. The other
function of the gas diffusion layer is being an electrical connection between
bipolar plates and catalyst layer. Additionally, it helps in managing water that
produced as a result of electrochemical reactions (Saab et al, 2002).

10
2.3.4 Bipolar Plates
Bipolar plates in fuel cell have many functions such as supplying reactant gases to
the fuel cell by gas flow channels, keeping electrical connection between the
individual cells. Gas flow channels design are critical parameters for fuel cell
performance because reactants distribution to the fuel cell is partially depend on
this configurations (Pantea et al, 2001). And also they must remove the water
produced as a result of electrochemical reactions at the cathode side effectively
(Wang, 2003). Bipolar plates must have high chemical stability due to acidic
environments and corrosion resistance.
2.4 Fuel Cell Electrochemistry and Polarization Curve
2.4.1 Open Circuit Voltage
Exterior with the movement of free electrons between the electrodes of anode and
cathode, electric current is obtained. Direct current output of the cell over
electrode surface area is called current density (Barbir, 2005).
Theoretical hydrogen/air fuel cell potential is 1.23 V at standard conditions. But,
it is generally lower than that theoretical fuel cell potential and this potential is
known as open circuit voltage (OCV).
H2 → 2H+ + 2e− (Er = 0 V) (2.1)
1 2⁄ O2 + 2e− → H2O (Er = 1.23 V) (2.2)
Combined effects of internal short, fuel crossover and parasitic oxidation
reactions of air side contribute to the drops the fuel cell voltage (Zhang, 2008).
These additional losses in a typical fuel cell occur because of internal electrical
and ionic resistances, the kinetics of the electrochemical reactions, internal
currents and crossover of reactants and difficulties in transport of the reactants to
reaction sites (Barbir, 2005).

11
The design of the fuel cell stack includes lots of parameters and requires a detailed
optimization study. Actually, materials structure and properties, configurations,
operating conditions such as pressure regulation, gas flow rates and water and
heat management affect fuel cell power output (Zhang, 2008).
2.4.2 Polarization Curve and Voltage Losses
2.4.2.1 Polarization Curve
A polarization curve is used as a standard electrochemical technique for
characterizing the fuel cell performance. It is a plot of cell current density against
cell potential under a set of constant operating conditions such as system
temperature, pressure, humidification, and gas stoichiometry. Polarization curve
gives information about the performance losses in the fuel cell under these
operating conditions (Zhang, 2008). A typical polarization curve is shown in
Figure 2.2. Generally, polarization curves are converted to power density versus
current density curves by multiplying the fuel cell potential by the current density
at each point of the curve, also seen in Figure 2.2.
Figure 2.2 Typical polarization curve of PEM fuel cell

12
2.4.2.2 Voltage Losses
The fuel cell voltage losses are classified into three categories: the concentration
loss (concentration polarization), the ohmic loss (ohmic polarization), and the
activation loss (activation polarization). Plots of voltage drops caused by each of
the losses are shown in Figure 2.3.
The cell potential drops sharply and the majority of these losses are due to the
sluggish kinetic of the oxygen reduction reaction (ORR) at low current densities
(the region of activation polarization) (Hirano et al, 1997). At intermediate current
densities (the region of ohmic polarization), the voltage loss caused by ohmic
resistance becomes significant and results mainly from resistance to the flow of
ions in the electrolyte and resistance to the flow electrons through the electrode
(Zhang, 2008). In this region, the cell potential decreases nearly linearly with
current density, while the activation over potential reaches a relatively constant
value (Hirano et al, 1997). At high current densities (the region of concentration
polarization), mass transport effects dominate due to the transport limit of the
reactant gas through the pore structure of the GDLs and electro catalyst layers,
and cell performance drops drastically (Zhang, 2008).

13
Figure 2.3 PEM fuel cell polarization curve
The output voltage of a single cell, Ecell, can be defined as follows:
Ecell = EOCV − ∆Eact − ∆Eohmic − ∆Econ (2.3)
Where Ecell is the voltage for a certain operating condition, EOCV represents the
fuel cell theoretical voltage, ∆Eact is the voltage drop associated with the activation
of the H2 and of the air, ∆Eohmic is the ohmic voltage drop associated with the
conduction of protons and electrons, and ∆Econ is the voltage drop resulting from
the decrease in the concentration of air and hydrogen.
2.5 Fuel Cell Operating Conditions
A fuel cell power output depends on mainly material properties, cell structure and
design, operating conditions. These are gas flow rate, pressure, water and heat
management. High power output of a PEM fuel cell requires optimal membrane
hydration, temperature and reactants partial pressure (Zhang, 2008).
14
2.5.1 Operating Pressure
A PEM fuel cell is generally operated at ambient pressure or at a higher pressure.
Better performance usually obtained at increased pressures. However, increasing
the operating pressure requires extra compression power. Usually, the reactant
gases are supplied from pressurized tanks to the fuel cell inlet (Hirano et al, 1997).
2.5.2 Operating Temperature
Temperature is one of the most important parameter in a fuel cell operation. It is
generally required high operating fuel cell temperature in order to get a high fuel
cell power output. However, a fuel cell design requires an optimal operating
temperature to be able to obtain better performance (Zhang, 2008).
The fuel cell reaction is an exothermic reaction that generates heat as a by-
product. Heat must be removed from the fuel cell system to maintain the desired
temperature. (Hirano et al, 1997).
Additionally, the temperature inside a fuel cell may not be uniform throughout the
cell. It may varies from inside to outside, from inlet to outlet or from cathode to
anode. Generally, it is surface temperature or leaving air temperature from the fuel
cell that is the measured fuel cell temperature (Zhang, 2008).
2.5.3 Reactants Flow Rate
The reactant flow rate at the inlet of a fuel cell must be equal to or greater than the
consumption rate of the reactants in the electrochemical reaction of the fuel cell.
The ratio between the actual flow rate of a reactant at the cell inlet and the
consumption rate of that reactant is called the stoichiometry. Lack of reactants has
destructive effect on fuel cell performance because negative cell potential can
arise in the absence of reactants. Thus, membrane degradation and failure of the
fuel cell is occurred (Zhang, 2008). To overcome these difficulties, high

15
stoichiometry gas flow rates and suitable gas flow field designs must be required
for proper flow of gasses (Zhang, 2008).
2.5.4 Reactant Humidity
An important issue in PEM fuel cell systems is water balance and management
that they have a critical effect on lifetime and performance of fuel cell systems.
Reactant humidity is required in order to have a sufficient membrane hydration.
Generally, inlet relative humidity (RH) of reactant gases equal to or less than 100
% during the fuel cell operation. The proton conductivity of the membrane in a
PEMFC is directly proportional to its water content, which depends on the water
carried by the humidified reactant gases. Full hydration of the membrane is
required in order to maintain good proton conductivity from anode side to cathode
side. Membrane hydration can be obtained by giving fully humidified reactant
gases to both the anode and the cathode (Zhang, 2008).
Water transport in a PEM fuel cell membrane is affected by mainly four
mechanisms. These are the water carried by the humidified reactant gases in to the
fuel cell; the water generated as result of electrochemical reaction at the cathode
side; the water carried by the protons from the anode to the cathode which is
called electro osmotic drag; and the water back diffusion from the cathode side to
the anode side. It is apparent that water management in a fuel cell is a critical and
complex issue.
Both the lifetime and performance of the fuel cell are degraded by too much or too
little water. If the membrane is lack of sufficient hydration, membrane proton
conductivity will be decreased. On the other hand, if water is not removed
sufficiently from the fuel cell cathode side, liquid water flooding occurs and that
leads to unpredictable, unreliable, and unrepeatable PEM fuel cell performance
under identical operating conditions. Therefore, achieving a perfect water balance
during dynamic fuel cell operation is essential for fuel cell lifetime and
performance.

16
2.6 Water Management
In PEM fuel cells, it is possible that the PEM fuel cell may need a hydrogen
humidification system in order to prevent dehydrating under the load. As
mentioned before, because of the existence of ohmic heating under high current
flow which makes the polymer membrane dry and also slow ionic transport, in
the PEM fuel cell , water management is a troublesome event. By reason of the
existence of water generation at the air, some of the fuel cell stacks might not
need any humidification. However, it is necessary to humidify air or hydrogen
together or one of them at the fuel inlets when fuel cell systems are larger.
The humidity is contingent upon the partial pressure of vapor in the mixture ,
in case of constant total pressure. Fuel cell performance is affected by operating
temperature, relative humidity of reactant gases, flow rates and pressures of
reactant gases. In order for improving fuel cell performance with regard to
reaction kinetics , water management, catalyst CO tolerance, and heat rejection,
high temperatures are an essential need for PEM fuel cell to be operated. While
the fuel cell is being operated at a high temperature, it is needed to operate at high
relative humidity in order to get a useful performance in PEM fuel cell (Rodríguez
et al., 2009). So as to diminish extra power losses that applied for heating the
reactants to get preferred humidity conditions, commercial applications give
preference to low gas humidity conditions. Yet, the decline of water content in the
PEMFC, which will result in the performance loss, leads to low gas humidity. The
consequences of various feed gas temperatures and humidities were studied to
analyze the performance uniformity of PEMFC (Weng et al., 2008).
The membrane hydration that feels necessity for suitable water management
decides PEM fuel cell performance and durability. These stand for one of the
most important and design issues of PEM fuel cells (Perez et al., 2011). There are
several challenges of water management principally flow-field designs or new
humidification strategies, and membrane electrode assembly designs (Sauriol et
al., 2005). In the event of the ionic conductivity of the proton conducting

17
membranes, water content takes a crucial part. The electrical performance
decreases because of important ohmic losses in the case of membrane dehydration
or drying, (Zawodzinski et al., 1993). The situation that excess of water causes
condensation must be avoided because liquid water blocks the pores of the gas
diffusion layers (GDL). As a result, the transport of reactants are inhibited.
Furthermore, it confines active sites in the catalyst layers and blockade the gas
transport channels in the flow-field plates. As a consequence of water flooding a
non-uniform distribution of reactants over the active catalyst area occurs and this
causes inefficient electrical performances (Maranzana et al., 2008).
2.6.1 Water Transport and Balance
In a PEM fuel cell, the oxygen reduction reaction (ORR) generates water at the air
side and later the reactant gas flow removes it. As water molecules are reacting,
protons drag water molecules through the membrane while they are moving from
the anode to the cathode. Currently used in PEMFCs, perfluorosulfonic acid
(PFSA) membranes are known to be the most popular membrane type. It acts not
only as the separator but also the electrolyte. Many studies such as hydrocarbons
(Lee et al., 2007), aromatic polymers (Miyatake et al., 2005), acid–base
complexes (Nakamoto et al., 2007), additionally modified or composite PFSA
membranes (Verbrugge et al., 1992), have focused on alternative materials (Feng
et al., 2008). However, the strict requisites of the proton exchange
membrane have been met by far few other commercial membranes.
In current PEMFC technologies, membrane performance and durability include a
large effect of water content of the membrane. The effectiveness of the
electrochemical reaction is determined by proton conductivity in which hydration
of the PFSA membrane acts a crucial role. The requirement of contact with liquid
water or water vapor at >80 % RH to keep adequate proton conductivity by
PFSA and some sulfonated aromatic systems is shown in Figure 2.4 (Roelofs,
2001). It is still hard to succeed the adjustment between the membrane
conductivity (and dry out) and hydration of feed gases and propensity to flooding.

18
The current understanding of the fundamental structure and properties of Nafion®
PFSA materials has been comprehensively reviewed by Mauritz and Moore
(2004). For being the structure of the Nafion® ionomer, the water and proton
diffusion mechanisms are still debated. To explain some important features of
Nafion®, including the rapid diffusion of water and protons through Nafion®,
even at low temperatures, a parallel cylindrical water nano channels model has
been built by Schmidt-Rohr and Chen (2008). Small-angle scattering data on
hydrated Nafion® which is using a recently introduced algorithm was previously
published by their quantitatively simulated model . It is still required that
membrane fundamentals and satisfactory models should be understood by
sufficient experimental data and achieved a better PEMFC design and
optimization. Figure 2.4 showed membrane proton conductivity as a function of
gas humidification at different temperatures for Nafion membrane.
Figure 2.4 Membrane proton conductivity as a function of gas humidification at
different temperatures for Nafion membrane (Schmidt-Rohr and Chen, 2008)
High proton conductivity of the membrane that needed adequate water content
influenced the efficiency of electrochemical reactions in PEM fuel cell. The
reduced proton conductivity probably will lead to lower cell fulfillment in case of

19
the water content in the membrane being insufficient. A dry membrane is also
easily affected by pinhole formation, and this formation can increase the speed of
degradation process in the membrane and also result in membrane failure. Still,
the pores of the catalyst or gas diffusion layers and limiting reactant mass
transport can be obstructed by overabundance of liquid water in the cathode or
anode and it leads to a performance fall or cell reversal. Before going into the cell,
it is essential to humidify the feed gases in most PEM fuel cell applications. For
the time being, removing excess water from the cell to prevent flooding is also
very important. Thus water acts interestingly in PEMFCs that is favorable for
proton delivery and adverse to mass transfer. To maintain a balance; for achieving
better cell performance, water should be dealt with and this the desired way:
Supply efficient water for proton exchange to appear through the membrane and
be prevented from condensed water blocking the mass-transfer channels (Dai et
al., 2009).
Electro-osmotic drag (EOD), back diffusion (BD) usually help water to go
through the membrane. On the appliance of a pressure gradient, hydraulic
permeation are driven by convection and pressure. Compared with EOD and
BD pressure, driven hydraulic permeation is generally insignificant when a
pressure gradient is not placed and the operating temperature is under 70 ºC.
Yet, during high temperature (>80 ºC) or high back pressures, PEM water balance
is considerably influenced by this factor. Because of this reason (Yan et al., 2006).
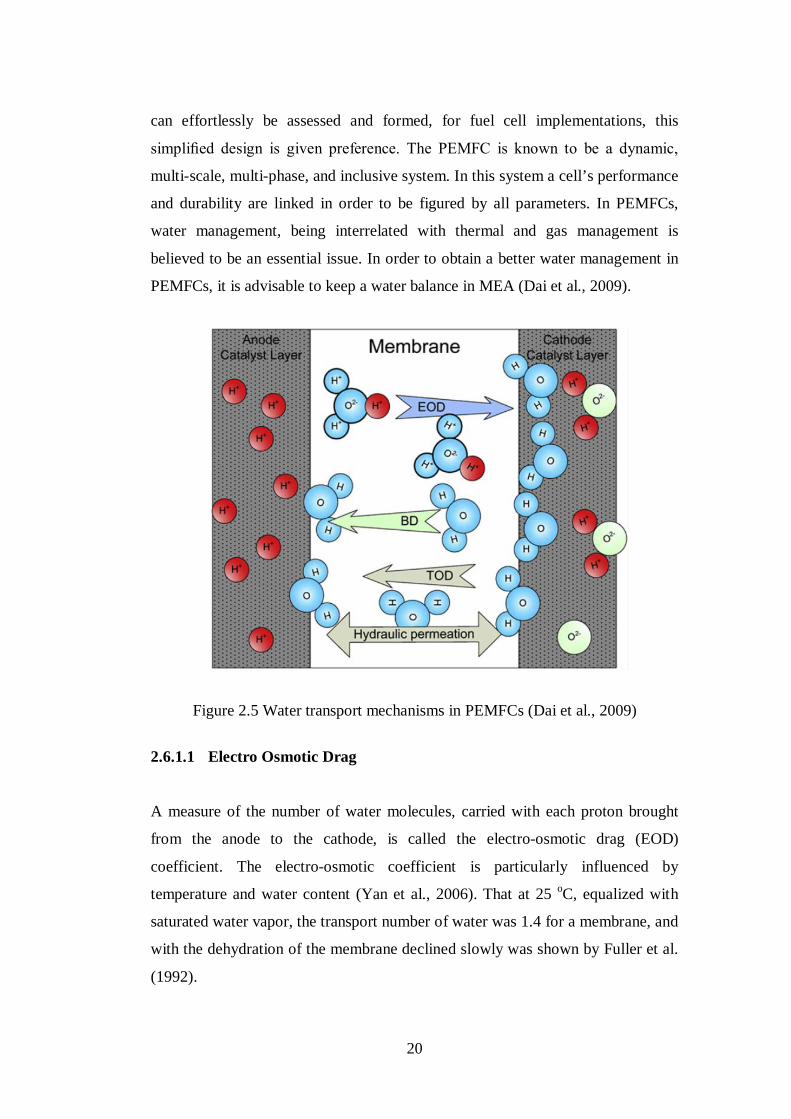
The water transport operation in a common hydrogen PEM fuel cell is shown as a
scheme in Figure 2.5. One can realize that EOD, BD and pressure driven
hydraulic permeation are included in water transport mechanisms in PEM fuel
cells.
Apart from extra water, providing the water in this internal cycle by any means
necessary, the best way is to keep water balance. In the event of the water being
withdrawn by the exhaust gases, it is reprocessed to humidify the feed gases
which are another larger water cycle forms. If the necessities of PEMFC operation
are fulfilled by the recycled water, without external humidification water
balancing in a single cell or system would be accomplished. As the recycled water
20
can effortlessly be assessed and formed, for fuel cell implementations, this
simplified design is given preference. The PEMFC is known to be a dynamic,
multi-scale, multi-phase, and inclusive system. In this system a cell’s performance
and durability are linked in order to be figured by all parameters. In PEMFCs,
water management, being interrelated with thermal and gas management is
believed to be an essential issue. In order to obtain a better water management in
PEMFCs, it is advisable to keep a water balance in MEA (Dai et al., 2009).
Figure 2.5 Water transport mechanisms in PEMFCs (Dai et al., 2009)
2.6.1.1 Electro Osmotic Drag
A measure of the number of water molecules, carried with each proton brought
from the anode to the cathode, is called the electro-osmotic drag (EOD)
coefficient. The electro-osmotic coefficient is particularly influenced by
temperature and water content (Yan et al., 2006). That at 25 oC, equalized with
saturated water vapor, the transport number of water was 1.4 for a membrane, and
with the dehydration of the membrane declined slowly was shown by Fuller et al.
(1992).

21
Electro-osmosis consequences from proton chemistry, through isolated protons in
which electron clouds does not exist, can hardly be in existence in solution as
independent species (Kreuer, 1996). Alternatively, protons cooperate with the
electrons of adjacent water molecules to shape dynamic species such as H3O+
(Pivavor et al., 2006).
Some of the EOD factors get by various researchers are listed in Table 2.2. Being
ordered from 1.5 to 2.6 under different operating cases, electro-osmotic drag
coefficients are attested in literature (Yan et al., 2006). When the temperature
increases, EOD coefficients in Nafion ® 117 also increase. Higher back pressures
(3.16 H2O/H3O+) or EOD (1.5–2.6 H2O/H3O+) become higher than those at
room temperature and ambient pressure (0.9–1.4 H2O/H3O+) as the
temperature is higher. That the electro-osmotic drag coefficient are greatly subject
to the cell current density including the temperature is also discovered by Husar et
al. (2008).
By reason of their EOD coefficient being concluded by the membrane’s water
content (Zawodzinski et al., 1993), temperature (Verbrugge et al., 1992), current
density (Ge et al., 2006), and also membrane thickness (Janssen and Overvelde,
2001), the EOD coefficients of other membranes, including GORE® (1.01
H2O/H3O+), are dissimilar with regard to those of Nafion ® membranes. For the
use of better comprehending water balance and designing necessities for the
PEMFCs, the systematic data based on experience on EOD coefficients for
various membranes (even for the commonly used Nafion ® -series membranes)
and various operating conditions (e.g., current density temperature, pressure) is
still seen inadequate even though for water transport from H2 to air, EOD is
the main driving power.
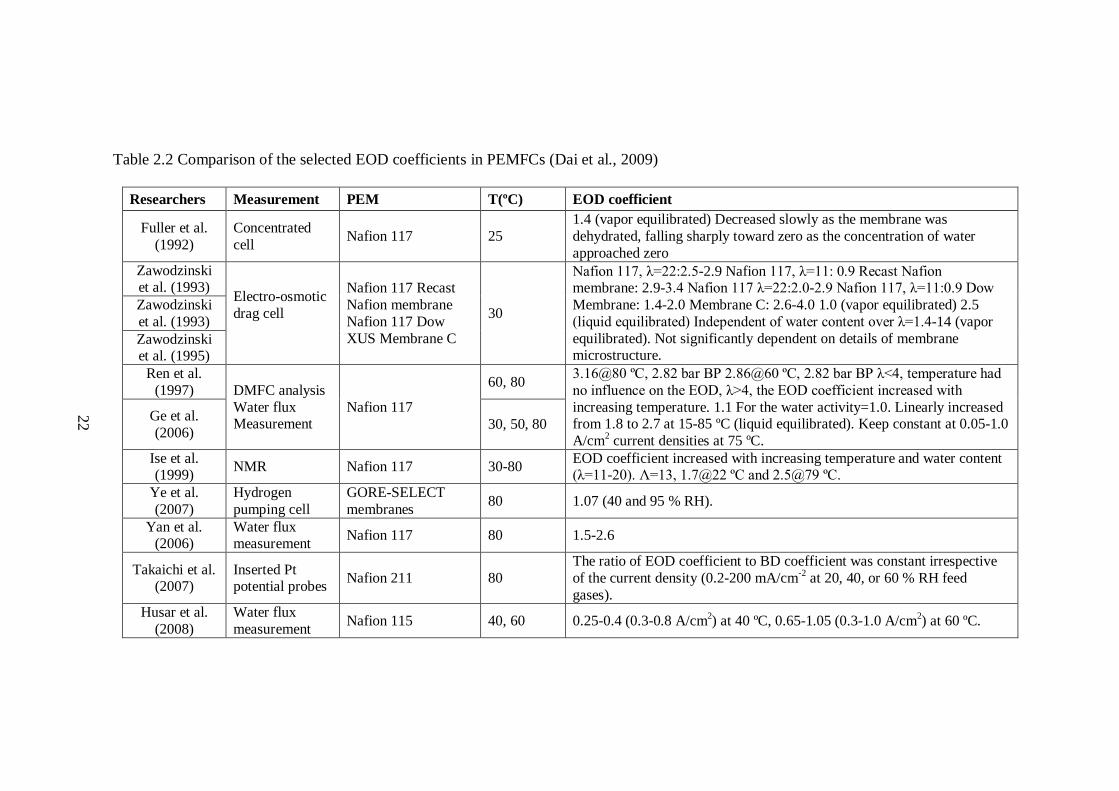
Table 2.2 Comparison of the selected EOD coefficients in PEMFCs (Dai et al., 2009)
Researchers Measurement PEM T(ºC) EOD coefficient
Fuller et al. (1992)
Concentrated cell Nafion 117 25
1.4 (vapor equilibrated) Decreased slowly as the membrane was dehydrated, falling sharply toward zero as the concentration of water approached zero
Zawodzinski et al. (1993) Electro-osmotic
drag cell
Nafion 117 Recast Nafion membrane Nafion 117 Dow XUS Membrane C
30
Nafion 117, λ=22:2.5-2.9 Nafion 117, λ=11: 0.9 Recast Nafion membrane: 2.9-3.4 Nafion 117 λ=22:2.0-2.9 Nafion 117, λ=11:0.9 Dow Membrane: 1.4-2.0 Membrane C: 2.6-4.0 1.0 (vapor equilibrated) 2.5 (liquid equilibrated) Independent of water content over λ=1.4-14 (vapor equilibrated). Not significantly dependent on details of membrane microstructure.
Zawodzinski et al. (1993) Zawodzinski et al. (1995)
Ren et al. (1997) DMFC analysis
Water flux Measurement
Nafion 117
60, 80 3.16@80 ºC, 2.82 bar BP 2.86@60 ºC, 2.82 bar BP λ<4, temperature had no influence on the EOD, λ>4, the EOD coefficient increased with increasing temperature. 1.1 For the water activity=1.0. Linearly increased from 1.8 to 2.7 at 15-85 ºC (liquid equilibrated). Keep constant at 0.05-1.0 A/cm2 current densities at 75 ºC.
Ge et al. (2006) 30, 50, 80
Ise et al. (1999) NMR Nafion 117 30-80 EOD coefficient increased with increasing temperature and water content
(λ=11-20). Λ=13, 1.7@22 ºC and 2.5@79 ºC. Ye et al. (2007)
Hydrogen pumping cell
GORE-SELECT membranes 80 1.07 (40 and 95 % RH).
Yan et al. (2006)
Water flux measurement Nafion 117 80 1.5-2.6
Takaichi et al. (2007)
Inserted Pt potential probes Nafion 211 80
The ratio of EOD coefficient to BD coefficient was constant irrespective of the current density (0.2-200 mA/cm-2 at 20, 40, or 60 % RH feed gases).
Husar et al. (2008)
Water flux measurement Nafion 115 40, 60 0.25-0.4 (0.3-0.8 A/cm2) at 40 ºC, 0.65-1.05 (0.3-1.0 A/cm2) at 60 ºC.
22
23
2.6.1.2 Back Diffusion
Back diffusion (BD) is water’s diffusion from the air to the H2. Many groups who
are using methods including streaming potential NMR (Zawodzinski et al., 1993),
flow permeation and sorption (Rivin et al., 2001), water flux measurement
(Husar et al., 2008), has examined the water BD coefficient, or the number of
water molecules that are diffusing with each proton from the air to the H2.
the density and dimension changes of Nafion® 117 as a function of water
content was evaluated by Morris and Sun (1993) and that the BD coefficient of
water in Nafion®117 are mainly related to the water content was discovered.
Furthermore, the BD coefficient of Nafion®117 membrane at 30 ºC using
NMR was evaluated by Zawodzinski et al. (1993 The dependence of water BD
coefficients on concentration was examined by Rivin et al. (2001) by regarding
various Nafion® membranes, including Nafion ®112, 115, and 117, and by
making use of the flow permeation and sorption method at 32 ºC. ıt was
concluded from the results that the water BD coefficient rises easily and droningly
with concentration. The estimated water flux across Nafion® 115 membranes
with the experimental water flux that was estimated under different flow rates
and pressure gradients, was contrasted by Motupally et al. (2000) through
measuring water flux. The result of this comparison showed that the experimental
data suited the guessed modeling using the Fickian diffusion coefficient got as an
information from self-diffusion evaluations stated in the literature.
Temperature and outlet pressure, the diffusivity of water as a function of water
movement were evaluated by Husar et al. (2008). The water content gradient that
exists across the membrane (Zawodzinski et al., 1993), membrane thickness
(Ye and Wang, 2007), temperature (Husar et al., 2008), and pressure gradient
(Motupally et al., 2000) have defined the BD coefficien while the experimental
data for varied membranes under varied operating circumstances are
inefficient, these data are still useful for placing the PEM water balance region,

24
additionally, selecting a membrane and making the operating circumstances
better.
2.6.1.3 Pressure Driven Hydraulic Permeation
Water’s move in a PEMFC between the H2 and the air, known as pressure
driven hydraulic permeation, happens because of the pressure gradient. If both
the research of EOD and BD are taken into consideration, it can be concluded that
research of pressure driven hydraulic permeation has focalized on modeling rather
than on experiments. A model showing the influence of a constrained membrane
on fuel cell water balance was developed by Weber and Newman, (2004). A non
equilibrium force-balance water transport model in a Nafion®-based PEM was
formed by Nazarov and Promislow (2007). That mechanical pressure of the
membrane can cause a more uniform division of water along the thickness of the
membrane is pointed out from this model. It is also predicted from the model that
mechanical compression can reduce not only the back diffusion of water within
the membrane by up to 20 % but also the membrane water content by 5–30 % by
using an original aggregated operational fuel cell Husar et al. (2008) quantified
the water pressure driven the hydraulic permeation rate. As a result, rising
pressure difference and temperature cause the water pressure driven hydraulic
permeation flux to rise. Unlike electro-osmotic drag and back diffusion, pressure
driven hydraulic permeation can be neglected under several cases. Yet, to develop
the stack performance and lower the stack size, high pressure is favored for some
PEM fuel cell applications, such as automotive. Under these circumstances, in
order to stabilize the water in the fuel cell, it is essential to consider the water
pressure driven hydraulic permeation. Compared to water EOD and BD, water
pressure driven hydraulic permeation is generally ignored for ambient pressure
fuel cells.
2.6.2 Net Water Drag
By using the net water transport coefficient, in general, the net water transport is
described. Commonly, gas pressure, gas stoichiometry, feed gas humidity,

25
current density, gas stoichiometry, There is probability that the factors like flow
field pattern of the fuel cell membrane materials, and water content of the
membrane influence the net water transport coefficient. A gradient existing in
water activity across the Nafion membrane is the result of the production of water
at the air. The diffusion of water from the air to the H2 will be the effect of this
gradient (Yan et al., 2006). the electrical conductivity of Nafion and the diffusion
coefficient of water in Nafion were mainly related to the water content, discovered
by Morris et al. (1993). As the water is more firmly relevant to the sulfonic acid
sites, when the water content declines, correspondingly, the diffusion coefficient
is thought to decline, as a function of water content (Yan et al., 2006).
Principally, by using the net water transport coefficient, the net water transport is
mainly described. net electro-osmotic drag coefficient or the net drag coefficient
(NDC) is generally used in order to make the process easier. The NDC is the net
number of water molecules carried away by a single proton from the H2 to
the air. Under several cases, different techniques including H2 –H2 cells (Himanen
et al., 2006), water flux measurements, electrochemical impedance spectroscopy
(EIS) (Andreaus and Scherer, 2004),and humidity sensors (Ye and Wang, 2007)
has surveyed the NDC.
Some chosen results for the NDC measured by various research groups are shown
in Table 2.3.Although the most well-liked was Nafion®-series membranes. other
membranes were still examined. For instance, GORE® -series membranes or
MEAs were considered by Wang’s research group. ıt can be seen easily from
Table 2.3 that compared to those of Nafion® -series membranes, the NDC values
of GORE® membranes for which the gas RH conditions are more important
than the current density, show differences (Dai et al., 2009). The reason for that
is as GORE® -series membranes are Nafion® -based rein- forced composite
membranes with various microstructures and so they have various water transport
efficiency.

26
Table 2.3 Comparison of selected net drag coefficients in PEMFCS (Dai et al., 2009)
Researches Membrane/ MEA Condition Net drag coefficient (NDC) Janssen et al.
(2001) Nafion 112 Nafion 105 Wide range of operating condition and materials
The stoichiometry and the humidity of the inlet gases had a large effect on NDC as well as membrane thickness.
Choi et al. (2000)
Nafion 115 Hanwha membrane Different current densities NDC decreased sharply with current density, but nearly constant value
over 200mA/cm2. Yan et al.
(2006) Nafion 117 Various conditions NDC ranged from -0.02 to 0.93 and depended on current density, feed gas humidification, and operating conditions.
Cai et al. (2006) Nafion 112 Nafion 115 Dry H2 supply
NDC was negative even when the H2 was humidified and liquid water existed in both sides. High air humidity was a disadvantage for water removal in both sides.
Murahashi et al. (2006) Nafion112 Various fed gas humidity
FC mod operation: NDC decrease as the air humidity increased. ND<0 when humidity was higher than tdc=75ºC. H2 mode operation: NDC increased as the air humidity increased.
Liu et al. (2007)
30 µm GORE-SELECT membrane
Various H2 and air inlet RHs@ 80 ºC and 2 atm
Local current density was dominated by membrane hydration and gas RH has a large effect on NDC. Very small or negative water transport coefficients indicated strong water back diffusion.
Lu et al. (2007)
30 µm GORE-SELECT membrane Segmented cell
0.47 to 0.025 under 100% RH H2 and partially humidified air (EOD dominates). 0.19 to -0.24 under partially humidified H2 and air (negative value indicating back diffusion dominant).
Ye et al. (2007)
GORETM PRIMEA 18 MEA 18 µm GORE-SELECT membrane
In-situ effective water diffusivity diagnostic tool
NDC considerably decreased with increasing current density at 35% - 95% RH. NDC slightly decreased with the increasing RH level of the gas streams at constant current density.
Yang et al. (2005)
Commercial MEA 18 µm membrane
Segmented cell @ 80 ºC and 2 atm
0.05-0.30 even under very dry air conditions, suggesting the presence of strong back diffusion of water from the air to the H2, despite rather dry air gases.
Himanen et al. (2006)
GORETM PRIME series 58 MEA Symmetrical H2-H2 cell NDC increased with increasing concentration difference of water over
the membrane.
26

27
Moreover, the thicknesses of GORE®-series membranes, being 18 mm and 30
mm, are much thinner than Nafion®117 (178 mm), Nafion®105/115 (127 mm),
and Nafion ®112 (50 mm). as mentioned before, thinner membranes includes
strong back diffusion, with dry-feed gases as well.
2.6.3 Humidification Effect on Net Water Transport
Under different cases , water balance in a polymer electrolyte membrane fuel cell
(PEMFC) was examined by measurements of the net drag coefficient (Yan et al.,
2006). Actual density and humidification of feed gases is essential for the net drag
coefficient of water in the membrane as the former is subjected to the latter and on
the fuel cell performance, air inlet gases possessed an important influence. That
the membrane resistance rose as the feed gas relative humidity (RH) declined was
revealed by the resistance of the working fuel cell. The humidity of each H2
In case of incorrectly hydrated, the membrane shows higher ionic resistance and
also can be inconvertibly harmed in extreme conditions. for keeping high proton
conductivity, It is required to hydrate polymer membrane materials which are
used in PEM fuel cells and also take out excess water in order to avoid flooding.
While the water transport circumstance influences membrane hydration in the
membrane, the condition of the inlet gases and the operating parameters of
the fuel cell influences the membrane. The fact that the temperature and the
hydrogen flow rate are the major parameters affecting the water transport
coefficient was discovered (Colinart et al., 2009). Thus, in the course of the
operation of PEM fuel cells, keeping an ideal water balance is highly essential. It
is important to keep the water balance in order to make sure of ideal performance
is obtained ( Perez et al, 2011) . The performance and stabilization of a PEMFC
are interdependent on numerous operating parameters (Weng et al., 2008).
By Nguyen et al. (1993), a water and heat management model for fuel cell was
developed and used to examine the impact of different humidification designs. It
is concluded that both H2 stream and the air stream, if air is used, need to be
28
humidified so as to minimize the ohmic loss. Along with current density, the
amount of water that is produced by ORR in air catalyst layer also rose linearly.
As a result of the parallel increase of the water concentration gradient existing in
the membrane near to the air side and current density, similarly, the back-diffused
water from air to H2 rose. This is the result of decline of the net electro-osmotic
drag coefficient. Hydration and proton conductivity of membrane is settled by the
equilibration between electro-osmotic drag and back diffusion. It is inferred that
so as to avoid membrane dehydration water transport by reason of back-diffusion
is not adequate.
Monitored by Perez et al, (2011), in the non-exist condition of humidification, it is
presented by the polarization curves of the fuel cell stack that the fuel cell
performance got better associated with increase temperature from 20 ºC to 40 ºC.
because of the possibility of membranes death, when the temperature is higher,
the performance of the fuel cell stack declines. The operation temperature
subjects the impact of the humidification temperature on the fuel cell stack
performance. In the case of high operation temperature, humidification
temperatures must be higher. On the other hand, flooding in some individual cells
is caused by the excess of water owing to high humidification temperatures on
behalf of low operation temperatures. It was also monitored that in the event of
membrane’s well humidification, the resistance declines with the operation
temperature owing to the membrane conductivity at higher temperatures and the
progress of the gas diffusivity (Perez at al., 2011).
Some transports such as the transport of the proton from the H2 side to the air side
through the membrane , the transport of reactant and oxidant gases to active sites
of catalyst layer, and the transport of produced water from the air side to the H2
side by back diffusion mechanism are the mass transport limitation. This
limitation has great effects on the performance of PEMFC and it could be
decreased through temperatures, pressures, and humidity of reactant gases. In
addition, the performance of the fuel cells could be improved with these factors.
According to these observations, with the humidified reactant gases temperature

29
increased and the ideal conditions acted when the temperature was higher.
Moreover, there has been more influence on the performance of the PEM fuel cell
on compressed air side rather than compressed H2 side (Amirinejad et al., 2006).
In order to study the impact of the air humidification circumstances on the
location of the interworking, a, multi-component, multi-dimensional,
computational fluid dynamic model was developed. The cell performance and
power density lowers while the relativistic humidity of the air elevates because the
condensed water in the pores in the porous media blockades the access of fuel gas,
(Lee et al., 2007).
2.7 Fuel Cell Modeling
In order to get ideal performance and design, right system selection, design,
and modeling for forecast of performance are required while the fuel cell is a
exclusive and perfect system. Possessing an interdisciplinary intellect of
electrochemistry, materials, manufacturing, mass and heat transfer is essential in
order to take a step in performance, cost, and assurance.
A fuel cell model is thought to be highly important for obtaining the best fuel cell
performance. By a suitable model, forecasts of the cell performance under
different operating circumstances will be allowed. In the past, consecutive and
analytical fuel cell models that compound different ways of heat, mass, and
momentum transport characteristics have been suggested. the different parts of
the PEM fuel cell such as the polymer electrolyte membrane (proton and water
transport), the catalyst layer (reaction site), and the gas diffusion layer / gas flow
channel (reactant transport) have seen as a focal point by most modeling efforts.
It is likely that water transport and heat impacts might be existed in typical PEM
fuel cell models that comprise of transport equations for these respective parts.
Besides leading to cheaper, better, and more effective fuel cells, fuel cell
modeling can cause fuel cell design reformations that it is beneficial for fuel

30
cell developers. In order to be considered as an ideal model, the model should
provide fuel cell performance under a great variety of fuel cell operating
conditions. the cell, the fuel or oxidant pressures, the weight fraction of
each reactant, fuel and oxidant temperatures, and the cell potential are several
crucial factors to add in a fuel cell model. better design, optimization , and
materials are claimed by important developments for fuel cell performance and
operation. These subjects can only be dealt providing veridical mathematical
process models are existing.
Butler- Volmer-type expressions are stated by many certain papers, yet Tafel-
type expressions can be often seen. More veridical, complex multi-staged
reaction kinetics for the electrochemical reactions are used other a few models.
The existence of the two phases (liquid and gas) is known. These phases coexist
under a different of operating circumstances. Within the air structure, with the
purpose of reaching the catalyst layer, there is a possibility that water may
condense and blockade the way for fresh oxygen.
Descriptions related to the mass transport aiming the H2, air, and electrolyte
are an essential property for a single modal. Some mass transport models are put
to use. Despite using Fick diffusivities, basic Fick diffusion models and
efficient Fick diffusion models generally apply efficient transport coefficients
that are specified by experiment and do not throw light on convective flow
contributions. Consequently, Nernst-Planck mass transport expressions
associating Fick's disperse with convective flow is used by many models.
Darcy's law, having various formulations of the hydraulic permeability
coefficient, is typically used to number the convective flow while Schlogl's
formulations for convective flow are used by some models which not only
numbers electro osmotic flow but also and can be applicable for mass transport
inside the PEM, Using the drag coefficient model is known to be a basic model to
associate electro osmotic flow in the membrane. A proportion of water and fuel
flow to proton flow are presumed by this model. The Maxwell-Stefan
formulation is the other well-known mass transport definition for multi

31
component mixtures. Although the Maxwell-Stefan formulation has been
applied on many models for gas-phase transport, it could be preferable if used
for liquid-vapor-phase mass transport. Surface diffusion models and models
based on unchangeable thermodynamics are not used very much. Mass transport
models using efficient transport coefficients and drag coefficients generally
only make a good access to experimental data under a restricted range of
operating conditions.
A fully hydrated PEM is ascribed by most models. In some instances, while
based upon the change of Gibbs free energy inside the PEM based upon
water content, a thermodynamic model is referable. In some other instances, an
empirical correlation defines the water uptake. Most of the forms associate an
isothermal cell activity and as a result there is a lack of involved energy
balances. In the open literature, the description of many PEM fuel cell models
regarding simple zero-dimensional and complex three-dimensional models has
been made during last decade.
Most models are based in theory, comprehensive and complicated, managing to
number circumstance in fuel cells. The models ordinarily deal with one side or
section of the fuel cell only. In order to get a general voltage–current relationship
some models called semi-empirical are held. Yet, these relations inclined to be
particular to one definite fuel cell stack with physical justification which is unreal.
For each new fuel cell form, it is essential to re-examine the coefficients existing
in the voltage–current that restricts this kind of model that can be predicted. A
simplified approach to the electrochemical viewpoints including electrode
kinetics and mass transport restrictions in the fuel cell are applied by fuel cell
system models that are usually semi-empirical having fluid dynamic relations for
the supporter system and extra thermodynamic (Haraldson and Wipke, 2004).
A three-dimensional parametric model, based on the influences of temperature,
humidity and pressure was developed by Wang et al. (2003). It is discovered that
in case of the inlet gases being completely humidified, with increasing

32
temperature the performance of the fuel cell developed. However, with under
humidified gases dehydration of the membrane may happen leading to lowered
conductivity values, as well as lowered cell activity. It is also discovered that
except at higher current densities, H2 humidification is needed at low current
densities. The reason of this is when the current densities are high, adequate water
is produced at the air in order to maintain the membrane hydrated. As dehydration
may take place on the H2 side and flooding on the air side; in addition to
previously mentioned results, it is seen that air humidification has no importance,
particularly when current densities are high. As a result, humidifying the air gas
stream has no advantage. In Table 2.4 recent mathematical models are compared.

Table 2.4 Comparison of recent mathematical models
No. Of Dimension Dyn/ SS H2 and Air
Kinetics H2 and Air Phase
Mass Transport (H2 and Air)
Mass Transport (Electrolyte)
Membrane Swelling Energy Balance
One dimension, two dimension, or three dimension
Dynamic or steady state
Tafel-type expressions, butlervolmer complex kinetics equations
Gas, liquid, combination of gas and liquid
Effective fick’s diffusion, nernstplanck, nernst-planck +schlogl, maxwellstefan
Nernst-planck +schlogl, Nernst-Planck +drag coefficient, Maxwell-Stefan, effective Fick’s diffusion
Empirical or thermodynamic models
Isothermal or full energy balance
33
34
The needed water inclusion and removal important to keep full membrane
humidification at a certain current density are identified by the Bernardi and
Verbrugge model (1992). A pseudo two-dimensional model predicting not only
water and thermal control but also fuel utilization for a fuel cell operating with
developed methanol as the fuel was developed by Fuller and Newman (1993).
That for fuel cell stacks water control is strongly attached to thermal control and
becomes even more harder can be seen through the model of Wohr et al., (1998).
In the inner cells of the stack the temperatures are more than the outer cells
coming up with result in membrane dehydration. Water control mainly has
relation with thermal control/heat removal. the geometry of the gas flow field is
included in other strategies for influential water control.
In mechanistic modeling, getting the most importance in the literature,
differential and algebraic equations are came out stood for the physics and
electro-chemistry managing the incident internal to the cell. By applying some
kind of computational method, these equations are solved. Multi-domain models
or single- domain (or unified) models are the categories of mechanistic models.
2.7.1 Zero-D Model
A movement of electrical load and a alteration in Gibbs energy are both included
in electrochemical reactions. The activation energy block specifies the rate of
an electrochemical reaction. The overwhelm of the charge in travelling from
electrolyte to a solid electrode is required or reverse. an electrochemical
activation keeps going on the external part of the electrode at the speed and this
is the rate where the electrons are freed or "consumed,'' called the electrical
current. The current (of electrons or ions) per unit area of the external part is
called current density. It is pursued from Faraday's Law that current density, the
current (of electrons or ions) per unit area of the surface, is comparative to the
charge carried and the depletion of reactant per unit area:
i = nFj (2.14)

35
in which nF stands for the charge transferred (Coulombs mol-1) , and j stands
for the flux of reactant per unit area (mols-1cm-2). Thus, by a current-
measuring device located outer part to the cell, the reaction rate can be
quantified with ease. Yet, the variation between onward and backward current
on the electrode is the net current or current density. In general, both
oxidation and lessening of the categories are included in an electrochemical
reaction:
Red → Ox + ne− (2.15)
Ox + ne− → Red (2.16)
Protons and electrons are the products of the H2 reactions, known as oxidation
of hydrogen where hydrogen and its electrons are separated. During oxygen
reduction, water is activated as a product and this occurrence is defined as the
air reaction. Reduction , courses, and oxidation happen at identical rates when
an electrode is at balanced circumstances that means outer current is not being
activated:
Ox + ne− ↔ Red (2.17)
The flux related to the onward reaction of Equation (2.17), defined by Equation
(2.176), is:
jf = kfCOx (2.18)
In which kf means forward reaction (reduction) rate coefficient, and Cox means
surface concentration of the reacting species.
in the same way, the flux related to the reverse reaction of Equation (2.18),
defined by Equation (2.15), is:
jb = kbCRd (2.19)

36
In which kb stands for reverse reaction (oxidation) rate coefficient, and CRd for
surface concentration of reacting species.
Each two reactions liberates or uses electrons up. The core current generated is
the difference between the electrons released and consumed:
Electrons are liberated or used up by each two reactions. The difference between
the electrons liberated and used up is called the absolute current activated:
i = nFkfCOx − kbCRd (2.20)
Despite the fact that the reaction advances in both directions concurrently, at
balanced condition, the absolute current coincides with zero. The rate including
these reactions advance at balanced condition is called the exchange current
density.
That a function of the Gibbs free energy means the reaction velocity coefficient
for an electrochemical reaction can be shown in Transition State Theory:
k = kBT
h exp −∆G
RT (2.21)
where kB is Boltzmann’s constant and h is Planck’s constant.
That the Gibbs free energy for electrochemical reactions is composed of not
only chemical terms but also electrical terms can be regarded. At this stage,
reduction reaction :
∆G = ∆Gch + αRdFE (2.22)
an oxidation reaction:
∆G = ∆Gch − αOxFE (2.23)

37
The subscript "ch" signifies the chemical component of the Gibbs free
energy, E infers the potential, F means the Faraday's constant, α stands for a
transfer coefficient, E infers the potential. In the literature the transfer
coefficient related to the transfer coefficient, α , and the symmetry factor, β,
includes some disordinance. For a single-step reaction including a single electron
(n = 1), the symmetry factor, β , may most certainly be used. Although its
amount is between 0 and 1 in theory, the amount approximately for the reactions
on a metallic surface is principally approximately 0.5. As β is identified in a
method that needs the union of that the total of the symmetry factors in the anodic
and cathodic direction. Regarding that β is for reduction, it is obliged to be (1 -
β) for the backward, oxidation reaction. Yet, oxygen reduction and hydrogen
oxidation called electrochemical reactions electron, include more step and
electron rather than one. Therefore, the slowest step in the range, also called as
rate-determining step, identified that the rate of all steps have to be like at
steady state. experimental parameter, referred the transfer coefficient α, is
applied rather than the symmetry factor, β, on defining a multistep process. In
this stage, the equality of αRd + αOx to unity is not much needed. As a matter of
fact (αRd + αOx) = n/ν stands for the number of times the rate-determining step
have to happen to lead to the occurrence of the overall reaction, n refers the
number of electrons carried in the overall reaction and ν means the
stoichiometry number. In Equation (2.20) the parameter of the onward
(reduction) and reversal (oxidation) reaction rate is shown then successively:
kf = k0,f exp −αRdFERT
kb = k0,b exp −αOxFERT
(2.24)
The net current density is acquired after including into Equation (2.20)
i = nF k0,fCOxexp −αRdFERT
− k0,bCrd exp αOxFERT
(2.25)

38
Despite the fact that in both directions the reaction advances at once, at
balanced condition, E stands for the potential, and the net current is zero,. the
exchange current density means the rate at which these reactions advance at
balanced condition:
i0 = nFk0,fCOx exp αRdFErRT
= nFk0,bCRd exp αOxFErRT
(2.26)
A connection between potential and the current density is acquired by
conjoining the Equations (2.26) and (2.27),
i = i0 exp −αRdF(E−Er)RT
− exp αRdF(E−Er)RT
(2.27)
Er is the invertible or balanced condition potency, called as Butler-Volmer
Equation. 0 V is the invertible or balanced condition potency at the fuel cell
H2 and 1.229 V (at 25°C and atmospheric pressure) stands for the invertible
potential at the fuel cell air, with temperature and pressure it varieties. Over
potential is the dissimilarity between the invertible potential and the electrode
potential. This potential dissimilarity is needed in order to engender current.
The Butler-Volmer Equation (2.27) is suitable H2 and air reaction in a fuel cell:
ia = i0,a exp −αRd,aFEa − Er,a
RT − exp
αOx,aFEa − Er,aRT
Ic = i0,c exp −αRd,cFEc−Er,cRT
− exp αOx,cFEc−Er,cRT
(2.28)
The over potential on the H2 is positive (Ea > Er,a,) which causes the first term
of the Equation (2.28) to be insignificant in comparison with the second term,
that is, the oxidation current is predominant and the equation may be
reduced to:

39
The over potential on the H2 is positive (Ea > Er,a,)
Compared to the second term, the over potential on the H2 is positive (Ea > Er,a,)
causing the first term of the Equation (2.28) to be insignificant. Therefore, the
oxidation current is most effective and the equilibrium may be decreased to:
ia = −i0,aexp ∝Ox,aFEa−Er,a
RT (2.29)
A negative sign existing in the resulting current stands for the parting of the
electrons from the electrode (net oxidation reaction). In the same way, the over
potential on the air is negative (Ec < Er,c) causing the first term of the Equation
(2.28) to be larger compared with the second term. Therefore, the oxidation
current is most effective and the equilibrium may be decreased
ic = i0,cexp −∝Rd,cFEc−Er,cRT
(2.30)
It is appeared that for hydrogen/oxygen fuel cells applying Pt catalyst has value
around 1 in the former equations related to the transfer coefficients. An n
parameter in the former equations signifying the number of electrons
included appears in some literature. Regarding that n = 2, on the fuel cell H2
side and n = 4, on the air side, the product of nα has value around 1. α in
range between 0.2 and 2 is stated by Newman (1991) and a value of α = 0.5 for
the hydrogen fuel cell H2 (including two electrons ) and also α = 0.1 to 0.5
for the air are inscrolled.
If the rate constant in chemical reactions is compared to Exchange current
density, io, in electrochemical reactions, it can be seen that exchange current
density is depended on concentration that can be seen directly from Equation 2.26.
A function of electrode catalyst charging and catalyst particular surface area
are also the part of the influential exchange current density (per unit of
electrode active area).

40
For advance with the electrochemical reaction, exchange current density is a
measurement of an electrode's preparedness. High exchange current density
leads to higher activity on the surface of the electrode. The exchange current
density at the H2 at the air is not as high as that in a hydrogen/oxygen fuel cell.,
when the exchange current density is larger, contrarily, the energy barrier gets
smaller. Moreover, when the exchange current density is larger, the amount of
current is created at any over potential increases. Because the H2 exchange
current density in hydrogen/oxygen fuel cells is several orders of magnitudes
larger than the air current density (~10-4 vs. ~10-9 Acm-2 Pt, at 25 °C and l
atm), the over potential on the air is much larger than the H2 over potential.
Thence, the connection between the cell potential and current is frequently
converged only by Equation (2.30).
41
CHAPTER 3
EXPERIMENTAL
3.1 Materials
High-purity hydrogen, nitrogen and dry air (Linde Company) were used as the
fuel, oxidant and inert gases, respectively. The flow stoichiometry for hydrogen
and the air was 1.2/2.0, respectively (Barbir, 2005). The polarization curve data
for commercial PEM MEA was obtained from Paxitech and the required flow rate
of the reactant gases for the experiments were calculated according to these data.
The calculations and polarization curve are given in Appendix C and Figure C.1,
respectively. A membrane electrode assembly (MEA) having active surface area
of 5 x 5 cm2 (Paxitech) and a single test cell having 5 x 5 cm2 active area
(Paxitech) were used during the experiments.
3.2 Experimental Setup
3.2.1 Fuel Cell Test Station
Fuel cell test station with a capacity of 600 W (Henatech TM, HENAtwinTM) was
used for PEM fuel cell performance tests. Test station can be used for both
methanol and PEM fuel cell testing. A schematic representation and a photo of the
test station are given in Figure 3.1 and 3.2, respectively.
The system mainly consists of 7 sub-systems. These are hydrogen and methanol
fuel distribution system, the oxidant gas distribution system, linear electronic
load, fuel cell heater control system, the I/O capabilities, and Hardwired
Emergency Stop system.

42
For each entry in the gas system, there are pressure transducers and each gas is
allowed to enter the system by secure computer-controlled solenoid
valves. Gas flow rates are controlled by pressure regulators.
There is also an isolated purge system in the fuel cell test station. This purge
system can be used for purging the fuel mixture gas line in the emergency
situation. Back pressure regulators are used to increase the pressure of the system
up to 10 bars. These adjustable back pressures can be read on the front panel of
HENAtwinTM test unit.
Online electronic load sub-system acts as a variable power resistor.
Electronic load connections, the fuel cell current and voltage monitors
are located on the front panel of the unit. The amount of impedance,
electronic load, the power to spend or how much current and voltage will
pass was controlled by user-control software, selecting any of such conditions. In
the meantime, current and voltage values are continuously monitored by
computer. These parameters are used to calculate and monitor the amount of
power consumed by the load sub-system at any time. An internal fan is running
continuously to cool the electronic load.
There are three thermocouple input HENAtwinTM testing unit. One of the
thermocouples used to measure the fuel cell temperature and the other ones are
used to measure the hydrogen and air gas transmission lines temperatures before
entering the cell, respectively.

43
Figure 3.1 Schematic representation of fuel cell test station
Anode Flow Control Test Station
Control
HTR 102
HTR 101
HTR 103
HTR 104
Hydrogen
H2 Exhaust
Load Control
Anode
Cathode
Air Exhaust
Anode Back Pressure Control
Cathode Back Pressure Control
Cell Temperature Control
Cathode Flow Control
Anode Humidifier
HTR 204
HTR 203
HTR 202
HTR 201
Nitrogen
Air
Cathode Humidifier
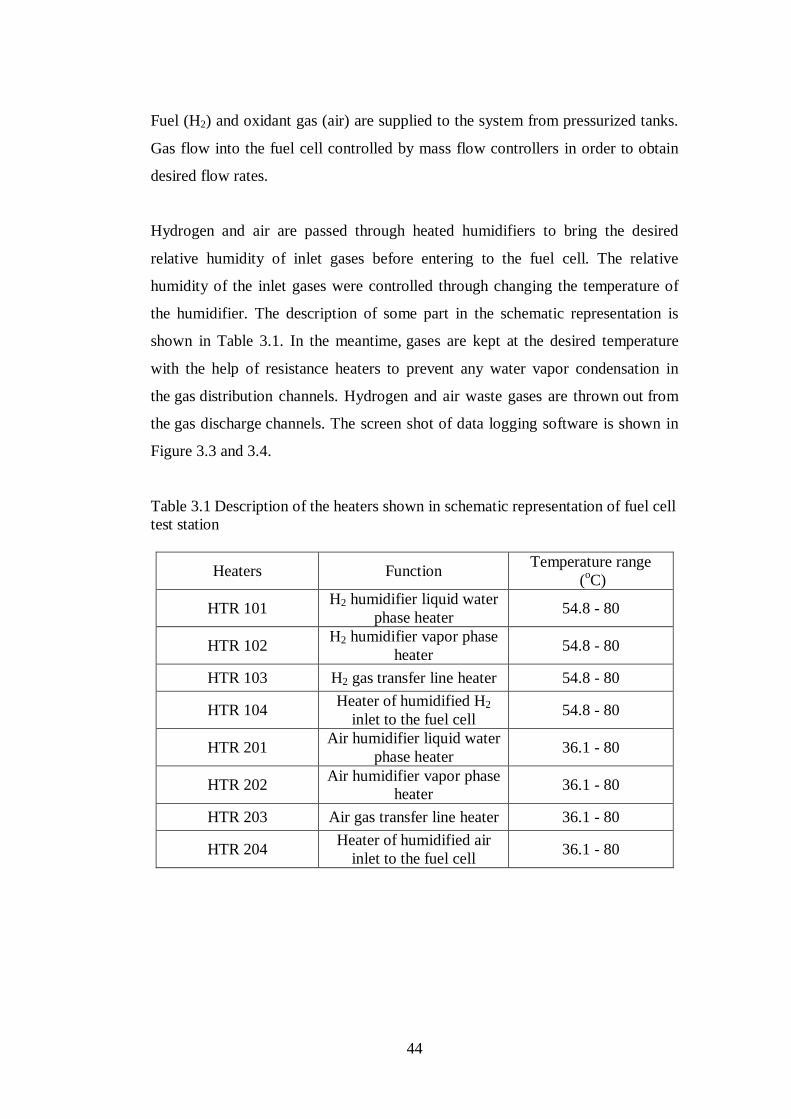
44
Fuel (H2) and oxidant gas (air) are supplied to the system from pressurized tanks.
Gas flow into the fuel cell controlled by mass flow controllers in order to obtain
desired flow rates.
Hydrogen and air are passed through heated humidifiers to bring the desired
relative humidity of inlet gases before entering to the fuel cell. The relative
humidity of the inlet gases were controlled through changing the temperature of
the humidifier. The description of some part in the schematic representation is
shown in Table 3.1. In the meantime, gases are kept at the desired temperature
with the help of resistance heaters to prevent any water vapor condensation in
the gas distribution channels. Hydrogen and air waste gases are thrown out from
the gas discharge channels. The screen shot of data logging software is shown in
Figure 3.3 and 3.4.
Table 3.1 Description of the heaters shown in schematic representation of fuel cell test station
Heaters Function Temperature range (oC)
HTR 101 H2 humidifier liquid water phase heater 54.8 - 80
HTR 102 H2 humidifier vapor phase heater 54.8 - 80
HTR 103 H2 gas transfer line heater 54.8 - 80
HTR 104 Heater of humidified H2 inlet to the fuel cell 54.8 - 80
HTR 201 Air humidifier liquid water phase heater 36.1 - 80
HTR 202 Air humidifier vapor phase heater 36.1 - 80
HTR 203 Air gas transfer line heater 36.1 - 80
HTR 204 Heater of humidified air inlet to the fuel cell 36.1 - 80

45
Figure 3.2 Photo of PEM fuel cell test station
Figure 3.3 The screen shot of data logging software

46
Figure 3.4 The screen shot of data logging software 3.2.2 Fuel Cell Testing Unit
A single test cell composed of two graphite plates having 3-fold serpentine gas
flow channel was used in the experiments. Two current collector plates located
behind the graphite bipolar plates, two insulator sheets that is preventing the fuel
cell from electric short circuits, and two end plates were used to tighten the cell
together. 1 mm, 2 mm and 3.2 mm diameter holes was drilled in the graphite
bipolar plates in order to measure the voltage and temperature. These test cells are
all equipped with “swagelock” type fittings matching 6 mm diameter gas pipes.
The photo of the test PEM fuel cell is shown in Figure 3.5.

47
Figure 3.5 Photo of test PEM fuel cell (PaxiTech)
3.2.3 Membrane Electrode Assembly (MEA)
In order to realize fuel cell tests, an active surface area of 5 x 5 cm2 PEM fuel cell
MEA was obtained from Paxitech. Catalyst loading is 0.5 mg Pt/cm2 for both
anode and cathode side of MEA. Membrane thickness is 70 µm of Nafion 212.
Electrode gas diffusion layer is composed of both the macro porous as well as
micro porous layers with the components of carbon non-woven felt, 10 % PTFE
and carbon 30 % PTFE, respectively. Gas diffusion layer thickness is 215 µm.
Commercial PEM MEA specifications and a photo of PEM MEA is shown in
Table 3.2 and Figure 3.6, respectively.

48
Table 3.2 Commercial PEM MEA (Paxitech) specifications
Active area 25 cm2
GDL 215 µm (carbon non-woven felt – 10% PTFE)
H2 Pt/C – 0.5 mg/cm2
Air Pt/C – 0.5 mg/cm2
Membrane thickness 70 µm
Micro porous layer (carbon + PTFE)
Figure 3.6 Commercial PEM MEA (Paxitech)
3.3 Experimental Procedure
The commercial MEA was placed into the test cell and the bolts were tightened at
a torque of 8-10 Nm on eight bolts. . In order to be in safe and prevent the use of
gases in vain, before starting the experiments gas leakages from the fuel cell was
tested with a liquid gas detector.

49
3.3.1 Performance Procedure
The following procedure has been followed for performance tests.
1) The cell temperature was adjusted and the temperatures of humidifiers and
gas transfer lines were set desired values for each experiment.
2) Before passing the reactant gases, the anode and the cathode side were
purged with nitrogen in order to ensure that no H2 and air were present in
the anode and the cathode side or there was no leak in the cell.
3) After the cell passed the required level of safety and set temperatures were
achieved, hydrogen and air are supplied to the cell at a rate of 0.3 and 1
slpm, respectively.
4) The cell was operated at 0.6 V until it came to steady state, which took
about 4 hours.
5) After steady state was achieved, starting from the OCV value, the current-
voltage data was logged by changing the load and polarization curve
(voltage versus current density) was obtained.
6) For each experiment, three polarization curves were obtained after purging
the system with nitrogen for one hour.
3.3.2 Polarization Curve Procedure
A polarization curve reflects the performance of a fuel cell. After the normal
operating procedure is performed, polarization curve procedure is performed as
below. Experimental data was taken at multiple voltage points. Starting from
OCV, 12 or 13 points between 300 mV/cell and 900 mV/cell, with 5 minutes
dwell at each point, corresponding current was read and the data for five (5)
minutes was averaged and then plotted as average current versus average voltage.
3.4 Scope of the Experiments
Fuel cell performance test was performed with the commercial MEA obtained
from Paxitech. In this way, it was tried to determine the most appropriate

50
operating conditions for single cell PEM fuel cell. Effect of relative humidity of
reactant gases and cell temperatures on fuel cell performance was carried out. In
order to obtain desired relative humidity, the required dew point at the fuel cell
temperature was calculated and this value was set to the fuel cell station. These
calculations are shown in Appendix C. In this context, while the relative humidity
of hydrogen was constant, effect of relative humidity of air on the system
performance was tried to examine. At the best RH of air condition, 50 % RH of
hydrogen was also tested in order to see the effect of relative humidity of
hydrogen. Tests were carried out at of 60, 70 and 80 oC cell temperatures. Test
conditions for commercial PEM MEA are given in Table 3.3 and experimental
data obtained at these conditions are given in Appendix A.
Table 3.3 Test conditions of performed experiments with commercial PEM MEA, H2 flow rate 0.3 slpm, air flow rate 1slpm
Test Conditio
n
Cell T (ºC)
RH of air (%)
RH of H2 (%)
H2 dew point (ºC)
Air dew point (ºC)
1 60 30 100 60 36.1
2 60 50 100 60 45.7
3 70 20 100 70 36.9
4 70 30 100 70 44.5
5 70 50 100 70 54.8
6 70 70 100 70 62
7 70 100 100 70 70
8 70 70 50 54.8 62
9 80 20 100 80 44.8
10 80 30 100 80 52.9
11 80 50 100 80 63.8
12 80 70 100 80 71.4
13 80 100 100 80 80
14 80 100 50 63.8 80

51
Two different relative humidity of air were tested at 100 % RH of H2 with a
stoichiometry of 1.2/2 for hydrogen and air, at 60 oC cell temperature,
respectively. Five different relative humidity of air were tested at 100 % relative
humidity of H2 and at the best relative humidity of air (70 %) condition, 50 %
relative humidity of H2 was also tested with a stoichiometry of 1.2/2 for H2 and air
at 70 oC cell temperature, respectively. Five different relative humidity of air were
tested at 100 % relative humidity of H2 and at the best relative humidity of air
(100 %) condition, 50 % relative humidity of H2 was also tested with a
stoichiometry of 1.2/2 for H2 and air at 80 oC cell temperature, respectively.

52
CHAPTER 4
RESULTS AND DISCUSSION
In this work, the simultaneous effect of cell temperature and relative humidity of
reactant gases on the performance of the fuel cell has been studied. In this way,
sets of experiments were carried out where the operation temperature of the fuel
cell was varied from 60 to 80 ºC, and the humidification temperature for inlet
gases were varied from 36.1 to 80 ºC in order to achieve different relative
humidity of reactant gases. The polarization curves were obtained for each set of
experiments and zero dimensional mathematical models was fitted to
experimental data. Experimental data and modeling results are given in Appendix
A and B, respectively.
4.1 Performance of PEM Fuel Cell at Different Temperatures
4.1.1 Performance at 60 °C
The effect of air inlet relative humidity on PEM fuel cell performance have been
tested at 60 oC fuel cell temperature and atmospheric pressure with a flow rate of
0.3 slpm for H2 and 1 slpm for air. The operating conditions are shown in Table
4.1. Tests were repeated for three times for each experiments and a single
polarization curve was obtained taking the arithmetic average of these three
experiments. The standard deviations are 0.022 and 0.020 for 30 % and 50% RH
air, respectively. It is mean that the average value is consistent with these three
curves. So the mean value was used in the results.

53
Table 4.1 OCV values at 60 °C PEMFC, air flow rate 1 slpm, H2 flow rate 0.3 slpm
RH of air (%)
RH of H2 (%)
H2 dew point (ºC)
Air dew point (ºC)
OCV (V)
30 100 60 36.1 0.97
50 100 60 45.7 0.96
In order to obtain the best polarization curve the commercial PEM MEA was
tested at different cell, humidifier, and gas transfer line temperatures. During the
tests, all the parameters such as pressure, air and H2 flow rate were kept constant.
The polarization curves and power outputs of commercial PEM MEA are shown
in Figure 4.1 and 4.2, respectively.
0 100 200 300 400 500 600 700 800 9000.0
0.10.2
0.30.4
0.5
0.60.7
0.8
0.91.0 30 % RH Air
50 % RH Air
Current Density (mA/cm2)
Cell
Poten
tial (
V)
Figure 4.1 Cell potential vs. current density at 60 o C cell temperature, 100 % RH of H2

54
0 100 200 300 400 500 600 700 800 9000.00
0.05
0.10
0.15
0.20
0.25
0.30
30 % RH Air 50 % RH Air
Current Density (mA/cm2)
Powe
r Den
sity
(W/cm
2 )
Figure 4.2 Power density vs. current density at 60 oC cell temperature, 100 % RH of H2
As shown in Figure 4.1 and 4.2, the best performance and highest power output is
obtained at 50 % RH of air with a constant RH of H2 (100%). As it can be seen
from the Figure 4.1, open circuit potentials (OCV) are 0.97 V and 0.96 V for 30 %
RH and 50 % RH, respectively. It is usually lower than theoretical cell potential
(1.2 V). However, in practice this potential is usually less than 1V.
The current density at 0.6 V for 30 % RH is 270 mA/cm2 and 50 % RH is 275
mA/cm2. The current density at 0.4 V for 30 % RH is 580 mA/cm2 and 50 % RH
is 650 mA/cm2. As RH of air decreases, almost 2 % decrease at 0.4 V and 10 %
decrease at 0.6 V was observed for the current densities. As it can be seen from
Figure 4.3, the maximum power density is 0.23 W/cm2 for 30 % RH and 0.26
W/cm2 for 50 % RH.
At low current densities, the activation voltage losses are nearly the same at 30 %
and 50 % RH of air. At low relative humidity, the ohmic voltage losses are higher
than that of high relative humidity. Therefore in the ohmic region, the resistance is
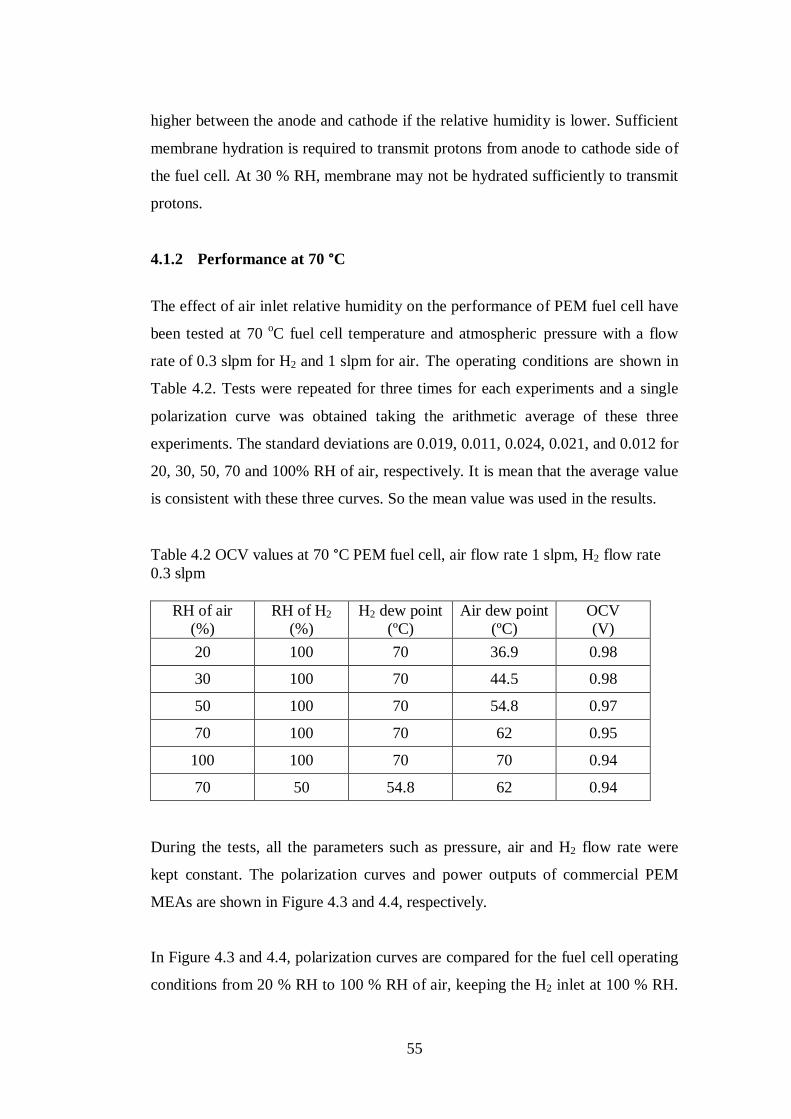
55
higher between the anode and cathode if the relative humidity is lower. Sufficient
membrane hydration is required to transmit protons from anode to cathode side of
the fuel cell. At 30 % RH, membrane may not be hydrated sufficiently to transmit
protons.
4.1.2 Performance at 70 °C
The effect of air inlet relative humidity on the performance of PEM fuel cell have
been tested at 70 oC fuel cell temperature and atmospheric pressure with a flow
rate of 0.3 slpm for H2 and 1 slpm for air. The operating conditions are shown in
Table 4.2. Tests were repeated for three times for each experiments and a single
polarization curve was obtained taking the arithmetic average of these three
experiments. The standard deviations are 0.019, 0.011, 0.024, 0.021, and 0.012 for
20, 30, 50, 70 and 100% RH of air, respectively. It is mean that the average value
is consistent with these three curves. So the mean value was used in the results.
Table 4.2 OCV values at 70 °C PEM fuel cell, air flow rate 1 slpm, H2 flow rate 0.3 slpm
RH of air (%)
RH of H2 (%)
H2 dew point (ºC)
Air dew point (ºC)
OCV (V)
20 100 70 36.9 0.98
30 100 70 44.5 0.98
50 100 70 54.8 0.97
70 100 70 62 0.95
100 100 70 70 0.94
70 50 54.8 62 0.94 During the tests, all the parameters such as pressure, air and H2 flow rate were
kept constant. The polarization curves and power outputs of commercial PEM
MEAs are shown in Figure 4.3 and 4.4, respectively.
In Figure 4.3 and 4.4, polarization curves are compared for the fuel cell operating
conditions from 20 % RH to 100 % RH of air, keeping the H2 inlet at 100 % RH.

56
As seen from the Table 4.2, OCV values are 0.98 V, 0.98 V, 0.97 V, 0.95, 0.94 V
for 20, 30, 50, 70, 100 RH of air with 100 % RH H2 and 0.93 V for 50 % RH H2
with 70 % RH air. At open circuit voltage, in a fuel cell internal currents and
crossover losses may have a dramatic effect on fuel cell potential. OCV of
hydrogen/air fuel cells is generally below 1V, most likely about 0.94 to 0.97 V
depending on operating pressure. Hydrogen cross over is a function of membrane
permeability, membrane thickness, and hydrogen partial pressure difference
across the membrane, as the main driving force. As RH of hydrogen increases,
partial pressure of hydrogen in gas mixture will decrease. Therefore while
increasing the RH, OCV values decreases.
The best performance of 230 mA/cm2 was obtained at 0.6 V for 50 % RH of air
and 530 mA/cm2 at 0.4 V for 70 % RH of air with a constant 100 % RH of
hydrogen was obtained.
As it can be seen from the Figure 4.3, the current densities at 0.4 V are 350
mA/cm2, 400 mA/cm2, 528 mA/cm2, 530 mA/cm2, 529 mA/cm2 and at 0.6 V are
180 mA/cm2, 200 mA/cm2, 230 mA/cm2, 175 mA/cm2, 150 mA/cm2 for 20, 30,
50, 70, 100 % RH of air with a constant 100 % RH of H2, respectively.
As it can be seen from Figure 4.4, the maximum power densities are 0.14 W/cm2 ,
16 W/cm2 , 21 W/cm2 , 22 W/cm2 , 23 W/cm2 for 20, 30, 50, 70,100 % RH of air
with a constant 100 % RH of hydrogen, respectively.
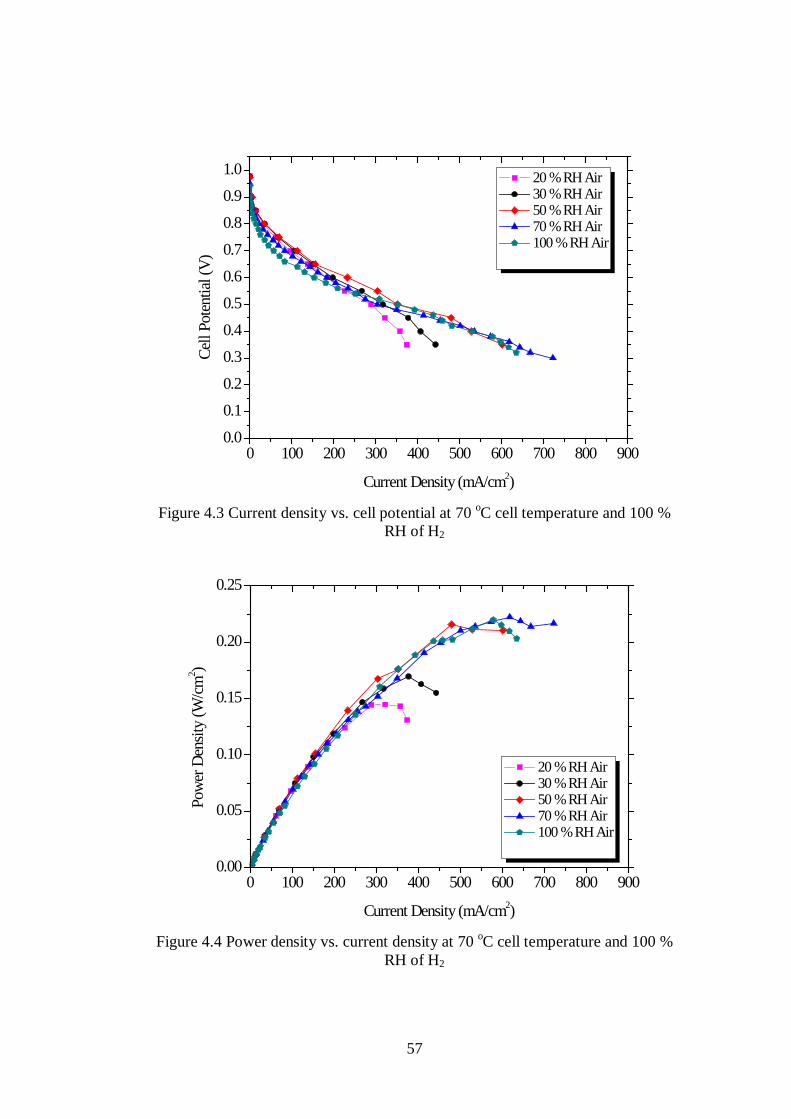
57
0 100 200 300 400 500 600 700 800 9000.0
0.10.2
0.30.4
0.5
0.60.7
0.8
0.91.0
Current Density (mA/cm2)
Cell
Poten
tial (
V)
20 % RH Air 30 % RH Air 50 % RH Air 70 % RH Air 100 % RH Air
Figure 4.3 Current density vs. cell potential at 70 oC cell temperature and 100 % RH of H2
0 100 200 300 400 500 600 700 800 9000.00
0.05
0.10
0.15
0.20
0.25
20 % RH Air 30 % RH Air 50 % RH Air 70 % RH Air 100 % RH Air
Current Density (mA/cm2)
Powe
r Den
sity
(W/cm
2 )
Figure 4.4 Power density vs. current density at 70 oC cell temperature and 100 % RH of H2

58
As shown in Figure 4.3 and 4.4, at low current density region, the cell
performance is the best for 50 % RH of air and the worst for 100 % RH of air with
a constant 100 % RH of hydrogen. It is seen from the Figure 4.3 that increasing
the relative humidity of air from 20 to 50 %, increases the cell performance at low
current densities but further increment in RH of air decreases the cell performance
at these current densities. At high current densities, increasing the RH of air
increases the cell performance. However, there is not much performance
difference between 50, 70 and 100 % RH of air with a constant RH of hydrogen
(100 %) at that region.
As mentioned before, water is mainly transported inside the membrane by electro-
osmotic drag and back diffusion. They affect the water balance in a PEMFC and
determine the membrane hydration. In order to achieve good cell performance,
there must be an optimal water balance between anode and cathode (Yan et al.,
2006). Water transport through the membrane by EOD and BD is affected by
current density, fuel cell temperature, membrane water content and humidity of
inlet gases.
Fuel cell temperature and water content affect the electro-osmotic coefficient. Yan
et al. (2006) was observed that while the current density increasing, the flow of
protons and water from the anode to cathode increased linearly with current
density. Meanwhile, water was produced at the cathode by oxygen reduction
reaction (ORR). The quantity of produced water also increased linearly as current
density increased. Therefore the water concentration gradient in the membrane
close to the cathode side increased and produced water in the cathode may back
diffuse through the membrane from the cathode to the anode. The balance
between electro-osmotic drag and back diffusion determines hydration and proton
conductivity of membrane.
In their two-dimensional PEMFC model, Nguyen and White (1993) stated that, at
high current density, EOD exceeds BD and this cause membrane drying. As the
membrane becomes dehydrated, the membrane pores shrink, which further limits

59
the back diffusion of water. Therefore, it was concluded that water transport due
to BD is not sufficient to prevent membrane dehydration. So, it is seen from the
Figure 4.3 that increasing RH of air improves the cell performance at high current
density region.
As shown in Figure 4.3, at high operating voltages the cell performance decreases
with increasing RH of air with a constant 100 % RH of H2. This may be the
because of different channel type configuration like serpentine. Because the cell
performance in PEMFC and water management is affected by relative humidity of
reactants and flow field designs in the bipolar plates.
In Figure 4.5 and 4.6, polarization curves are compared for the fuel cell operating
conditions with 50 % RH and 100 % RH of H2, keeping the air inlet at 70 % RH.
The current density at 0.6 V decreases from 175 mA/cm2 to 130 mA/cm2, almost
25 % decrease is observed. As it can be seen from Figure 4.6, the maximum
power density is 0.22 W/cm2 for 100 % RH and 0.15 W/cm2 for 50 % RH.
As shown in Figure 4.5 and 4.6, the cell performance is higher for 100 % RH of
H2 than 50 % RH of H2 with a constant 70 % RH of air. As it can be seen from
Figure 4.5 that increasing RH of H2 improves the cell performance with a constant
RH of air. As current density is gradually increased, the contribution of RH of H2
became more important. Yan et al. (2006) observed that when dry hydrogen was
supplied to anode as saturated air was supplied to cathode, effective drag
coefficient decreased dramatically. With low humidity of hydrogen at anode side,
it is fed less water to the anode side of the fuel cell and this cause less water
transport from anode to fuel cell membrane leading partial dehydration of
membrane.

60
0 100 200 300 400 500 600 700 800 9000.0
0.10.2
0.30.4
0.5
0.60.7
0.8
0.91.0
50 % RH Hydrogen 100 % RH Hydrogen
Current Density (mA/cm2)
Cell
Poten
tial (
V)
Figure 4.5 Current density vs. cell potential at 70 oC cell temperature, 70 % RH of air

61
0 100 200 300 400 500 600 700 800 9000.00
0.05
0.10
0.15
0.20
0.25
100 % RH Hydrogen 50 % RH Hydrogen
Current Density (mA/cm2)
Powe
r Den
sity
(W/cm
2 )
Figure 4.6 Current density vs. power density at 70 oC cell temperature, 70 % RH of air
4.1.3 Performance at 80 °C
The effect of air inlet relative humidity on the performance of PEM fuel cell have
been tested at 80 oC fuel cell temperature and atmospheric pressure with a flow
rate of 0.3 slpm for H2 and 1 slpm for air. The operating conditions are shown in
Table 4.3. Tests were repeated for three times for each experiments and a single
polarization curve was obtained taking the arithmetic average of these three
experiments. The standard deviations are 0.008, 0.022, 0.010, 0.022, and 0.019 for
20, 30, 50, 70 and 100% RH of air, respectively. It is mean that the average value
is consistent with these three curves. So the mean value was used in the results.

62
Table 4.3 OCV values at 80 °C PEM fuel cell, air flow rate 1 slpm, H2 flow rate 0.3 slpm
RH of air (%)
RH of H2 (%)
H2 dew point (ºC)
Air dew point (ºC)
OCV (V)
20 100 80 44.8 1.0
30 100 80 52.9 0.98
50 100 80 63.8 0.97
70 100 80 71.4 0.97
100 100 80 80 0.94
100 50 63.8 80 0.92
During the tests, all the parameters such as pressure, air and H2 flow rate were
kept constant. The polarization curves and power outputs of commercial PEM
MEAs are shown in Figure 4.7 and 4.8, respectively.
In Figure 4.7 and 4.8, polarization curves are compared for the fuel cell operating
conditions from 20 % RH to 100 % RH of air, keeping the hydrogen inlet at 100
% RH. The current density at 0.6 V decreases from 200 mA/cm2 to 80 mA/cm2,
almost 60 % decrease is observed. Also, the current density at 0.4 V decreases
from 530 mA/cm2 to 225 mA/cm2, almost 60 % decrease is observed. As it can be
seen from Figure 4.8, the maximum power density is 0.23 W/cm2 for 100 % RH
and 0.09 W/cm2 for 20 % RH.

63
0 100 200 300 400 500 600 700 800 9000.0
0.10.2
0.30.4
0.5
0.60.7
0.8
0.91.0 20 % RH Air
30 % RH Air 50 % RH Air 70 % RH Air 100 % RH Air
Current Density (mA/cm2)
Cell
Poten
tial (
V)
Figure 4.7 Current density vs. cell potential at 80 oC cell temperature, 100 % RH of H2
0 100 200 300 400 500 600 700 800 9000.00
0.05
0.10
0.15
0.20
0.25
Current Density (mA/cm2)
Powe
r Den
sity
(W/cm
2 )
20% RH Air 30% RH Air 50% RH Air 70% RH Air 100% RH Air
Figure 4.8 Power density vs. current density at 80 oC cell temperature, 100 % RH H2
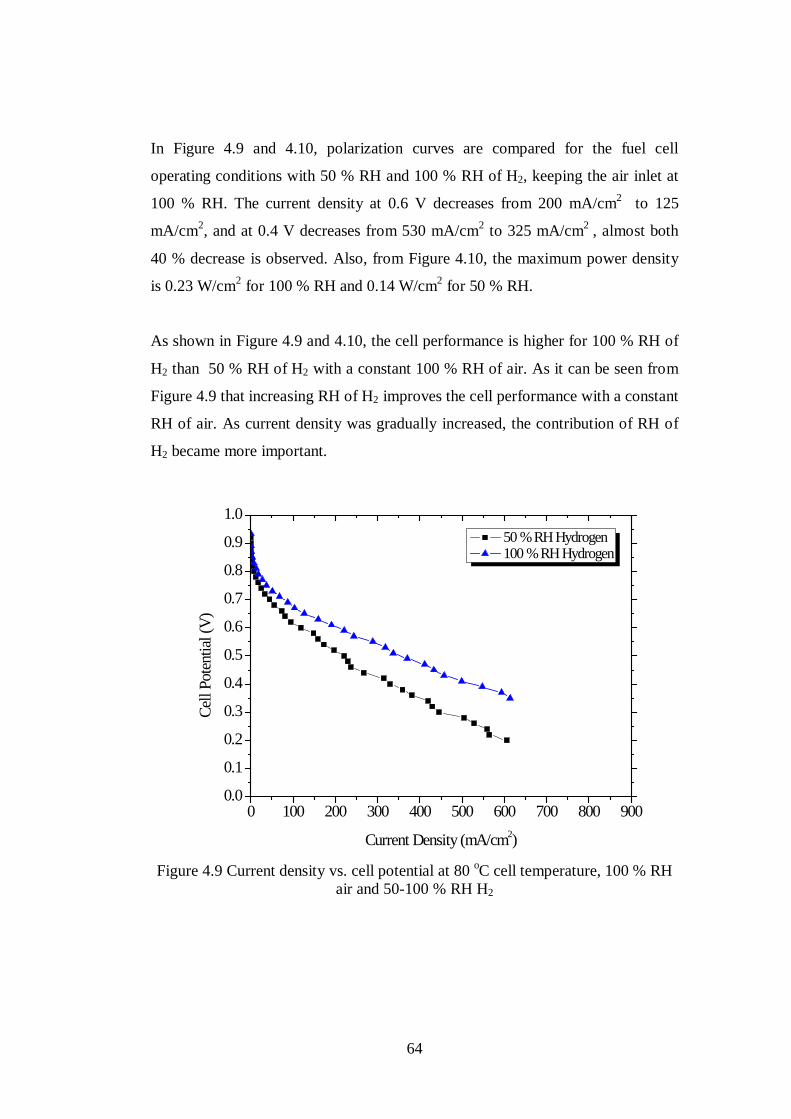
64
In Figure 4.9 and 4.10, polarization curves are compared for the fuel cell
operating conditions with 50 % RH and 100 % RH of H2, keeping the air inlet at
100 % RH. The current density at 0.6 V decreases from 200 mA/cm2 to 125
mA/cm2, and at 0.4 V decreases from 530 mA/cm2 to 325 mA/cm2 , almost both
40 % decrease is observed. Also, from Figure 4.10, the maximum power density
is 0.23 W/cm2 for 100 % RH and 0.14 W/cm2 for 50 % RH.
As shown in Figure 4.9 and 4.10, the cell performance is higher for 100 % RH of
H2 than 50 % RH of H2 with a constant 100 % RH of air. As it can be seen from
Figure 4.9 that increasing RH of H2 improves the cell performance with a constant
RH of air. As current density was gradually increased, the contribution of RH of
H2 became more important.
0 100 200 300 400 500 600 700 800 9000.0
0.1
0.2
0.3
0.4
0.5
0.6
0.7
0.8
0.9
1.0 50 % RH Hydrogen 100 % RH Hydrogen
Current Density (mA/cm2)
Cell
Poten
tial (
V)
Figure 4.9 Current density vs. cell potential at 80 oC cell temperature, 100 % RH air and 50-100 % RH H2
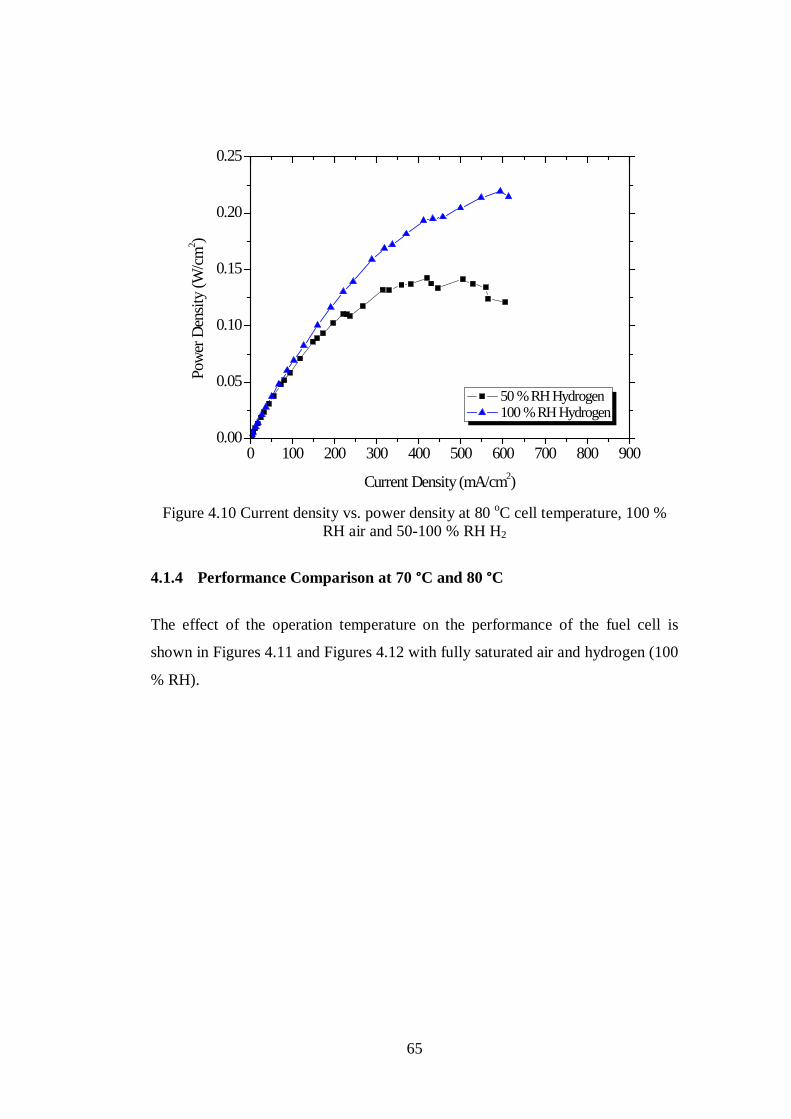
65
0 100 200 300 400 500 600 700 800 9000.00
0.05
0.10
0.15
0.20
0.25
50 % RH Hydrogen 100 % RH Hydrogen
Current Density (mA/cm2)
Powe
r Den
sity
(W/cm
2 )
Figure 4.10 Current density vs. power density at 80 oC cell temperature, 100 % RH air and 50-100 % RH H2
4.1.4 Performance Comparison at 70 °C and 80 °C
The effect of the operation temperature on the performance of the fuel cell is
shown in Figures 4.11 and Figures 4.12 with fully saturated air and hydrogen (100
% RH).
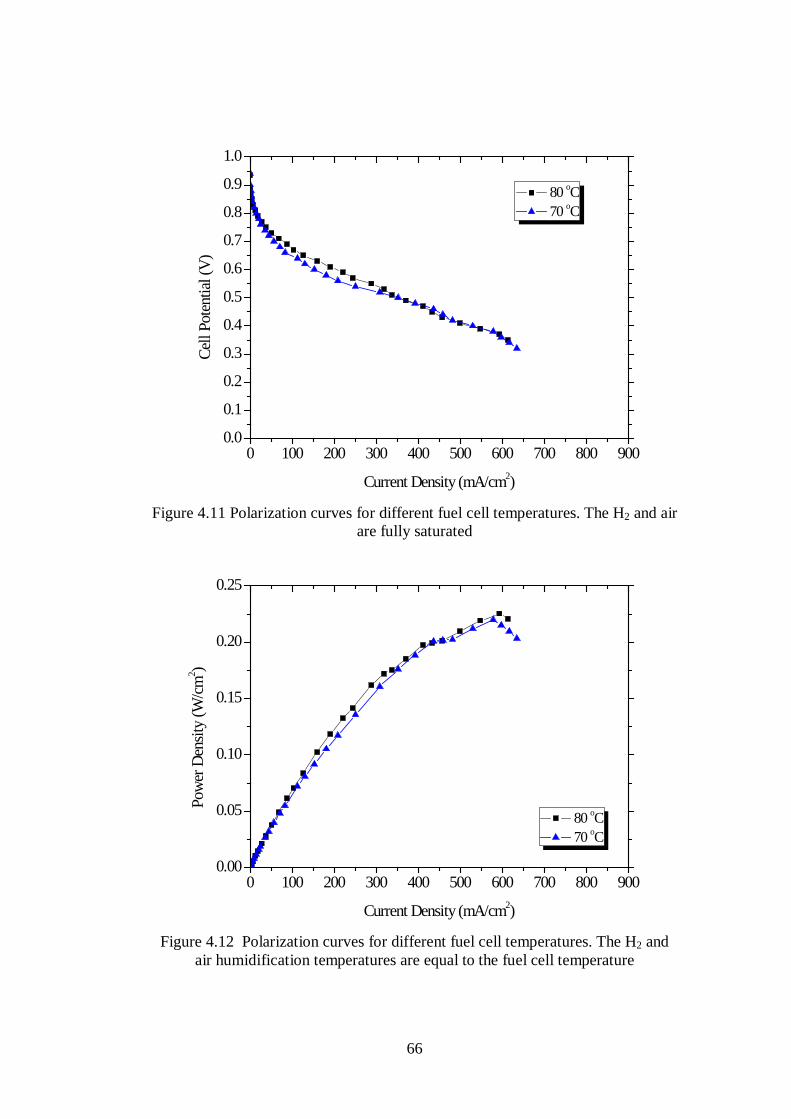
66
0 100 200 300 400 500 600 700 800 9000.0
0.1
0.2
0.3
0.4
0.5
0.6
0.7
0.8
0.9
1.0
80 oC 70 oC
Current Density (mA/cm2)
Cell
Poten
tial (
V)
Figure 4.11 Polarization curves for different fuel cell temperatures. The H2 and air are fully saturated
0 100 200 300 400 500 600 700 800 9000.00
0.05
0.10
0.15
0.20
0.25
Current Density (mA/cm2)
Powe
r Den
sity
(W/cm
2 )
80 oC 70 oC
Figure 4.12 Polarization curves for different fuel cell temperatures. The H2 and air humidification temperatures are equal to the fuel cell temperature
67
In this set of experiments, by keeping the reactants fully saturated the effect of
fuel cell temperature on the cell performance is tried to observe.
Figure 4.11 shows that increasing fuel cell temperature improves PEM fuel cell
performance. The slope of the linear portion of the curve decreases as fuel cell
temperature increases. The limiting current density increases with the increase of
the fuel cell temperature as well, due to the improvement of mass transport. It can
be seen from the Figure 4.11 that, there is no significant difference between the
polarization curves at 70 and 80 ºC. However, there are some differences at the
ohmic region. In the high temperature the diffusivity increases and mass transport
resistance decreases. Also, the increase in ohmic-ion conductivity of Nafion
membrane occurs in elevated temperature (Amirinejad et al., 2006).
4.1.5 Water balance
Table 4.4 summarizes the current obtained at 0.4 V for all experiments. The water
flow rate entering and leaving the fuel cell are estimated by the following
procedure and the results are tabulated in Table 4.4 at these conditions. Sample
calculations for the mass balance are given in Appendix C.

68
mAir,in
mAir,in
mH2O,in Air,in
Tca,in
mH2,in
mH2O,in H2,in
FUEL CELL mH2,out
mH2O,in H2,out
mAir,out
mH2O,in Air,out
Tca,out
Cathode Humidifier
Anode Humidifier
Assumptions:
1) The inlet gases are humidified to the assigned relative humidity in the
humidifiers.
2) Humidifiers are operated at dew point temperature.
3) Gases leaving the humidifiers are in thermal equilibrium with the liquid at
dew point temperature.
4) Gases are saturated with water vapor at humidifier temperature.
5) Gas inlet temperatures are equal to humidifier outlet temperatures. (Gas
lines are heated to eliminate any condensation of vapor).
6) Gases outlet temperatures are equal to fuel cell operating temperature.
7) Both anode and cathode inlet and outlet pressures are taken as 1 atm.
8) Pressure drop between humidifiers and fuel cell connections are
negligible.
mH2,in Tan,in Tan,out

69
9) Water transfer from anode to cathode by electro osmotic drag is
considered as each proton accompanied by 1 water molecule.
10) Net electro osmotic drag coefficient is assumed as 0.93.
Reactant flow rates are calculated by Faraday’s Law:
Water vapor in hydrogen inlet to the fuel cell in gmin-1
mH2O,in H2,in = SH2MH2O
2FφanPvsTan,in
Pan − φanPvsTan,inI ∗ ncell ∗ 60
ncell = 1 (single cell PEM fuel cell). It will be taken as 1 for the following
calculations
Water vapor in air inlet to the fuel cell in gmin-1
mH2O,in Air,in =𝑆𝑂2𝑟𝑂2
MH2O
4FφcaPvsTca,in
Pca − φcaPvsTca,inI ∗ ncell ∗ 60
Water content in hydrogen exhaust in gmin-1
mH2O,in H2,out = mH2O,in H2,in − mH2O,ED + mH2O,BD
Electro osmotic drag was calculated as:
mH2O,ED = ξMH2O
F I ∗ ncell
Where ξ = 1 (each proton is accompanied by 1 water molecule) (Barbir, 2005)

70
Yan et al. (2006) obtained the net electro osmotic drag coefficient ranged from −
0.02 to 0.93, and was dependent on the operating conditions, the current load and
the level of humidification.
It is assumed that the net drag coeffcient is 0.93. Then
Net electro osmotic drag = Electro osmotic drag coefficient (EOD) – back
diffusion coefficient (BD)
NDC = ξ- β
0.93 = 1 − 𝛽 ⇒ 𝛽 = 0.07
mH2O,BD = βmH2O,ED = βξMH2O
F I ∗ ncell
Water vapor at anode exhaust calculated as:
mH2O,inH2,out V = min (SO2 − 1)MH2O
2FPvsTout,an
Pan − ∆Pan − PvsTout,anI
∗ ncell , mH2O,in H2,out
Liquid water at anode exhaust calculated as:
mH2O,inH2,out L = mH2O,inH2,out − mH2O,in H2,out V
Water content in the cathode exhaust in gmin-1
mH2O,in Air,out = mH2O,in Air,in + mH2O,qen + mH2O,ED − mH2O,BD
mH2O,in Air,out V = min SO2 − rO2,in
rO2,in
MH2O
4FPvsTout,ca
Pca − ∆Pca − PvsTout,caI ∗ ncell , mH2O,in Air,out
mH2O,in Air,out L = mH2O,in Air,out − mH2O,in Air,out V

71
It is seen from Table 4.4 that decreasing hydrogen relative humidity from 100 to
50, the amount of water obtained at the cathode exhaust decreases about 40 % at
70 oC cell temperature for both in liquid and vapor phases. At 80 oC cell
temperature decreasing the RH of hydrogen from 100 to 50 %, decreases the
cathode exhaust water content 40 % for both liquid and vapor phases.
Yan et al. (2006) obtained the net electro osmotic drag coefficinet ranged from -
0.02 to 0.93. It is seen that at 60 oC cell temperature the anode exhaust water was
obtained as vapor. However there is no liquid water formation at the anode
exhaust. At cathode side the higher amount of cathode exhaust was obtained as
liquid water. For 70 oC cell temperature, the anode exhaust was also obtained as
vapor and no liquid water is observed. Higher amount of cathode exhaust was
obtained as vapor except for the relative humidity of 100 % for both air and
hydrogen. At 80 oC, the similar anode exhaust behavior was obtained. Vapor was
obtained at the anode exhaust and there is no liquid water. However, up to 70 %
RH air with a costant 100 % RH hydrogen, there is no liquid water at the cathode
exhaust, all the water was obtained as vapor. At 70 and 100 RH air, the higher
amount of water was obtained as vapor but both the liquid and vapor phase was
observed.

Table 4.4 Inlet and outlet water flow rates
TC Cell
T (ºC)*
RH of air
(%)*
RH of H2
(%)*
I (A)* (0.4V)
Mass flow rate of water
at H2 inlet (g/min)**
Mass flow rate of water at air inlet (g/min)**
Mass flow rate of water vapor
at H2 outlet (g/min)**
Mass flow rate of liquid water
at H2 outlet (g/min)**
Mass flow rate of water vapor at air
outlet (g/min)**
Mass flow rate of liquid water at air
outlet (g/min)**
1 60 30 100 14.5 0.024 0.007 0.004 0.000 0.085 0.154 2 60 50 100 16.25 0.027 0.022 0.004 0.000 0.095 0.187 3 70 20 100 9 0.027 0.003 0.004 0.000 0.096 0.052 4 70 30 100 10.25 0.031 0.008 0.005 0.000 0.109 0.063 5 70 50 100 13.5 0.040 0.030 0.007 0.000 0.143 0.103 6 70 70 100 13.5 0.040 0.064 0.007 0.000 0.143 0.137 7 70 100 100 13.5 0.040 0.160 0.007 0.000 0.143 0.233 8 70 70 50 8.5 0.005 0.040 0.004 0.000 0.090 0.086 9 80 20 100 5.75 0.034 0.003 0.006 0.000 0.095 0.000
10 80 30 100 5.75 0.034 0.007 0.006 0.000 0.099 0.000 11 80 50 100 8 0.047 0.028 0.008 0.000 0.156 0.000 12 80 70 100 10 0.059 0.079 0.010 0.000 0.210 0.029 13 80 100 100 13.25 0.078 0.311 0.013 0.000 0.278 0.245 14 80 100 50 8.25 0.007 0.193 0.008 0.000 0.173 0.152
*Experimental
**Calculated
72

73
By using the net water transport coefficient, in general, the net water transport is
described. Commonly, gas pressure, gas stoichiometry, feed gas humidity,
current density, gas stoichiometry, There is probability that the factors like flow
field pattern of the fuel cell membrane materials, and water content of the
membrane influence the net water transport coefficient. A gradient existing in
water activity across the Nafion membrane is the result of the production of water
at the air. The diffusion of water from the air to the H2 will be the effect of this
gradient (Yan et al., 2006).
Principally, by using the net water transport coefficient, the net water transport is
mainly described. Net electro-osmotic drag coefficient or the net drag coefficient
(NDC) is generally used in order to make the process easier. The NDC is the net
number of water molecules carried away by a single proton from the anode to
the cathode. NDC ranged from -0.02 to 0.93 and depended on current density,
feed gas humidification, and operating conditions (Yan et al., 2006). Fuel cell
performance is affected mainly by relative humidity of both hydrogen and air
gases. Membrane resistance increased as the feed gas relative humidity (RH)
decreased.
Along with current density, the amount of water that is produced by ORR in air
catalyst layer also rose linearly. As a result of the parallel increase of the water
concentration gradient existing in the membrane near to the air side and current
density, similarly, the back-diffused water from air to H2 rose. This is the result
of decline of the net electro-osmotic drag coefficient. Hydration and proton
conductivity of membrane is settled by the equilibration between electro-osmotic
drag and back diffusion (Yan et al., 2006).
4.2 Comparison of Performance Curve with Zero-D (Butler-Volmer)
Model
Series of polarization curves with different fuel cell operation temperatures and
relative humidity of reactants have been studied. From the polarization curves, the
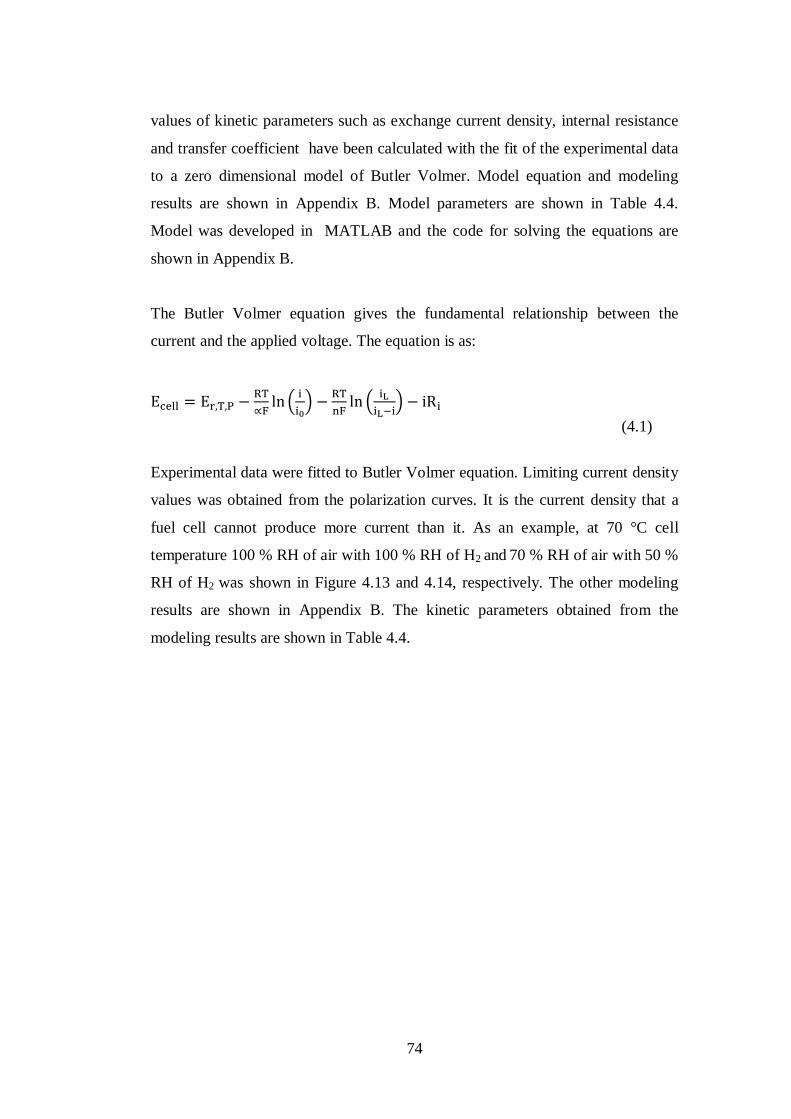
74
values of kinetic parameters such as exchange current density, internal resistance
and transfer coefficient have been calculated with the fit of the experimental data
to a zero dimensional model of Butler Volmer. Model equation and modeling
results are shown in Appendix B. Model parameters are shown in Table 4.4.
Model was developed in MATLAB and the code for solving the equations are
shown in Appendix B.
The Butler Volmer equation gives the fundamental relationship between the
current and the applied voltage. The equation is as:
Ecell = Er,T,P −RT∝F
ln ii0 − RT
nFln iL
iL−i − iRi
(4.1)
Experimental data were fitted to Butler Volmer equation. Limiting current density
values was obtained from the polarization curves. It is the current density that a
fuel cell cannot produce more current than it. As an example, at 70 °C cell
temperature 100 % RH of air with 100 % RH of H2 and 70 % RH of air with 50 %
RH of H2 was shown in Figure 4.13 and 4.14, respectively. The other modeling
results are shown in Appendix B. The kinetic parameters obtained from the
modeling results are shown in Table 4.4.

75
Figure 4.13 Comparison of the modeling results with the experimental data for
polarization curve at 70 °C, 100 % RH air, 100 % RH H2
0 0.1 0.2 0.3 0.4 0.5 0.6 0.7
0.4
0.5
0.6
0.7
0.8
0.9
1
i(A/cm2)
E(V
)
Experimental dataModel
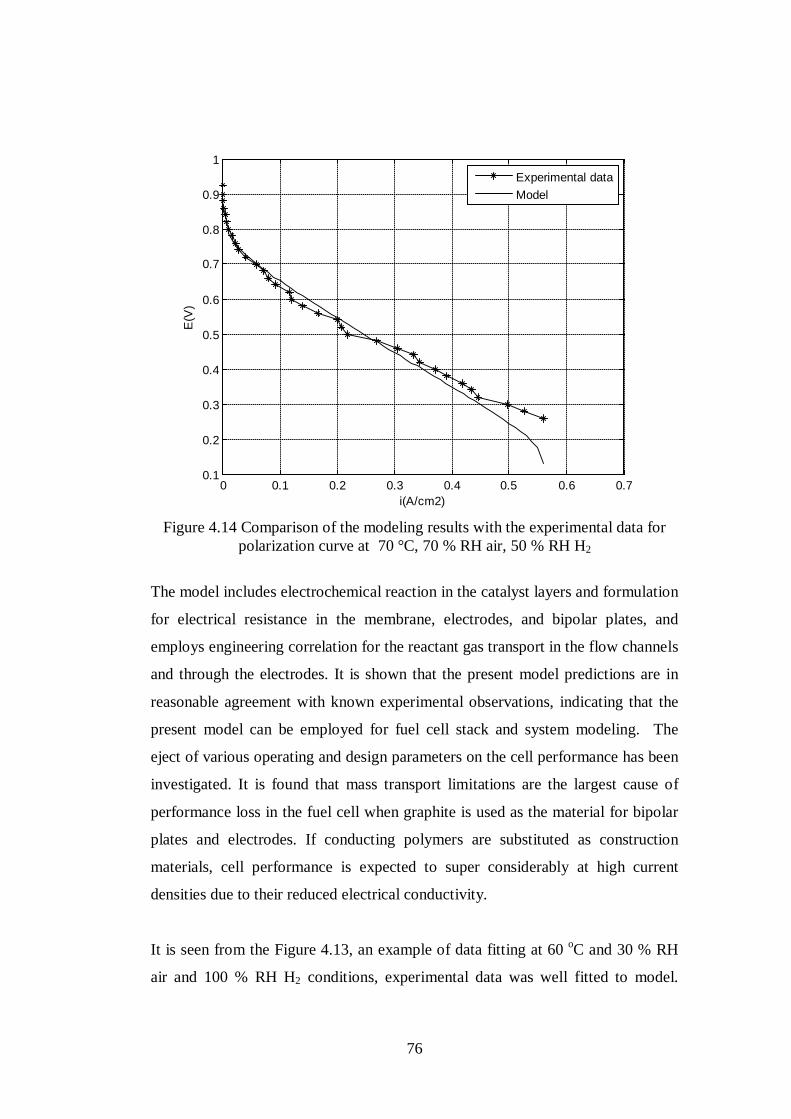
76
Figure 4.14 Comparison of the modeling results with the experimental data for
polarization curve at 70 °C, 70 % RH air, 50 % RH H2
The model includes electrochemical reaction in the catalyst layers and formulation
for electrical resistance in the membrane, electrodes, and bipolar plates, and
employs engineering correlation for the reactant gas transport in the flow channels
and through the electrodes. It is shown that the present model predictions are in
reasonable agreement with known experimental observations, indicating that the
present model can be employed for fuel cell stack and system modeling. The
eject of various operating and design parameters on the cell performance has been
investigated. It is found that mass transport limitations are the largest cause of
performance loss in the fuel cell when graphite is used as the material for bipolar
plates and electrodes. If conducting polymers are substituted as construction
materials, cell performance is expected to super considerably at high current
densities due to their reduced electrical conductivity.
It is seen from the Figure 4.13, an example of data fitting at 60 oC and 30 % RH
air and 100 % RH H2 conditions, experimental data was well fitted to model.
0 0.1 0.2 0.3 0.4 0.5 0.6 0.70.1
0.2
0.3
0.4
0.5
0.6
0.7
0.8
0.9
1
i(A/cm2)
E(V
)
Experimental dataModel
77
Transfer coefficient, exchange current density and limiting current density values
were found from the modeling results.
Transfer coefficient represented as α. In theory, it varies between 0 and 1,
depending on the symmetry of the transition state in the electrochemical reaction.
Experimentally, it has been determined to be about 0.5 (Hoogers, 2003).
Concentration of reactants and products do not change in a chemical reaction at
equilibrium. It means that forward and backward reaction rates are equal to each
other. At equilibrium, the current density of forward and backward reaction are
equal to each other. This is called the exchange current density. It is a kinetic
parameter that depends on the reaction and on the electrode surface. Exchange
current density is defined as a rate of redox reactions at equilibrium. Exchange
current density is mainly affected by electrode catalyst loading, active catalyst
surface area, distribution of catalyst particles and thickness of the catalyst layer
(Barbir, 2005).
In the manner of operation variables, fuel cell temperature effect the exchange
current density (Santarelli et al, 2006).
It’s magnitude ease the electrochemical reaction on the electrode surface. A small
exchange current means that a high over potential is required to achieve a high
current flow, while a large exchange current density indicates that only a small
over potential is needed to produce a large current flow.
The exchange current density can be used as a comparison between different
catalysts: the smaller the activation energy, the larger the exchange current
density and the better the catalyst (Hoogers, 2003).
In a PEM fuel cell, typical exchange current density values
are: i0,a = 0.2 A cm−2 and i0,c = 1 × 10⁻⁴ A cm−2 (Larminie and Dicks, 2000).
You and Liu (2001) found a unique value is considered: i0 = 4.84 × 10⁻⁸ A cm−2.

78
Bevers et al. (1997), found the considered exchange current density value is:
i0 = 1 × 10⁻⁶ A cm−2. Finally, Parthasarathy et al. (1992) found the exchange
current value in the range from i0,c = 6 × 10⁻⁵ A cm−2 at T = 30 °C to
i0,c = 2.6 × 10⁻⁴ A cm−2 at T = 70 °C.
However, limiting current density is not particularly discussed in the literature.
Lee et al. (1998), a typical value for a PEM is reported: iL= 0.9 A cm−2. Amphlett
et al. (1995) described an analytical expression, where the limiting current is
function of the diffusion coefficient of the reactant in the electrode, of the
electrode thickness and of the reactant concentration above the diffusion in the
electrode. Pisani et al. (2002) found iL= 0.810 A cm−2 in case of Nafion 115 fed
by H2/air, operating at atmospheric pressure, at 70 oC.

Table 4.5 Model parameters
Cell Temperature
(oC)
Relative Humidity of
H2 (%)
Relative Humidity of air (%)
Transfer coefficient
(α )
Exchange Current Density (io)
(A/cm2)
Limiting Current Density (iL)
(A/cm2)
Internal Resistance (Ri)
(Ω-cm2)
60 100 30 0.778 8.834x10⁻⁷ 0.720 0.495
60 100 50 1.254 1.975x10⁻⁹ 0.790 0.538
70 100 20 1.310 2.068x10⁻⁹ 0.374 0.957
70 100 30 1.372 1.434x10⁻⁹ 0.443 0.866
70 100 50 1.327 1.545x10⁻⁹ 0.602 0.704
70 100 70 0.770 4.927x10⁻⁷ 0.723 0.461
70 100 100 1.075 2.566x10⁻⁹ 0.636 0.475
70 50 70 1.155 1.458x10⁻⁹ 0.561 0.839
80 100 20 0.409 1.152x10⁻⁴ 0.334 0.986
80 100 30 0.364 2.114x10⁻⁴ 0.391 0.800
80 100 50 0.495 3.332x10⁻⁵ 0.480 0.687
80 100 70 0.605 8.169x10⁻⁶ 0.503 0.560
80 100 100 0.778 5.423x10⁻⁷ 0.614 0.443
80 50 100 0.726 5.129x10⁻⁷ 0.606 0.667
79

80
It is seen from Table 4.4 that higher exchange current density was obtained at 30
% RH of air than 50 % RH with a constant 100 % RH of H2 at 60 ° cell
temperature At 70 oC cell temperature, the highest exchange current density was
obtained at 70 % RH of air and the lowest was obtained at 30 % RH of air with
constant 100 % RH of H2. On the other hand, with constant 70 % RH of air, 100
% RH of H2 gives the higher exchange current density than that of 50 % RH of
H2. At 80 oC cell temperature, the highest exchange current density was obtained
at 30 % RH of air and the lowest was obtained at 100 % RH of air with constant
100 % RH of H2. Besides, with constant 100 % RH of air, 100 % RH of H2 gives
the higher exchange current density than that of 50 % RH of H2. It is seen that
relative humidity of reactant gases have a significant effect on exchange current
density.
It is seen from Figure 4.15 that higher internal resistance was obtained at 50 %
RH of air than 30 % RH with a constant 100 % RH of H2 at 60 ° cell temperature
At 70 oC cell temperature, the lowest internal resistance was obtained at 70 % RH
of air and the highest internal resistance was obtained at 20 % RH of air with
constant 100 % RH of H2. On the other hand, with constant 70 % RH of air, 50 %
RH of H2 gives the higher internal resistance than that of 100 % RH of H2. At 80 oC cell temperature, the lowest internal resistance was obtained at 100 % RH of
air and the highest internal resistance was obtained at 20 % RH of air with
constant 100 % RH of H2. Besides, with constant 100 % RH of air, 50 % RH of
H2 gives the higher internal resistance than that of 100 % RH of H2. It is seen that
relative humidity of reactant gases have a significant effect on internal resistance.
Increasing relative humidity of reactant gases improves the fuel cell performance
as decreasing internal resistances.
Internal resistance is associated with ohmic losses. Ohmic losses vary directly
with current, increasing over the entire range of current density. These are due to
the resistance to the flow of protons in the electrolyte membrane and resistance to
flow of electrons through the stack materials, electrode materials, electrode
backing, interconnects current collector plates and constant resistance between

81
various interfaces. This may be the because of non-properly hydration, it exhibits
higher ionic resistance. At the same time excess water must be removed to
prevent flooding. This also causes internal resistance in the fuel cell.
Figure 4.15 Internal resistances at different cell temperatures and relative humidity of reactants
It is seen from Figure 4.16 that higher transfer coefficient was obtained at 50 %
RH of air than 30 % RH with a constant 100 % RH of H2 at 60 ° cell temperature
At 70 oC cell temperature, the highest transfer coefficient was obtained at 30 %
RH of air and the lowest transfer coefficient was obtained at 70 % RH of air with
constant 100 % RH of H2. On the other hand, with constant 70 % RH of air, 50 %
RH of H2 gives the higher transfer coefficient than that of 100 % RH of H2. At 80 oC cell temperature, the highest transfer coefficient was obtained at 100 % RH of
air and the lowest transfer coefficient was obtained at 30 % RH of air with
constant 100 % RH of H2. Besides, with constant 100 % RH of air, 100 % RH of
H2 gives the higher transfer coefficient than that of 50 % RH of H2. It is seen that
as a general trend increasing the relative humidity of reactant gases increase the
transfer coefficient.
0
0,2
0,4
0,6
0,8
1
1,2
60˚C 70˚C 80˚C
Inte
rnal
Res
istan
ce
Temperature
100%Air, 50%H2 20%Air, 100%H2 30%Air, 100%H2 50%Air, 100%H2 70%Air, 100%H2 100%Air, 100%H2 70%Air, 50%H2

82
Figure 4.16 Transfer coefficients at different cell temperatures and relative humidity
It is seen from Figure 4.17 that higher limiting current density was observed at 50
% RH of air than 30 % RH with a constant 100 % RH of H2 at 60 ° cell
temperature At 70 oC cell temperature, the highest limiting current density was
obtained at 70 % RH of air and the lowest limiting current density was obtained
at 20 % RH of air with constant 100 % RH of H2. On the other hand, with
constant 70 % RH of air, 100 % RH of H2 gives the higher limiting current
density than that of 50 % RH of H2. At 80 oC cell temperature, the highest
limiting current density was obtained at 100 % RH of air and the lowest limiting
current density was obtained at 20 % RH of air with constant 100 % RH of H2.
Besides, with constant 100 % RH of air, 100 % RH of H2 gives the higher limiting
current density than that of 50 % RH of H2. It is seen that as a general trend
increasing the relative humidity of reactant gases increase the limiting current
density.
0
0,2
0,4
0,6
0,8
1
1,2
1,4
1,6
60˚C 70˚C 80˚C
Tran
sfer
Coe
ffici
ent
Temperature
100%Air, 50%H2 20%Air, 100%H2 30%Air, 100%H2 50%Air, 100%H2 70%Air, 100%H2 100%Air, 100%H2 70%Air, 50%H2

83
Figure 4.17 Limiting current density at different cell temperatures and relative humidity
When the membrane is well hydrated, increasing the operation temperature
improves the performance of the fuel cell stack, due to the increase of the
exchange current density, which reduces the activation losses, and to the increase
in the gas diffusivity and membrane conductivity at higher temperatures. The
hydration of the membrane is better at low temperatures than at high
temperatures, but the kinetics was slower at low operation temperatures than at
high temperatures. The trade-off between water retention and kinetics may be
responsible for the similar performances in the low current range. At higher
current, the positive impact of accelerated reaction kinetics at high temperatures
on the performance may overwhelm the negative impact of less hydration of
membrane, resulting in higher performance. . This could be because at this high
operation temperature, the membrane material in the catalyst layer may not be
fully hydrated. The water is more easily vaporizes at high temperatures. This
could cause a decrease in the membrane conductivity and in the active surface
area of the catalyst, and then, a decrease of the fuel cell stack performance (Perez,
2011). The increase of the operation temperature would cause an increase of the
0
0,1
0,2
0,3
0,4
0,5
0,6
0,7
0,8
0,9
60˚C 70˚C 80˚C
Lim
iting
Cur
rent
Den
sity
Temperature
100%Air, 50%H2 20%Air, 100%H2 30%Air, 100%H2 50%Air, 100%H2 70%Air, 100%H2 100%Air,100%H2 70%Air, 50%H2

84
exchange current density, because a higher temperature value allows an
improvement of the reaction activation (Santarelli et al, 2006)

85
CHAPTER 5
CONCLUSION AND RECOMMENDATIONS
The aim of this study was to observe the effect of different operating temperature
and relative humidity of reactant gases on the performance of PEM fuel cell.
Experiments have been carried out at 60, 70 and 80 °C cell temperature and
relative humidity of air was changed from 20 to100 % RH and relative humidity
of 50 % and 100 % of hydrogen were tested. The experimental results are
presented in the form of polarization curves. These curves data have been fit to a
zero dimensional model, and the effect of the fuel cell operation temperature and
relative humidity of reactant gases on the kinetic parameters and the cell
resistance have been detected.
It was concluded that increasing the relative humidity of both hydrogen and air
have a significant effect on fuel cell performance. Increasing the relative humidity
of air improves the fuel cell performance for 60 oC, 70 oC and 80 oC cell
temperatures. Also, higher relative humidity of hydrogen increases the fuel cell
performance.
From the modeling results, increasing the relative humidity of reactants decreases
the internal resistance in the fuel cell. However, increasing the relative humidity
increases the transfer coefficient and limiting current density.
It is seen that relative humidity of reactant gases have a significant effect on
internal resistance. Increasing relative humidity of reactant gases improves the
fuel cell performance as decreasing internal resistances.

86
It is seen that fuel cell performance is highest at 60 oC fuel cell temperature but it
was only tested for two different relative humidity of air condition. So, this
temperature can be more test in order to observe the relative humidity of reactants
on the fuel cell performance at this temperature.

87
REFERENCES
Amirinejad, M., Rowshanzamir, S., Eikani, M. H., Effects of operating parameters on performance of a proton exchange membrane fuel cell, J Power Sources, 161: 872–875, (2006). Amphlett, J. C., Baumert, R. M., Mann, R. F., Peppley, B. A., Roberge, P. R., Performance modelling of the Ballard Mark IV solid polymer electrolyte fuel cell, J. Electrochem. Soc., 142:1–15, (1995). Andreaus, B., Scherer, G. G., Proton-conducting polymer membranes in fuel cells – humidification aspects, Solid State Ionics, 168 (3–4): 311–320, (2004). Barbir, F., PEM Fuel Cells: Theory and Practice, Elsevier Academic Press:USA, (2005). Bayrakçeken, A., Türker, L., Eroğlu, İ., Improvement of carbon dioxide tolerance of PEMFC electrocatalyst by using microwave irradiation technique, Int. J. Hydrogen Energy, 33:7527:7537, (2008a). Bayrakçeken, A., Erkan, S., Türker, L., Eroğlu, İ., Effects of membrane electrode assembly components on proton exchange membrane fuel cell performance, Int. J. Hydrogen Energy, 33:165:170, (2008b). Bernardi, D. M., Verbrugge, M. W., Mathematical model of a gas diffusion electrode bonded to a polymer electrolyte, AIChE J., 37 (8): 1151–1163, (1992). Bevers, D., Wohr, M., Yasuda, K., Oguro, K., Simulation of a polymer electrolyte fuel cell electrode, J. Appl. Electrochem., 27: 1254–1264, (1997). Cai, Y. H., Hu, J., Ma, H. P., Yi, B. L., Zhang, H. M., Effect of water transport properties on a PEM fuel cell operating with dry hydrogen, Electrochim Acta, 51 (28): 6361–6366, (2006). Ceraolo, M., Miulli, C., Pozio, A., Modelling static and dynamic behaviour of proton exchange membrane fuel cells on the basis of electro-chemical description, J. Power Sources, 113 (1): 131-144, (2003) Choi, K. H., Peck, D. H., Kim, C. S., Shin, D. R., Lee, T. H., Water transport in polymer membranes for PEMFC, J Power Sources, 86 (1–2): 197–201, (2000). Colinart, T., Chenu, A., Didierjean, S., Lottin, O., Besse, S., Experimental study on water transport coefficient in Proton Exchange Membrane Fuel Cell, Journal of Power Sources, 190 (2): 230–240, (2009).

88
Dai, W., Haijiang, W., Xiao-Zi, Y., Jonathan, J. M., Daijun, Y., Jinli, Q., Jianxin, M., A review on water balance in the membrane electrode assembly of proton exchange membrane fuel cells, Int. J. Hydrogen Energy, 34: 9461-9478, (2009). Devrim, Y., Erkan, S., Baç, N., Eroğlu, İ., Improvement of PEMFC performance with Nafion/inorganic nanocomposite membrane electrode assembly prepared by ultrasonic coatng technique, xxx: I-II, (2012). Feng, S. G., Xie, X. F., Shang, Y. M., Jin, H., Xu, J. M., Zhou, Q. F., Membranes from sulfonated block copolymer for use in proton exchange membrane fuel cells, Prog Chem, 20 (1): 117–25, (2008). Fıçıcılar B., Eroğlu İ., Nguyen T.V., A Five Layer One-Dimensional PEMFC Model with Detailed Electrode Kinetics, ECS Transactions, 33(1): 1515-1527, (2010). Fuller, T. F., Newman, J., Experimental Determination of the Transport Number of Water in Nafion 117 Membrane, J. Electrochem. Soc., 139 (5): 1332–1337, (1992). Fuller, T. F., Newman, J., Water and thermal management in solid–polymer–electrolyte fuel cells, J. Electrochem. Soc., 140: 1218–1225, (1993). Ge, S. H., Yi, B. L., Ming, P. W., Experimental determination of electro-osmotic drag coefficient in Nafion membrane for fuel cells, J Electrochem Soc., 153 (8): 1443–50, (2006). Güvenatam, B., Fıçıcılar, B., Bayraçeken, A., Eroğlu, İ., Hollow core mesoporous shell carbon supported Pt electroctalysts wit high Pt loading for PEMFCs, Int. J. Hydrogen Energy, 37: 1865-1874, (2012). Haraldsson, K.,Wipke, K., Evaluating PEM fuel cell system models, J Power Sources, 126 (1-2): 88-97, (2004). Himanen, O., Hottinen, T., Mikkola, M., Saarinen, V., Characterization of membrane electrode assembly with hydrogen–hydrogen cell and ac-impedance spectroscopy – Part I, Experimental Electrochim Acta, 52 (1): 206–214,(2006). Hirano, S., Kim, J., Srinivasan, S., High performance proton exchange membrane fuel cells with sputter-deposited Pt layer electrodes, Electrochim Acta, 42: 1587-93, (1997). Hoogers, G., Fuel Cell Technoogy Handbook, CRC Press, Boca Raton, FL, (2003). Husar, A., Higier, A., Liu, H., In situ measurements of water transfer due to different mechanisms in a proton exchange membrane fuel cell, J Power Sources, 183 (1): 240–6, (2008).
89
Ise, M., Kreuer, K. D., Maier, J., Electroosmotic drag in polymer electrolyte membranes: an electrophoretic NMR study Solid State Ionics, 125 (1–4): 213–223, (1999). Janssen, G. J. M, Overvelde, M. L. J., Water transport in the proton-exchange-membrane fuel cell: measurements of the effective drag coefficient, J Power Sources, 101 (1): 117–25, (2001). Ji, M., Dai, Z., A Review of Water Management in Polymer Electrolyte Membrane Fuel Cells, Energies, 2 (4): 1057-1106, (2009). Kreuer, K. D., Proton conductivity: materials and applications, Chem Mater, 8 (3): 610–41, (1996). Larminie, J., Dicks, A., Fuel Cell Systems Explained, John Wiley & Sons Ltd., Chichester, GB, 2003. Lee, J. M., Ito, T., Yamaguchi, T., Development and modification of a PEMFC electrode by using a hydrocarbon lonomer for high utilization of catalyst, J Chem Eng Jpn, 40 (9): 773–9, (2007). Lee, J. H., Lalk, T. R., Appleby A. J., Modeling electrochemical performance in large scale proton exchange membrane fuel cell stacks, J. Power Sources, 70: 258–268, (1998). Liu, F. Q., Lu, Wang, C. Y., Water transport coefficient distribution through the membrane in a polymer electrolyte fuel cell, J Membr Sci, 287 (1): 126–131, (2007). Lu, G. Q., Liu, F. Q., Wang, C. Y., An approach to measuring spatially resolved water crossover coefficient in a polymer electrolyte fuel cell, J Power Sources, 164 (1): 134–140, (2007). Maranzana, G., Lottin, O., Colinart, T., Chupin, S., Didierjean, S., J. Power Sources, A multi-instrumented polymer exchange membrane fuel cell: Observation of the in-plane non-homogeneities, 180 (2): 748–754, (2008). Mauritz, K. A., Moore, R. B., State of understanding of nafion, Chem Rev., 104 (10): 4535–86, (2004). Miyatake, K., Watanabe, M., Recent progress in proton conducting membranes for PEFCs. Electrochemistry, 73 (1): 12–9, (2005). Morris, D. R., Sun, X., Water-sorption and transport properties of Nafion 117 H, J Appl Polym Sci, 50 (8): 1445–1452, (1993). Motupally, S., Becker, A. J., Daidner JW., Diffusion of water in Nafion 115 membranes. J Electrochem Soc., 147 (9): 3171–3177, (2000).

90
Murahashi, T., Naiki, M., Nishiyama, E., Water transport in the proton exchange-membrane fuel cell: comparison of model computation and measurements of effective drag, J Power Sources, 162 (2): 1130–1136, (2006). Nakamoto, H., Watanabe, M., Bronsted acid–base ionic liquids for fuel cell electrolytes, Chem Commun., 24: 2539–41, (2007). Nazarov, I., Promislow, K., The impact of membrane constraint on PEM fuel cell water management, J Electrochem Soc., 154 (7): 623–30, (2007). Newman, J. S., Electrochemical Systems, Second ed.,Prentice Hall, Englewood Cliffs, NJ, (1991). Nguyen, T.V., White, R.E., A water and heat management model for proton-exchange-membrane fuel-cells, J Electrochem Soc, 140 (8): 2178–2186, (1993). Pantea, D., Darmstadt, H., Kaliaguine, S., Summchen, ., Roy, C., Electrical conductivity of thermal carbon blacks:Influence of surface chemistry, Carbon, 39: 1147-58, (2001). Parthasarathy, A., Supramaniam, S., Appleby, A. J., Martin, C. R., Temperature dependence of the electrode kinetics reduction at the platinum/Nafion interface—a microelectrode investigation, J. Electrochem. Soc., 139: 2530–2537, (1992). Pérez, P. M., Pérez-Herranz, V., Effect of the Operation and Humidification Temperatures on the Performance of a Pem Fuel Cell Stack on Dead-End Mode, Int. J. Electrochem. Sci., 6 (1): 492 – 505, (2011). Pisani, L., Murgia, G., Valentini, M., D’Aguanno, B., A new semi-empirical approach to performance curves of polymer electrolyte fuel cells, J. Power Sources, 108: 192–203, (2002). Pivovar, B. S., An overview of electro-osmosis in fuel cell polymer electrolytes, Polymer, 47 (11): 4194–202, (2006). Ren, X. M., Henderson, W., Gottesfeld, S., Electro-osmotic drag of water in ionomeric membranes – new measurements employing a direct methanol fuel cell, J Electrochem Soc, 144 (9): 267–270, (1997). Rivin, D., Kendrick, C. E., Gibson, P. W., Schneider, N. S., Solubility and transport behavior of water and alcohols in Nafion(TM), Polymer 42 (2): 623–35, (2001). Rodatz, P., Büchi, F., Onder, C., Guzzella, L., Operational aspects of a large PEFC stack under practical conditions, J. Power Sources, 128 (2): 208-217, (2004). Rodríguez, M. B., Araceli Rosas Paleta, M. G., Antonio Rivera Marquez, J., Belén Tapia Pachuca, A., Roberto García de la Vega, J., Effect of a Rigid Gas

91
Diffusion Media Applied as Distributor of Reagents in a PEMFC in Operation, Part I: Dry Gases, Int. J. Electrochem. Sci., 4: 1754 – 1760, (2009). Roelofs, M., Membrane issues for PEM fuel cells, NSF Workshop, Arlington, Virginia, November 14, 2001. Saab, P., Garzan, F. H., Zawodzinski, T. A., Determination of ionic and electronic resistivities in carbon/polylelectrolyte fuel cell composite electrodes, J Electrochem Soc., 149: 1541-6, (2002). Santarelli, M. G., Torchio, M. F., Cochis, P., Parameters estimation of a PEM fuel cell polarization curve and analysis of their behavior with temperature, Journal of Power Sources, 159: 824–835, (2006). Sauriol, P., Kim, G., Bi, H. T., Stumper, J., St-Pierre, J., Comparison between Pemfc Water Management Model and in-Situ Water Transfer Measurements, AIChE Annual Meeting, 2005. Schmidt-Rohr, K., Chen, Q., Parallel cylindrical water nanochannels in Nafion fuel cell membranes. Nat Mater,7(1): 75-83, (2008). Springer, T. E., Zawodzinski, T. A., Gottesfeld, S., Polymer electrolyte fuel-cell model, J Electrochem Soc, 138 (8): 2334–2342, (1991). Squadrito, G., Maggio, G., Passalacqua, E., Lufrano, F., Patti, A., An empirical equation for polymer electrolyte fuel cell (PEFC) behaviour, J. Appl. Electrochem., 29: 1449–1455, (1999). Takaichi, S., Uchida, H., Watanabe, M., Response of specific resistance distribution in electrolyte membrane to load change at PEFC operation, J Electrochem Soc., 154 (12): 1373–1377, (2007). Verbrugge, M. W., Schneider, E. W., Conell, R. S., Hill, R. F., The effect of temperature on the equilibrium and transport-properties of saturated poly(perfluorosulfonic acid) membranes, J Electrochem Soc., 139 (12): 3421–8, (1992). Wang, L., Husar, A., Zhou, T., Liu, H., A parametric study of PEM fuel cell performances, Int. J. Hydrogen Energy, 28: 1263–1272, (2003). Weber, A. Z., Newman, J., A theoretical study of membrane constraint in polymer–electrolyte fuel cells, AlChE J., 50 (12): 3215–26, (2004). Weng, F. B., Yan, W. M, Duan, Y. Y., Wang, X. D., Effect of humidity of reactants on the cell performance of PEM fuel cells with parallel and interdigitated flow field designs, Journal of Power Sources, 176 (1): 247-258, (2008).
92
Wohr, M., Holwin, K., Schurnberger, W., Fischer, M., Neubrnad, W., Eigenberger, G., Dynamic modeling and simulation of a polymer membrane fuel cell including mass transport limitation, Int. J. Hydrogen Energy, 23 (3): 213–218, (1998). Yan, Q. G., Toghiani, H., Wu, J. X., Investigation of water transport through membrane in a PEM fuel cell by water balance experiments, J Power Sources, 158 (1): 316–325, (2006). Yang, X. G., Burke, N., Wang, C. Y., Tajiri, K., Shinohara K., Simultaneous measurements of species and current distributions in a PEFC under low-humidity operation, J Electrochem Soc, 152 (4): 759–766, (2005). Ye, X. H., Wang, C. Y., Measurement of water transport properties through membrane electrode assemblies – Part II. Air diffusion media, J Electrochem Soc., 154 (7): 683–6, (2007). You, L., Liu, H., A parametric study of the air catalyst layer of PEM fuel cells using a pseudo-homogeneous model, Int. J. Hydrogen Energy, 26: 991–999, (2001). Youssef E. M., Khairia E.AL-NAdi, Moataz H.Khalil, Lumped Model for Proton Exchange Membrane Fuel Cell (PEMFC), Int. J. Electrochem. Sci., 5 (1): 267 – 277, (2010). Yu, X., Zhou, B., Sobiesiak, A., Water and Thermal Management for Ballard PEM Fuel Cell Stack, J. Power Sources, 147 (1-2): 184-195, (2005). Zawodzinski, T. A., Davey, J., Valerio, J., Gottesfeld, S., The water-content dependence of electroosmotic drag in proton-conducting polymer electrolytes, Electrochim Acta, 40 (3): 297–302, (1995). Zawodzinski, T. A., Derouin, C., Radzinski, S., Sherman, R. J., Smith, V. T., Springer, S., Gottesfeld, T. E., Water Uptake by and Transport Through Nation 117 Membranes, J. Electrochem. Soc., 140 (4): 1041–1047, (1993). Zhang, J., Pem Fuel Cell Electrocatalyst and Catalyst Layers Fundementals and Applications, Springer, Canada, 1-50, (2008).

93
APPENDIX A
EXPERIMENTAL DATA
Table A.1 Polarization curve data obtained at 60 °C
100 % RH H2
% RH Air
30 50 Voltage
(V) Current
(A) Voltage
(V) Current
(A) 0.97 0.00 0.96 0.00
0.90 0.10 0.90 0.07
0.85 0.43 0.85 0.36
0.80 1.04 0.80 1.01
0.75 1.94 0.75 2.05
0.70 3.05 0.70 3.39
0.65 4.34 0.65 4.88
0.60 6.04 0.60 6.73
0.55 7.88 0.55 8.92
0.50 10.07 0.50 11.54
0.45 12.37 0.45 13.51
0.40 14.78 0.40 16.38
0.35 16.43 0.35 18.04

Table A.2 Polarization curve data obtained at 70 °C
100 % RH H2 50 % RH H2 % RH Air % RH Air
20 30 50 70 100 70 Voltage
(V) Current
(A) Voltage
(V) Current
(A) Voltage
(V) Current
(A) Voltage
(V) Current
(A) Voltage
(V) Current
(A) Voltage
(V) Current
(A) 0.98 0 0.98 0 0.97 0 0.95 0 0.94 0 0.93 0 0.9 0.09 0.9 0.08 0.9 0.15 0.9 0.01 0.9 0 0.88 0.03 0.85 0.35 0.85 0.34 0.85 0.3 0.88 0.05 0.88 0.04 0.86 0.05 0.8 0.85 0.8 0.88 0.8 0.85 0.86 0.11 0.86 0.07 0.84 0.13 0.75 1.54 0.75 1.71 0.75 1.74 0.84 0.23 0.84 0.16 0.82 0.2 0.7 2.42 0.7 2.67 0.7 2.83 0.82 0.38 0.82 0.24 0.8 0.28 0.65 3.44 0.65 3.77 0.65 3.89 0.8 0.54 0.8 0.37 0.78 0.43 0.6 4.62 0.6 4.95 0.6 5.81 0.78 0.78 0.78 0.52 0.76 0.57 0.55 5.64 0.55 6.68 0.55 7.61 0.76 1.06 0.76 0.62 0.74 0.72 0.5 7.22 0.5 7.94 0.5 8.8 0.74 1.38 0.74 0.89 0.72 1.03 0.45 8.04 0.45 9.43 0.45 11.99 0.72 1.7 0.72 1.11 0.7 1.47 0.4 8.94 0.4 10.18 0.4 13.22 0.7 2.08 0.7 1.42 0.68 1.78 0.35 9.35 0.35 11.07 0.35 15.04 0.68 2.55 0.68 1.78 0.66 2
0.66 3.05 0.66 2.08 0.64 2.31 0.64 3.57 0.64 2.82 0.62 2.93 0.62 4.05 0.62 3.26 0.6 3.01
94
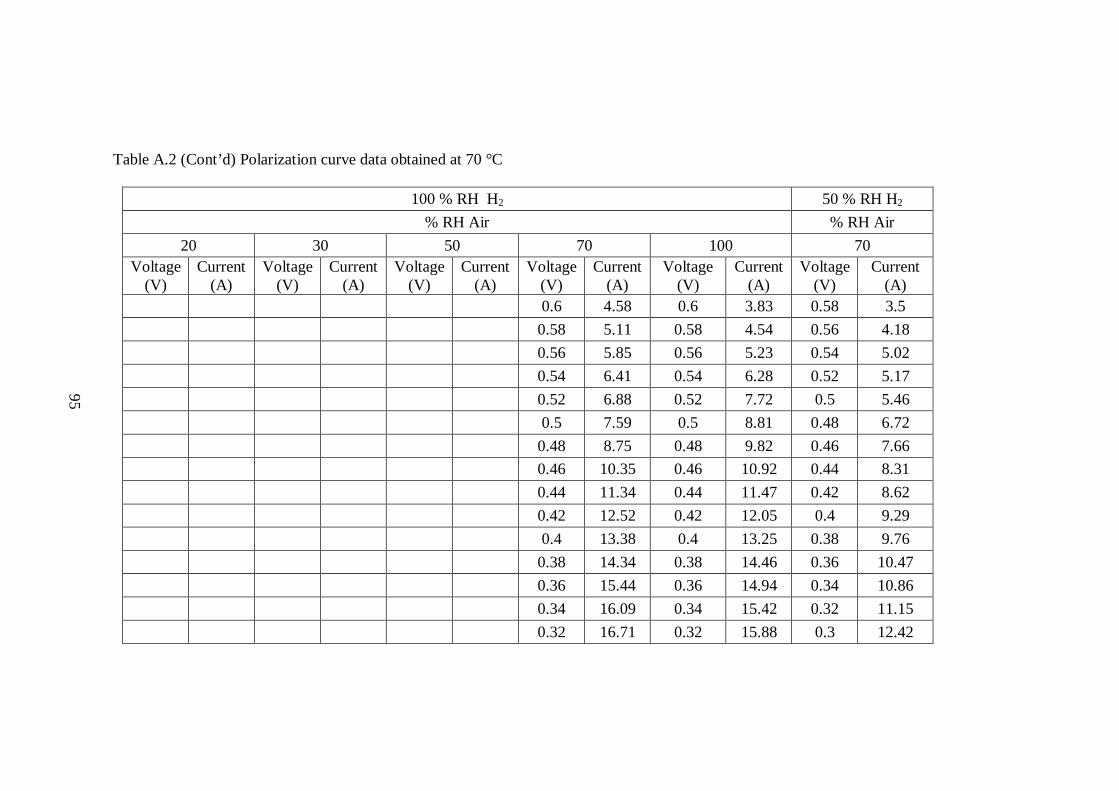
Table A.2 (Cont’d) Polarization curve data obtained at 70 °C
100 % RH H2 50 % RH H2 % RH Air % RH Air
20 30 50 70 100 70 Voltage
(V) Current
(A) Voltage
(V) Current
(A) Voltage
(V) Current
(A) Voltage
(V) Current
(A) Voltage
(V) Current
(A) Voltage
(V) Current
(A) 0.6 4.58 0.6 3.83 0.58 3.5 0.58 5.11 0.58 4.54 0.56 4.18 0.56 5.85 0.56 5.23 0.54 5.02 0.54 6.41 0.54 6.28 0.52 5.17 0.52 6.88 0.52 7.72 0.5 5.46 0.5 7.59 0.5 8.81 0.48 6.72 0.48 8.75 0.48 9.82 0.46 7.66 0.46 10.35 0.46 10.92 0.44 8.31 0.44 11.34 0.44 11.47 0.42 8.62 0.42 12.52 0.42 12.05 0.4 9.29 0.4 13.38 0.4 13.25 0.38 9.76 0.38 14.34 0.38 14.46 0.36 10.47 0.36 15.44 0.36 14.94 0.34 10.86 0.34 16.09 0.34 15.42 0.32 11.15 0.32 16.71 0.32 15.88 0.3 12.42
95
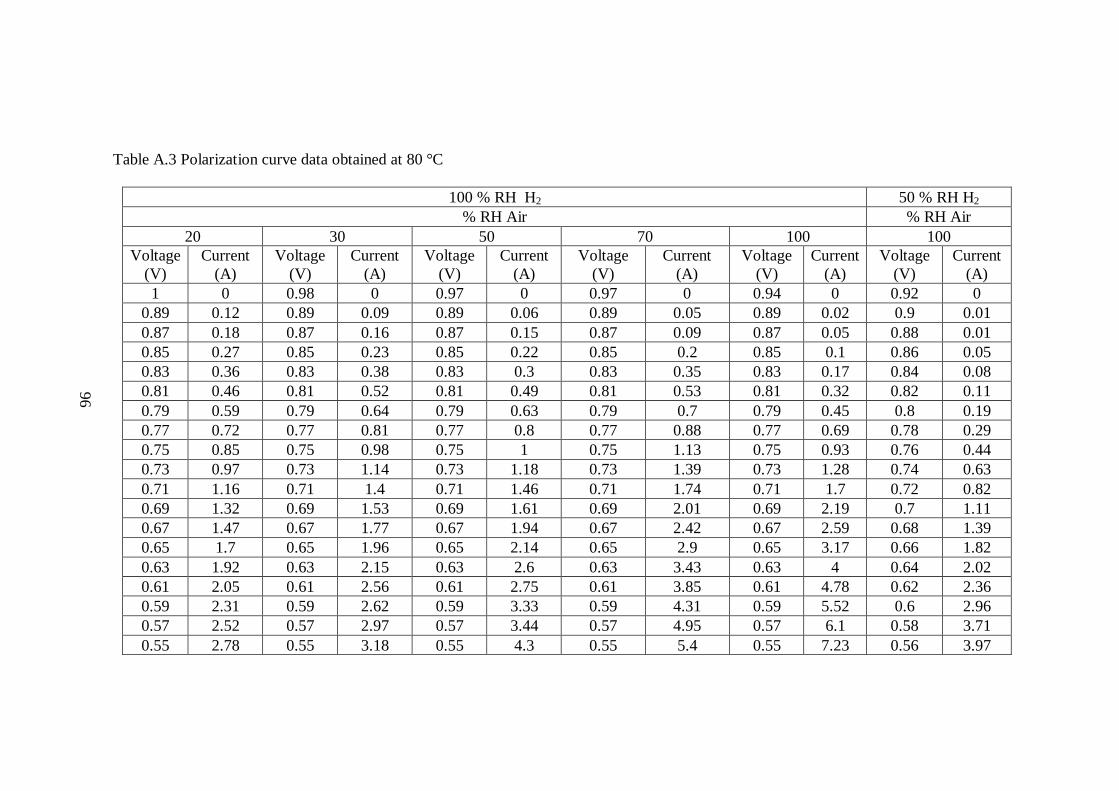
Table A.3 Polarization curve data obtained at 80 °C
100 % RH H2 50 % RH H2 % RH Air % RH Air
20 30 50 70 100 100 Voltage
(V) Current
(A) Voltage
(V) Current
(A) Voltage
(V) Current
(A) Voltage
(V) Current
(A) Voltage
(V) Current
(A) Voltage
(V) Current
(A) 1 0 0.98 0 0.97 0 0.97 0 0.94 0 0.92 0
0.89 0.12 0.89 0.09 0.89 0.06 0.89 0.05 0.89 0.02 0.9 0.01 0.87 0.18 0.87 0.16 0.87 0.15 0.87 0.09 0.87 0.05 0.88 0.01 0.85 0.27 0.85 0.23 0.85 0.22 0.85 0.2 0.85 0.1 0.86 0.05 0.83 0.36 0.83 0.38 0.83 0.3 0.83 0.35 0.83 0.17 0.84 0.08 0.81 0.46 0.81 0.52 0.81 0.49 0.81 0.53 0.81 0.32 0.82 0.11 0.79 0.59 0.79 0.64 0.79 0.63 0.79 0.7 0.79 0.45 0.8 0.19 0.77 0.72 0.77 0.81 0.77 0.8 0.77 0.88 0.77 0.69 0.78 0.29 0.75 0.85 0.75 0.98 0.75 1 0.75 1.13 0.75 0.93 0.76 0.44 0.73 0.97 0.73 1.14 0.73 1.18 0.73 1.39 0.73 1.28 0.74 0.63 0.71 1.16 0.71 1.4 0.71 1.46 0.71 1.74 0.71 1.7 0.72 0.82 0.69 1.32 0.69 1.53 0.69 1.61 0.69 2.01 0.69 2.19 0.7 1.11 0.67 1.47 0.67 1.77 0.67 1.94 0.67 2.42 0.67 2.59 0.68 1.39 0.65 1.7 0.65 1.96 0.65 2.14 0.65 2.9 0.65 3.17 0.66 1.82 0.63 1.92 0.63 2.15 0.63 2.6 0.63 3.43 0.63 4 0.64 2.02 0.61 2.05 0.61 2.56 0.61 2.75 0.61 3.85 0.61 4.78 0.62 2.36 0.59 2.31 0.59 2.62 0.59 3.33 0.59 4.31 0.59 5.52 0.6 2.96 0.57 2.52 0.57 2.97 0.57 3.44 0.57 4.95 0.57 6.1 0.58 3.71 0.55 2.78 0.55 3.18 0.55 4.3 0.55 5.4 0.55 7.23 0.56 3.97
96

Table A.3 (Cont’d) Polarization curve data obtained at 80 °C
100 % RH H2 50 % RH H2 % RH Air % RH Air
20 30 50 70 100 100 Voltage
(V) Current
(A) Voltage
(V) Current
(A) Voltage
(V) Current
(A) Voltage
(V) Current
(A) Voltage
(V) Current
(A) Voltage
(V) Current
(A) 0.53 3.13 0.53 3.62 0.53 4.7 0.53 6.15 0.53 7.97 0.54 4.32 0.51 3.51 0.51 3.93 0.51 5.02 0.51 6.74 0.51 8.43 0.52 4.93 0.49 4.07 0.49 4.13 0.49 5.62 0.49 7.26 0.49 9.27 0.5 5.53 0.47 4.51 0.47 4.35 0.47 6.09 0.47 8.17 0.47 10.29 0.48 5.74 0.45 4.99 0.45 4.78 0.45 6.65 0.45 8.67 0.45 10.84 0.46 5.91 0.43 5.18 0.43 5.04 0.43 7.07 0.43 9.12 0.43 11.44 0.44 6.68 0.41 5.52 0.41 5.65 0.41 7.78 0.41 9.8 0.41 12.48 0.42 7.86 0.39 5.83 0.39 6.12 0.39 8.12 0.39 10.48 0.39 13.7 0.4 8.24 0.37 6.16 0.37 6.13 0.37 8.88 0.37 11.1 0.37 14.84 0.38 8.98 0.35 6.46 0.35 7.07 0.35 9.27 0.35 11.72 0.35 15.34 0.36 9.52 0.33 6.78 0.33 7.18 0.33 9.81 0.33 12.23 0.34 10.49 0.31 6.95 0.31 7.9 0.31 10.47 0.31 12.44 0.32 10.75 0.29 7.17 0.29 8.9 0.29 10.71 0.29 12.57 0.3 11.13 0.27 7.41 0.27 9.36 0.27 11.06 0.28 12.62 0.25 7.86 0.25 9.44 0.25 11.57 0.26 13.21 0.23 8.35 0.23 9.54 0.23 11.69 0.24 13.98
0.21 9.55 0.21 11.98 0.22 14.11
97

98
APPENDIX B
MODELING RESULTS
In order to fit experimental data to Butler Volmer equation, MATLAB code is as
below and the model results are given in the figures from Figure B1 to B14.
x=[0.0001; 0.004; 0.01707; 0.04173; 0.0776; 0.12213; 0.1736; 0.24173; 0.3152;
0.40293; 0.4948; 0.59107; 0.6572];
y=[0.96967; 0.9; 0.85; 0.8; 0.75; 0.7; 0.65; 0.6; 0.55; 0.5; 0.45; 0.4; 0.35];
E0=1.2; % Volt R=8.31434; % J/kmol.K F=96485; % C/mol % alfa=1.5; % io=3*10^(-6); % A/cm2 % Res=0.15; % ohm.cm2 % iL=1.6; % A/cm2 T= 333; % K n=2; % electron maxIL=0.6573; mymodel = @(alpha, I0, IL, Ri, x)... E0-((R*T)./(alpha*F)).*log(x./I0)-((R*T)./(n*F)).*log(IL./(IL-x))-x.*Ri; % cevap=fit(x,y,mymodel,'StartingPoint',[0.5,0.4,0.3,0.1],'Lower', [0,0.0000000001,0.83,0], 'Robust', 'LAR') % cevap=fit(x,y,mymodel,'Lower', [0,0.0000000001,0.83,0],'Upper', [Inf,1,1,Inf], 'Robust', 'LAR') [cevap,gof]=fit(x,y,mymodel,'Startpoint', [0.7,5e-7,0.6574,1],'Lower', [0,0.0000000001,x(length(x)),0],'Upper', [Inf,1,maxIL,Inf], 'Robust', 'LAR') alpha=cevap.alpha; I0=cevap.I0; IL=cevap.IL; Ri=cevap.Ri; figure; plot(x,y,'k*-');
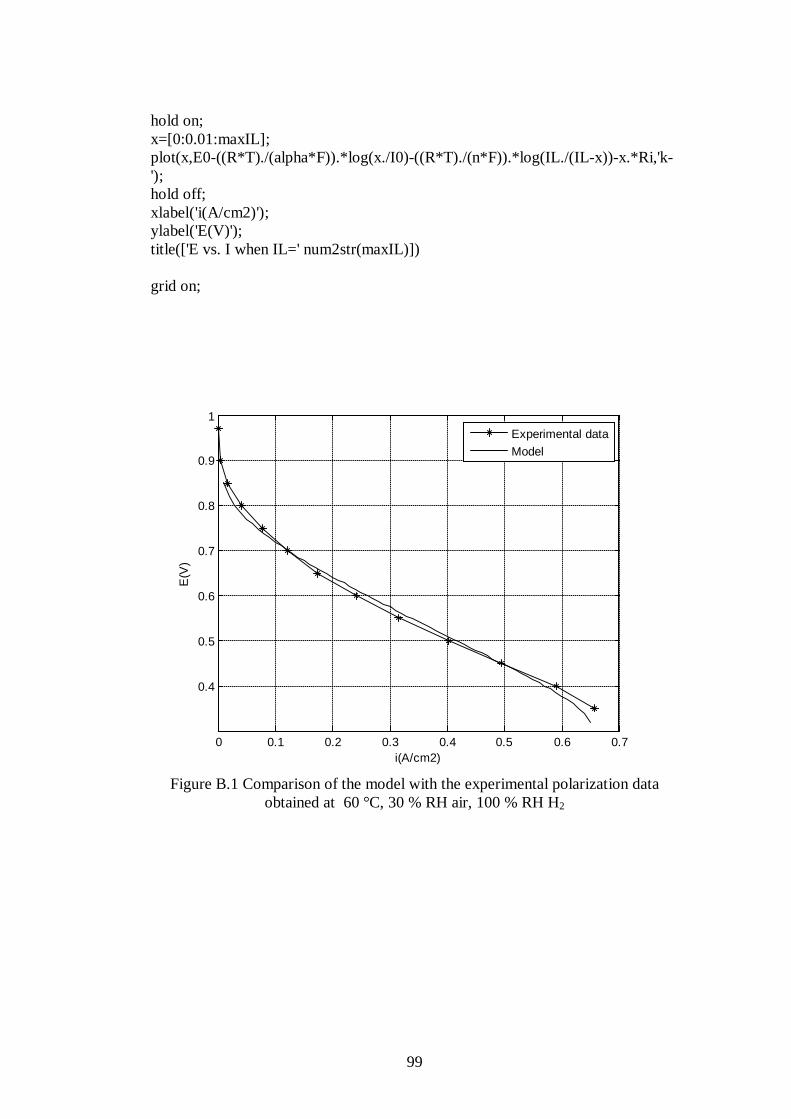
99
hold on; x=[0:0.01:maxIL]; plot(x,E0-((R*T)./(alpha*F)).*log(x./I0)-((R*T)./(n*F)).*log(IL./(IL-x))-x.*Ri,'k-'); hold off; xlabel('i(A/cm2)'); ylabel('E(V)'); title(['E vs. I when IL=' num2str(maxIL)]) grid on;
Figure B.1 Comparison of the model with the experimental polarization data
obtained at 60 °C, 30 % RH air, 100 % RH H2
0 0.1 0.2 0.3 0.4 0.5 0.6 0.7
0.4
0.5
0.6
0.7
0.8
0.9
1
i(A/cm2)
E(V
)
Experimental dataModel

100
Figure B.2 Comparison of the model with the experimental polarization data
obtained at 60 °C, 50 % RH air, 100 % RH H2
Figure B.3 Comparison of the model with the experimental polarization data
obtained at 70 °C, 20 % RH air, 100 % RH H2
0 0.1 0.2 0.3 0.4 0.5 0.6 0.7 0.80.2
0.3
0.4
0.5
0.6
0.7
0.8
0.9
1
i(A/cm2)
E(V
)
Experimental dataModel
0 0.05 0.1 0.15 0.2 0.25 0.3 0.35 0.4
0.4
0.5
0.6
0.7
0.8
0.9
1
i(A/cm2)
E(V
)
Experimental dataModel

101
Figure B.4 Comparison of the model with the experimental polarization data
obtained at 70 °C, 30 % RH air, 100 % RH H2
Figure B.5 Comparison of the model with the experimental polarization data
obtained at 70 °C, 50 % RH air, 100 % RH H2
0 0.05 0.1 0.15 0.2 0.25 0.3 0.35 0.4 0.45
0.4
0.5
0.6
0.7
0.8
0.9
1
i(A/cm2)
E(V
)
Experimental dataModel
0 0.1 0.2 0.3 0.4 0.5 0.6 0.70.2
0.3
0.4
0.5
0.6
0.7
0.8
0.9
1
i(A/cm2)
E(V
)
Experimental dataModel

102
Figure B.6 Comparison of the model with the experimental polarization data
obtained at 70 °C, 70 % RH air, 100 % RH H2
Figure B.7 Comparison of the model with the experimental polarization data
obtained at 70 °C, 100 % RH air, 100 % RH H2
0 0.1 0.2 0.3 0.4 0.5 0.6 0.7 0.80.2
0.3
0.4
0.5
0.6
0.7
0.8
0.9
1
i(A/cm2)
E(V
)
Experimental dataModel
0 0.1 0.2 0.3 0.4 0.5 0.6 0.7
0.4
0.5
0.6
0.7
0.8
0.9
1
i(A/cm2)
E(V
)
Experimental dataModel

103
Figure B.8 Comparison of the model with the experimental polarization data
obtained at 80 °C, 20 % RH air, 100 % RH H2
Figure B.9 Comparison of the model with the experimental polarization data
obtained at 80 °C, 30 % RH air, 100 % RH H2
0 0.05 0.1 0.15 0.2 0.25 0.3 0.350.2
0.3
0.4
0.5
0.6
0.7
0.8
0.9
1
i(A/cm2)
E(V
)
Experimental dataModel
0 0.05 0.1 0.15 0.2 0.25 0.3 0.35 0.40.1
0.2
0.3
0.4
0.5
0.6
0.7
0.8
0.9
i(A/cm2)
E(V
)
Experimental dataModel

104
Figure B.10 Comparison of the model with the experimental polarization data
obtained at 80 °C, 50 % RH air, 100 % RH H2
Figure B.11 Comparison of the model with the experimental polarization data
obtained at 80 °C, 70 % RH air, 100 % RH H2
0 0.05 0.1 0.15 0.2 0.25 0.3 0.35 0.4 0.45 0.50.1
0.2
0.3
0.4
0.5
0.6
0.7
0.8
0.9
i(A/cm2)
E(V
)
Experimental dataModel
0 0.1 0.2 0.3 0.4 0.5 0.6 0.70.2
0.3
0.4
0.5
0.6
0.7
0.8
0.9
1
i(A/cm2)
E(V
)
Experimental dataModel

105
Figure B.12 Comparison of the model with the experimental polarization data
obtained at 80 °C, 100 % RH air, 100 % RH H2
Figure B.13 Comparison of the model with the experimental polarization data
obtained at 70 °C, 70 % RH air, 50 % RH H2
0 0.1 0.2 0.3 0.4 0.5 0.6 0.7
0.4
0.5
0.6
0.7
0.8
0.9
1
i(A/cm2)
E(V
)
Experimental dataModel
0 0.1 0.2 0.3 0.4 0.5 0.6 0.70.1
0.2
0.3
0.4
0.5
0.6
0.7
0.8
0.9
1
i(A/cm2)
E(V
)
Experimental dataModel
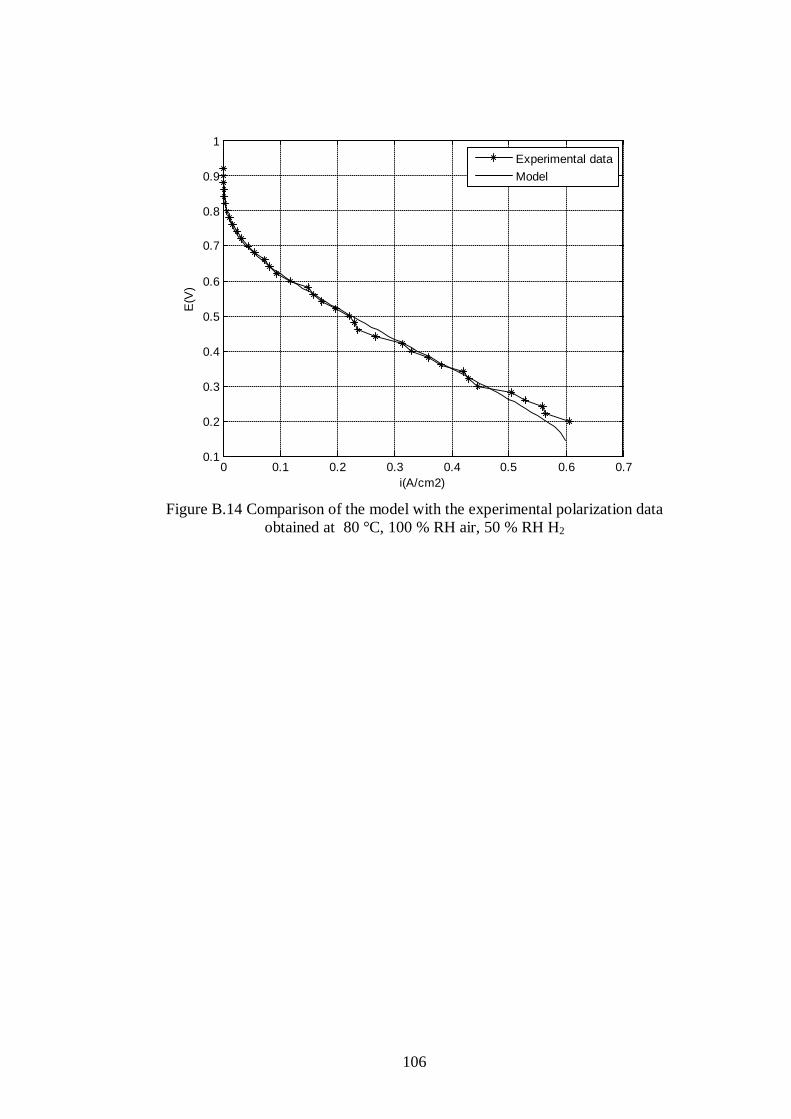
106
Figure B.14 Comparison of the model with the experimental polarization data
obtained at 80 °C, 100 % RH air, 50 % RH H2
0 0.1 0.2 0.3 0.4 0.5 0.6 0.70.1
0.2
0.3
0.4
0.5
0.6
0.7
0.8
0.9
1
i(A/cm2)
E(V
)
Experimental dataModel

107
APPENDIX C
SAMPLE CALCULATIONS
Standardization Values
It is often convenient to assume an ideal gas when specifying flows of gases, then
covert the volumetric flows into standardized flow. There are many different
standardization temperatures (i.e. 25 °C, 15 °C, 0 °C, etc.).
At 15 °C standard temperature:
Ideal Gas Constant (R): 8.31411 J / (mole K)
Standard Pressure: 101325 Pa
Water Constants
Density of Liquid Water: 1 g / ml
The atomic mass of water = 18.015 g / mole
Using the standardization values calculated above, and the atomic weight of
water, the density of water vapor at the specified standard conditions can be
calculated.
The density of water vapor at 15 °C : 18.02 / 22413: 8x10⁻⁴ g/sml
1/ The density of water vapor at 15 °C: 1 / 8x10⁻⁴: 1244.1 sml / g H2O

108
Calculation of A Dew Point to Achieve a Desired Relative Humidity
Relative humidity is the actual water vapor pressure within a system divided by
the water vapor pressure of the system at its dew point. The saturation vapor
pressure is only a function of temperature. This means we can ignore pressure
when calculating relative humidity. Thus if a gas being saturated to a given dew
point, and then heated up, we can calculate the relative humidity as follows:
As an example, for 60 °C cell temperature, in order to supply air at 30 % relative
humidity, required dew point was calculated.
ASHRAE Fundamentals (1981), provides Antoine equation that allows us to
calculate the saturation pressure (in Pa) for any given temperature between 0 oC
and 100 oC:
Pvs = eaT−1+b+cT+dT2+eT3+ln(T)
The coefficients are:
a = −5800.22
b = 1.39
c = −0.05
d = 0.42
e = −0.14
f = 6.55
For 60 °C= 333.15 K;
Pvs
= e(−5800.22)333.15−1+(1.39)+(−0.05)(333.15)+(0.42)333.152+(−0.14)333.153+(6.55)ln(333.15)
Pvs = 19.94 kPa
Water Partial Pressure = Saturation Vapor Pressure ∗ Relative Humidity
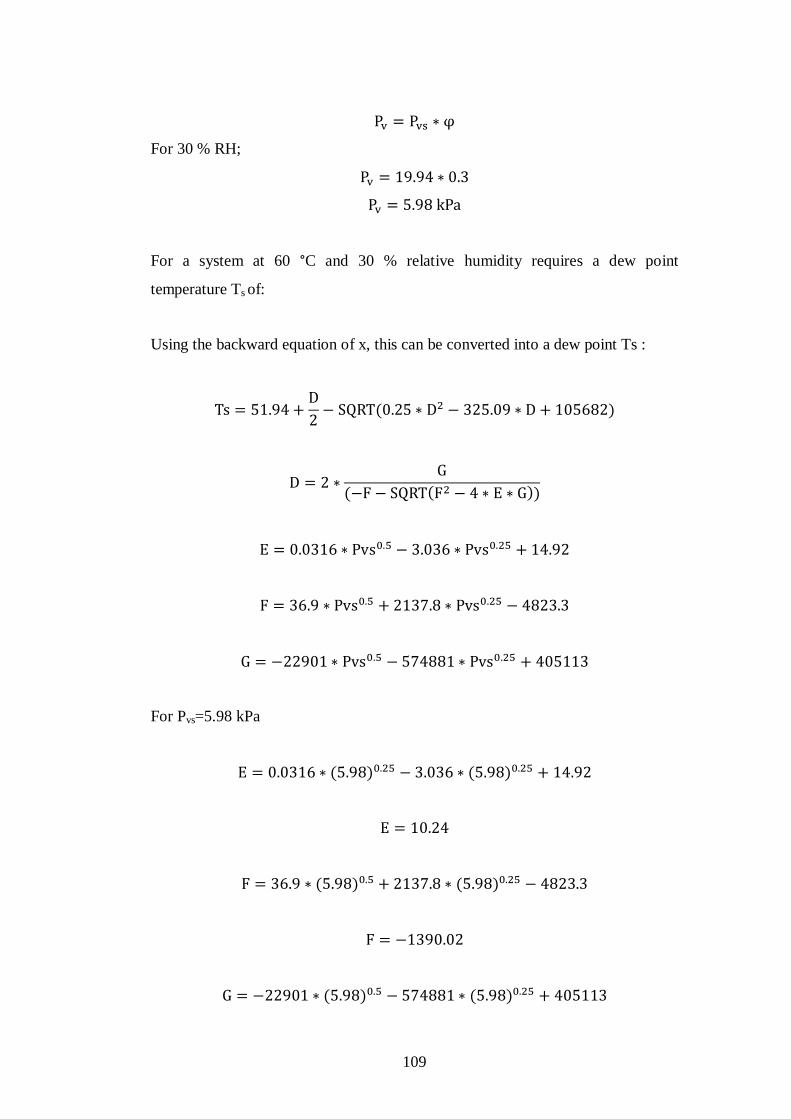
109
Pv = Pvs ∗ φ
For 30 % RH;
Pv = 19.94 ∗ 0.3
Pv = 5.98 kPa
For a system at 60 °C and 30 % relative humidity requires a dew point
temperature Ts of:
Using the backward equation of x, this can be converted into a dew point Ts :
Ts = 51.94 +D2 − SQRT(0.25 ∗ D2 − 325.09 ∗ D + 105682)
D = 2 ∗G
(−F − SQRT(F2 − 4 ∗ E ∗ G))
E = 0.0316 ∗ Pvs0.5 − 3.036 ∗ Pvs0.25 + 14.92
F = 36.9 ∗ Pvs0.5 + 2137.8 ∗ Pvs0.25 − 4823.3
G = −22901 ∗ Pvs0.5 − 574881 ∗ Pvs0.25 + 405113
For Pvs=5.98 kPa
E = 0.0316 ∗ (5.98)0.25 − 3.036 ∗ (5.98)0.25 + 14.92
E = 10.24
F = 36.9 ∗ (5.98)0.5 + 2137.8 ∗ (5.98)0.25 − 4823.3
F = −1390.02
G = −22901 ∗ (5.98)0.5 − 574881 ∗ (5.98)0.25 + 405113
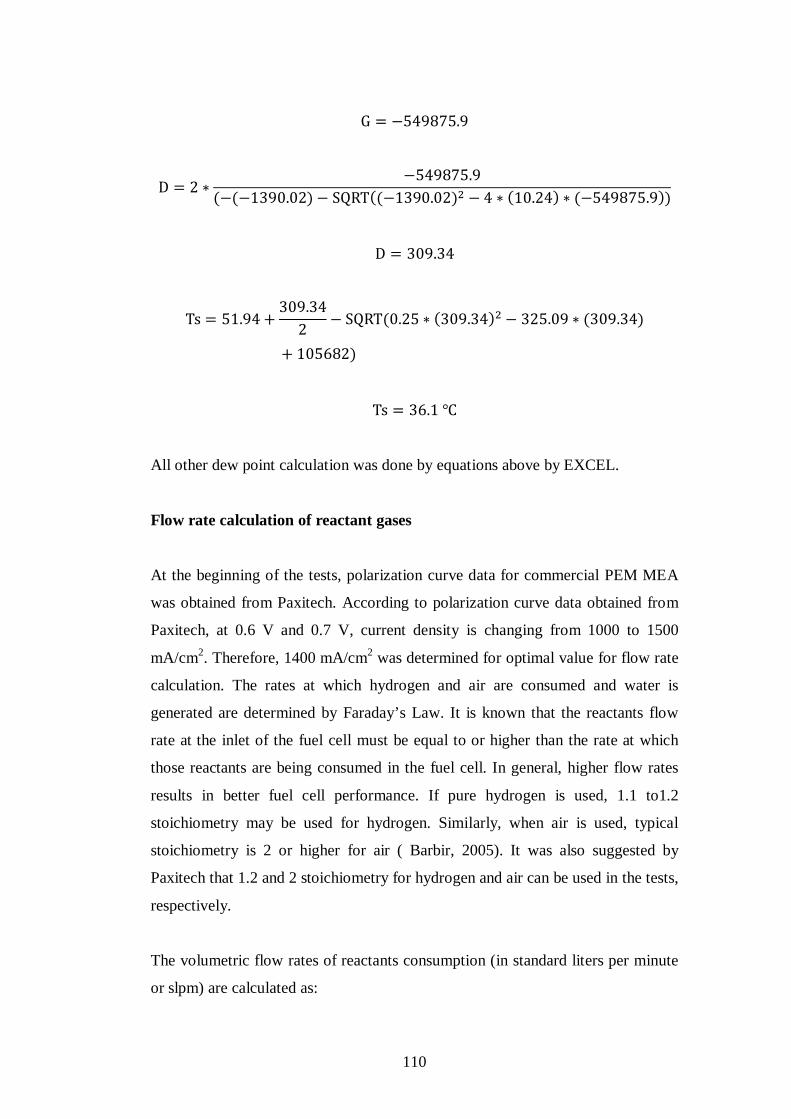
110
G = −549875.9
D = 2 ∗−549875.9
(−(−1390.02)− SQRT((−1390.02)2 − 4 ∗ (10.24) ∗ (−549875.9))
D = 309.34
Ts = 51.94 +309.34
2 − SQRT(0.25 ∗ (309.34)2 − 325.09 ∗ (309.34)
+ 105682)
Ts = 36.1
All other dew point calculation was done by equations above by EXCEL.
Flow rate calculation of reactant gases
At the beginning of the tests, polarization curve data for commercial PEM MEA
was obtained from Paxitech. According to polarization curve data obtained from
Paxitech, at 0.6 V and 0.7 V, current density is changing from 1000 to 1500
mA/cm2. Therefore, 1400 mA/cm2 was determined for optimal value for flow rate
calculation. The rates at which hydrogen and air are consumed and water is
generated are determined by Faraday’s Law. It is known that the reactants flow
rate at the inlet of the fuel cell must be equal to or higher than the rate at which
those reactants are being consumed in the fuel cell. In general, higher flow rates
results in better fuel cell performance. If pure hydrogen is used, 1.1 to1.2
stoichiometry may be used for hydrogen. Similarly, when air is used, typical
stoichiometry is 2 or higher for air ( Barbir, 2005). It was also suggested by
Paxitech that 1.2 and 2 stoichiometry for hydrogen and air can be used in the tests,
respectively.
The volumetric flow rates of reactants consumption (in standard liters per minute
or slpm) are calculated as:

111
VH2 = 23.65x60xI
2F
VAir =1
rO223.65x60x
I4F
For 25 cm2 PEM MEA, current is calculated at a current density of 1400 mA/cm2
as:
1400mA
cm2 x1A
1000mA x25cm2 = 35A
VH2 = 23.65x60 x 35
2x96485
VH2 = 0.257 slpm
With a stoichiometry of 1.2 for hydrogen, inlet hydrogen flow rate to the fuel cell
calculated as:
VH2 = 1.2 x 0.257 slpm
VH2 = 0.3 slpm
Same calculations can be done for air:
rO2 = oxygen volume fraction at fuel cell inlet
So, oxygen volume fraction in air is 0.21
VAir =1
0.21 x23.65x60x35
4x96485
VAir = 0.5 slpm

112
Cathode Humidifier
Anode Humidifier
FUEL CELL
mH2O,in H2,in
mH2O,in Air,in
mH2O,in H2,out
mH2O,in Air,out
mAir,in
mAir,in
mH2,in mH2,out
mAir,out
Tca,in
With a stoichiometry of 2 for air, inlet air flow rate to the fuel cell calculated as:
VAir = 2x0.5 slpm
VAir = 1 slpm
Water Balance Calculations
Tan,in mH2,in

113
Assumptions:
1) The inlet gases are humidified to the assigned relative humidity in the
humidifiers.
2) Humidifiers are operated at dew point temperature.
3) Gases leaving the humidifiers are in thermal equilibrium with the liquid at
dew point temperature.
4) Gases are saturated with water vapor at humidifier temperature.
5) Gas inlet temperatures are equal to humidifier outlet temperatures. (Gas
lines are heated to eliminate any condensation of vapor).
6) Gases outlet temperatures are equal to fuel cell operating temperature.
7) Both anode and cathode inlet and outlet pressures are taken as 1 atm.
8) Pressure drop between humidifiers and fuel cell connections are
negligible.
9) Water transfer from anode to cathode by electro osmotic drag is
considered as each proton accompanied by 1 water molecule.
10) Net electro osmotic drag coefficient is assumed as 0.93.
Calculations are done by Faraday’s Law:
Water vapor in hydrogen inlet to the fuel cell in gmin-1
mH2O,in H2,in = SH2MH2O
2FφanPvsTan,in
Pan − φanPvsTan,inI ∗ ncell ∗ 60
ncell = 1 ( single cell PEM fuel cell). It will be taken as 1 for the following
calculations
Water vapor in air inlet to the fuel cell in gmin-1

114
mH2O,in Air,in =𝑆𝑂2𝑟𝑂2
MH2O
4FφcaPvsTca,in
Pca − φcaPvsTca,inI ∗ ncell ∗ 60
Water content in hydrogen exhaust in gmin-1
mH2O,in H2,out = mH2O,in H2,in − mH2O,ED + mH2O,BD
Electro osmotic drag was calculated as:
mH2O,ED = ξMH2O
F I ∗ ncell
Where ξ = 1 (each proton is accompanied by 1 water molecule) (Barbir, 2005)
Yan et al. (2006) obtained the net electro osmotic drag coefficient ranged from −
0.02 to 0.93, and was dependent on the operating conditions, the current load and
the level of humidification.
It is assumed that the net drag coeffcient is 0.93. Then
Net electro osmotic drag = Electro osmotic drag coefficient (EOD) – back
diffusion coefficient (BD)
NDC = ξ- β
0.93 = 1 − 𝛽 ⇒ 𝛽 = 0.07
mH2O,BD = βmH2O,ED = βξMH2O
F I ∗ ncell
Water vapor at anode exhaust calculated as:
115
mH2O,inH2,out V = min (SO2 − 1)MH2O
2FPvsTout,an
Pan − ∆Pan − PvsTout,anI
∗ ncell , mH2O,in H2,out
Liquid water at anode exhaust calculated as:
mH2O,inH2,out L = mH2O,inH2,out − mH2O,in H2,out V
Water content in the cathode exhaust in gmin-1
mH2O,in Air,out = mH2O,in Air,in + mH2O,qen + mH2O,ED − mH2O,BD
mH2O,in Air,out V = min SO2 − rO2,in
rO2,in
MH2O
4FPvsTout,ca
Pca − ∆Pca − PvsTout,caI ∗ ncell , mH2O,in Air,out
mH2O,in Air,out L = mH2O,in Air,out − mH2O,in Air,out V
Sample Calculation of Water Balance
For 60 oC fuel cell temperature 30 % RH of air with 100 % RH of H2, it is
determined from its polarization curve that at 0.4 V current density of 580
mA/cm2 was obtained.
The current is:
580 mAcm2 x
1A1000mA x25cm2 = 14.5A
Water vapor in Hydrogen inlet (gmin-1)
mH2O,in H2,in = 1.2 ∗ 18 g/mol
2∗96485 Cmol−1∗ 1∗19.94 kPa101.325kPa−(1∗19.94kPa)
∗ 14.5 𝐴*60
116
mH2O,in H2,in = 0.024 gmin−1
Water content in hydrogen exhaust in min-1 It is assumed that ξ = 1 Then NDC = ξ- β
0.93 = 1 − 𝛽 ⇒ 𝛽 = 0.07
mH2O,ED = 118 g/mol
46485 14.5A ∗ 60
mH2O,ED = 0.162 g/min
mH2O,BD = βmH2O,ED = βξMH2O
F I ∗ ncell
mH2O,BD = 0.07 (0.162) = 0.011 g/min
mH2O,in H2out = mH2O,in H2,in − mH2O,ED + mH2O,BD Then;
mH2O,in H2out = 0.024− 0.162 + 0.011
mH2O,in H2out = −0.127 g/min Depending on the flow rate, that is, stoichiometry and conditions at the outlet,
water at hydrogen exhaust may be present as vapor only, or liquid water may be
present after the gas is saturated with water vapor. The water vapor content at
anode outlet is the smaller of total water flux at anode outlet and the maximum
amount the exhaust gas can carry (saturation) (Barbir, 2005):

117
mH2O,inH2,out V = min (SH2 − 1)MH2O
2FPvsTout,an
Pan − ∆Pan − PvsTout,anI
∗ ncell , mH2O,in H2,out
mH2O,inH2,out V =
min (1.2 − 1)18 g
mol2(96485)
19.94 kPa101.325kPa − 0 − 19.94 kPa 14.5 A ,
−0.127g
min
mH2O,inH2,out V = min 0.004
gmin ,−0.127 g/min
The water vapor content at anode outlet is the smaller of total water flux at anode
outlet and the maximum amount the exhaust gas can carry;
mH2O,inH2,out V = −0.127 g/min
mH2O,inH2,out L = mH2O,inH2,out − mH2O,in H2,out V
mH2O,inH2,out L = −0.127g
min − (−0.127)g/min
mH2O,inH2,out L = 0 g/min Water vapor in air inlet (min-1)
mH2O,in Air,in =2
0.21∗
18g/mol4 ∗ 96485Cmol−1
∗0.3 ∗ 5.98 𝑘𝑃𝑎
101.325kPa − 0.3 ∗ 5.98kPa∗ 14.5 𝐴 ∗ 60
mH2O,in Air,in = 0.007 gmin−1 Water content in the cathode exhaust in gmin-1
118
mH2O,in Air,out = mH2O,in Air,in + mH2O,qen + mH2O,ED − mH2O,BD
Water generation at cathode side in gmin-1
mH2O,qen =I
2F MH2O ∗ 60
mH2O,qen =14.5 A
2(96485) 18gs ∗ 60
mH2O,qen = 0.081 gmin−1 Then
mH2O,in Air,out = 0.007g
min + 0.081g/ min + 0.162 g/ min−0.011 g/min
mH2O,in Air,out = 0.239 g/min
mH2O,in Air,out V =
min 2 − 0.21
0.2118g/mol4(96485)
19.94 kPa101.325 kPa − 0 − 19.94 kPa 14.5A , mH2O,in Air,out
mH2O,in Air,out V = min 0.085g
min , 0.239g/min
mH2O,in Air,out V = 0.085 g/min
mH2O,in Air,out L = mH2O,in Air,out − mH2O,in Air,out V
mH2O,in Air,out L = 0.239
gmin− 0.085g/min
mH2O,in Air,out L = 0.154 g/min
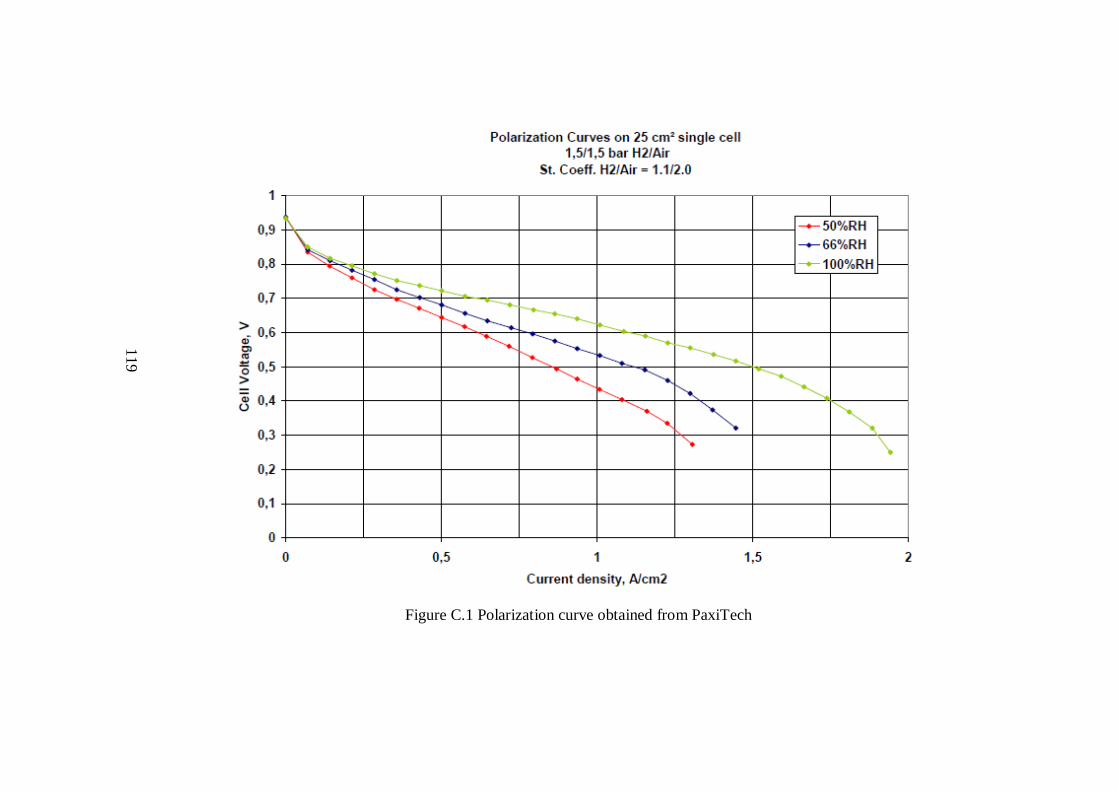
Figure C.1 Polarization curve obtained from PaxiTech
119