
Effect of refrigerant oil additive on ... - nvlpubs.nist.gov
III
EFFECT OF POLYVINYLPYRROLIDONE
ADDITIVE ON THE PERFORMANCE OF
HOLLOW FIBER ION EXCHANGER MIXED
MATRIX MEMBRANE FOR COPPER REMOVAL
KELVIN WONG JING ZHI
Thesis submitted in partial fulfilment of the requirements
for the award of the degree of
Bachelor of Chemical Engineering
Faculty of Chemical & Natural Resources Engineering
UNIVERSITI MALAYSIA PAHANG
JANUARY 2015
©KELVIN WONG JING ZHI (2015)
VIII
ABSTRACT
The existence of copper in the environment is a concern due to the acute and long term
toxicity. With the advantages of lower capital cost, easy operation process and high
copper removal percentage, ion exchange technology offers the best treatment for
copper removal but it has a drawback where it will cause a vast drop in pressure. In
order to overcome this limitation, an ion exchanger mixed matrix membrane was
produced in this study. Amberlite IR 120H cation exchanger was incorporated in the
polyethersulfone (PES) based polymer solution. The effect of polyvinylpyrrolidone
(PVP) pore forming additive in the PES dope solution was studied in the range of 0 to
10wt%. The hollow fiber membrane was synthesized using dry-wet spinning procedure.
The pore structure of the membrane was characterized using Scanning Electron
Microscope (SEM) and was found more porous as the concentration of PVP increases.
The permeability was also increased as the concentration of PVP increases. The
optimum concentration of PVP for the removal of copper is between 3wt% and 5wt%.
IX
ABSTRAK
Kewujudan kuprum dalam alam sekitar adalah kebimbangan disebabkan oleh
ketoksikan jangka akut dan panjang. Dengan kelebihan kos modal yang lebih rendah,
proses operasi yang mudah dan tembaga tinggi peratusan penyingkiran, teknologi
pertukaran ion menawarkan rawatan yang terbaik untuk penyingkiran kuprum tetapi ia
mempunyai kelemahan di mana ia akan menyebabkan penurunan besar dalam tekanan.
Dalam usaha untuk mengatasi had ini, ion membran penukar matriks bercampur
dihasilkan dalam kajian ini. Amberlite IR 120H kation penukar diperbadankan pada
polyethersulfone yang (PES) penyelesaian polimer berasaskan. Kesan
polyvinylpyrrolidone (PVP) liang membentuk bahan tambahan dalam larutan PES telah
dikaji dalam julat 0 hingga 10wt%. Membran gentian geronggang telah disintesis
menggunakan prosedur berputar kering-basah. Struktur liang membran dicirikan
menggunakan Mikroskop Imbasan Elektron (SEM) dan didapati lebih poros sebagai
kepekatan kenaikan PVP. Kebolehtelapan ini juga meningkat kepekatan kenaikan PVP.
Kepekatan optimum PVP untuk penyingkiran tembaga adalah antara 3wt% dan 5wt%.
X
TABLE OF CONTENTS
SUPERVISOR’S DECLARATION ..................................................................... IV STUDENT’S DECLARATION............................................................................. V Dedication ......................................................................................................... VI ACKNOWLEDGEMENT ................................................................................... VII ABSTRACT ..................................................................................................... VIII ABSTRAK ......................................................................................................... IX TABLE OF CONTENTS ..................................................................................... X LIST OF FIGURES ........................................................................................... XII LIST OF TABLES ............................................................................................ XIV LIST OF SYMBOLS ......................................................................................... XV LIST OF ABBREVIATIONS ............................................................................. XVI 1 INTRODUCTION ........................................................................................ 1
1.1 Motivation and statement of problem .................................................... 1 1.2 Objective ............................................................................................... 2 1.3 Scope of this research .......................................................................... 2 1.4 Main contribution of this work ................................................................ 2 1.5 Organisation of this thesis ..................................................................... 2
2 LITERATURE REVIEW ............................................................................... 4 2.1 Heavy Metals Pollution .......................................................................... 4
2.1.1 Copper ............................................................................................ 6 2.2 Heavy Metals Removal Techniques ...................................................... 7
2.2.1 Adsorption ...................................................................................... 7 2.2.2 Chemical Precipitation .................................................................... 8 2.2.3 Coagulation and flocculation ........................................................ 10 2.2.4 Membrane .................................................................................... 12 2.2.5 Ion Exchange ............................................................................... 16 2.2.6 Comparison of the Heavy Metals Removal Techniques ............... 16
2.3 Ion Exchanger Mixed Matrix Membrane .............................................. 19 2.4 Opportunities of Copper Removal Mixed Matrix Ion Exchange Membrane .................................................................................................... 20 2.5 Polyethersulfone ................................................................................. 20 2.6 Analysis Methods of Permeability and Adsorption of Membrane ........ 21 2.7 Summary ............................................................................................. 22
3 METHODOLOGY ...................................................................................... 23 3.1 Chemicals ........................................................................................... 23 3.2 Preparation of Dope Polymer Solution ................................................ 23 3.3 Hollow Fiber Dry-Wet Spinning Process ............................................. 25
3.4.3 Membrane Module Fabrication ........................................................ 27 3.4.4 Scanning Electron Microscope ......................................................... 31 3.4.5 Water Permeability ........................................................................... 31 3.4.6 Static Adsorption Capacity ............................................................... 32 3.4.7 Effect of pH ...................................................................................... 34 3.4.8 Dynamic Copper Removal Test ....................................................... 34 3.4.9 Elution Test ...................................................................................... 35
XI
4 RESULTS AND DISCUSSION .................................................................. 37 4.1 Synthesis of Hollow Fiber Membrane.................................................. 37 4.2 Scanning Electron Microscope (SEM)................................................. 39 4.3 Static Adsorption Test ......................................................................... 42 4.4 Effect of pH ......................................................................................... 43 4.5 Water Permeability .............................................................................. 47 4.6 Dynamic Copper Removal Test .......................................................... 48 4.7 Elution Test ......................................................................................... 50
5 Conclusions and Recommendation .......................................................... 51 5.1 Conclusion .......................................................................................... 51 5.2 Recommendations .............................................................................. 52
5.2.1 Study on the Static Adsorption ..................................................... 52 5.2.2 Study on the Effect of pH .............................................................. 52 5.2.3 Study on the Water Permeability ................................................. 53 5.2.4 Study on the Dynamic Copper Removal ...................................... 53 5.2.5 Study on the Elution Recovery .................................................... 53
REFRENCES ................................................................................................... 54 APPENDICES .................................................................................................. 60
XII
LIST OF FIGURES
Figure 2.1: Percentile Values of Cu (Copper) at all Sampling Stations (Department of
Irrigation and Drainage, 2009) .......................................................................................... 6
Figure 2.2: Percentile Values of Cu (Copper) at all Sampling Stations continued
(Department of Irrigation and Drainage, 2009) ................................................................ 6
Figure 2.3: The adsorption mechanism of Cu(II) on hydrous TiO2 (Barakat, 2005) ....... 8
Figure 2.4: Processes of a conventional metals precipitation treatment plant (Wang, et
al., 2005). ........................................................................................................................ 10
Figure 2.5: Mechanism of Flocculation(Chemistry.TutorVista.com, 2014) .................. 11
Figure 2.6: Mechanism of Coagulation (Chemistry.TutorVista.com, 2014) .................. 11
Figure 2.7: Coagulation and Flocculation Tank (Dynamic-des.com, 2014) .................. 12
Figure 2.8: Schematic diagram of a two-phase separation system separated by a
membrane.(Tin, 2005) .................................................................................................... 13
Figure 2.9: Pore Size of Membrane Processes (Radcliff & Zarnadze, 2004) ................. 14
Figure 2.10: Flat Sheet Membrane(EC Plaza, 2013) ..................................................... 15
Figure 2.11: Structure of a Hollow Fiber Membrane (Hyfluxmembranes.com, 2008) .. 15
Figure 2.12: Mechanism of Binding of Copper ion to the Functional (Neunmann, 2009)
........................................................................................................................................ 16
Figure 2.13: Schematic of Mixed Matrix Membrane (MMM)(Bastani, et al., 2013)..... 20
Figure 2.14: Molecular Structure Polyethersulfone (PES) ............................................. 21
Figure 2.15: Molecular Structure of Polyvinylpyrrolidone (PVP) ................................. 21
Figure 3.1: Retsch Rottor Mill ZM200 ........................................................................... 23
Figure 3.2: Dope Solution Preparation ........................................................................... 24
Figure 3.3: Dry-wet Spinning Process ............................................................................ 25
Figure 3.4: Hollow fiber membrane produced at the take up drum ................................ 26
Figure 3.5: Storage bath of the hollow fiber membrane ................................................. 26
Figure 3.6: Shell-side Hollow Fiber Module .................................................................. 27
Figure 3.7: Structure of lab-scale modular module (Li, et al., 2004) ............................. 28
Figure 3.8: Bundle preparation and module assembly(Li, et al., 2004) ......................... 29
Figure 3.9: Curing of the Epoxy Resin ........................................................................... 29
Figure 3.10: Schematic Diagram of Membrane Module Setup ..................................... 30
Figure 3.11: The Membrane Module Setup .................................................................... 30
Figure 3.12: Scanning Electron Microscope (SEM) at 400x Magnification .................. 31
Figure 3.13: Perkin AAnalyst 400 Flame Atomic Absorption Spectrometer ................. 33
Figure 4.1: Surface of the Membrane for 10wt% PVP dope solution ............................ 37
Figure 4.2: Surface of the Membrane for 0wt% PVP dope solution .............................. 38
XIII
Figure 4.3: Cross Section of 0wt% and 3wt% PVP Membrane ..................................... 39
Figure 4.4: Cross Section of 5wt% and 8wt% PVP Membrane ..................................... 39
Figure 4.5: Cross Section of 10wt% PVP Membrane .................................................... 39
Figure 4.6: Cross Section of 0wt% and 3wt% Membrane at 400x Magnification ......... 40
Figure 4.7: Cross Section of 5wt% and 8wt% Membrane at 400x Magnification ......... 40
Figure 4.8: Cross Section of 10wt% Membrane at 400x Magnification ........................ 40
Figure 4.9: Cross Section of 0wt% and 3wt% Membrane at 1000x Magnification ....... 41
Figure 4.10: Cross Section of 5wt% and 8wt% Membrane at 1000x Magnification ..... 41
Figure 4.11: Cross Section of 10wt%Membrane at 1000x Magnification ..................... 41
Figure 4.12: Binding of Copper at Different Concentration of Co-polymer .................. 42
Figure 4.13: Precipitation formed in pH12 and pH13 (Alkaline solution) ..................... 44
Figure 4.14: Effect of pH on the Binding of Copper ...................................................... 45
Figure 4.15: Binding of Copper at Low pH .................................................................... 47
Figure 4.16: Pure Water Permeability at Different PVP Concentration ......................... 48
XIV
LIST OF TABLES
Table 2.1: Parameter Limits of Effluent of Standards A and B (Department of
Enviroment, 2000) ............................................................................................................ 5
Table 2.2: Membrane separation process classified driving force .................................. 13
Table 2.3: Comparison of the Heavy Metals Removal Techniques ............................... 17
Table 3.1: Dope solution composition of hollow fiber membrane ................................. 24
Table 4.1: Results of the Static Adsorption of Different PVP Concentration Membrane
........................................................................................................................................ 42
Table 4.2: Statistical Data for Different PVP Concentration .......................................... 43
Table 4.3: pH Testing for Optimum pH condition for the Adsorption of the Membrane
........................................................................................................................................ 44
Table 4.4: Concentration of Copper after Incubation ..................................................... 45
Table 4.5: Study of the Optimum Acidic pH condition .................................................. 46
Table 4.6: Statistical Data of Different pH Static Adsoption ......................................... 46
Table 4.7: Pure water permeability of Different PVP Concentration Membrane .......... 48
Table 4.8: Dynamic Copper Removal Test Run 1 .......................................................... 49
Table 4.9: Dynamic Copper Removal Test Run 2 .......................................................... 49
Table 4.10: Average copper bound and rejection efficiency .......................................... 49
Table 4.11: Statistical Data for Cross Flow .................................................................... 49
Table 4.12: Elution for the Run 1 Membrane ................................................................. 50
Table 4.13: Elution for the Run 2 Membrane ................................................................. 50
XV
LIST OF SYMBOLS
Greek
vl kinematic viscosity
Subscripts
g gas
l liquid
eff effective
XVI
LIST OF ABBREVIATIONS
AAS Atomic Absorption Spectrometry
BOD Biological Oxygen Demand
COD Chemical Oxygen Demand
CuSO4.5H2O Copper Sulphate Pentahydrate
NMP N-Methyl-2-pyrrolidone
PAM Polyacrylmide
PAN Polyacrylite
PEG Polyethylene glycol
PES Polyethersulfone
PVDF Polyvinyllidene fluoride
PVP Polyvinylpyrrolidone
SEM Spectrometry Electron Microscope
1
1 INTRODUCTION
1.1 Motivation and statement of problem
Abundant of heavy metals waste water has been generated worldwide due to the
industry activities such as mining, metals plating, electric device manufacturing, surface
treatment and raw material for synthesis. Heavy metals such as copper, lead, mercury
and chromium are toxic to human as it compromises acute and long term effect to our
health(Farooq, et al., 2010).
Copper is vastly used as the major material of electronic industries. It is one of the most
common metals be used in industries for the construction of structures as it has a
relative high tensile strength (Kuhn & Medlin, 2000)
As a result of application of copper in electronic industries, it generates an
environmental problem as the heavy metals are toxic, environment persistent and have
the tendency to accumulate in the body tissues (Al-Rashidi, et al., 2013).
Membrane technology in the separation processes have became one of the emerging
technologies which experienced a rapid growth of during the past decades. The
membrane technology has been widely used in the gas separation where heat is not
required or the mixture is an azeotrope (Hillmen, 2000). In the removal of heavy
metals, membrane is not widely used as the dead end filtration is prone to fouling and
concentration polarization (Zhang & Vecitis, 2014).
Several processes have been practiced for the removal of heavy metals. These methods
include chemical precipitation, ion-exchange, membrane filtration, carbon adsorption,
co-precipitation/adsorption and electrochemical removal (Babel & Kurniawan, 2003).
Ion exchange processes mostly uses selective chelating resins contain anion functional
group that have affinity towards the heavy metals ions. Besides that, the ion exchange
resins causes a vast drop in pressure as the treated water passes through the ion
exchange bed filled with resins (Stremovskii & Klyueva, 1974).
To date, the removal of heavy metals from wastewater using membrane are mostly flat
sheet profile (Sato, et al., 2002). Microfiltration and nanofiltration are unique due to the
2
separation mechanism which is working based on size exclusion, charge repulsion and
have a higher rejection of multivalent heavy metals ions as compared to UF membranes.
(Gherasim, et al., 2013). Recently hollow fiber has become a progress due to the high
total surface area as compare to flat sheet (Peng, et al., 2012).
1.2 Objective
The objective of this research is to study the effects of polyvinylpyrrolidone additive
concentration on the performance of hollow fiber ion exchanger mixed matrix
membrane for copper removal.
1.3 Scope of this research
The following are the scope of this research:
i) To produce ion exchange hollow fiber MMM by incorporating cation resin,
Amberlite IR120H into a polymer solution consist of PES, NMP and PVP.
ii) To study the effect of PVP additive concentration in the PES-Amberlite
IR120H dope polymer solution from 0-10wt% on the performance of
adsorptive MMM for copper removal.
iii) To characterize the MMM in term of pore structure, water permeability and
static adsorption properties for copper removal.
iv) To study the effect of pH on the adsorption capacity of the membrane.
1.4 Main contribution of this work
The following are the contributions:
1) To provide an economic alternative for the removal of copper from the
wastewater.
2) To provide a more efficient alternative for the removal of copper.
3) To enhance the quality of water in order to reduce the pollution of the river
caused by the electronic industries in Malaysia.
1.5 Organisation of this thesis
This thesis was distributed into five chapters. Following the introduction in Chapter 1,
3
Chapter 2 provides a description of the applications and general design features of ion
exchanger mixed matrix membrane (MMM). A general description on the hollow fiber
membrane, as well as the ion exchange and adsorptive membrane. This chapter also
provides a brief discussion of the advanced experimental techniques available for
copper removal, mentioning their applications and limitations for permeability and
adsorption analysis. A summary of the previous experimental work on copper removal
is also presented. A brief discussion on the characterisation methods for Ion Exchanger
Mixed Matrix Membrane is also provided.
Chapter 3 is essential as it provides the information on the materials and methods of
synthesizing and characterising the Ion Exchanger Mixed Matrix Membrane for Copper
Removal. The performance of the Ion Exchanger Mixed Matrix Membrane (MMM) for
Copper Removal with different concentration of Polyvinlypyrrolidone (PVP) additive
range from 0-10wt% will be explained. The performance of the Ion Exchanger MMM
was studied based on the permeability, adsorption and structure. The experimental data
were compared to determine the optimum concentration of the PVP. Both static and
dynamic adsorptions of the copper by the ion exchanger were studied.
Chapter 4 focused on the major findings of this research with relevant discussion. The
first section will be discussing about the characterized membrane developed in this
research using SEM and permeability. The effect of pH on the membrane was also
discussed. The performance of the membrane is discussed based on the static and
dynamic adsorption capacity and elution recovery. The analysis was done based on the
data obtained.
Chapter 5 is focused on the conclusion and recommendation of the dissertation based on
the results and discussion.
4
2 LITERATURE REVIEW
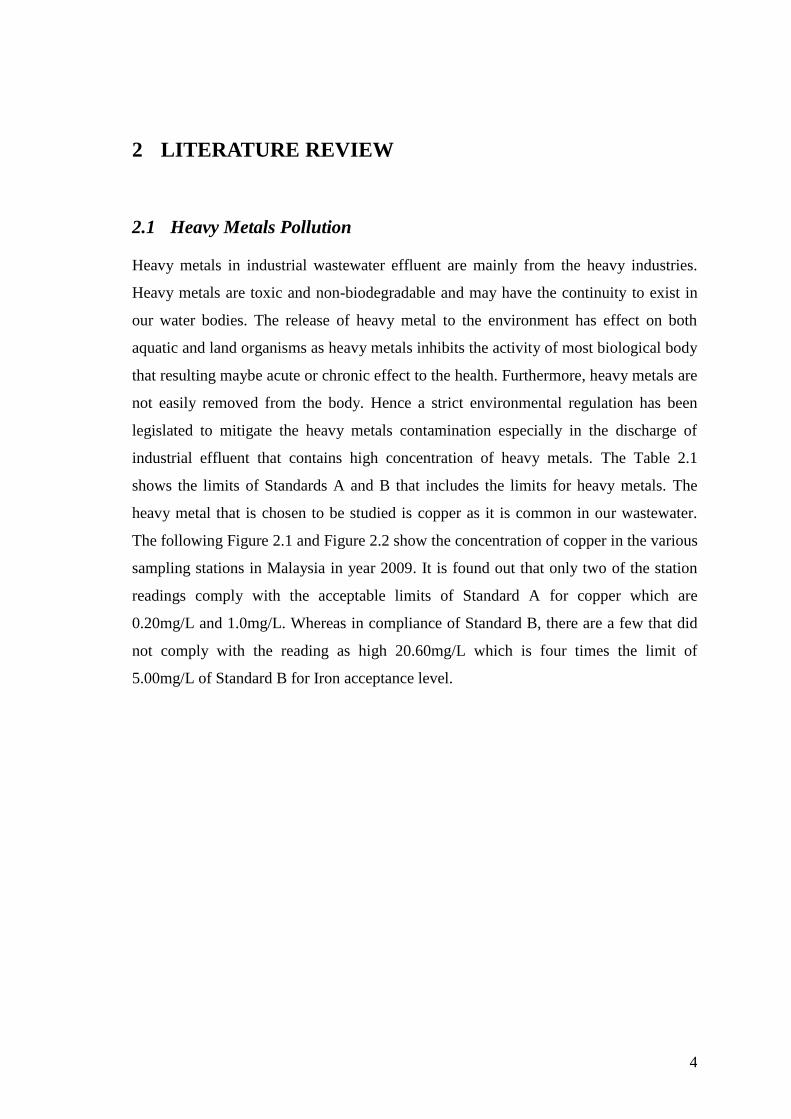
2.1 Heavy Metals Pollution
Heavy metals in industrial wastewater effluent are mainly from the heavy industries.
Heavy metals are toxic and non-biodegradable and may have the continuity to exist in
our water bodies. The release of heavy metal to the environment has effect on both
aquatic and land organisms as heavy metals inhibits the activity of most biological body
that resulting maybe acute or chronic effect to the health. Furthermore, heavy metals are
not easily removed from the body. Hence a strict environmental regulation has been
legislated to mitigate the heavy metals contamination especially in the discharge of
industrial effluent that contains high concentration of heavy metals. The Table 2.1
shows the limits of Standards A and B that includes the limits for heavy metals. The
heavy metal that is chosen to be studied is copper as it is common in our wastewater.
The following Figure 2.1 and Figure 2.2 show the concentration of copper in the various
sampling stations in Malaysia in year 2009. It is found out that only two of the station
readings comply with the acceptable limits of Standard A for copper which are
0.20mg/L and 1.0mg/L. Whereas in compliance of Standard B, there are a few that did
not comply with the reading as high 20.60mg/L which is four times the limit of
5.00mg/L of Standard B for Iron acceptance level.
5
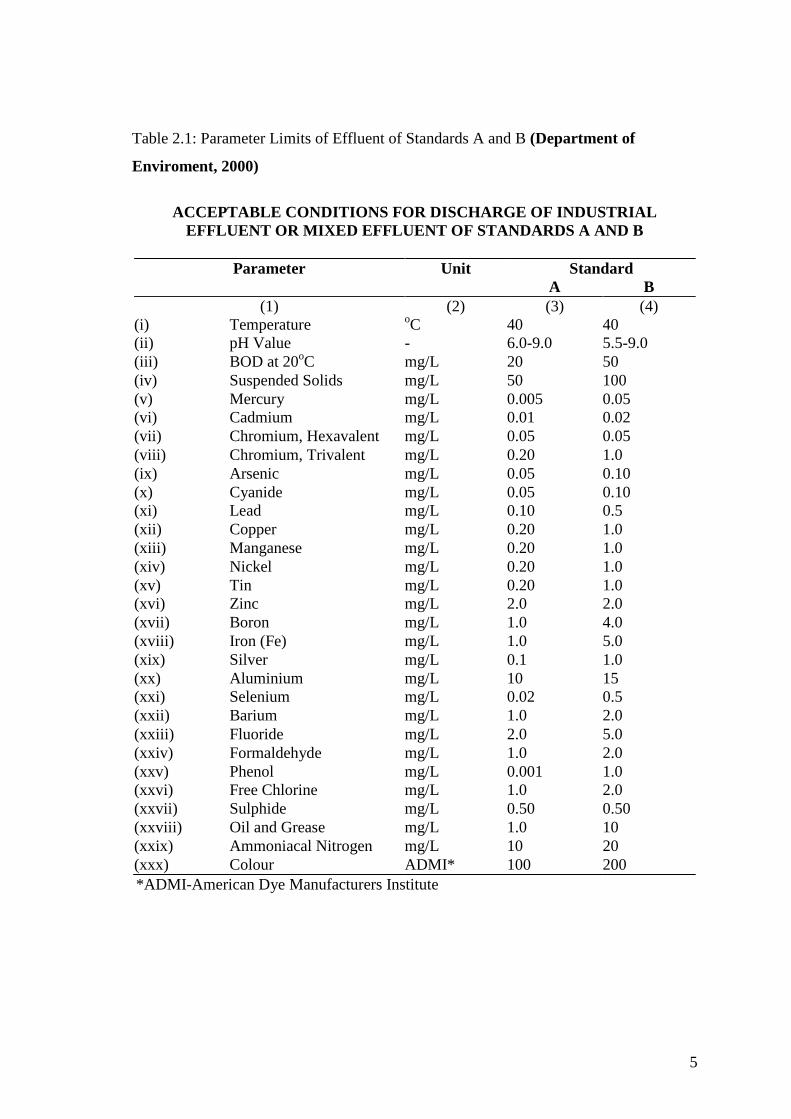
Table 2.1: Parameter Limits of Effluent of Standards A and B (Department of
Enviroment, 2000)
ACCEPTABLE CONDITIONS FOR DISCHARGE OF INDUSTRIAL
EFFLUENT OR MIXED EFFLUENT OF STANDARDS A AND B
Parameter Unit Standard A B
(1) (2) (3) (4)
(i) Temperature oC 40 40
(ii) pH Value - 6.0-9.0 5.5-9.0
(iii) BOD at 20oC mg/L 20 50
(iv) Suspended Solids mg/L 50 100
(v) Mercury mg/L 0.005 0.05
(vi) Cadmium mg/L 0.01 0.02
(vii) Chromium, Hexavalent mg/L 0.05 0.05
(viii) Chromium, Trivalent mg/L 0.20 1.0
(ix) Arsenic mg/L 0.05 0.10
(x) Cyanide mg/L 0.05 0.10
(xi) Lead mg/L 0.10 0.5
(xii) Copper mg/L 0.20 1.0
(xiii) Manganese mg/L 0.20 1.0
(xiv) Nickel mg/L 0.20 1.0
(xv) Tin mg/L 0.20 1.0
(xvi) Zinc mg/L 2.0 2.0
(xvii) Boron mg/L 1.0 4.0
(xviii) Iron (Fe) mg/L 1.0 5.0
(xix) Silver mg/L 0.1 1.0
(xx) Aluminium mg/L 10 15
(xxi) Selenium mg/L 0.02 0.5
(xxii) Barium mg/L 1.0 2.0
(xxiii) Fluoride mg/L 2.0 5.0
(xxiv) Formaldehyde mg/L 1.0 2.0
(xxv) Phenol mg/L 0.001 1.0
(xxvi) Free Chlorine mg/L 1.0 2.0
(xxvii) Sulphide mg/L 0.50 0.50
(xxviii) Oil and Grease mg/L 1.0 10
(xxix) Ammoniacal Nitrogen mg/L 10 20
(xxx) Colour ADMI* 100 200
*ADMI-American Dye Manufacturers Institute

6
Figure 2.1: Percentile Values of Cu (Copper) at all Sampling Stations (Department of
Irrigation and Drainage, 2009)
Figure 2.2: Percentile Values of Cu (Copper) at all Sampling Stations continued
(Department of Irrigation and Drainage, 2009)
2.1.1 Copper
Copper is a ductile metal with a very high electrical and thermal conductivity. It is used
as a conductor of electricity and heat, parts of several metal alloys and construction
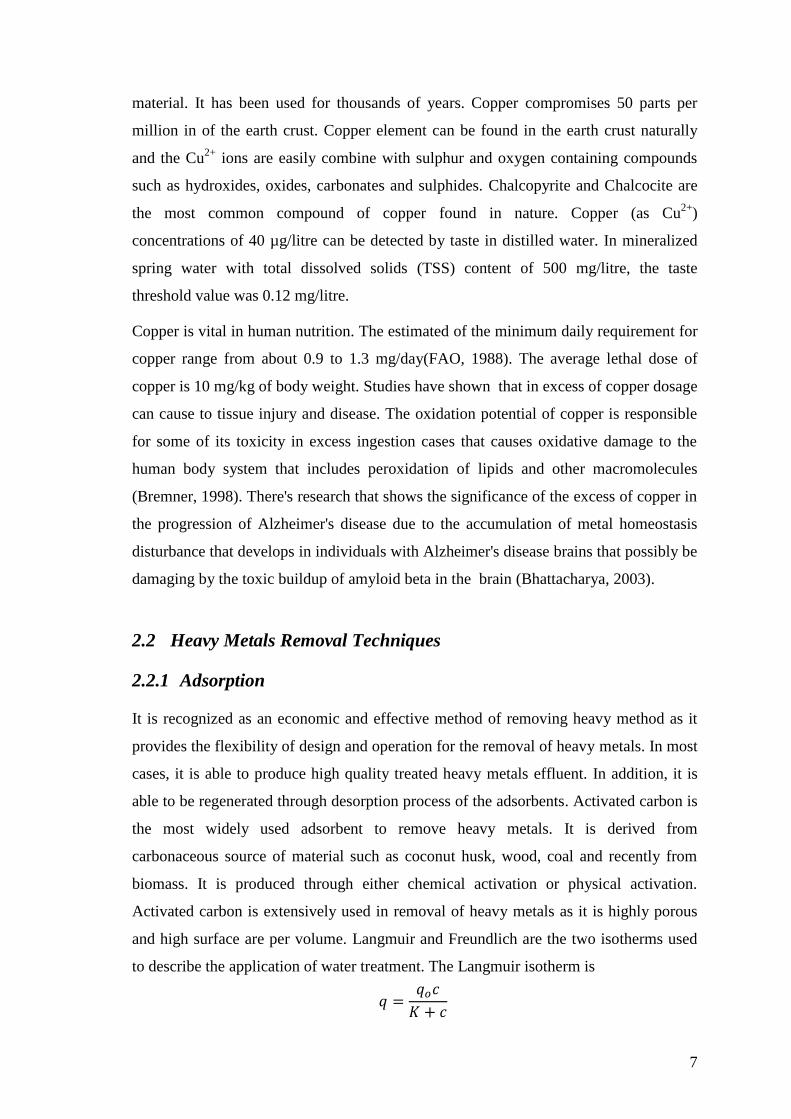
7
material. It has been used for thousands of years. Copper compromises 50 parts per
million in of the earth crust. Copper element can be found in the earth crust naturally
and the Cu2+
ions are easily combine with sulphur and oxygen containing compounds
such as hydroxides, oxides, carbonates and sulphides. Chalcopyrite and Chalcocite are
the most common compound of copper found in nature. Copper (as Cu2+
)
concentrations of 40 µg/litre can be detected by taste in distilled water. In mineralized
spring water with total dissolved solids (TSS) content of 500 mg/litre, the taste
threshold value was 0.12 mg/litre.
Copper is vital in human nutrition. The estimated of the minimum daily requirement for
copper range from about 0.9 to 1.3 mg/day(FAO, 1988). The average lethal dose of
copper is 10 mg/kg of body weight. Studies have shown that in excess of copper dosage
can cause to tissue injury and disease. The oxidation potential of copper is responsible
for some of its toxicity in excess ingestion cases that causes oxidative damage to the
human body system that includes peroxidation of lipids and other macromolecules
(Bremner, 1998). There's research that shows the significance of the excess of copper in
the progression of Alzheimer's disease due to the accumulation of metal homeostasis
disturbance that develops in individuals with Alzheimer's disease brains that possibly be
damaging by the toxic buildup of amyloid beta in the brain (Bhattacharya, 2003).
2.2 Heavy Metals Removal Techniques
2.2.1 Adsorption
It is recognized as an economic and effective method of removing heavy method as it
provides the flexibility of design and operation for the removal of heavy metals. In most
cases, it is able to produce high quality treated heavy metals effluent. In addition, it is
able to be regenerated through desorption process of the adsorbents. Activated carbon is
the most widely used adsorbent to remove heavy metals. It is derived from
carbonaceous source of material such as coconut husk, wood, coal and recently from
biomass. It is produced through either chemical activation or physical activation.
Activated carbon is extensively used in removal of heavy metals as it is highly porous
and high surface are per volume. Langmuir and Freundlich are the two isotherms used
to describe the application of water treatment. The Langmuir isotherm is
8
(2.1)
In Langmuir isotherm, only a fixed number of active sites available for adsorption. It is
also a reversible and reaches equilibrium.
The Freundlich isotherm is
(2.2)
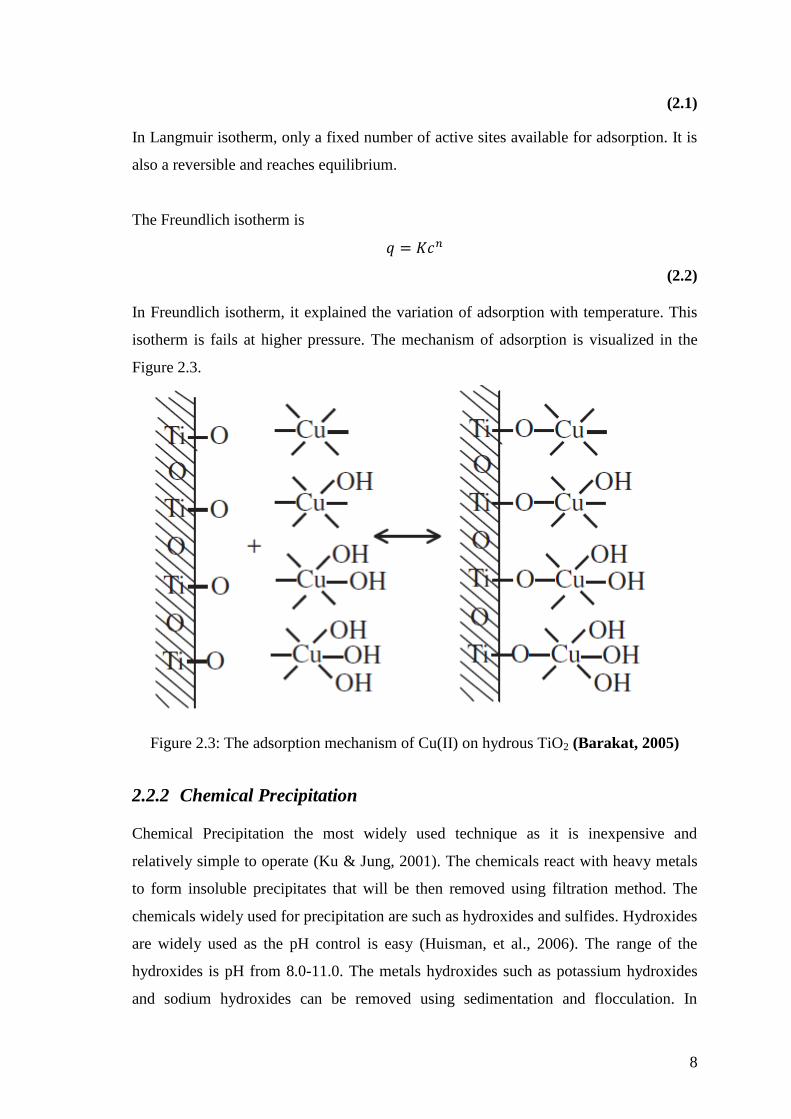
In Freundlich isotherm, it explained the variation of adsorption with temperature. This
isotherm is fails at higher pressure. The mechanism of adsorption is visualized in the
Figure 2.3.
Figure 2.3: The adsorption mechanism of Cu(II) on hydrous TiO2 (Barakat, 2005)
2.2.2 Chemical Precipitation
Chemical Precipitation the most widely used technique as it is inexpensive and
relatively simple to operate (Ku & Jung, 2001). The chemicals react with heavy metals
to form insoluble precipitates that will be then removed using filtration method. The
chemicals widely used for precipitation are such as hydroxides and sulfides. Hydroxides
are widely used as the pH control is easy (Huisman, et al., 2006). The range of the
hydroxides is pH from 8.0-11.0. The metals hydroxides such as potassium hydroxides
and sodium hydroxides can be removed using sedimentation and flocculation. In
9
addition, aluminum oxide and iron salts are being used to boost the removal of the
heavy metals. The drawback of hydroxide precipitation is that it produces a large
amount of sludge that poses disposal problems (Kongsricharoern & Polprasert, 1995).
Aside from metals hydroxides, sulfide precipitation is also an effective method to
remove heavy metals. It is more preferred to be used due to the solubility of most
sulfide compounds are less soluble as compare to hydroxides that provides a more
effective removal of heavy metals. However, sulfide precipitation process is causing
problems due to the hydrogen sulfide toxic fumes with the reaction of acidic conditions.
Thus the process should be done in neutral or alkaline condition. Lastly, the sulfide
precipitation is prone to form colloidal precipitates that causes problem in filtration and
settling process.
Recently, chelating precipitants are used to precipitate heavy metals from the solution.
The three widely used chelating precipitants for heavy metals removal are
trimercaptotriazin, sodium dimethyl dithiocarbonate and potassium/sodium
dimethyldithiocarbonate. Chelating precipitation is a particular method that ions and
molecules bind metals ions to form precipitants and removed through filtration(Wang,
et al., 2012). Chelating precipitation shows a remarkable result of reducing the
concentration of heavy metals with an immediate reduction of the heavy metals but if
the precipitate is not removed immediately, it will decompose and form by products
such as tetramethylthiuram and thiram which are toxic to aquatic organisms (Atwood &
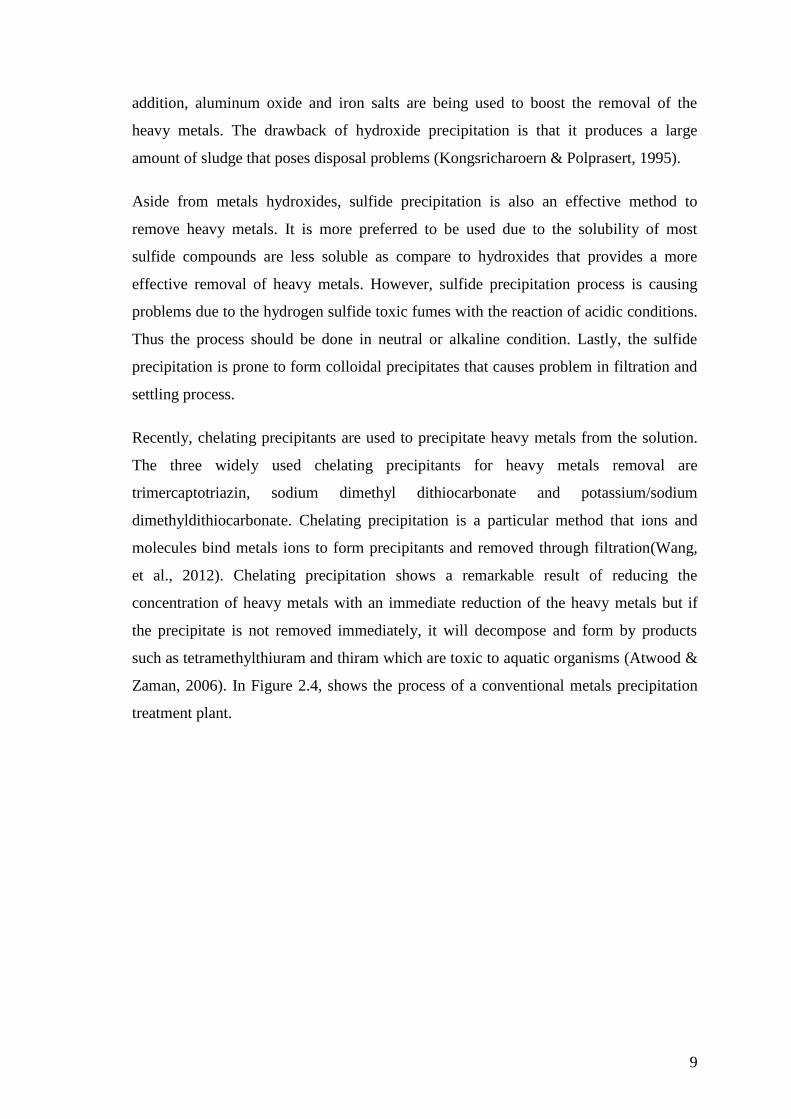
Zaman, 2006). In Figure 2.4, shows the process of a conventional metals precipitation
treatment plant.
10
Figure 2.4: Processes of a conventional metals precipitation treatment plant (Wang, et
al., 2005).
2.2.3 Coagulation and flocculation
The processes before sedimentation are coagulation and flocculation. Coagulation is the
process of destabilising the colloids by neutralising the forces that keep the colloids
apart. Aluminium oxide and ferric chloride are the most widely used coagulant in the
conventional wastewater treatment processes. Flocculation is the formation of bridges
between the flocs and binds to form larger agglomerates. Suspended particles are
flocculated into larger particles can be removed by filtration or floatation. Polyferric
sulphate (PFS) and polyacrylamide (PAM) are the widely used flocculants. However,
most of these flocculants and coagulants are not able to remove heavy metals (Chang &
Wang, 2007). These processes require the support of other treatment to fully remove
heavy metals. In order to overcome the limitation of coagulation, electrocoagulation
technique had been introduced. Electrocoagulation involves the formation of coagulants
in situ by dissolving electrically iron or aluminium ions from iron or aluminium
11
electrodes (Chen, 2004). The metals ions are formed at the anodes and hydrogen gas is
released from the cathodes. The hydrogen gas that is released assists the floatation of
the flocculated particles out of the water. The removal efficiency of heavy metals is able
to achieve 99% (Mulligan, 2009). However the electrocoagulation technique requires a
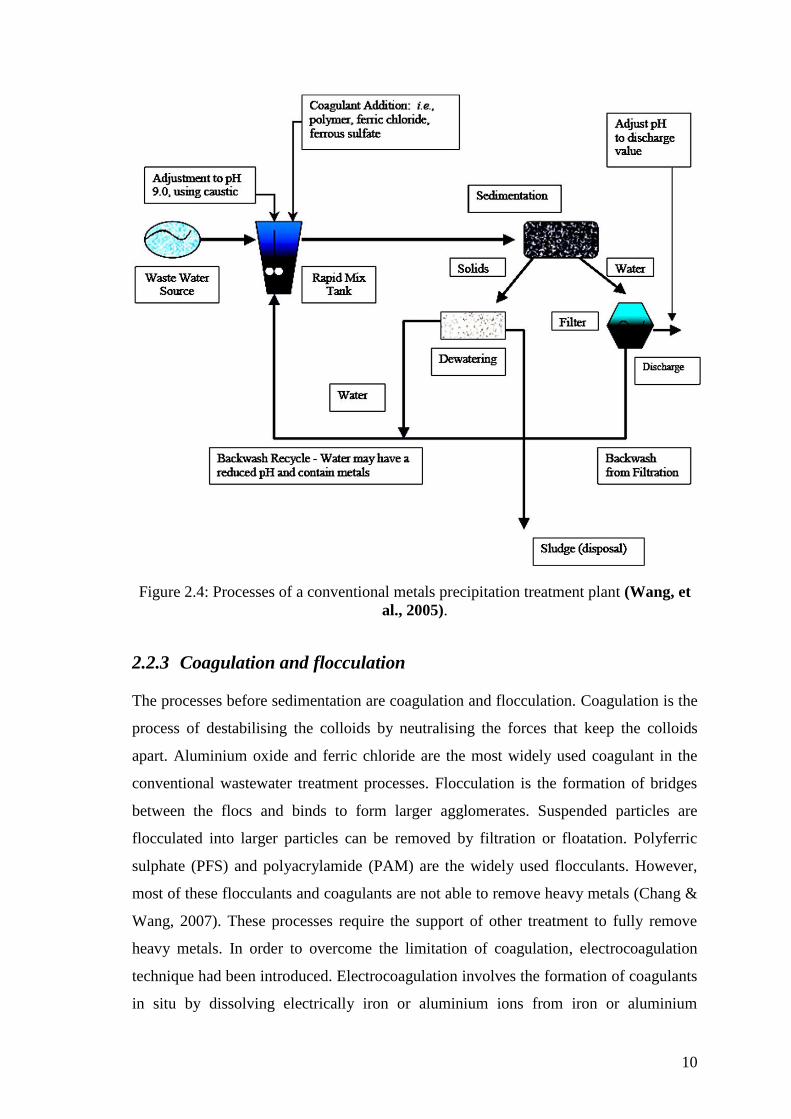
huge amount of energy to remove heavy metals (Kim, et al., 2014).
Figure 2.5: Mechanism of Flocculation(Chemistry.TutorVista.com, 2014)
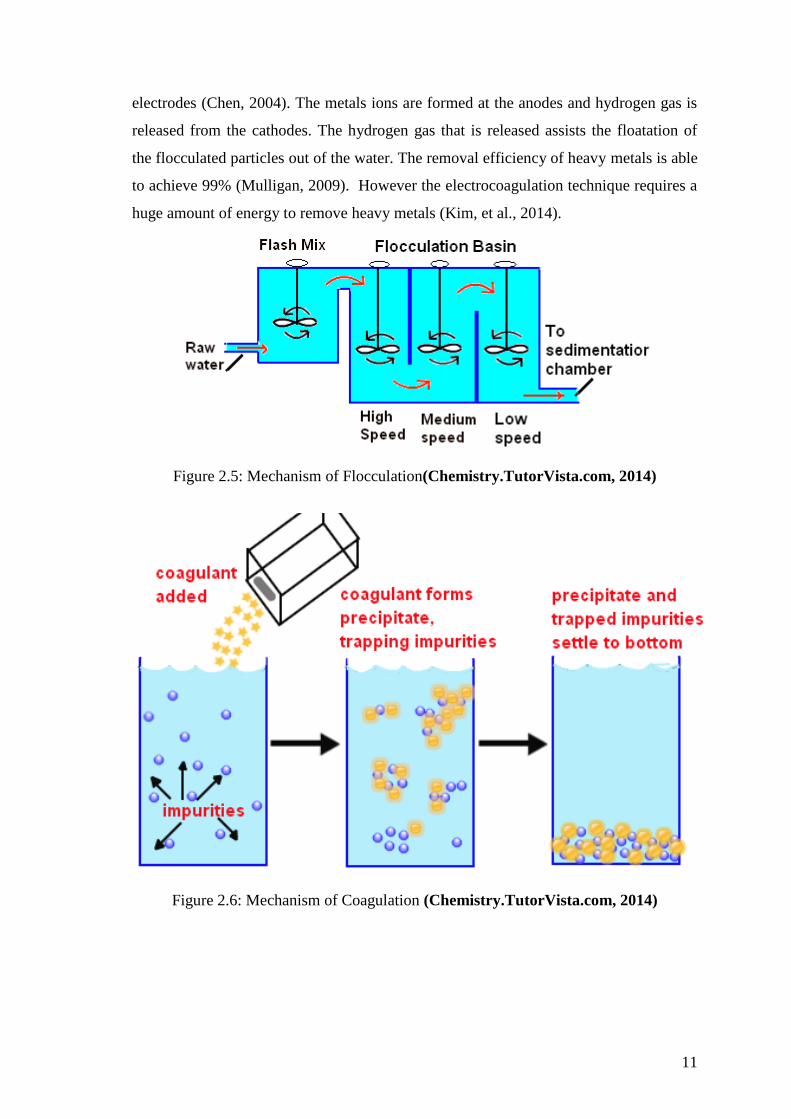
Figure 2.6: Mechanism of Coagulation (Chemistry.TutorVista.com, 2014)

12
Figure 2.7: Coagulation and Flocculation Tank (Dynamic-des.com, 2014)
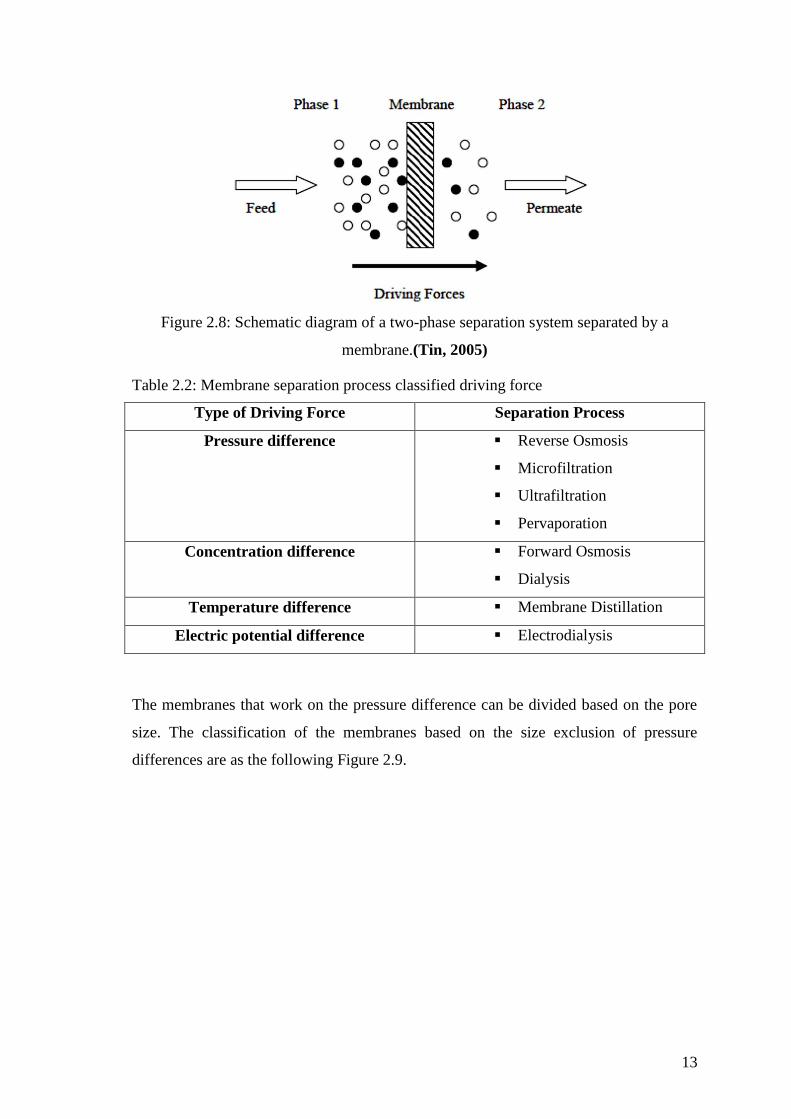
2.2.4 Membrane
Membrane is a thin barrier that allows certain constituents and retains other constituents
found in the liquid based on the ionic charge and size of the constituents (Cheryan,
1998). The membrane is separated by one bulk phase with higher concentration of
certain constituents and another lower concentration of it as shown in Figure 2.8
(Geankoplis, 2003). In terms of pressure or concentration gradient, the driving force
initiates from the chemical potential gradient. Industrial membranes separation
processes can be categorized into several groups based on the driving force that initiates
the flow of the permeate through the membrane (Matsuura, 1994). In Table 2.2 the
types of membrane separation process classified based on the driving force. In general
membrane is prone to fouling and concentration polarization (Moreno-Villoslada, et al.,
2005).
13
Figure 2.8: Schematic diagram of a two-phase separation system separated by a
membrane.(Tin, 2005)
Table 2.2: Membrane separation process classified driving force
Type of Driving Force Separation Process
Pressure difference Reverse Osmosis
Microfiltration
Ultrafiltration
Pervaporation
Concentration difference Forward Osmosis
Dialysis
Temperature difference Membrane Distillation
Electric potential difference Electrodialysis
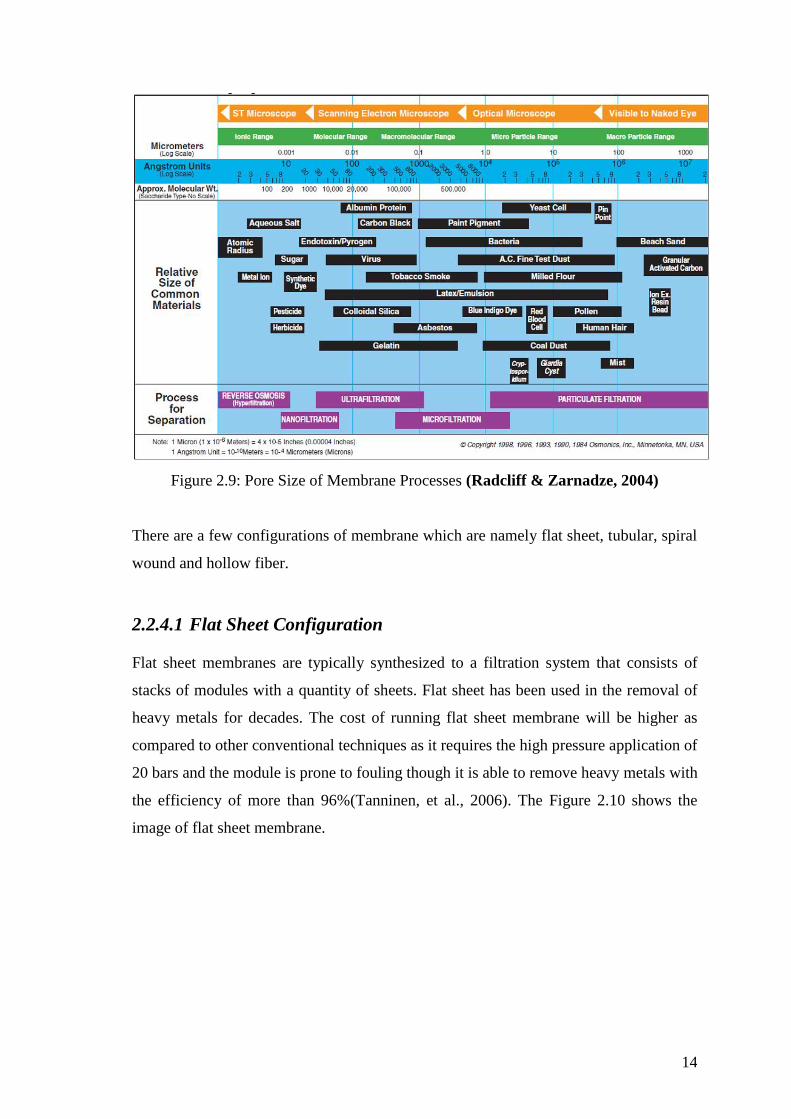
The membranes that work on the pressure difference can be divided based on the pore
size. The classification of the membranes based on the size exclusion of pressure
differences are as the following Figure 2.9.
14
Figure 2.9: Pore Size of Membrane Processes (Radcliff & Zarnadze, 2004)
There are a few configurations of membrane which are namely flat sheet, tubular, spiral
wound and hollow fiber.
2.2.4.1 Flat Sheet Configuration
Flat sheet membranes are typically synthesized to a filtration system that consists of
stacks of modules with a quantity of sheets. Flat sheet has been used in the removal of
heavy metals for decades. The cost of running flat sheet membrane will be higher as
compared to other conventional techniques as it requires the high pressure application of
20 bars and the module is prone to fouling though it is able to remove heavy metals with
the efficiency of more than 96%(Tanninen, et al., 2006). The Figure 2.10 shows the
image of flat sheet membrane.


