
EFFECT OF PASSIVE AND ACTIVE HEATING ON THE …
60
EFFECT OF PASSIVE AND ACTIVE HEATING ON THE PERFORMANCE OF DENITRIFYING BIOREACTORS BY TIMOTHY J RENDALL THESIS Submitted in partial fulfillment of the requirements for the degree of Master of Science in Technical Systems Management in the Graduate College of the University of Illinois in Urbana-Champaign, 2015 Urbana, Illinois Adviser: Professor Richard Cooke
Transcript of EFFECT OF PASSIVE AND ACTIVE HEATING ON THE …

EFFECT OF PASSIVE AND ACTIVE HEATING ON THE PERFORMANCE OF
DENITRIFYING BIOREACTORS
BY
TIMOTHY J RENDALL
THESIS
Submitted in partial fulfillment of the requirements
for the degree of Master of Science in Technical Systems Management
in the Graduate College of the
University of Illinois in Urbana-Champaign, 2015
Urbana, Illinois
Adviser:
Professor Richard Cooke

ii
ABSTRACT
In the Midwestern United States, the intensification of agriculture has led to increased
yields, higher profits, and greater food availability. However, this productivity increase has not
been without consequence. The Midwest’s agricultural industry has been linked to the region’s
degrading water quality and the hypoxic zone in the Gulf of Mexico. Nutrient runoff via
subsurface drainage flow enter surrounding water bodies and drain to the Gulf of Mexico causing
lasting ecological damage. This influx of nutrients into these water bodies is challenging the
scientific community to create innovative solutions to mitigate these problems. The use of
denitrifying bioreactors is a management practice developed to reduce nitrate pollution from
agricultural fields with subsurface drainage. Denitrifying bioreactors are woodchip filled
trenches that provide the necessary energy source to allow for microbial communities to convert
harmful nitrate (NO3-) into atmospheric nitrogen (N2). Bioreactors are a proven nitrate reduction
technology and continued research is being conducted to develop more efficient systems.
This study aimed to develop a paired bioreactor system for a study evaluating the effects
of a bioreactor heating system. The treatment bioreactor was equipped with both solar powered
underground electric heaters and a solar greenhouse in an attempt to raise internal temperature.
The treatment and control bioreactors were compared based on temperature, nitrate, pH, and
dissolved oxygen content.
Temperature was analyzed for both submerged and unsubmerged portions of the
bioreactors. The submerged section of the bioreactor had an average increase of 0.80 °C and the
unsubmerged section had an average increase of 7.53 °C. The submerged temperature is of most
interest because denitrification occurs in the submerged portion of the bioreactor. The
iii
submerged temperature increased longitudinally within the bioreactor as flow moved
horizontally from inlet to outlet. Overall, there was an increase in temperature in the treatment
bioreactor.
The effect of bioreactor temperature on water quality was analyzed in this study. Nitrate
data were inconclusive due to sampling errors resulting from nitrate stratification in the inlet
structure. The pH levels in this investigation ranged from 6.51-6.98. The pH of the treatment
bioreactor was statistically significantly lower than the pH of the control bioreactor, suggesting
that an increase in bioreactor temperature lowers effluent pH. The dissolved oxygen content
results confirmed that both the treatment and control bioreactors performed as expected.
Dissolved oxygen content was statistically significantly lower in the treatment bioreactor
compared to the control bioreactor, indicating more biological activity in the treatment
bioreactor.
The study proved it is possible to increase internal bioreactor temperature. This study did not
determine an effect on nitrate reduction due to change in temperature in the paired system,
however it is still hypothesized the increase in temperature will affect nitrate reduction. Future
paired heated bioreactor research is needed to quantify the effect of temperature on nitrate
reduction.

iv
TABLE OF CONTENTS
CHAPTER 1. INTRODUCTION .................................................................................................. 1
CHAPTER 2. OBJECTIVES ........................................................................................................ 4
CHAPTER 3. REVIEW OF LITERATURE ................................................................................ 5
3.1 Nitrogen and Agricultural Practices ................................................................................. 5
3.2 Agricultural Drainage and Water Quality ........................................................................ 8
3.3 Mitigating Water Quality Degradation and Other Best Management Practices
(BMP’s) .................................................................................................................................... 12
3.4 Denitrification and Temperature ..................................................................................... 15
CHAPTER 4. METHODOLOGY ................................................................................................ 17
4.1 Site Description .................................................................................................................. 17
4.2 Treatment Bioreactor........................................................................................................ 18
4.3 Data Collection .................................................................................................................. 22
4.4 Water Sampling ................................................................................................................. 25
CHAPTER 5. RESULTS ............................................................................................................. 27
5.1 Temperature ...................................................................................................................... 27
5.2 Water Quality .................................................................................................................... 34
CHAPTER 6. DISCUSSION ....................................................................................................... 43
6.1 Temperature Results ......................................................................................................... 43
6.2 Nitrate Results ................................................................................................................... 44
6.3 Heating Costs ..................................................................................................................... 46
6.4 Design Flaws/Considerations ........................................................................................... 47
6.5 Future of Heated Bioreactor Research ............................................................................ 49
CHAPTER 7. SUMMARY ........................................................................................................... 50
REFERENCES ............................................................................................................................ 54

1
CHAPTER 1. INTRODUCTION
Agriculture is an essential industry, and will remain important as food security becomes a
growing concern, in response to global population increases. The past 100 years has seen
considerable research and development breakthroughs that have led to a more advanced and
efficient agricultural industry. These advances include developments in agricultural machinery,
commercial fertilizers, drainage and irrigation, genetic cross breeding, biotechnology, to name a
few. However, progress have presented new concerns that must be addressed. The Midwestern
United States experiences extremely high water pollution rates as a result of its intense
agricultural practices. This study focused on denitrifying bioreactors, a technology used to
mitigate surface water nitrate pollution caused by nutrient runoff from farmlands.
Each year excess fertilizer residue remains on the field and is unused by plants. This remaining
residue can leach through the soil profile and enter groundwater; or is transported via surface
flow and subsurface tile drainage into surface waters (streams, lakes, rivers). Tile drainage
serves as a direct pathway for nutrients to bypass the natural filtration of the soil profile and enter
surface waters. In the Midwestern US a combination of subsurface drainage systems and excess
fertilizer application have caused excessive nutrient loading into water ways and are a cause for
concern.
The Mississippi River Basin drains a total of 41% of the continental United States, draining to
the Gulf of Mexico. This river system contains an abundance of nutrients, and pollution is a
problem. Nitrogen and phosphorus fill its waterways and have long-lasting damaging effects on
the natural ecosystem. These nutrients are eventually deposited into the Gulf of Mexico, and as a
result, the ecosystem suffers. A nutrient rich Gulf results in eutrophication and algal blooms

2
dominating the area. Eutrophication causes excessive plant or algae growth from an increased
availability of nutrients (Chislock et al. 2013). Eutrophication in the Gulf of Mexico leads to
hypoxic conditions and as a result marine life suffers. If oxygen levels fall below 2 milligrams
per liter the area is considered hypoxic (Rabalais et al. 2002). Ocean life is unable to survive in
hypoxic conditions and the ecosystem and industries located in the Gulf of Mexico are affected.
Nutrient loading of the Gulf of Mexico has been identified as a major environmental issue and
various best management practices (BMP’s) have been proposed and developed to mitigate this
problem. Denitrifying bioreactors are a best management practice that has been developed to
remove nitrate from subsurface drainage water. Nitrate (NO3-) is a water soluble form of
nitrogen (N) that is a major pollutant in water bodies. Denitrifying bioreactors use a biological
process to convert nitrate (NO3-) into atmospheric nitrogen (N2). Denitrifying bioreactors are
woodchip filled trenches that intercept subsurface drainage water prior to entering drainage
ditches and break down the nitrate into inert nitrogen. Denitrifying bioreactors are a proven
technology for removing nitrate. The next step in the progression of bioreactors design is to
improve their efficiency. This is the underlying motivation that inspired this investigation.
Studies have proven that denitrification is more efficient at higher temperatures (Stanford et al.
1972). Previous work on denitrifying bioreactors have proven that denitrification does occurs at
a higher rate at higher temperatures (Bell 2013; Robertson et al., 2008; Cameron and Schipper,
2010).
This study aims to explore denitrifying bioreactors response to the addition of passive and active
heat. If this study determines the addition of passive and active heating does increase operational
efficiency of bioreactors, then a new iteration of bioreactor design may be implemented. A
system with an increased temperature would result in higher nitrate reduction rates and the

3
ability for a single bioreactor to treat more polluted water. This study investigated one potential
approach to increasing temperature within denitrifying bioreactors, and its effect on nitrate
reduction.

4
CHAPTER 2. OBJECTIVES
The overall goal of this study was to explore the potential use of passive and active heaters to
increase temperature in woodchip-based subsurface denitrifying bioreactors. The specific
objectives were to:
1. Design, install and instrument a paired bioreactor system with a treatment (active and
passive heating) and a control bioreactor
2. Quantify nitrate load removal from both bioreactors
3. Quantify temperature differences between the treatment and control
4. Characterize temperature effects on nitrate removal of denitrifying bioreactors

5
CHAPTER 3. REVIEW OF LITERATURE
3.1 Nitrogen and Agricultural Practices
3.1.1 Nitrogen in Agriculture
Nitrogen (N) is abundantly present in the Earth’s atmosphere, hydrosphere, and
biosphere; however most of this nitrogen is present in molecular form and unusable by most
organisms (Galloway et al., 2003). Atmospheric nitrogen (N2) can be transformed into forms
easily used by organisms. This transformation process is known as nitrogen fixation. In nature,
biological nitrogen fixation naturally occurs through the cultivation of legumes as well as high
temperature combustion processes caused by atmospheric lightning (Winiwarter et al., 2013,
Boyer et al., 2006). A study by Galloway et al. (2004) stated the natural fixation rate of nitrogen
does not meet the increasing need for reactive nitrogen in agriculture to sustain the growing
population. Because of this state of affair scientists have concentrated on techniques for
synthetically developing reactive nitrogen. Galloway et al. (2013) presents a history of the
nitrogen cycle and provides a timeline for scientific advances. In 1823 Johann Wolfgang
Döbereiner was able to convert reactive nitrogen in the form of ammonia (NH3). This discovery
and continued increase in scientific research and knowledge on the chemistry of nitrogen led to
the advent of the Haber-Bosch process. In the Haber-Bosch process atmospheric nitrogen is
converted to ammonia which is a usable form for crops (Haber, 1920). The Haber-Bosch process
led to industrial manufacturing of ammonia and the intensification of fertilizer usage in the
United States.
3.1.2 Crop Production and Fertilizer Usage
The Midwest United States (Illinois, Indiana, Iowa, Kentucky, Michigan, Minnesota,
Missouri, Ohio, and Wisconsin) is one of the most intensely farmed regions in the world. This

6
region of the United States concentrates it agricultural production on corn and soybeans, the
most common agricultural crops grown in the United States. In 2013, the United States
harvested nearly 30.8 million hectares [76 million acres] of soybeans and over 35.4 million
hectares [87.5million acres of corn], resulting in the production of over 3.25 billion bushels of
soybean and 14 billion bushels of corn (USDA NASS, 2014). The majority of this crop
production occurs in the Midwest. In 2012, 20.1 million hectares [49.7 million acres] or 57% of
corn hectares harvested, and 30.8 million hectares [76.2 million] or 51% of soybeans hectares
harvested were produced in the Midwest states (USDA NASS, 2014). This resulted in 58
percent of the bushels of corn and 56 percent of the bushels of soybeans produced in 2012 in the
United States being grown in the Midwest (USDA NASS, 2014). In 2012 Illinois was the
second largest producer of corn and soybeans after Iowa. Illinois harvested 5.0 [12.3] and 3.6
[8.9] million hectares [acres] of corn and soybeans, respectively.
In 2007, commercial fertilizer was applied to approximately 107.6 million hectares [266 million
acres] of farmland in the United States (USDA Census of Agriculture, 2007). According to the
Census of Agriculture (2007), 7.8 million hectares [19.2 million acres] of farmland were
commercially fertilized in Illinois in 2007. Figure 1 shows fertilizer usage on cropland within
the United States in 2007 and visually depicts Illinois as one of the most heavily fertilized states.
Figure 2 shows the average annual fertilizer N inputs by county in the Mississippi River Basin
(MRB) over a 9 year period. Illinois is the state with the highest average annual N input within
the Mississippi river basin.

7
Figure 1. Acres of Cropland fertilized as percent of all cropland acreage (USDA Census of
Agriculture, 2007).
Figure 2. Average Annual fertilizer N inputs by county for Mississippi River basin for 1997-2006
(David et al., 2010)

8
3.1.3 Nitrogen Based Fertilizer and Basic Soil Chemistry
There are many nitrogen based fertilizers available on the market for a farmer. These
fertilizers include: Anhydrous ammonia (82% Total N) [NH3], Urea (46% Total N) [CH4N2O],
Ammonium Nitrate (34 % Total N) [NH4NO3], UAN (30% Total N) [urea+ammonium
nitrate+water], Ammonium Sulfate (21% Total N) [(NH4)2SO4], Diammonium Phosphate (18%
Total N) [(NH4)2H2PO4], and Monoammonium phosphate (11% Total N) [NH4H2PO4] (Penn
State University, 2014).
Ammonia [NH3] in soil solution reacts and quickly forms ammonium ions [NH4+].
Ammonium carries a positive charge and can be absorbed onto the soil particles. The binding to
the soil means that nitrogen in this form does not leach from the soil. However, ammonium ions
are easily oxidized by bacteria in the soil to form nitrite [NO2-] and eventually nitrate [NO3
-].
Both nitrite and nitrate are soluble and extremely mobile and likely to leach away from where
they are applied.
3.2 Agricultural Drainage and Water Quality
3.2.1 History and Extent
Over many decades in the 19th century, Illinois landscape transformed from wetlands,
marshes and swamps to the highly productive land of the region (Kalita et al., 2007). Hey &
Philippi (2007) estimate the Mississippi River basin contained 18.2 million hectares [45 million
acres] of wetlands in 1780. By 1980 this number had diminished to 7.7 million hectares [19
million acres] (Hey & Philippi, 2007). Agricultural drainage is a primary cause of this drastic
landscape change that occurred in the Mississippi River Basin over the 200 year time span. The
use of tile drainage completely transformed Illinois from marshland to the productive row-crop
land cultivated today. Figure 3 confirms that Illinois is one of the most intensively tiled drained

9
states. Currently, 90% or 4 million hectares of Illinois cropland has implemented a drainage
system (Kalita et al. 2007). This tile drained landscape has altered the hydrological environment
and nutrient cycle of the region.
Figure 3. Fraction of county area that is tile drained in the Mississippi River basin. (David et al.,
2010)
Subsurface drainage lines serve as conduits for the nutrients applied to the fields to enter surface
water bodies. David et al. (2010) confirmed a positive correlation between tile drainage and
riverine N nitrate loads. Figure 3 contains the fraction of county area that is tile drained within
the Mississippi River Basin while figure 4 contains predicted average riverine nitrate yields by
county. These two graphics together depict the positive correlation between tile drainage and
riverine N nitrate loads. Counties with higher concentration of tile drained landed are more
likely to have higher nitrate yields.

10
Figure 4. Predicted average riverine nitrate N yield, January to June, for all counties in the
Mississippi basin for period 1997 to 2006. (David et al., 2010).
3.2.2 Water Quality Concerns
Even though agricultural drainage has led to productive soils resulting in high crop
yields, there are negative environmental impacts that have resulted from the implementation of
drainage. Petrolia and Gowda (2006) explained that 90% of the freshwater contribution to the
Gulf of Mexico flows from the Mississippi River basin which drains a total of 41% of the
continental United States land area. From 1980-1996 the Mississippi-Atchafalaya River Basin
input roughly 1.6 million metric tons of total N into Gulf of Mexico. Of the 1.6 metric tons of N,
61% is nitrate, 37% is dissolved and particulate organic N and 2% is ammonium (Goolsby et al.,

11
1999). Tile drains act as conduits for this reactive nitrogen to be removed from agricultural land
into streams and rivers that reach the Mississippi River and eventually enter the Gulf of Mexico.
The Gulf of Mexico on the Louisiana/Texas continental shelf is the location of one of
the largest zones of estuarine and coastal hypoxia in the world (Rabalais et al., 2002). Hypoxic
or “dead” zones are characterized by areas of low oxygen and if oxygen levels fall under 2
milligram per liter the area is considered hypoxic (Rabalais et al. 2002). Nutrients, specifically
nitrogen and phosphorus, present in agricultural production, legume cultivation, human
wastewater, industrial sources, and fossil fuels are linked to the causes of hypoxia (Rabotyagov,
2014). Nutrient runoff from the production of corn and soybean are the largest contributor of
nitrogen and the second largest contributor to phosphorus to the Gulf of Mexico (Alexander et al,
2008).
Figure 5. Percentage of nitrogen and phosphorus delivered to the Gulf of Mexico (Alexander et al,
2008).

12
As previously stated, Illinois is the second largest producer of both corn and soybean in the
United States. Coupled with the fact that corn and soybean crops are heavy contributors to the
nutrient load entering the Gulf of Mexico it is logical that Illinois be one of the largest
contributors of nutrients. As indicated in Figure 6, Illinois contributes 10-17% of total nitrogen
and phosphorus loads to the gulf. (Alexander et al, 2008).
Figure 6. Estimated contributions to Gulf, by state (Alexander et al, 2008).
3.3 Mitigating Water Quality Degradation and Other Best Management Practices (BMP’s)
Studies have proven the necessity to keep nutrients within farm fields and out of water
bodies. There have been a variety of approaches used to help mitigate this known problem under
the general heading Best Management Practices (BMP’s).
3.3.1 Drainage Water Management and Wetlands
Drainage water management has been a proven method of conserving water, increasing
yields, and reducing nitrate and phosphorus losses to surface waters from tile drained fields
(Poole et al, 2013). In drainage water management, a water control structure is installed at the

13
end of a tile system to control the height of the drain outlet of the field (Kalita et al., 2007). The
height of the drain outlet will be raised after harvest and this action will reduce nitrate loading
from tile effluent, and this management practice has observed nitrate reductions of 47% (Kalita
et al., 2007). Adeuya et al. (2013) conducted a two year study drainage water management study
on paired fields in Indiana and found annual nitrate load reductions ranging from 15%-31%.
Cooke and Verma (2012) conducted a study in Illinois that found annual nitrate load reductions
for DWM fields ranging from 37% to 79% with an average nitrate reduction of 61%. Woli et al.
(2010) compared free drainage systems with drainage water management systems and found a
three year average loss of 57.2 kg N ha-1 yr-1 in free drainage compared to 17 kg N ha-1yr-1 for
controlled drainage.
Constructed wetlands are another management practice used to reduce nitrate loading
from drained fields. Poe et al (2003) conducted wetland studies in a North Carolina wetland that
received surface drainage from 971 ha area and found the wetland received variable N loading of
1-1,729 kg N per month and had a variable N removal of 8-81 kg N per month. Kovacic et al
(2008) studied three wetlands treating tile-drained runoff from corn and soybean cropland and
determined the wetlands reduced 37% of the nitrate input over a 3 year period.
3.3.2 Denitrifying Bioreactors
Subsurface denitrifying bioreactors are carbon source (i.e. woodchips) filled trenches that
treat nitrate rich agricultural drainage water. In 1994 the first study demonstrating bioreactors
ability to reduce nitrate in drainage effluent was published (Blowes et al., 1994). Since this first
study many researchers have affirmed bioreactors ability to reduce nitrate concentrations from
flowing subsurface drainage water.

14
Blowes et al (1994) first study on the denitrification abilities of bioreactors took place in
the village of Kintore in Ontario, Canada. The study used two 200 L fixed bed bioreactors
containing a mixture of both sand and tree bark, woodchips, and leaf compost as sources of
organic carbon. The bioreactors treated influent agricultural drainage water with nitrate
concentrations of 3 to 6 mg L-1. After an acclimation period of 2 weeks the study found effluent
nitrate concentration was consistently less than .02 mg L-1. Data suggested a residence time of
less than 1-2 days was sufficient to keep high removal of nitrate and allow for low effluent
nitrate concentrations. This study affirmed bioreactors ability to remove nitrate from agricultural
drainage water and was the catalyst for many future bioreactor studies.
Robertson et al. (2008) published a report encompassing 15 years of bioreactor research
conducted in southern Ontario. This was a pilot scale bioreactor that consisted of a sand and
sawdust mixture that was in operation for 15 years. Robertson et al (2008) found nitrate removal
rates that ranged from0.22 mg N L-1d-1 to 6.0 mg N L-1d-1 with the sand sawdust mix. Janyes et
al. (2008) found the removal rate of woodchip based carbon source bioreactors to have a nitrate
removal rate of 0.622 mg N L-1d-1. Elgood et al. (2010) found a monthly average nitrate removal
rate over a one year period to range from 0.3-2.5 mg N L-1. Cameron et al. (2010) found a nitrate
removal rate of 2-10 mg N L-1d-1. A 2009 study complied and presented nitrate removal rates for
different bioreactor treatment system that can be seen in table 1 below (Christianson et al., 2009).

15
Table 1. Nitrate removal rates for denitrification treatment systems reported in literature.
Although the removal rates are variable this confirms bioreactors denitrifying ability. Further
research on the variable such as temperature (Schipper et al., 2008; Robertson et al., 2008),
retention time (Chun et al., 2009), bioreactor size still need to be further analyzed and studied.
Currently bioreactors are mainly used for research and demonstration purposes, however,
with increased knowledge bioreactors may potentially be a common agricultural practice for
nitrate removal. The Illinois Nutrient Reduction Strategy was developed by a committee of
environmental researchers and aims to reduce nutrient pollution in Illinois’ rivers, lakes, and
streams. This strategy clearly outlines the positive environmental effects of bioreactors and helps
to spread the technology to new potential users. This strategy may help improve bioreactors
visibility in the agricultural community and create an uptake in bioreactor usage, and result in
nutrient reduction.
3.4 Denitrification and Temperature
Bioreactors work on the principle of denitrification. In denitrification, nitrate [NO3-] is
converted to nonreactive atmospheric nitrogen [N2] via the microbial community present in the
Reference System Description Location Nitrate Removal Rate
System Volume System Surface Area
Schipper and
Vojvodic-Vukovic
2000
Sawdust flow-through
wall for groundwater
Cambridge,
New Zealand
0.11-0.43g N/m3/d N/A
Schipper et al. 2005 Sawdust flow-through
wall for groundwater
Cambridge,
New Zealand
1.4 g N/m3/d N/A
Fahner 2002 thesis
cited in Schipper et al.
2005
Sawdust flow-through
wall for groundwater
Busselton,
Australia
15 g N/m3/d N/A
Janyes et al. 2008 Flow-through woodchip
wall between crop rows
Iowa, USA 0.62 g N/m3/d N/A
Van Driel et al. 2006a Fine coarse wood media
agricultural drainage
reactor
Ontario,
Canada
2.3g N/m3/d 2.5 g N/m2/d
Van Driel et al. 2006b Fine wood media, riparian
groundwater treatment
Ontario,
Canada
1.2-5 g N/m3/d 0.7-3.5 g N/m2/d
Christianson, 2009 Pilot scale woodchip
bioreactors
Iowa, USA 3.8-5.6 g N/m3/d 1.5-3.4 g N/m2/d

16
carbon source of the bioreactor. This conversion occurs when nitrate [NO3-] is first converted to
nitrite [NO2-], then nitric oxide[NO], nitrous oxide[N2O] and finally to nonreactive dinitrogen
[N2] (Knowles, 1982). There are many environmental conditions that influence denitrification,
such as oxygen content, temperature and pH (Heinen, 2006). Heinen (2006) explains the rate of
biological processes exponentially increase with increasing temperature. Stanford et al., (1975)
found the biological reaction rates increased by a factor of two or three for each 10°C rise in
temperature in nine different test soils tested. Bachand and Horne (1999) determined that nitrate
removal via denitrification is positively correlation with water temperature in constructed
wetlands another management practice used to treat nitrate heavy effluent. Increasing the
temperature of a bioreactor theoretically should increase the denitrification rate and results with
greater reductions in nitrate. Studies have found a positive relationship between temperature and
removal rates obtained in denitrifying bioreactors (Bell 2013; Robertson et al., 2008; Cameron
and Schipper, 2010). Schipper et al. (2011) conducted an evaluation of passive solar heating to
increase nitrate removal in denitrification beds receiving municipal wastewater effluent. The
study found that passive solar heating increased the mean bioreactor bed temperature by 3.4°C,
but did not find a measurable increase in nitrate removal due to variability of the removal rate
exceeding the expected increase due to temperature (Schipper et at., 2011). Currently research
has yet to be published on the effects of passive solar heating on subsurface denitrifying
bioreactors used to treat agricultural runoff.

17
CHAPTER 4. METHODOLOGY
4.1 Site Description
The research site is located on the University of Illinois-Urbana Champaign Research
Farm near the intersection of Co Rd 1200 N and Co Rd 1350 E (40.056981, -88.218369), on the
north east bank of the Embarras River as shown in figure 7. This location is within the Embarras
Watershed located in central Illinois and experiences a humid continental climate, characterized
by cold winters and hot and humid summers. Champaign-Urbana experiences an average annual
precipitation of 1051 mm. The field that drains to the bioreactor contains 50% Drummer Silty
clay loam soil, 23 % Throp silt loam, 12.9 % Blackberry silt loam, as well as traces of Flanagan
silt loam and Elburn silt loam soils.
Figure 7. Research site location
4.1.1 Paired Subsurface Bioreactors
A paired subsurface bioreactors system was installed at the research site in November
2014. The system is comprised of two bioreactors measuring 6.1 length x 1.5 width x 1.5 depth

18
m3. The schematic of the bioreactor design is depicted in figure 8. The system uses three
AgriDrain ™ structures to divert water from the flowing subsurface tile lines through both the
treatment and control bioreactors, before entering the Embarrass river. The paired system
ensures the intial properties of the water entering each bioreactor are identical for treatment and
control comparsion analysis.
Figure 8. Top-view paired bioreactor schematic.
4.2 Treatment Bioreactor
The treatment bioreactor was equipped with both active and passive heating mechanisms
to attempt to raise the temperature within it. The source of active heating is an electric
underground heater located along the length of the bottom of the bioreactor bed. The passive
heating element is a solar greenhouse consisting of a wooden frame and polyethylene plastic
covering.
4.2.1 Active Heating
The active heating elements within the treatment bioreactor are two ThermoTile TT20-
120 radiant floor heaters. The heaters, conventionally used to heat tile floors in residential

19
bathrooms, were retrofitted for use in the bioreactor. The electrical characteristics are provided
in Table 2.
Table 2. ThermoTile Characteristics
Model TT20-120
Width (m) 0.46
Length (m) 6.10
Heated Area (m2) 2.79
Current (A) 3.00
Peak Power (W) 360
The ThermoTile TT20-120 radiant floor heaters run on 120 VAC. The heaters have a width of
0.46 m and a length of 6.10 m. Two ThermoTiles TT20-120 heaters were installed to provide
full coverage of the bottom of the bioreactor bed (figure 9). The system required 720 watts
produced by running 6.00 amps at 120 VAC. An off-grid solar system was installed at the
research site to provide the energy required for the heaters operation.
Figure 9. Installation of Thermotile underground heaters

20
4.2.2 Solar Array
A 1000 watt off-grid system was installed to meet the energy requirements of the
underground ThermoTile heaters fitted in the treatment bioreactor. The 1000 watt system is
composed of four 255 Watt Canadian PV modules mounted on a storage shed at the research
site. The PV modules panels connect to a Midnite Solar Classic 200 MPPT charge controller
located inside the storage shed. The charge controller regulates the energy input from the solar
panels to the battery bank. The battery bank in this system is comprised of 2 size 4D 12V heavy
duty commercial batteries. The battery bank powers a 1500 watt Trace Engineering sine wave
inverter. The sine wave inverter converts the battery DC output to 120VAC output. Due to
economic constraints the system was sized to only operate when the PV modules produced the
necessary amount of power (720 watts) to power the electric load. To ensure longevity, the solar
system was programmed to operate under specific conditions, and the conditions needed to meet
all system requirements in order to energize the ThermoTile heaters.
Figure 10. Flow diagram of PV system
21
4.2.3 Passive Heating
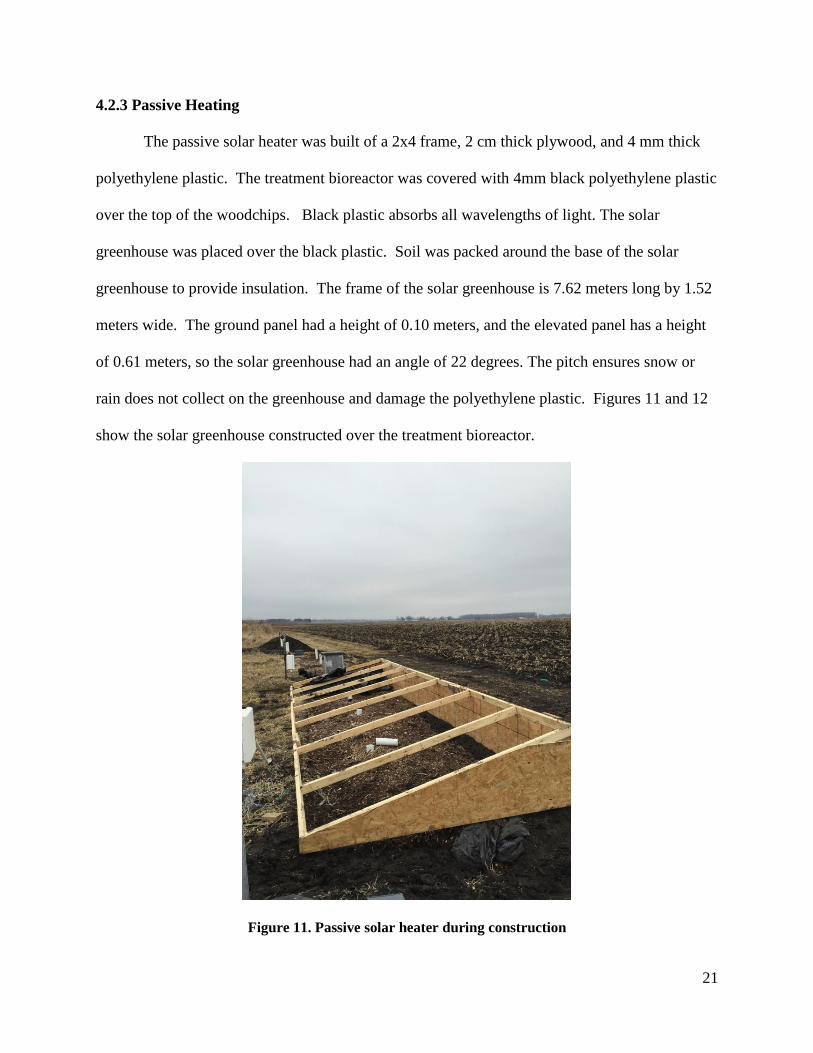
The passive solar heater was built of a 2x4 frame, 2 cm thick plywood, and 4 mm thick
polyethylene plastic. The treatment bioreactor was covered with 4mm black polyethylene plastic
over the top of the woodchips. Black plastic absorbs all wavelengths of light. The solar
greenhouse was placed over the black plastic. Soil was packed around the base of the solar
greenhouse to provide insulation. The frame of the solar greenhouse is 7.62 meters long by 1.52
meters wide. The ground panel had a height of 0.10 meters, and the elevated panel has a height
of 0.61 meters, so the solar greenhouse had an angle of 22 degrees. The pitch ensures snow or
rain does not collect on the greenhouse and damage the polyethylene plastic. Figures 11 and 12
show the solar greenhouse constructed over the treatment bioreactor.
Figure 11. Passive solar heater during construction

22
Figure 12. Passive solar heater in operation
4.3 Data Collection
4.3.1 Data Loggers
A total of five 4-channel SGT Engineering Data Loggers (Figure 13) were incorporated
into the data collection system. The instruments used to measure both temperature and water
depth had voltage outputs that were saved on the hard drive in the data logger. Each voltage
corresponded to a specific value (temperature, °C or pressure, PSI) based on the calibration
curves of the respective instruments. The system contains a total of 20 sensors; 17 sensors used
to determine temperature, and 3 pressure transducers. Each sensor was individually calibrated
prior to the study in the Hydraulics Laboratory in the Agricultural Engineering building at the
University of Illinois. The data loggers were set to record data at 30 minute intervals for the
entirety of the investigation.

23
Figure 13. SGT Engineering data logger
4.3.2 Temperature Sensors
The system was equipped with 17 temperature sensors located at various positions. The
control and treatment bioreactors each had six temperature sensors located at different positions
within the bioreactor bed. Temperature sensors located at positions 1, 2 and 3 were at a depth of
1.24 meters, and those sensors located at positions 4, 5 and 6 were at a depth of 0.50 meters
(Figure 14). Horizontally, positions 1 and 4 were located 1.00 meters from the inlet, positons 2
and 5 were located 3.50 meters from the inlet, and positions 3 and 6 were located 5.10 meters
from the inlet (Figure 14).
Figure 14. Side-view bioreactor dimensions

24
Figure 15. Temperature sensor locations
Figure 15 depicts the temperature sensor by position for both bioreactors; H1-H6 are positions 1-
6 for the treatment (heated) bioreactor and C1-C6 are positions 1-6 for the control bioreactor.
Temperature sensors at positions 1-3 are completely submerged in the drainage flow throughout
the entire investigation. Temperature sensors at position 4-6 are above the water level except
during periods of flooding and high water tables. Temperature sensors are also located at the
bottom of each AgriDrain™ structure to collect water temperature data at the inlet and outlets of
the paired bioreactor system. Finally, two more temperature sensors are used to collect ambient
air temperature and air temperature inside the passive solar heater.
4.3.3 Pressure Transducers
The system was equipped with three pressure transducers located at the bottoms of the
AgriDrain ™ structures positioned at the inlet and outlets of both the treatment and control
bioreactors. The pressure transducers recorded voltage corresponds to a depth of water. Flow
rates were calculated using a calibrated V-notch weir located with the water control structures,
based on the depths of water obtained from pressure transducer data. Flow rate is required to

25
measure hydraulic retention time of both the treatment and control bioreactor as well as
determine total nutrient load released into the Embarras River.
4.4 Water Sampling
Water samples were collected every four days from November 1, 2014 to March 15,
2015. March 15, 2015 – June 1, 2015 sampling frequency was increased to two day intervals.
Samples were collected using 30 mL NALGENE bottles. The NALGENE bottles and caps were
acid washed to eliminate biological activity within the sampling container. Collected samples
were transported to a freezer in the Water Quality Lab at the University of Illinois and keep
frozen until analysis. Water was analyzed for Nitrate [NO3-], Soluble Reactive Phosphorus [PO4
-
], Dissolve Oxygen Percentage, and pH.
4.4.1 Nitrate Analysis
Nitrate analysis was conducted in the Water Quality Laboratory located at the department
of Agricultural and Biological Engineering at the University of Illinois Urbana-Champaign.
Nitrate concentration was determined by an automated hydrazine reduction method using an
AAII Continuous-Flow Autoanalyzer.
4.4.2 Phosphorus
Soluble reactive phosphorus analysis was conducted by the Water Quality Laboratory
located at the department of Agricultural and Biological Engineering at the University of Illinois
Urbana-Champaign. Phosphorus concentration was determined via an automated ascorbic acid
reduction method using an AAII Continuous-Flow Autoanalyzer.
4.4.3 Dissolved Oxygen
An YSI Professional Plus handheld multi-parameter meter with Quatro cable was used to
record values for dissolved oxygen (DO). The DO sensor was calibrated prior to each use. The

26
data were collected at the field using the YSI meter at the time of sampling. The DO sensor was
used to determine DO levels at the inlet, treatment outlet, and control outlet AgriDrain ™
structures. The sensor was allow to settle 6 minutes prior to data collection.
4.4.4 pH
An YSI Professional Plus handheld multi-parameter meter with Quatro cable was used to
record values for pH levels. This pH sensor was calibrated bi-weekly. The data were collected in
real time at the time of sampling. The pH sensor was used to determine pH levels at the inlet,
treatment outlet, and control outlet AgriDrain ™ structures. The sensor was allow to settle 6
minutes prior to data collection.

27
CHAPTER 5. RESULTS
The overall goal of this investigation was to determine if the passive and active heating
increased the temperature of the bioreactors and if a change in temperature affected the
denitrification rates and nitrate loads of the bioreactors. Results are presented in three sections,
with the first two sections corresponding to the objectives listed above. The third section
contains additional water quality results investigated during the study.
5.1 Temperature
Temperature results will determine if the passive and active heating affected the
temperatures of the treatment and control bioreactors. Data including solar greenhouse
temperatures, positional temperatures, and AgriDrain™ structure temperatures were analyzed to
quantify the effect of the heating treatment on the bioreactor bed temperature.
5.1.1 Solar Greenhouse
The greenhouse structure was added as a passive heating element to attempt to increase
the temperature within the treatment bioreactor. Ambient air temperature and solar greenhouse
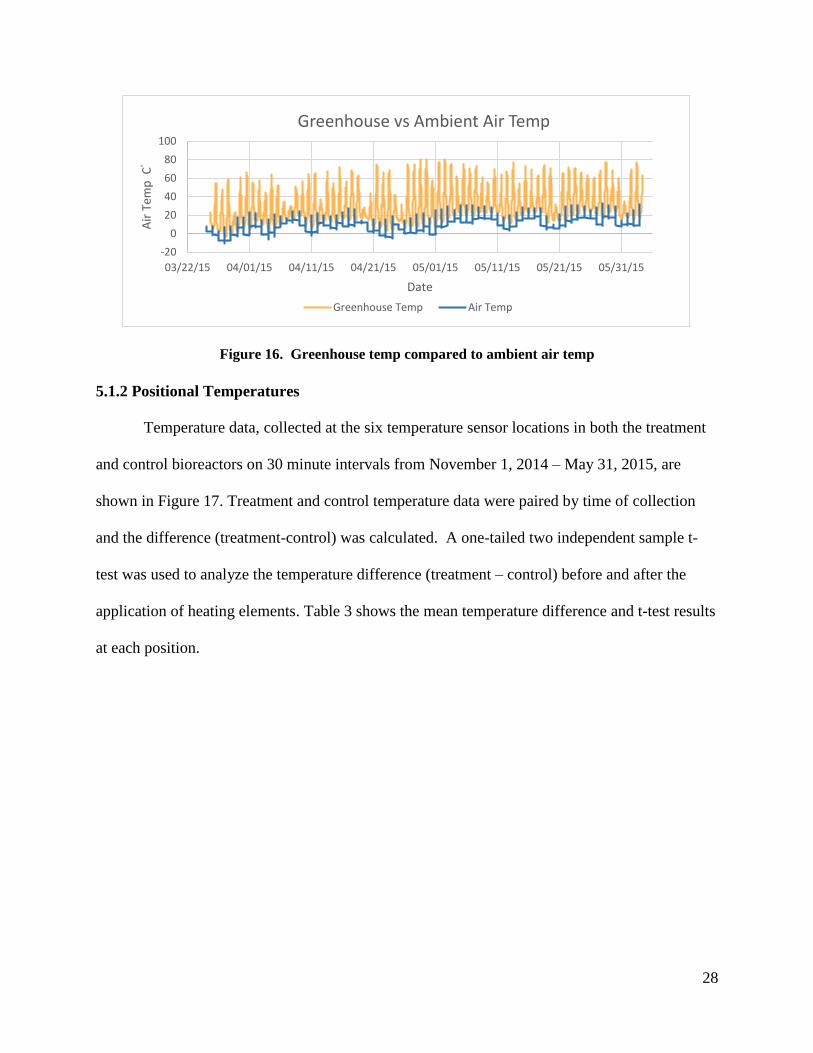
data were collected from March 25, 2015 – May 31, 2015. These data are plotted in figure 16.
Both the greenhouse and ambient temperature display a similar pattern of large temperature
fluctuations. This cyclical pattern is a result of the increasing temperature during daylight hours
and decreasing temperature during the night. During the investigation the solar greenhouse
temperature was an average of 14.21°C (SD = 11.73) higher than the ambient air temperature.
The maximum ambient temperature reached during the investigation was 32.93 °C recorded on
May 28, 2015. The maximum greenhouse temperature recorded was 80.77 °C recorded on April
28, 2015. The solar greenhouse heating was effective at increasing air temperature above the
treatment bioreactor.
28
Figure 16. Greenhouse temp compared to ambient air temp
5.1.2 Positional Temperatures
Temperature data, collected at the six temperature sensor locations in both the treatment
and control bioreactors on 30 minute intervals from November 1, 2014 – May 31, 2015, are
shown in Figure 17. Treatment and control temperature data were paired by time of collection
and the difference (treatment-control) was calculated. A one-tailed two independent sample t-
test was used to analyze the temperature difference (treatment – control) before and after the
application of heating elements. Table 3 shows the mean temperature difference and t-test results
at each position.
-20
0
20
40
60
80
100
03/22/15 04/01/15 04/11/15 04/21/15 05/01/15 05/11/15 05/21/15 05/31/15
Air
Tem
p C
°
Date
Greenhouse vs Ambient Air Temp
Greenhouse Temp Air Temp

29
Table 3. Temperature Difference (treatment-control) and T-test results by position
Mean
Temperature
Difference
Before
Heating (°C)
Mean
Temperature
Difference
After Heating
(°C)
Heating
Effect
(∆Temp)
Test
Statistic P-Value
Position 1
(H1-C1) -0.53 -0.95 -0.47
t (10172) =
-52.52 p = 1.00
Position 2
(H2-C2) -1.06 -0.33 0.73
t (10172) =
49.15 p = 0.00
Position 3
(H3-C3) -0.13 2.00 2.13
t (10172) =
112.30 p = 0.00
Position 4
(H4-C4) 0.37 6.91 6.54
t (10172) =
104.09 p = 0.00
Position 5
(H5-C5) -0.35 6.77 7.12
t (10172) =
83.82 p = 0.00
Position 6
(H6-C6) -1.90 7.04 8.94
t (10172) =
167.70 p = 0.00
Position 1 was the only position that did not experience an increase in temperature of the
treatment bioreactor after the heating elements were applied. At 0.05 alpha levels there was not a
significant increase in temperature for before heating (M = -0.53, SD = 0.41) and after heating
(M = -0.95, SD = 0.33) conditions; t (10172) = -52.52, p = 1.00. This lack of temperature
increase suggests the heating treatment did not have an effect on the temperature at position 1 in
the experimental design.
Positions 2-6 all experienced an increase in temperature of the treatment bioreactor after the
application of the heating elements. The two independent sample t-tests proved the temperature
increase was significant at the 0.05 alpha levels for positions 2-6. The test statistic and p-values
from the t-test for position 2-6 are outlined in table 3. The increase in temperatures after the start
of treatment are clear depicted for positions 3-6 in figure 17. The increase in temperature at
position 2 is more difficult to determine based on the plot, however, statistical analysis proves
there was a temperature increase.

30
Figure 17. Positional temperature comparison

31
5.1.3 Positional Slopes
Temperature data of each bioreactor bed position (1-6) was further analyzed using a slope
comparison. A one-tailed two independent sample t-test with 0.05 alpha levels was used to
analyze the slope of the relationship between the temperature at corresponding positions before
and after the addition of the passive and active heating elements. Temperature data were plotted
(control temp x treatment temp) and the slopes of these plots were analyzed. Figure 18 contains
the slope plots for each position. Table 4 shows the slopes at each position and the results of the
two independent t-tests.
Table 4. Slope difference by position
Slope Before
Heating (°C)
Slope After
Heating (°C) Test Statistic P-Value
Position 1 (H1-C1) 1.0855 1.0318
t (10172) =
18.91 p = 1.00
Position 2 (H2-C2) 1.1572 1.3138
t (10172) = -
29.83 p = 0.00
Position 3 (H3-C3) 1.1328 1.2152
t (10172) = -
9.59 p = 0.00
Position 4 (H4-C4) 1.4194 1.3764
t (10172) =
5.09 p = 1.00
Position 5 (H5-C5) 1.9173 1.4939
t (10172) =
61.02 p = 1.00
Position 6 (H6-C6) 1.1133 1.3624
t (10172) = -
43.31 p = 0.00
Positions 1, 4 and 5 did not see an increase in slope after the application of the heating elements.
This result suggest these positions did not see an increase in temperature in the treatment
bioreactor. Position 1 results align with the positional temperature analysis. Position 1 did not
have a temperature increase as a result of the treatment bioreactors. This is likely a result of
position 1’s location at entrance of the bioreactor. The drainage water does not have enough
time to interact with the heating elements to cause a temperature increase. Position 4 and 5 slope
results contradict the result obtained from the positional temperature analysis.

32
Positions 2, 3 and 6 had an increase in slope after the application of heating elements. This result
suggest temperatures at these positions did increase as a result of the heating elements. This
results aligns with the results from the positional temperature analysis.
Figure 18. Slope comparison by bioreactor bed position

33
5.1.4 Water Structures Outlet Temperatures
Temperature sensors were placed in the three water control structures (Inlet, Treatment,
and Control). Data were collected on 30 minute intervals from March 25th – June 3rd 2015.
Figure 19 contains a plot of all three sensors temperature readings throughout the investigation.
Figure 19. Water control structures temperature data
A nonparametric Kruskal Wallis statistical test was conducted to compare temperatures
in the Treatment (heater), Control, and Inlet structures (Sheskin, D.J., 2007). The results of the
test showed statistically significant difference at alpha levels of 0.05, in the temperature at the
structures, χ2 (2, N = 3287) = 130.81, p = 0.00. Table 5 contains the rank data for each structure.

34
A post hoc Mann-Whitney U test with Bonferroni corrected alpha levels of 0.016 was
conducted to provide full comparison of temperature in each structure (Sheskin, D.J., 2007). The
results of the Mann-Whitney analysis are outlined in table 6.
Table 5. Structure Rank Data
N Mean Rank Sum of Ranks
Treatment 3287 5374.88 1.77E7
Control 3287 4592.94 1.51E7
Inlet 3287 4825.18 1.58E7
Table 6. Mann-Whitney Results Water Temperature
U Z Bonferroni Adjusted
α levels
Probability
Treatment-Control 6.19E6 10.22 0.016 0.00
Treatment-Inlet 6.08E6 8.75 0.016 0.00
Control-Inlet 5.08E6 -4.23 0.016 0.00
The Mann-Whitney analysis with Bonferroni adjusted alpha levels indicates the water
temperature was greater in treatment structure (Mdn = 9.47) than control structure (Mdn = 9.37)
[U = 6.19E6, p = 0.00] and the inlet structure (Mdn = 8.91) [U = 6.08E6, p = 0.00]. The results
also states the water temperature of the inlet structure is statistically warmer than the control
structure [U = 5.08E6, p = 0.00]. Overall, the presence of heating elements in the treatment
bioreactors was able to statistically raise the outlet water temperature compared to both the inlet
and control structures.
5.2 Water Quality
Water quality results were used to determine if the passive and active heating affected the
water quality of the treatment and control bioreactors. Data, including phosphorus, nitrate, pH,
and dissolved oxygen content were analyzed to quantify the effect the treatment had on the water
quality.

35
5.2.1 Phosphorus
Phosphorus was analyzed for 50 samples at varying dates of the investigation. All of the
inlet and outlet samples had phosphorus levels below the detection limit of the laboratory
equipment used for the analysis. Because of the lack of phosphorus in the first group of samples
analyzed, this part of the investigation was abandoned. Phosphorus results were not analyzed in
this study.
5.2.2 Nitrate Results
Water samples were collected November 1, 2014 – May 31, 2015 at the inlet, treatment
(heater) outlet, and control outlet positions. The samples were analyzed for nitrate (NO3-) and
the results are outlined in figure 20 and figure 21. Figure 20 contains a bar graph of the nitrate
concentrations at each position. Data shows treatment and control positions having higher nitrate
concentrations than the inlet position on several sample dates. Nitrate concentration reduction,
relative to inlet concentration, are shown in Figure 21 for both the treatment (heated) and control
bioreactors. There is an apparent negative reduction on many days. Bioreactors are a proven
technology for removing nitrate, however this data suggests the bioreactors are increasing nitrate
levels as opposed to reducing nitrate. This suggests an error in the data. This issue is explored
further in the Chapter 6.

36
Figure 20. Nitrate concentration by date at inlet, control outlet, and treatment outlet positions
0.00
5.00
10.00
15.00
20.00
25.00
30.00
35.00
11/04/14 11/25/14 12/08/14 12/23/14 02/07/15 03/05/15
N-C
on
cen
trat
ion
Nitrate Concentration
0.00
5.00
10.00
15.00
20.00
25.00
30.00
03/12/15 03/19/15 03/23/15 03/27/15 04/02/15 04/08/15
N-C
on
cen
trat
ion
0.00
5.00
10.00
15.00
20.00
25.00
04/13/15 04/17/15 04/22/15 04/30/15 05/08/15 05/19/15
N-C
on
cen
trat
ion
Inlet Control Treatment

37
Figure 21. Nitrate removal
5.2.3 pH
The YSI ProPlus multiparameter meter was used to measure pH. Data were collected in
April 1st- May 27th. The USEPA water quality criteria range of pH levels is set from 6.5 to 9 to
ensure the protection of aquatic life (USEPA, 2014). The maximum pH recorded during the
investigation was 6.98. The value was measured at the inlet position on April 21st 2105. The
minimum pH recorded during the investigation was 6.51 and was measured at the heater outlet
on May 6, 2014. The entire data series of pH values remained within the USEPA water quality
range. The pH data is present in the bar graph in figure 22.
-2.5
-2
-1.5
-1
-0.5
0
0.5
1
1.5
10/15/14 12/04/14 01/23/15 03/14/15 05/03/15 06/22/15
Per
cen
t N
itra
te R
emo
val
Date
Nitrate Reduction
Inlet Control Treatment

38
Figure 22. pH comparison by position
A nonparametric Kruskal Wallis statistical test was conducted to compare pH levels in
the Treatment (heated), Control, and Inlet structures. The results of the test showed statistical
difference at alpha levels of 0.05, in the pH levels at the structures, χ2 (2, N = 24) = 36.53, p =
0.00. Table 7 contains the rank data for each structure.
A post hoc Mann-Whitney U test with Bonferroni corrected alpha levels of 0.016 was
conducted to provide full comparison of pH in each structure. The results of the Mann-Whitney
analysis are outlined in table 8.
Table 7. Structure Rank Data
N Mean Rank Sum of Ranks
Treatment 3287 5374.88 1.77E7
Control 3287 4592.94 1.51E7
Inlet 3287 4825.18 1.58E7
Table 8. pH Mann-Whitney Comparison
U Z Bonferroni Adjusted
α levels
Probability
Treatment-Control 99.5 -3.88 0.016 0.00
Treatment-Inlet 29 -5.33 0.016 0.00
Control-Inlet 199.5 -3.47 0.016 0.00
6
6.1
6.2
6.3
6.4
6.5
6.6
6.7
6.8
6.9
7
4/1/2015 4/18/2015 4/24/2015 5/7/2015 5/21/2015
pH
Lev
el
Date
pH Comparison
Inlet Control

39
The Mann-Whitney analysis using Bonferroni adjusted alpha levels indicates the pH
levels at the inlet structure (Mdn = 6.84) is statistically larger than pH levels at both the treatment
(heated) structure (Mdn = 6.62) and control structure (Mdn = 6.76). This result suggests the
bioreactors lower pH levels throughout the denitrification process. The post hoc Mann Whitney
analysis compared the pH levels at the treatment (heated) and control structures. The results
suggest the pH level at the treatment (heated) outlet structure was statistically lower than at the
control outlet structure. This suggests the presence of heating elements in the treatment
bioreactors statistically lowered pH levels compared to the control bioreactor. Bell (2013) also
found a decrease in pH in bioreactor effluent.
pH data was also analyzed by comparing pH levels in the treatment and control to their
retention times. Since biological activity of denitrifying bioreactors lower pH, it is expected that
pH should decrease as retention time increases. The results from this study do not follow this
trend. This is likely due to temperature variation at the retention times caused by seasonal
differences. The longer retention times in this study were recorded in the coldest months with
the least amount of biological activity and as a result pH levels did not follow the expected trend.
Figure 23. pH plotted against retention time.
6.5
6.55
6.6
6.65
6.7
6.75
6.8
6.85
6.9
0 5 10 15 20 25 30 35 40
pH
Retention Time
pH vs Retention Time
Control Treatment
Linear (Control) Linear (Treatment)

40
5.2.4 Dissolved Oxygen Content
The YSI ProPlus multiparameter meter was used to measure dissolved oxygen content
(DOC). The data was collected in April 1st- May 27th. The data distributions are depicted in the
bar graph in figure 24. At the inlet position the dissolve oxygen content ranged from 59.1 % to
75.9 %. Both the heater and control positions had much lower dissolved oxygen content. This
result is expected as the dissolved oxygen is consumed during the denitrification process. The
treatment (heater) outlet position had a dissolved oxygen content range from 2.3 % saturation to
8.5% saturation. The control outlet positon had a dissolved oxygen content range from 3.4% to
31.2%
Figure 24. Dissolved oxygen content comparison by position
A nonparametric Kruskal Wallis statistical test was conducted to compare dissolved
oxygen levels in the Treatment (heated), Control, and Inlet structures. The Kruskal Wallis tests
0
10
20
30
40
50
60
70
80
4/1/2015 4/18/2015 4/24/2015 5/7/2015 5/21/2015
Dis
solv
ed O
xyge
n C
on
ten
t (%
)
Date
Dissolved Oxygen Content Comparison
Inlet Control Treatment

41
indicate statistical difference at alpha levels of 0.05, in dissolved oxygen content at the
structures, χ2 (2, N = 24) = 50.21, p = 0.00. Table 9 contains the rank data for each structure.
A post hoc Mann-Whitney U test with Bonferroni adjusted alpha levels of 0.016 was
conducted to provide full comparison of dissolved oxygen content in each structure. The results
of the Mann-Whitney analysis are outlined in table 10.
Table 9. Structure Rank Data
N Mean Rank Sum of Ranks
Treatment 24 19.40 465.50
Control 24 29.60 710.50
Inlet 24 60.5 1452
Table 10. Dissolved Oxygen Content Mann-Whitney Comparison Analysis
U Z Bonferroni Adjusted
α levels
Probability
Treatment-Control 165.5 -2.52 0.016 0.006
Treatment-Inlet 0 -5.93 0.016 0.00
Control-Inlet 0 -5.93 0.016 0.00
The Mann-Whitney analysis with Bonferroni adjusted alpha levels indicates the dissolved
oxygen content at the inlet structure (Mdn = 66.2) is statistically larger than dissolved oxygen
contents at both the treatment (heated) structure (Mdn = 4.2) and control structure (Mdn = 6.05).
This is expected because the microbial community of the bioreactors consume dissolved oxygen
throughout the denitrification process. The post hoc Mann Whitney analysis compared the
dissolved oxygen at the treatment (heated) and control structures. The results suggest the
dissolved oxygen content at the treatment (heated) outlet structure was statistically lower than at
the control outlet structure. This suggests the presence of heating elements in the treatment
bioreactors statistically increased dissolved oxygen consumption compared to the control
bioreactor.

42
This study also looked at dissolved oxygen content against retention time. Expected
results would expect dissolved oxygen content to decrease as retention time increases. This
studies results, shown in figure 25, do not follow this trend. The unexpected trend was caused by
temperature variation at the corresponding retention times. The longer retention times were
recorded during colder months when the biological activity in the bioreactor is least active. The
microbial community was not working as effectively in the cold temperatures and as a result the
dissolved oxygen content levels did not follow the expected trend.
Figure 25. Dissolved oxygen content plotted against retention time
0
2
4
6
8
10
12
0 5 10 15 20 25 30 35 40
Dis
solv
ed O
xyge
n P
erce
nta
ge
Retention Time (hrs)
Dissolve Oxygen Content
control treatment
Linear (control) Linear (treatment)

43
CHAPTER 6. DISCUSSION
6.1 Temperature Results
A goal of this study was to determine if heating resulted in a temperature increase of the
treatment bioreactor compared to the control bioreactor. The submerged portion (positions 1-3) of the
bioreactor is of most importance because this is where denitrification occurs. The average temperature
increase in the submerged portion of the bioreactor is 0.80 °C. Position 3 is located within the bioreactor
and is the last temperature sensor the bioreactor flow will pass as it exits the bioreactor. This position will
provide the most accurate representation of bioreactor temperature change due to the heating elements of
the investigation. At this position 3 the treatment bioreactor obtained a 2.13°C increase temperature
compared to the control bioreactor. Although this increase in temperature was statistically significant, it
is only of practical importance if there is a corresponding increase in nitrate removal rate. This
determination was an objective of this investigation, but unfortunately, this study was unable to determine
this relationship due to inaccurate nitrate results.
It is important to note a longitudinal increase at all temperature sensor positons as water in the bioreactor
moves from inlet to outlet. This longitudinal increase in temperature occurred in all positions. There was
a clear increase in longitudinal temperature from position 1(inlet) to 3 (outlet) and position 4 (inlet) to 6
(outlet). There was 0.00 °C increase of temperature at the inlet, an increase of 0.73 °C in the middle, and
a 2.13 °C temperature increase at the outlet in submerged portions of the bioreactors. The temperature
increase in the submerged portion is a result of increased interaction time with the underground heaters.
There was 6.54 °C increase of temperature at the inlet, an increase of 7.12 °C in the middle, and a 8.9 °C
temperature increase at the outlet in unsubmerged portions of the bioreactors The increase in the
unsubmerged portions is a result of heat conduction from the warmed drainage flow to the pore space
above at positions 4-6 and the heating effect of the solar greenhouse.

44
6.2 Nitrate Results
The experimental setup hypothesized two potential outcomes. Either the active and passive
heating would affect nitrate reduction rates, or there would be no difference between the two test
bioreactors. If no treatment effect is present, then the additional heat did not affect nitrate levels, and the
trends would be similar to the graph entitled “Expected Outcome-No Treatment Effect” depicted in figure
26. The treatment and control nitrate levels are both lower than the inlet concentration and the treatment
and control N-concentrations and are not significantly different. In this outcome nitrate concentration
decreases (at the same rate) in the treatment and control bioreactors as the retention time increases. This
result indicates the bioreactors are working properly and breaking down nitrate (NO3-) into atmospheric
nitrogen (N2). The result suggests the presence of active and passive heating does not affect the
denitrification process within bioreactors.
If a treatment effect did occur then the result would follow the trend in the graph entitled
“Expected outcome-treatment effect” depicted in figure 26. The scientific proof behind this investigation
is that denitrification increases with higher temperatures. In theory if temperature increases in the
treatment bioreactor than the nitrate reduction rates of this bioreactor should also increase. In this
outcome the nitrate concentration of both the treatment and control bioreactors decreases as retention time
increases; however the treatment bioreactor exhibits increased reduction rates compared to the control
bioreactor.

45
Figure 26. Plots for expected nitrate concentration trends by retention times. This plots illustrate
the potential outcomes with plot A depicting no treatment effect and plot B depicting a treatment
effect.
The data obtained in this study did not align with either of these two expected results. Nitrate
levels at the treatment and control outlets often exceed nitrate levels at the inlet position. It was
determined that an error in sampling technique affected the validity of the nitrate analysis. The inlet
nitrate samples are inaccurate and do not represent the nitrate level at this position. Without accurate inlet
nitrate data it is impossible to determine nitrate reduction and makes bioreactor comparisons.
The error in the nitrate levels at the inlet position was due to the location of sampling in the inlet
structure. Grab samples were collected by skimming the surface of the water in the inlet structure, but the
surface nitrate levels are not representative of the nitrate levels of the drainage water entering the
treatment and control bioreactors. It is theorized that the inlet structure experienced stratification of the
nitrate levels based on water depth. Future studies must collect water samples by pumping grab samples
from the bottom of the inlet control structure to ensure accurate nitrate data.
Personal conversation with Lowell Gentry in the department of Natural Resources and Environmental
Sciences gave insight on the nitrate data as he experienced similar trouble with this sampling technique.

46
He determined that chloride did not stratify that same as nitrate and used a ratio of inlet chloride and
outlet chloride levels to determine accurate nitrate levels.
𝑁𝑖𝑡𝑟𝑎𝑡𝑒 𝐼𝑛−𝐴𝑐𝑡𝑢𝑎𝑙 = 𝑁𝑖𝑡𝑟𝑎𝑡𝑒𝑆𝑢𝑟𝑓𝑎𝑐𝑒 × 𝐶ℎ𝑙𝑜𝑟𝑖𝑑𝑒𝑜𝑢𝑡𝑙𝑒𝑡
𝐶ℎ𝑙𝑜𝑟𝑖𝑑𝑒𝐼𝑛𝑙𝑒𝑡
This technique was applied to the data obtained from Mar 7, 2015 – May 27, 2015 during this
investigation. These samples were specifically chosen for having outlet nitrate levels exceed inlet nitrate
levels. Unfortunately, the results are still inconclusive. The results of this analysis are outlined in figure
27. The chloride adjusted nitrate results still indicated negative nitrate reduction in both the treatment and
control bioreactors.
Figure 27. Chloride adjusted nitrate reduction
6.3 Heating Costs
The heated bioreactor built in this investigation requires high upfront capital to create the
solar array. Table 11 contains a price break down of the individual components used to create the
-2
-1.5
-1
-0.5
0
0.5
1
3/7/2015 3/17/20153/27/2015 4/6/2015 4/16/20154/26/2015 5/6/2015 5/16/20155/26/2015
Nit
rate
Red
uct
ion
Per
cen
t
Date
Chloride Adjusted Nitrate Reduction
Inlet Treatment Control

47
solar array. The total off-grid solar and heating system cost $4,558.70 dollars to install. The cost
to increase temperature one degree centigrade per unit area was calculated. Overall, this
investigation found it cost $156/1°C/m3. It required $156 to create a 1 degree centigrade increase
to 1 cubic meter of bioreactor. Future research needs to concentrate on findings ways to lower
this value and find cheaper ways to increase bioreactor temperature.
Table 11. Solar systems components costs
Item Cost
1000 watts solar array (panels, controller, connections)
$ 2,130.00
Batteries (2-12 Volt 4D batteries)
$ 260.00
Inverter $ 1,000.00
ThermoTile Heaters $ 1,168.70
Total $ 4,558.70
6.4 Design Flaws/Considerations
This investigation was the first attempt at a paired denitrifying bioreactor experimental design.
The paired system concept allows for treatment and control investigations. If this design can be perfected
then it will be applied more often in bioreactor research because of its benefits. The design ensures the
only difference between the two bioreactors is the treatment and can be used for all comparison
investigations. This study was the first iteration of paired bioreactor approach and there are several
considerations that must be addressed in future designs.
The first flaw in this study that must be mentioned is the improper sampling technique used to
collect nitrate data at the inlet position. As mention earlier nitrate stratification occurred in the inlet water
control structure. Samples were taken from the water surface and are not representative of the water
entering the treatment and control bioreactors. The sample must be taken from the bottom of inlet
structure to obtain accurate nitrate results. Future designs must be aware of this problem and either
sample accordingly or completely reconfigure the system.
48
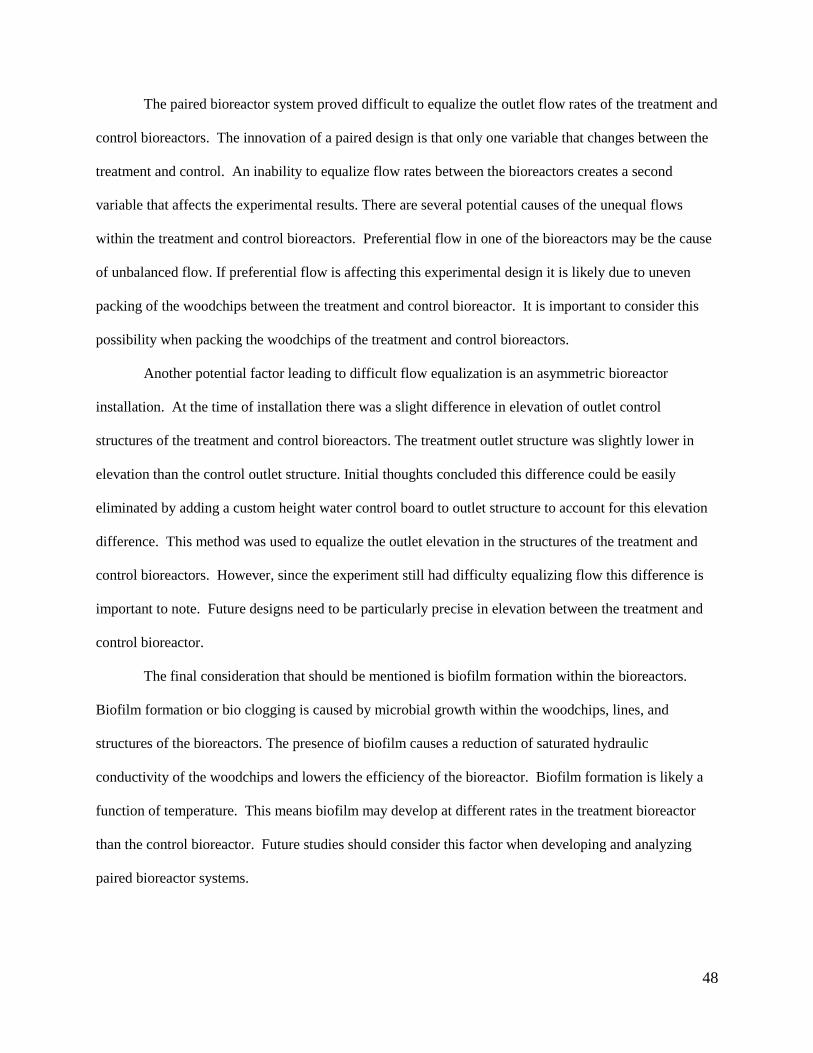
The paired bioreactor system proved difficult to equalize the outlet flow rates of the treatment and
control bioreactors. The innovation of a paired design is that only one variable that changes between the
treatment and control. An inability to equalize flow rates between the bioreactors creates a second
variable that affects the experimental results. There are several potential causes of the unequal flows
within the treatment and control bioreactors. Preferential flow in one of the bioreactors may be the cause
of unbalanced flow. If preferential flow is affecting this experimental design it is likely due to uneven
packing of the woodchips between the treatment and control bioreactor. It is important to consider this
possibility when packing the woodchips of the treatment and control bioreactors.
Another potential factor leading to difficult flow equalization is an asymmetric bioreactor
installation. At the time of installation there was a slight difference in elevation of outlet control
structures of the treatment and control bioreactors. The treatment outlet structure was slightly lower in
elevation than the control outlet structure. Initial thoughts concluded this difference could be easily
eliminated by adding a custom height water control board to outlet structure to account for this elevation
difference. This method was used to equalize the outlet elevation in the structures of the treatment and
control bioreactors. However, since the experiment still had difficulty equalizing flow this difference is
important to note. Future designs need to be particularly precise in elevation between the treatment and
control bioreactor.
The final consideration that should be mentioned is biofilm formation within the bioreactors.
Biofilm formation or bio clogging is caused by microbial growth within the woodchips, lines, and
structures of the bioreactors. The presence of biofilm causes a reduction of saturated hydraulic
conductivity of the woodchips and lowers the efficiency of the bioreactor. Biofilm formation is likely a
function of temperature. This means biofilm may develop at different rates in the treatment bioreactor
than the control bioreactor. Future studies should consider this factor when developing and analyzing
paired bioreactor systems.

49
6.5 Future of Heated Bioreactor Research
Future heated bioreactor studies will need to continue to build on the foundation this study
provided. Future heated bioreactor study need to create a representative relationship between heated
bioreactors and nitrate reduction.
Future research should attempt to determine a more efficient mode of heating. The design in this
investigation relied on solar panels power underground heaters. This design has high capital costs and
found only small (<2°C) increase in drainage water exiting the bioreactor. There is potential for more
efficient heating inputs that result in larger temperature increases. One proposed solution is to pump the
tile water through a solar passive heater prior to entering the denitrifying bioreactor. This is a potential
design to produce a larger heating effect with lower energy inputs.

50
CHAPTER 7. SUMMARY
In the Midwestern United States, farmer’s pursuit of highly efficient agricultural
systems has resulted in higher yields, higher profits, and greater food production. The
implementation of subsurface drainage systems and the use of fertilizers are two strategies
employed by the farmers to increase the productivity of their land. Although these strategies
have resulted in greater production, there are negative environmental impacts associated with the
combination of subsurface drainage and fertilizer usage. Fertilizer use and subsurface drainage
have been linked to the degrading water quality of the Midwestern US and the hypoxic zone in
the Gulf of Mexico. Subsurface drainage promotes nutrient runoff providing excess fertilizers a
conduit leading directly to water bodies. The influx of nutrients into these water bodies cause
lasting environmental damage. Nutrient rich waters lead to eutrophication and algal blooms,
which diminish water quality and cause harmful ecological conditions. In the Gulf of Mexico
eutrophication and algal blooms have caused shifts in water quality, affecting the dissolved
oxygen content of the water creating hypoxic conditions. Marine life is unable to survive the
toxic environment of the hypoxic zone and either flees the area or succumb to the oxygen
deprivation. The influx of nutrients challenge the scientific community to develop innovative
solutions to resolve this issue. Denitrifying bioreactors are one of the management practices
used to reduce nitrate pollution from land with subsurface drainage. Denitrifying bioreactors
provide the necessary energy source to allow the microbial community to convert harmful nitrate
(NO3-) into atmospheric nitrogen (N2). Bioreactors are a proven nitrate reduction technology and
continued research is necessary to create more efficient designs.
This study developed a paired bioreactor system to allow for a comparison study
evaluating the effects of a heating systems on nitrate reduction. The treatment bioreactor was

51
equipped with both passive and active heating systems in attempt to raise bioreactor bed
temperature. The passive heating source was solar greenhouse built of a wooden frame and a
combination of clear and black polyethylene plastic. The active heating source was underground
electric heaters powered by an off-grid solar array installed at the research site. Both the
treatment and control bioreactors were instrumented for flow rate and temperature. These data
were measured on 30 minute intervals for the entirety of the investigation. Grab samples of
bioreactor influent and effluent flow were collected on weekly intervals and analyzed for nitrate,
pH, and dissolved oxygen content.
The temperature was analyzed for both the submerged and unsubmerged portions of the
bioreactors. The submerged portion of the bioreactor had an average increase of 0.80 °C and the
unsubmerged portion of the bioreactor had an average temperature increase of 7.53 °C. Since
denitrification occurs is the submerged portion of the bioreactors, the change of temperature at
these positons are most important in determining the effectiveness of the heating system. The
submerged temperature increased longitudinally within the bioreactor as the water moved from
inlet to outlet. There was no increase of temperature at the inlet, an increase of 0.73 °C in the
middle, and a 2.13 °C temperature increase at the outlet in submerged portions of the bioreactors.
This is a result of an increased interaction time with the heaters as the flow moves horizontal
through the bioreactor and definitively proves the heating system had a warmer effect. In order to
determine if this increase in temperature is practically significant there needs to be a
corresponding increase in nitrate reduction with the increase in temperature.
An error in sampling technique caused inaccurate nitrate data and as a result nitrate
reduction was unable to be calculated in this investigation. Nitrate samples were collected from
the surface level of the water within the inlet AgriDrain™ structure, however samples taken from

52
this position are not indicative of the true nitrate levels entering both the treatment and control
bioreactors. Nitrate levels stratified with depth in the inlet AgriDrain™ structure and to obtain
precise nitrate data samples must be pumped from the bottom of the AgriDrain™ structure.
Future studies must be aware of this issue and sample accordingly to ensure data validity.
Data for pH and dissolved oxygen content were unaffected by the sampling technique
and accurately analyzed. Throughout this investigation the pH ranged from 6.51-6.98 and
always remained within the USEPA water quality critical pH range from 6.5 to 9. Statistical
analysis determined the pH was lower at the outlet of the treatment bioreactor than both the inlet
and control bioreactor outlet. This result suggests the increase of temperature in the treatment
bioreactor effectively lowers the outlet pH levels. Future heated bioreactor studies should be
aware of this result and continue to monitor pH to ensure pH remains within the USEPA water
quality critical range. Dissolved oxygen was an order of magnitude greater at the inlet than both
the treatment and control outlets. This results indicates functional bioreactors as dissolved
oxygen is consumed throughout the denitrification process. The treatment bioreactor outlet had
statistically lower dissolved oxygen levels than the control bioreactor outlet. This result suggests
the treatment bioreactor performed more efficiently than the control bioreactor. This results is
limited and does not prove increased efficiency. The metric should be determined by nitrate
reduction and not dissolved oxygen content.
Bioreactors are a proven technology to remove nitrate from drainage flow, and this stud
was a step forward for bioreactor research. The study proved it is possible to increase internal
bioreactor temperatures through passive and active heating. Unfortunately, this investigation
was unable to determine the effects of temperature change on nitrate reduction. Future research
needs to quantify the effect on temperature change on nitrate reduction in a paired bioreactor

53
system. Future paired bioreactor research should aim to develop new, low-cost heating systems
to create new, cost effective, highly functional bioreactor designs.

54
REFERENCES
Aber, J., E. Boyer, M. Castro, C. Cronan, C. T. Driscoll, C. L. Goodale, P. Groffman, C. Hopkinson, K. Lambert, G.
Lawrence, S. Ollinger and D. Whitall. 2003. Nitrogen pollution in the northeastern United States: sources, effects,
and management options. (Articles). Bioscience 53357+.
Adeuya, R., N. Utt, J. Frankenberger, L. Bowling, E. Kladivko, S. Brouder and B. Carter. 2012. Impacts of drainage
water management on subsurface drain flow, nitrate concentration, and nitrate loads in Indiana. Journal of Soil &
Water Conservation 67(6): 474-484.
Alexander, R. B., R. A. Smith, G. E. Schwarz, E. W. Boyer, J. V. Nolan and J. W. Brakebill. 2008. Differences in
phosphorus and nitrogen delivery to the gulf of Mexico from the Mississippi river basin. Environmental science &
technology 42(3): 822-830.
Bell, N. 2013. Characterizing Transient and Seasonal Responses of Bioreactors for Subsurface Drains. Master's
thesis, Department of Agricultural and Biological Engineering at the University of Illinois.
Blowes, D. W., W. D. Robertson, C. J. Ptacek and C. Merkley. 1994. Removal of agricultural nitrate from tile-
drainage effluent water using in-line bioreactors. Journal of contaminant hydrology 15(3): 207-221.
Boyer, E., R. Howarth, J. Galloway, F. Dentener, P. Green and C. Vorosmarty. 2006. Riverine nitrogen export from
the continents to the coasts. Global Biogeochemical Cycles 20(1): GB1S91.
Cameron, S. G. and L. A. Schipper. 2010. Nitrate removal and hydraulic performance of organic carbon for use in
denitrification beds. Ecological Engineering 36(11): 1588-1595.
Cameron, S. G. and L. A. Schipper. 2011. Evaluation of passive solar heating and alternative flow regimes on nitrate
removal in denitrification beds. Ecological Engineering 37(8): 1195-1204.
Christianson, L. E., J. A. Hanly and M. J. Hedley. 2011. Optimized denitrification bioreactor treatment through
simulated drainage containment. Agricultural Water Management 99(1): 85-92.
Chun, J. A., R. A. Cooke, J. W. Eheart and M. S. Kang. 2009. Estimation of flow and transport parameters for
woodchip-based bioreactors: I. laboratory-scale bioreactor. Biosystems Engineering 104(3): 384-395.
Cooke, R. and S. Verma. 2012. Performance of drainage water management systems in Illinois, United
States. Journal of Soil & Water Conservation 67(6): 453-464.
David, M. B., L. E. Drinkwater and G. F. Mclsaac. 2010. Sources of Nitrate Yields in the Mississippi River
Basin. Journal of environmental quality 39(5): 1657-1667.
Galloway, JN. Leach, AM. Bleeker, A. Erisman, JW. 2013. A chronology of human understanding of the nitrogen
cycle. . Philosophical Transactions of the Royal Society of Biological Sciences.
Galloway, J. N., J. D. Aber, J. W. Erisman, S. P. Seitzinger, R. W. Howarth, E. B. Cowling and B. J. Cosby. 2003.
The Nitrogen Cascade. Bioscience 53(4): 341.
Galloway, J. N., J. D. Aber, J. W. Erisman, S. P. Seitzinger, R. W. Howarth, E. B. Cowling and B. J. Cosby. 2003.
The Nitrogen Cascade. Bioscience 53(4): 341.

55
Gruyer, N., M. Dorais, B. W. Alsanius and G. J. Zagury. 2013. Simultaneous Removal of Nitrate and Sulfate from
Greenhouse Wastewater by Constructed Wetlands. Journal of environmental quality 42(4): 1256-1266.
Healy, M. G., T. G. Ibrahim, G. J. Lanigan, A. J. Serrenho and O. Fenton. 2012. Nitrate removal rate, efficiency and
pollution swapping potential of different organic carbon media in laboratory denitrification bioreactors. Ecological
Engineering 40(0): 198-209.
Heinen, M. 2006. Simplified denitrification models: Overview and properties. Geoderma 133(3–4): 444-463.
Illinois Nutrient Reduction Strategy. Rep. Illinois EPA, 31 Aug. 2015. Web. 23 Nov. 2015.
Jaynes, D. B., T. C. Kaspar, T. B. Moorman and T. B. Parkin. 2008. In situ bioreactors and deep drain-pipe
installation to reduce nitrate losses in artificially drained fields. Journal of environmental quality 37(2): 429-436.
Kalita, P. K., R. A. C. Cooke, S. M. Anderson, M. C. Hirschi and J. K. Mitchell. 2007. Subsurface Drainage and
Water Quality: the Illinois Experience. Transactions of the ASABE 50(5): 1651-1656.
Mitsch, W. J., J. Day John W., J. W. Gilliam, P. M. Groffman, D. L. Hey, G. W. Randall and N. Wang. 2001.
Reducing Nitrogen Loading to the Gulf of Mexico from the Mississippi River Basin: Strategies to Counter a
Persistent Ecological Problem. Bioscience 51(5): 373.
Petrolia, D. R. and P. H. Gowda. 2006. Missing the Boat: Midwest Farm Drainage and Gulf of Mexico
Hypoxia. Review of Agricultural Economics 28(2): 240-253.
Poe, A., M. Piehler, S. Thompson and H. Paerl. 2003. Denitrification in a constructed wetland receiving agricultural
runoff. Wetlands 23(4): 817-826.
Poole, C. A., R. W. Skaggs, G. M. Cheschier, M. A. Youssef and C. R. Crozier. 2013. Effects of drainage water
management on crop yields in North Carolina. Journal of Soil and Water Conservation 68(6): 429-437.
Ribaudo, M. O., R. Heimlich and M. Peters. 2005. Nitrogen sources and Gulf hypoxia: potential for environmental
credit trading. Ecological Economics 52(2): 159-168.
Schipper, L. A., W. D. Robertson, A. J. Gold, D. B. Jaynes and S. C. Cameron. 2010. Denitrifying bioreactors-An
approach for reducing nitrate loads to receiving waters.Ecological Engineering 36(11): 1532-1543.
Sheskin, D. J. (2007). Handbook of parametric and nonparametric statistical procedures 4 (Third Edition ed.)
Chapman & Hall
Skaggs, R., M. Breve and J. Gilliam. 1994. Hydrologic and Water-Quality Impacts of Agricultural
Drainage. Critical Reviews in Environmental Science and Technology 24(1): 1-32.
Stanford, G., S. Dzeinia and R. Vander Pol. 1975. Effect of Temperature on Denitrification Rate in Soils. Soil Sci.
Soc. Am. J. 39867-870.
USEPA (2014). National recommended water quality criteria.
http://water.epa.gov/scitech/swguidance/standards/criteria/current/index.cfm/. Accessed 24-July-2015
Warneke, S., L. A. Schipper, D. A. Bruesewitz, I. McDonald and S. Cameron. 2011. Rates, controls and potential
adverse effects of nitrate removal in a denitrification bed. Ecological Engineering 37(3): 511-522.

56
Warneke, S., L. A. Schipper, M. G. Matiasek, K. M. Scow, S. Cameron, D. A. Bruesewitz and I. R. McDonald.
2011. Nitrate removal, communities of denitrifiers and adverse effects in different carbon substrates for use in
denitrification beds. Water research 45(17): 5463-5475.
Winiwarter, W., J. Erisman, J. Galloway, Z. Klimont and M. Sutton. 2013. Estimating environmentally relevant
fixed nitrogen demand in the 21st century. Climatic Change 120(4): 889-901.
Woli, K. P., M. B. David, R. A. Cooke, G. F. McIsaac and C. A. Mitchell. 2010. Nitrogen balance in and export
from agricultural fields associated with controlled drainage systems and denitrifying bioreactors. Ecological
Engineering 36(11): 1558-1566.