Pyrolysis Kinetics and Chemical Structure Considerations of a
Upload
duongquynhCategory
view
222download
0
Effect of Particle Size on Pyrolysis Kinetics of Forest Fuels in Nitrogen
HUICHANG NIU, NAIAN LIU State Key Laboratory of Fire Science, University of Science and Technology of China Hefei, Anhui 230026, P. R. China
ABSTRACT
Pyrolysis of forest combustibles is an elementary process in the ignition and spread of forest fires, and particle size is an important parameter which affects the pyrolysis kinetics. In this work, samples of pine needle (PN), pine branch (PBr) and pine bark (PB) were subject to thermogravimetric experiments, in order to examine the effect of particle size on pyrolysis characteristics. For all the samples, one peak and two shoulders are observed in all of the mass loss curves, at different positions for different levels of particle size. The observation of the mass loss curves and the analysis of peak temperatures by Kissinger method indicated that the major mass loss steps in different heating rates have consistent pyrolysis kinetics. For all the samples, the particle size has no obvious effect on the temperatures of the major peaks. Basically, the peak mass loss rate increases with increasing particle size for smaller particles, however the increased temperature gradient inside the sample may have a remarkable suppression on the mass loss rate when the particle size exceeds a certain level. The mass loss rates for the two shoulders show complex variations for different samples and particle sizes, which reflects the difference in chemical components. A kinetic model which includes three pseudo components was used to simulate the pyrolysis for different dimensions, and the obtained kinetic parameters were compared and discussed in details. By industrial analysis the products of ashes for different particle sizes were compared, and especially it was implied that to some extent the activation energy and ash content involve negative correlation.
KEYWORDS: wildfires, forest fuels, particle size, pyrolysis
NOMENCLATURE LISTING
A frequency factor (1/s) β heating rate (oC/min) c proportion of component Subscripts corr correlation coefficient i number of components E activation energy (kJ/mol) j number of experimental curves ( )f α mechanism function k number of data points
m sample mass (mg) p peak n reaction order 0 initial value S standard deviation ∞ final value T absolute temperature (K) Superscripts T0 ambient temperature (K) calc value of calculation Greek simu value of simulation α conversion
INTRODUCTION
Pyrolysis, as the initial stage of the ignition of forest combustibles, plays an important role in the initiation and spread of forest fires. Pyrolysis kinetics depends on many parameters, for which particle size is an important parameter which affects both the kinetic regime and the relevant kinetic parameters. Previous researches [1, 2] indicated that the rate of pyrolysis is dominated by heat transfer (physical effect) for larger particles, and is controlled by chemical kinetics (chemical effect) for smaller particles. For the regime of kinetics controlled, the temperature gradient can usually be ignored, however, particles of different dimensions may still have distinct pyrolysis characteristics, due to the variation of chemical components and the actually existed temperature gradients under different particle sizes. Although there have been a large number of reports [3-8] concerning the pyrolysis characteristics of different forest species, the effect of particle size is scarcely touched. A few elementary researches [9-11] examined the variation of chemical components of solid fuels due to the grinding and sieving of particles. Kinetics research of olive solid waste indicated that the activation energy of the devolatilization step decreases with increasing particle size [10,
FIRE SAFETY SCIENCE-PROCEEDINGS OF THE ELEVENTH INTERNATIONAL SYMPOSIUM pp. 1393-1405 COPYRIGHT © 2014 INTERNATIONAL ASSOCIATION FOR FIRE SAFETY SCIENCE/ DOI: 10.3801/IAFSS.FSS.11-1393
1393

12]. Also the influence of particle size on the chemical components of two energy crops was studied [13], and the results revealed that the amounts of cellulose and lignin decomposition products were higher for larger particle sizes. The variation of chemical components of crops and lignite particles due to the reducing of particle sizes was also suggested in Ref. [11]. More volatiles and fixed carbon are prone to be concentrated in large particles while there are more inorganic contents for small particles.
Surface fires are mainly caused by the ignition and combustion of forest combustibles on the ground, including needles, branches, barks and other fuels fallen from trees. In addition, leaves and branches contribute a lot to crown fires. In the developed fire propagation and ignition models, very simple reaction models (e.g. a first-order, single-step reaction model) are usually used to describe the thermal degradation kinetics. The pyrolysis research is able to provide more reliable chemical descriptions for the complex thermal decomposition process of solid fuels. In the present work, we performed pyrolysis experiments by using samples of pine needle, pine branch and pine bark, with different particle sizes, to examine the effect of particle size on the pyrolysis kinetics of forest fuels.
EXPERIMENTAL
Materials
Materials used in this work were pine needle (PN), pine branch (PBr), pine bark (PB) of Pinus Sylvestris collected in the Great Khingan, northeast of China. The samples were collected from living trees to prevent from being polluted or mixed with impurities. Untreated Pine branches were about 8 mm in diameter, which was indicative of typical pine branches consumed in forest fires. Before tests, the samples were kept in a blast-type electric oven for 48 hours, with a constant temperature of 85oC. A mill (brand: RRHP-100) was used for grinding of materials. Dimensions of particles can be controlled by operation time. Generally 2 minutes' grinding produces well distributed particles. After grinding, sieves were used to classify the particles of different dimensions into 7 groups, the smallest being under 75 µm and the largest being from 1.0-1.5 mm. The sample powders were kept in glass bottles to keep the moisture. The classification of particles was listed in Table 1.
Table 1. Dimension classification of three forest fuels.
Samples Classification PN 75µm-;75-150µm;150-300µm;300-450µm;450µm+ PBr 75µm-;75-150µm;150-300µm;300-450µm;450-800µm;0.8-1.0mm;1.0-1.5mm PB 75µm-;75-150µm;150-300µm;300-450µm;450-800µm;0.8-1.0mm;1.0-1.5mm
Proximate Analysis of Samples
Proximate analysis of samples was conducted using a thermogravimetric analyzer [14], by three sequential steps of drying, devolatilization in nitrogen, and oxidation in air. The samples were evenly distributed over the sample pan with the initial mass kept to be 10±0.5 mg, and were then subject to a temperature program. First, the samples were kept in nitrogen (50 ml/min), under 25oC isothermally for 4 minutes. Then, the samples were heated at 50oC/min until 110oC, isothermally for 10 minutes. The mass loss during this stage was due to water evaporation. Followed was the devolatilization step at a heating rate of 50oC/min up to 900oC, isothermally for 5 minutes. Finally, air was introduced and held for 7 minutes until the completion of oxidation.
Pyrolysis Experiments
Pyrolysis experiments were performed with a STA 449F3 thermogravimetric analyzer. A sample mass of 8±0.5 mg was used in each test. Samples were heated from room temperature to 800oC, in different heating rates within 2~50oC/min. The tests were conducted in an inert (nitrogen) atmosphere with a flow rate of 20 ml/min. The thermogravimetric (TG) and derivative thermogravimetric (DTG) data were obtained.
Pyrolysis Kinetics
The kinetics of a single step decomposition reaction of heterogeneous condensed-phase materials is usually described by the following equation[15]
FIRE SAFETY SCIENCE-PROCEEDINGS OF THE ELEVENTH INTERNATIONAL SYMPOSIUM pp. 1393-1405 COPYRIGHT © 2014 INTERNATIONAL ASSOCIATION FOR FIRE SAFETY SCIENCE/ DOI: 10.3801/IAFSS.FSS.11-1393
1394
( )exp( )
d EA fdt RT tα
α⎛ ⎞
= −⎜ ⎟⎝ ⎠
(1)
where α is the degree of conversion, also called reaction fraction; t the time, T the temperature, E the activation energy, A the frequency factor, R the gas constant and ( )f α the reaction mechanism function,
which has different expressions according to reaction mechanisms. E, A and ( )f α are called kinetic triplet,
which determines a unique kinetic equation. The reaction fraction α is defined by
0 0( ) / ( )m m m mα ∞= − − (2)
where m is the sample mass recorded by the TG analyzer, m0 the initial and m∞ the final mass of sample.
Multi-component models consisting of competitive, parallel or consecutive reactions are generally used for kinetic analysis of complex reactions. Based on the assumption of Shafizad and Mcginnis [16], a reaction model consisting of three independent first-order reactions was used to investigate the thermal degradation of cellulose, hemicellulose and lignin under nitrogen and air [17]. A reformulated three-step parallel reaction model was used to simulate the pyrolysis of waste-wood samples [3], with satisfactory results obtained. The thermal degradation of forest peat under nitrogen was studied with four parallel reactions including evaporation of moisture [18]. In the present work, a multi-component model is also used to simulate the decomposition of forest combustibles, for which the overall conversion rate of samples in nitrogen is described by sum of the conversion rates of three pseudo reactions:
3i
ii
dd cdT dT
αα=∑ (3)
where ic is the proportion of pseudo component i and 1iic =∑ .
The mass loss rate can then be expressed as 3
0( ) ii
i
ddm m m cdT dT
α∞= − − ∑ (4)
First order reactions are assumed for three pseudo components. By using the experimental data, the kinetic parameters for the three reactions were evaluated by minimizing the DTGS coefficient which is defined as
2( / ) ( / )exp simuDTG j
j j kS S dm dT dm dT⎡ ⎤= = −⎣ ⎦∑ ∑∑ (5)
where the superscripts "exp" and "simu" denote the experimental and simulated values. The index "j" is the number of experimental curves and "k" the number of data points of each experimental curve. The minimization of DTGS was carried out by the Levenberg-Marquardt non-linear fitting algorithm. We use the DTG rather than TG data for data fitting because generally the DTG data is more powerful to identify poorly or well-fitting models, and also it is more suitable to distinguish the model which is able to fit the multi-peaks and other details of the experimental data. The correlation coefficient, corr, is used to evaluate the fitness between the experimental and calculated data.
RESULTS AND DISCUSSION
Effect of Heating Rate
Figure 1 shows the mass loss curves of PN powders of size <75µm in nitrogen, for five heating rates of 2, 5, 10, 20, and 30oC/min. The data for water evaporation is removed. As seen, for all the data the thermal decomposition mainly happens in the temperature range of 150-500oC, reaching a mass loss fraction of nearly 74%. Basically, due to the thermal lag effect, the initiation region of pyrolysis moves to higher temperatures with the increase of heating rate. Thermal lag effect is due to the small heat conductivity property and thus induced temperature gradients between the inner and surroundings of biomass particles.
FIRE SAFETY SCIENCE-PROCEEDINGS OF THE ELEVENTH INTERNATIONAL SYMPOSIUM pp. 1393-1405 COPYRIGHT © 2014 INTERNATIONAL ASSOCIATION FOR FIRE SAFETY SCIENCE/ DOI: 10.3801/IAFSS.FSS.11-1393
1395

Since the percent of residue varied under different heating rates, we calculate the conversion fraction by Eq.2, as shown in Fig. 2. As seen, the curve under the heating rate of 2oC/min shows a slightly different variation mode in higher temperatures as compared to others, however all the curves involve consistent variation modes in the temperature region corresponding to the major mass losses. Since under the heating rate of 2oC/min there will be a minimum temperature gradient inside the samples, the mass loss can thus be regarded to be dominated by the chemical kinetics.
100 200 300 400 500 600 700 800-‐90
-‐75
-‐60
-‐45
-‐30
-‐15
0Mas
s loss
(%)
T empera ture (oC )
2oC /min 5oC /min 10oC /min 20oC /min 30oC /min
Fig. 1. Mass loss curves of PN particles under different heating rates (nitrogen, particle size<75µm).
100 200 300 400 500 600 700 800
0.0
0.2
0.4
0.6
0.8
1.0
Con
version
T empera ture (oC )
2oC /min 5oC /min 10oC /min 20oC /min 30oC /min
Fig. 2. Conversion curves of PN particles under different heating rates (nitrogen, particle size < 75µm).
Figure 3 shows the DTG curves of PN powders under five different heating rates. The peak value under 30oC/min is 17.4%/min, which is much higher than the peak value of 1.2%/min under 2oC/min, indicating that the PN particles decompose much faster under higher heating rates. Meanwhile, the peak temperature increases with the increase of heating rate, which is consistent with the observation in literature [5]. Linear extrapolation was usually used to predict the peak temperatures at higher heating rates by using the data at lower heating rates. However, this method has no theoretical basis and often results in non-ignorable errors. In this work we used the Kissinger method [19] to correlate the peak temperatures with heating rates. For
FIRE SAFETY SCIENCE-PROCEEDINGS OF THE ELEVENTH INTERNATIONAL SYMPOSIUM pp. 1393-1405 COPYRIGHT © 2014 INTERNATIONAL ASSOCIATION FOR FIRE SAFETY SCIENCE/ DOI: 10.3801/IAFSS.FSS.11-1393
1396

this method, by assuming an n-th order reaction, and also by assuming that 1(1 )npn α −− is of almost unity independent on the heating rate, the following equation is derived:
2( / ) exp( / )p pAR E T E RTβ = − (6)
For different heating rates, several pairs of data, β1, Tp1, β2, Tp2, …, βm, Tpm, can be used to evaluate the kinetic parameters of A and E, and then the peak temperature Tp can be predicted for any given β.
100 200 300 400 500 600 700 800
0
4
8
12
16
20
316.42 oC328.21 oC
340.41 oC
350.11 oC
354.71 oC
Mas
s loss
rate (%
/min)
T empera ture (oC )
2oC /min 5oC /min 10oC /min 20oC /min 30oC /min
Fig. 3. DTG curves of PN particles under different heating rates (nitrogen, particle size < 75 µm).
0 10 20 30 40 50 60
300
315
330
345
360
375Correlation coefficient:0.9977
Predicted peak temperature by Kissinger methodExperimental data
Pea
k te
mpe
ratu
re (o C
)
Heating rate (oC/min)
Fig. 4. Simulation of peak temperatures and heating rates.
As seen in Fig. 4, five pairs of data under 2, 5, 10, 20 and 30oC/min were used for data fitting and another pair of data under 50oC/min was used for comparison. Nonlinear regression was used to obtain the kinetic parameters by Kissinger method, and then the kinetic parameters were used to obtain the predicted curve of peak temperature versus heating rate, as shown in Fig. 4. It is obvious that the predicted peak temperatures fit well with the experimental data for different heating rates. Especially the predicted peak temperature under 50oC/min differs little from the experimental data. Since the formulation of Kissinger method is
FIRE SAFETY SCIENCE-PROCEEDINGS OF THE ELEVENTH INTERNATIONAL SYMPOSIUM pp. 1393-1405 COPYRIGHT © 2014 INTERNATIONAL ASSOCIATION FOR FIRE SAFETY SCIENCE/ DOI: 10.3801/IAFSS.FSS.11-1393
1397
derived by assuming a single step reaction, the results imply that although generally the pyrolysis of forest fuel is considered to consist of multiple steps, the peaks in different heating rates fall into one major reaction step, with little overlap with other secondary reaction steps. This also implies that the data shown in Fig. 3 in different heating rates have consistent pyrolysis kinetics for their major mass losses.
Effect of Particle Size
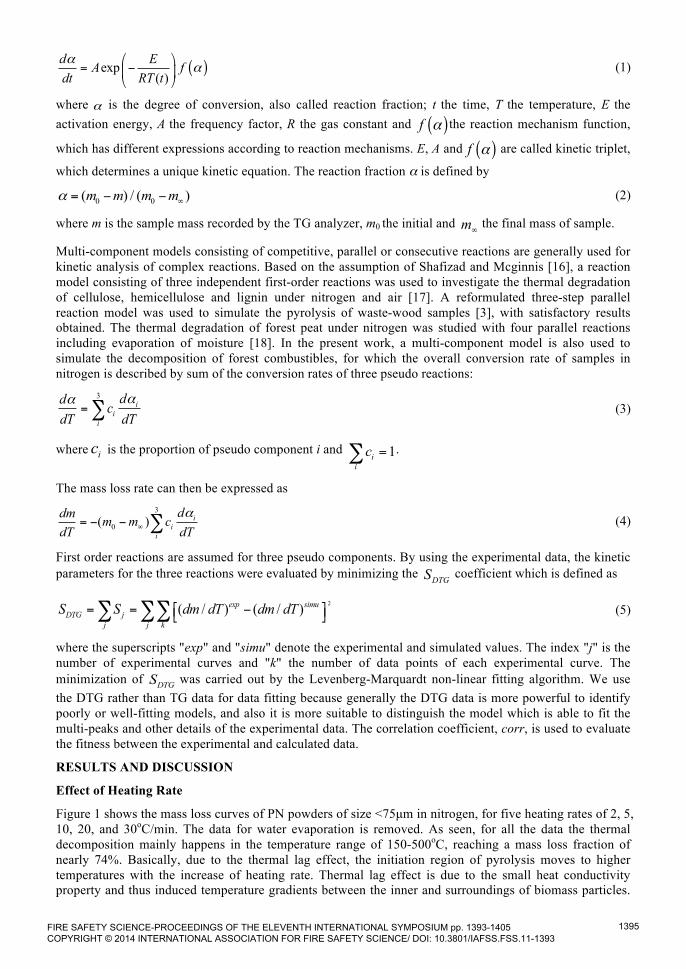
Figure 5 shows the DTG curves of fuel samples (PN, PBr, PB) under the heating rate of 2oC/min. Particles of different dimensions were tested under the same conditions. One peak and two shoulders are observed in all of the curves, at different positions for different levels of particle size. For the three types of samples, the temperatures of the major peaks appeared within 250~350oC. Each type of sample has nearly the same peak temperatures for different particle sizes. The first shoulder is recorded within 240~290oC, mainly corresponding to the decomposition of hemicellulose [1], while the second, especially obvious for PB particles, occurs around 400oC, which is possibly related to the decomposition of lignin.
The particle size has obvious influence on the mass loss rate. Figure 5a and Figure 5b show that with increasing particle size, the mass loss rates at the peak temperatures increase correspondingly, which is considered to be kinetically controlled. However, Fig. 5c shows that for particle sizes increasing from 75 µm until 1500 µm, the peak mass loss rate first increases versus particle size until the level of 150-300 µm, and then decreases. This suggests that the increased temperature gradient in the sample has remarkable impact on the mass loss rate for larger particle sizes.
The mass loss rate within 150~350oC for PBr samples shows complex variations (Fig. 5b), which reflects the difference in chemical components for different particle sizes. As shown, initially smaller particles decompose faster than larger ones, which implies that smaller particles contain more hemicellulose. With increasing temperatures, the reaction rate of smaller particles increases slower than that of larger ones, and the peak mass loss rate of larger particles (1.0-1.5 mm) is higher than that of smaller ones. Since the first shoulder and the peak correspond to the decomposition of hemicellulose and cellulose respectively, it is concluded that smaller PBr particles contain more hemicellulose and less cellulose. Also, particle size has an obvious impact on the mass loss rate within nearly the range of 350~470oC, where the pyrolysis of lignin is more significant than those of cellulose and hemicellulose. As shown, in Fig. 5a, the mass loss rate for smaller PN particles (<75 µm) is higher than larger ones (300-450 µm), while, in Fig. 5c, larger PB particles (75-300 µm) whose mass losses are controlled by pyrolysis kinetics decompose faster than smaller ones (<75 µm). This suggests the different mass fractions of lignin for PN and PB powders. It is possible that during the preparation (grinding and sieving) of samples, particles were redistributed, and thus the composition changed for different particle sizes. Previous research on swichgrass and reed canary grass revealed that larger particles contain more lignin [13].
100 200 300 400 500 600
0.0
0.2
0.4
0.6
0.8
1.0
1.2
1.4
1.6
Mas
s loss
rate (%
/min)
T empera ture (oC )
75µm-‐ 75-‐150µm 150-‐300µm 300-‐450µm
a : P ine needle
100 200 300 400 500 600
0.0
0.3
0.6
0.9
1.2
1.5
1.8
Mas
s loss
rate (%
/min)
T empera ture (oC )
75µm-‐ 75-‐150µm 150-‐300µm 450-‐800µm 1000-‐1500µm
b: P ine branch
100 200 300 400 500 600
0.0
0.2
0.4
0.6
0.8
1.0
1.2
Mas
s loss
rate (%
/min)
T empera ture (oC )
75µm-‐ 75-‐150µm 150-‐300µm 450-‐800µm 1000-‐1500µm
c: P ine ba rk
Fig. 5. Mass loss rates of forest combustibles of different particle dimensions in nitrogen.
Kinetic Analysis of Pyrolysis Using the Multi-component Mechanism
Kinetic analysis of PBr
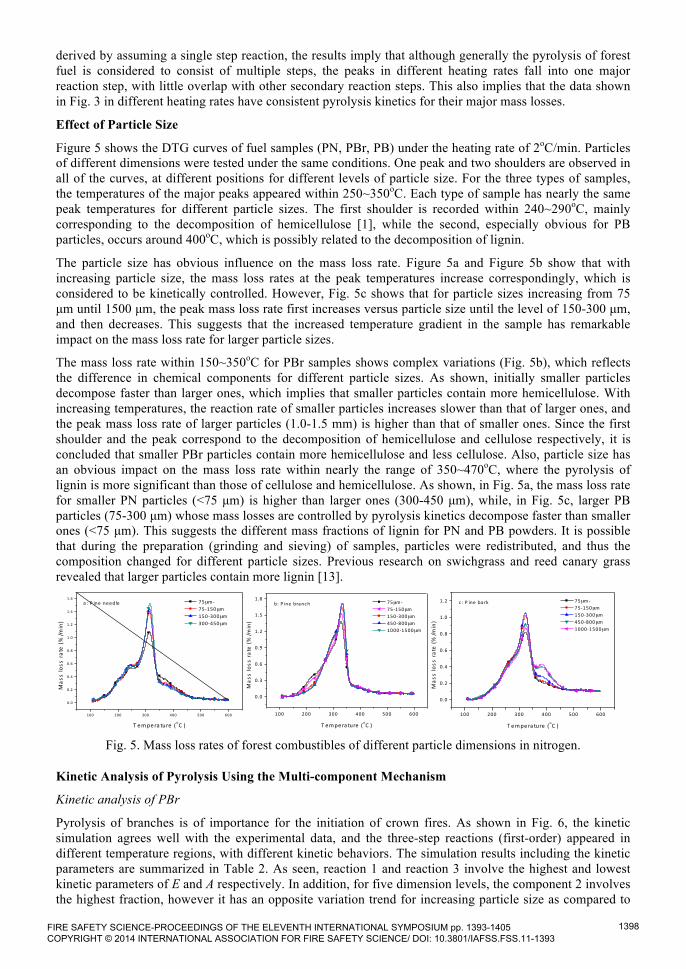
Pyrolysis of branches is of importance for the initiation of crown fires. As shown in Fig. 6, the kinetic simulation agrees well with the experimental data, and the three-step reactions (first-order) appeared in different temperature regions, with different kinetic behaviors. The simulation results including the kinetic parameters are summarized in Table 2. As seen, reaction 1 and reaction 3 involve the highest and lowest kinetic parameters of E and A respectively. In addition, for five dimension levels, the component 2 involves the highest fraction, however it has an opposite variation trend for increasing particle size as compared to
FIRE SAFETY SCIENCE-PROCEEDINGS OF THE ELEVENTH INTERNATIONAL SYMPOSIUM pp. 1393-1405 COPYRIGHT © 2014 INTERNATIONAL ASSOCIATION FOR FIRE SAFETY SCIENCE/ DOI: 10.3801/IAFSS.FSS.11-1393
1398

the components 1 and 3. This agrees with the observation of Fig. 5b. For the component 2, smaller particles involve lower values of E, which may be due to larger specific surface and higher activities. In comparison, the components 1 and 3 involve no obvious variations of E values with particle size.
Table 2. Simulation results of PBr particles.
Sample Size (µm) E1(kJ/mol) logA1 (s-1) c1
E2 (kJ/mol)
logA2 (s-1) c2
E3 (kJ/mol)
logA3 (s-1) c3 corr
Pine branch
<75 207.43 17.12 0.24 45.67 2.85 0.55 33.82 1.00 0.21 0.9971 75-150 232.21 19.25 0.24 55.27 3.74 0.51 32.78 1.00 0.24 0.9976
150-300 246.68 20.41 0.24 67.25 4.84 0.54 33.52 1.00 0.23 0.9982 450-800 238.84 19.71 0.35 95.06 7.65 0.37 32.51 1.07 0.28 0.9983
1000-1500 234.10 19.27 0.35 92.49 7.42 0.37 32.83 1.06 0.28 0.9984
0 100 200 300 400 500 600
0.000
0.002
0.004
0.006
0.008
0.010
0.012
0.014
Mas
s loss
rate (1/o C
)
T empera ture (oC )
R eac tion 1 R eac tion 2 R eac tion 3 T ota l reac tion E xperimenta l
a : 75µm-‐
0 100 200 300 400 500 600
0.000
0.002
0.004
0.006
0.008
0.010
0.012
0.014
Mas
s loss
rate (1/o C
)
T empera ture (oC )
R eac tion 1 R eac tion 2 R eac tion 3 T ota l reac tion E xperimenta l
b: 75-‐150µm
0 100 200 300 400 500 600
0.000
0.002
0.004
0.006
0.008
0.010
0.012
0.014
Mas
s loss
rate (1/o C
)
T empera ture (oC )
R eac tion 1 R eac tion 2 R eac tion 3 T ota l reac tion E xperimenta l
c : 150-‐300µm
0 100 200 300 400 500 600
0.000
0.002
0.004
0.006
0.008
0.010
0.012
0.014
Mas
s loss
rate (1/o C
)
T empera ture (oC )
R eac tion 1 R eac tion 2 R eac tion 3 T ota l reac tion E xperimenta l
d: 450-‐800µm
0 100 200 300 400 500 600
0.000
0.002
0.004
0.006
0.008
0.010
0.012
0.014
Mas
s loss
rate (1/o C
)
T empera ture (oC )
R eac tion 1 R eac tion 2 R eac tion 3 T ota l reac tion E xperimenta l
e : 1000-‐1500µm
Fig. 6. The kinetic simulation of PBr pyrolysis at 2oC/min in nitrogen.
FIRE SAFETY SCIENCE-PROCEEDINGS OF THE ELEVENTH INTERNATIONAL SYMPOSIUM pp. 1393-1405 COPYRIGHT © 2014 INTERNATIONAL ASSOCIATION FOR FIRE SAFETY SCIENCE/ DOI: 10.3801/IAFSS.FSS.11-1393
1399

Kinetic analysis of PN
There have been many studies on pyrolysis of PN due to its widespread distribution and high combustibility [4, 6, 7, 20]. The simulation results are shown in Fig. 7, and the kinetic parameters are listed in Table 3. As shown, the simulation curves agree well with experimental data for all the four particle size levels. Compared with PBr particles, PN particles involve higher shoulders in the mass loss rate curves, which imply that PN particles contain more component 1 and component 3. The values of kinetic parameters E and A for reaction 1 were much lower than those of PBr particles. Similar with PBr, the E and A values of smaller PN particles (<75 µm) were lower than those of larger particles (300-450 µm). This is also true for reaction 2 and reaction 3. In addition, smaller PN particles contain more components 3, which corresponds to the difference of mass loss rates in Fig. 5a.
0 100 200 300 400 500 600
0.000
0.002
0.004
0.006
0.008
0.010
0.012
Mas
s loss
rate (1/o C
)
T empera ture (oC )
R eac tion 1 R eac tion 2 R eac tion 3 T ota l reac tion E xperimenta l
a : 75µm-‐
0 100 200 300 400 500 600
0.000
0.002
0.004
0.006
0.008
0.010
0.012
Mas
s loss
rate (1/o C
)
T empera ture (oC )
R eac tion 1 R eac tion 2 R eac tion 3 T ota l reac tion E xperimenta l
b: 75-‐150µm
0 100 200 300 400 500 600
0.000
0.002
0.004
0.006
0.008
0.010
0.012
Mas
s loss
rate (1/o C
)
T empera ture (oC )
R eac tion 1 R eac tion 2 R eac tion 3 T ota l reac tion E xperimenta l
c : 150-‐300µm
0 100 200 300 400 500 600
0.000
0.002
0.004
0.006
0.008
0.010
0.012
Mas
s loss
rate (1/o C
)
T empera ture (oC )
R eac tion 1 R eac tion 2 R eac tion 3 T ota l reac tion E xperimenta l
d: 300-‐450µm
Fig. 7. The kinetic simulation of PN pyrolysis at 2oC/min in nitrogen
Table 3.Simulation results of PN particles.
Sample Size (µm) E1(kJ/mol) logA1 (s-1) c1
E2 (kJ/mol)
logA2 (s-1) c2
E3 (kJ/mol)
logA3 (s-1) c3 corr
Pine needle
<75 178.74 15.02 0.22 43.14 3.11 0.25 34.64 1.36 0.53 0.9967 75-150 188.51 15.89 0.30 49.19 3.66 0.29 34.34 1.45 0.41 0.9975
150-300 184.43 15.52 0.33 52.46 4.07 0.28 34.57 1.31 0.38 0.9982 300-450 183.34 15.37 0.37 52.90 4.09 0.28 36.38 1.45 0.35 0.9983
Kinetic analysis of PB
Figure 8 shows the simulation results of PB particles of five different size levels, with kinetic parameters listed in Table 4. Different from PN and PBr, the second shoulder of DTG curves of PB particles turns to be a minor peak. The minor peak becomes sharper when the dimension exceeds 450 µm, which may be due to the increase of the lignin contents in PB particles.
FIRE SAFETY SCIENCE-PROCEEDINGS OF THE ELEVENTH INTERNATIONAL SYMPOSIUM pp. 1393-1405 COPYRIGHT © 2014 INTERNATIONAL ASSOCIATION FOR FIRE SAFETY SCIENCE/ DOI: 10.3801/IAFSS.FSS.11-1393
1400

As seen in Table 4, PB particles contain 40-64% of component 3, much higher than the other two fuels, which correspond to the formation of minor peaks at higher temperatures. In addition, the fraction of component 3 for particle sizes of 1000-1500 µm is 64%, 24% more than that in small particles (<75 µm), which contributes to the sharper minor peaks on larger particles, consistent with the observation in Fig. 8d and Fig. 8e. Correspondingly, the percentages of component 1 and component 2 are lower in larger particles. However, although the chemical components of forest fuel particles were changed as a result of grinding and sieving, it does not mean that such mechanical means can cause the separation of the three components. Lignocellulosic materials are polymers with different degrees of polymerization and during the process of sieving, one certain component will not totally concentrate in largest or smallest particle level. As shown in Table 4, the fraction of component 3 cannot be ignored although this fraction in smaller particles is less than that in larger ones.
0 100 200 300 400 500 600
0.000
0.002
0.004
0.006
0.008
0.010
0.012
a : 75µm-‐
Mas
s loss
rate (1/o C
)
T empera ture (oC )
R eac tion 1 R eac tion 2 R eac tion 3 T ota l reac tion E xperimenta l
0 100 200 300 400 500 600
0.000
0.002
0.004
0.006
0.008
0.010
0.012
Mas
s loss
rate (1/o C
)
T empera ture (oC )
R eac tion 1 R eac tion 2 R eac tion 3 T ota l reac tion E xperimenta l
b: 75-‐150µm
0 100 200 300 400 500 600
0.000
0.002
0.004
0.006
0.008
0.010
0.012
c : 150-‐300µm
Mas
s loss
rate (1/o C
)
T empera ture (oC )
R eac tion 1 R eac tion 2 R eac tion 3 T ota l reac tion E xperimenta l
0 100 200 300 400 500 600
0.000
0.002
0.004
0.006
0.008
0.010
0.012
Mas
s loss
rate (1/o C
)
T empera ture (oC )
R eac tion 1 R eac tion 2 R eac tion 3 T ota l reac tion E xperimenta l
d: 450-‐800µm
0 100 200 300 400 500 600
0.000
0.002
0.004
0.006
0.008
0.010
0.012
Mas
s loss
rate (1/o C
)
T empera ture (oC )
R eac tion 1 R eac tion 2 R eac tion 3 T ota l reac tion E xperimenta l
e : 1000-‐1500µm
Fig. 8. The kinetic simulation of PB pyrolysis at 2oC/min in nitrogen.
FIRE SAFETY SCIENCE-PROCEEDINGS OF THE ELEVENTH INTERNATIONAL SYMPOSIUM pp. 1393-1405 COPYRIGHT © 2014 INTERNATIONAL ASSOCIATION FOR FIRE SAFETY SCIENCE/ DOI: 10.3801/IAFSS.FSS.11-1393
1401

Table 4. Simulation results of PB particles.
sample size (µm) E1 (kJ/mol)
logA1 (s-1) c1
E2 (kJ/mol)
logA2 (s-1) c2
E3 (kJ/mol)
logA3 (s-1) c3 corr
Pine bark
<75 151.75 12.30 0.33 69.87 5.63 0.27 35.11 1.09 0.40 0.9932 75-150 162.67 13.26 0.36 66.00 5.21 0.25 35.92 1.20 0.40 0.9945
150-300 180.31 14.89 0.32 71.02 5.72 0.20 35.37 1.23 0.48 0.9924 450-800 200.88 16.7 0.20 63.73 4.97 0.20 37.68 1.46 0.60 0.9892
1.0-1.5mm 198.21 16.47 0.19 68.09 5.42 0.17 39.05 1.59 0.64 0.9877
Proximate Analysis
From the viewpoint of industrial analysis, particle size may also affect the yields of pyrolysis products. Several studies have reported the effects of particle size on the yields of pyrolysis products, such as volatile, fixed carbon and ash. However, there is lack of research on the relationship between ash content and pyrolysis kinetics. The results of the industrial analysis of PBr particles are presented in Fig. 9, which shows that the percentages of moisture, volatile, fixed carbon and ash contents are determined to be within 6.0-7.3%, 80.0-80.1%, 18.3-19.3% and 0.29-1.52%, respectively. No significant variation of moisture, volatile and fixed carbon contents can be observed, while ash contents increase dramatically with the decrease of particle dimensions. Small particles (<75 µm) contain ashes five times of large particles (1.0 mm-1.5 mm). Ash is considered to be catalytic to decomposition process due to the inorganic species such as alkali metal salts and metallic oxides. Catalytic effects of mineral elements have been verified in literature [21, 22]. The catalytic effect is considered to function by decreasing the activation energy of decomposition reactions.
The relationship between ash contents and the activation energy E of the three pseudo reactions was summarized in Fig. 10. As shown, with the increase of particle size, E values of reaction 1 and reaction 2 increase first and then gradually turn to be constant, while those of reaction 3 will be not affected. On the other hand, the ash contents decrease monotonously from 1.52 to 0.29. The results seem to suggest that to some extent, ash content and activation energy have negative correlation.
Fig. 9. Yields of pyrolysis products of PBr particles.
CONCLUSIONS
Pyrolysis of three typical forest fuels was studied by thermogravimetric analysis, in different heating rates, to address the impact of particle sizes. For all the samples, one peak and two shoulders are observed in all of the mass loss curves, at different positions for different levels of particle size. Kissinger method was used to correlate the peak temperatures with heating rates, and the results imply that the major mass loss steps in different heating rates have consistent pyrolysis kinetics. For all the samples, the particle size has
0% 20% 40% 60% 80% 100%
75um-
75-150um
150-300um
450-800um
1.0-1.5mm
80.12
80.08
80.09
80.26
80.80
18,36
18,68
18,91
19,30
18,92
1,52
1,24
0,99
0,44
0,29
Volatile average% Fixed carbon average% Ash average%
FIRE SAFETY SCIENCE-PROCEEDINGS OF THE ELEVENTH INTERNATIONAL SYMPOSIUM pp. 1393-1405 COPYRIGHT © 2014 INTERNATIONAL ASSOCIATION FOR FIRE SAFETY SCIENCE/ DOI: 10.3801/IAFSS.FSS.11-1393
1402

no obvious effect on the temperatures of the major peaks. However, different particle sizes involve distinct mass loss rates, which cause the variation of chemical kinetics. Basically, the peak mass loss rate increases with increasing particle size for smaller particles, however the increased temperature gradient inside the sample may have a remarkable suppression on the mass loss rate when the particle size exceeds a certain level. The mass loss rates for the two shoulders show complex variations for different samples and particle sizes, which reflects the difference in chemical components.
A kinetic model consisting of three pseudo components was applied to simulate the pyrolysis for different dimensions. Higher activation energies and frequency factors were involved for component 1 and component 2 of larger PBr and PB particles. Industrial analysis of particles revealed that smallest particles contain ashes about 5 times of largest ones. To some extent, activation energy and ash content have negative correlation, which, however, needs to be further studied for verification.
<75 75-150 150-300 450-800 1000-1500
0.2
0.4
0.6
0.8
1.0
1.2
1.4
1.6
Ash content
Act
ivat
ion
ener
gy (k
J/m
ol)
Ash
con
tent
(%)
Particle size (µm)
0
50
100
150
200
250
E1
E2
E3
Fig. 10. Ash content and activation energy versus particle size, for pseudo components of PBr particles.
ACKNOWLEDGEMENTS
This work was sponsored by the National Basic Research Program of China (973 Program, No. 2012CB719702), the National Key Technology R&D Program under Grant 2011BAK07B01-02, and National Natural Science Foundation of China under Grant 51120165001, 51311120084 and 51076148. This work was also financially supported by Jiangsu Science-technology Support Plan Projects (No.BE2012671). Naian Liu was supported by the Fundamental Research Funds for the Central Universities (No. WK2320000020).
Correspondence to this paper should be addressed to Prof. Naian LIU, [email protected].
REFERENCES
[1] Di Blasi, C., (2008) Modeling Chemical and Physical Processes of Wood and Biomass Pyrolysis, Progress in Energy and Combustion Science 34(1): 47-90, http://dx.doi.org/10.1016/j.pecs.2006.12.001
[2] Babu, B.V., and Chaurasia, A.S., (2004) Heat Transfer and Kinetics in the Pyrolysis of Shrinking Biomass Particle, Chemical Engineering Science 59(10): 1999-2012, http://dx.doi.org/10.1016/j.ces.2004.01.050
[3] Manyà, J.J., Velo, E., and Puigjaner, L., (2002) Kinetics of Biomass Pyrolysis: a Reformulated Three-Parallel-Reactions Model. Industrial &Engineering Chemistry Research 42(3): 434-441, http://dx.doi.org/10.1021/ie020218p
FIRE SAFETY SCIENCE-PROCEEDINGS OF THE ELEVENTH INTERNATIONAL SYMPOSIUM pp. 1393-1405 COPYRIGHT © 2014 INTERNATIONAL ASSOCIATION FOR FIRE SAFETY SCIENCE/ DOI: 10.3801/IAFSS.FSS.11-1393
1403
[4] Safi, M.J., Mishra, I.M., and Prasad, B., (2004) Global Degradation Kinetics of Pine Needles in Air, Thermochimica Acta 412(1–2): 155-162, http://dx.doi.org/10.1016/j.tca.2003.09.017
[5] Várhegyi, G., Szabó, P., and Antal, Jr, M.J., (1994) Kinetics of the Thermal Decomposition of Cellulose under the Experimental Conditions of Thermal Analysis. Theoretical Extrapolations to High Heating Rates, Biomass and Bioenergy 7(1-6): 69-74, http://dx.doi.org/10.1016/0961-9534(95)92631-H
[6] Font, R., Conesa, J.A., Moltó, J., and Muñoz, M., (2009) Kinetics of Pyrolysis and Combustion of Pine Needles and Cones, Journal of Analytical and Applied Pyrolysis 85(1-2): 276-286, http://dx.doi.org/10.1016/j.jaap.2008.11.015
[7] Leoni, E., Cancellieri, D., Balbi, N., Tomi, P., Bernardini, A.F., and Kaloustian, J., (2003) Thermal Degradation of Pinus Pinaster Needles by DSC, part 2: Kinetics of Exothermic Phenomena, Journal of Fire Sciences 21(2): 117-130, http://dx.doi.org/10.1177/073490402032834
[8] Liu, N.A., and Fan, W.C., (1998) Modelling the Thermal Decompositions of Wood and Leaves under a Nitrogen Atmosphere, Fire and Materials 22(3): 103-108, http://dx.doi.org/10.1002/(Sici)1099-1018(1998050)22:3<103::Aid-Fam638>3.0.Co;2-G
[9] Mani, T., Murugan, P., Abedi, J., and Mahinpey, N., (2010) Pyrolysis of Wheat Straw in a Thermogravimetric Analyzer: Effect of Particle Size and Heating Rate on Devolatilization and Estimation of Global Kinetics, Chemical Engineering Research and Design 88(8): 952-958, http://dx.doi.org/10.1016/j.cherd.2010.02.008
[10] Chouchene, A., Jeguirim, M., Khiari, B., Zagrouba, F., and Trouvé, G., (2010) Thermal Degradation of Olive Solid Waste: Influence of Particle Size and Oxygen Concentration. Resources Conservation and Recycling 54(5): 271-277, http://dx.doi.org/10.1016/j.resconrec.2009.04.010
[11] Sis, H., (2007) Evaluation of Combustion Characteristics of Different Size Elbistan Lignite by Using TG/DTG and DTA. Journal of Thermal Analysis and Calorimetry 88(3): 863-870, http://dx.doi.org/10.1007/s10973-005-7447-4
[12] Duz, M.Z., Tonbul, Y., Baysal, A., Akba, O., Saydut, A., and Hamamci, C., (2005) Pyrolysis Kinetics and Chemical Composition of Hazro Coal According to the Particle Size. Journal of Thermal Analysis and Calorimetry 81(2): 395-398, http://dx.doi.org/10.1007/s10973-005-0798-z
[13] Bridgeman, T.G., Darvell, L.I., Jones, J.M., Williams, P.T., Fahmi, R., and Bridgwater, A.V., (2007) Influence of Particle Size on the Analytical and Chemical Properties of Two Energy Crops, Fuel 86(1-2): 60-72, http://dx.doi.org/10.1016/j.fuel.2006.06.022
[14] Mayoral, M.C., Izquierdo, M.T., Andrés, J.M., and Rubio, B., (2001) Different Approaches to Proximate Analysis by Thermogravimetry Analysis, Thermochimica Acta 370(1–2): 91-97, http://dx.doi.org/10.1016/S0040-6031(00)00789-9
[15] Hatakeyama, T., and Zhenhai, L.,Handbook of thermal analysis,John Wiley and Sons, San Francisco, 1999, p. 50.
[16] Shafizad, F., and Mcginnis, G.D., (1971) Chemical Composition and Thermal Analysis of Cottonwood, Carbohydrate Research 16(2): 273-277, http://dx.doi.org/10.1016/S0008-6215(00)81161-1
[17] Orfão, J.J.M., Antunes, F.J.A., and Figueiredo, J.L., (1999) Pyrolysis Kinetics of Lignocellulosic materials-Three Independent Reactions Model, Fuel 78(3): 349-358, http://dx.doi.org/10.1016/s0016-2361(98)00156-2
[18] Chen, H.X., Zhao, W.T., and Liu, N.A., (2011) Thermal Analysis and Decomposition Kinetics of Chinese Forest Peat under Nitrogen and Air Atmospheres, Energy & Fuels 25: 797-803, http://dx.doi.org/10.1021/Ef101155n
[19] Kissinger, H.E., (1957) Reaction Kinetics in Differential Thermal Analysis, Analytical Chemistry 29(11): 1702-1706, http://dx.doi.org/10.1021/ac60131a045
FIRE SAFETY SCIENCE-PROCEEDINGS OF THE ELEVENTH INTERNATIONAL SYMPOSIUM pp. 1393-1405 COPYRIGHT © 2014 INTERNATIONAL ASSOCIATION FOR FIRE SAFETY SCIENCE/ DOI: 10.3801/IAFSS.FSS.11-1393
1404

[20] Leoni, E., Tomi, P., Khoumeri, B., Balbi, N., and Bernardini, A.F., (2001) Thermal Degradation of Pinus Pinaster Needles by DSC. Part 1: Dehydration Kinetics, Journal of Fire Sciences 19(5): 379-397, http://dx.doi.org/10.1106/Qbdc-5vh2-U5x2-Fuf7
[21] Darvell, L., Hrycko, P., Jones, J., Nowakowski, D., Pourkashaniam, M., and Williams, A.,“Impact of minerals and alkali metals on willow combustion properties,”World Renewable Energy Congress, Regional Meeting, 2005, pp. 584-589.
[22] Fahmi, R., Bridgwater, A.V., Darvell, L.I., Jones, J.M., Yates, N.,and Thain, S., (2007) The Effect of Alkali Metals on Combustion and Pyrolysis of Lolium and Festuca Grasses, Switchgrass and Willow, Fuel 86(10–11): 1560-1569, http://dx.doi.org/10.1016/j.fuel.2006.11.030
FIRE SAFETY SCIENCE-PROCEEDINGS OF THE ELEVENTH INTERNATIONAL SYMPOSIUM pp. 1393-1405 COPYRIGHT © 2014 INTERNATIONAL ASSOCIATION FOR FIRE SAFETY SCIENCE/ DOI: 10.3801/IAFSS.FSS.11-1393
1405