EFFECT OF OUTFLOW ORIENTATION AND MULTIPLE JETS … · KING FAHD UNIVERSITY OF PETROLEUM & MINERALS...
263
EFFECT OF OUTFLOW ORIENTATION AND MULTIPLE JETS ORIFICE PLATE CONFIGURATIONS ON HEAT TRANSFER IN A RECTANGULAR DUCT By MOHAMMED KHALEEL AHMED A Thesis presented to the DEANSHIP OF GRADUATE STUDIES KING FAHD UNIVERSITY OF PETROLEUM & MINERALS DHAHRAN, SAUDI ARABIA In Partial Fulfillment of the Requirements for the Degree of MASTER OF SCIENCE In MECHANICAL ENGINEERING MARCH 2005
Transcript of EFFECT OF OUTFLOW ORIENTATION AND MULTIPLE JETS … · KING FAHD UNIVERSITY OF PETROLEUM & MINERALS...

EFFECT OF OUTFLOW ORIENTATION AND MULTIPLE
JETS ORIFICE PLATE CONFIGURATIONS ON HEAT TRANSFER IN A RECTANGULAR DUCT
By
MOHAMMED KHALEEL AHMED
A Thesis presented to the
DEANSHIP OF GRADUATE STUDIES
KING FAHD UNIVERSITY OF PETROLEUM & MINERALS
DHAHRAN, SAUDI ARABIA
In Partial Fulfillment of the Requirements for the Degree of
MASTER OF SCIENCE
In
MECHANICAL ENGINEERING MARCH 2005

KING FAHD UNIVERSITY OF PETROLEUM & MINERALS DHAHRAN 31261, SAUDI ARABIA
DEANSHIP OF GRADUATE STUDIES This thesis, written by MOHAMMED KHALEEL AHMED under the direction of
his Thesis Advisor and approved by his Thesis Committee, has been presented to and
accepted by the Dean of Graduate Studies, in partial fulfillment of the requirements
for the degree of MASTER OF SCIENCE IN MECHANICAL ENGINEERING.
Thesis Committee ____________________________________ Dr. Luai Al-Hadhrami (Advisor) ____________________________________ Prof. Syed M. Zubair (Member) ____________________________________ Prof. Mohammed A. Habib (Member) _____________________________ Dr. Faleh Al-Sulaiman Department Chairman _____________________________ Dr. Mohammed A. Al-Ohali Dean of Graduate Studies
_____________________________
Date

Dedicated to My Beloved Parents, Sister & Brother

iv
ACKNOWLEDGEMENTS
In the name of Allah, the Most Gracious and the Most Merciful
All praise and thanks are due to Almighty Allah, subhanahu Wa Ta’ala, for
bestowing me with health, knowledge, opportunity, courage and patience to complete this
work. Thereafter, acknowledgement is due to King Fahd University of Petroleum and
Minerals for my admittance, and to its learned faculty members for imparting quality
learning and knowledge with their valuable support and able guidance.
My deep appreciation and heartfelt gratitude goes to my thesis advisor Dr. Luai Al-
Hadhrami for his constant endeavor, guidance and the numerous moments of attention he
devoted throughout the course of this research work. His valuable suggestions made this
work interesting and knowledgeable to me. I would also acknowledge Dr. Luai Al-Hadhrami
for his cooperation in providing the Heat Transfer Lab facility.
I am deeply indebted and grateful to my thesis committee members Dr. Syed M.
Zubair and Dr. M. A. Habib for their extensive guidance, continuous support, constructive
and positive criticism and thought-provoking contribution in my research work. It was surely
an honor and an exceptional learning experience to work with them. Acknowledgements are
also due to Lab engineers Mr. Saeed Al-Baba and Mr. Mohandes Karam for their help and
support during experiments.
I am also thankful to department chairman Dr. Faleh Al-Sulaiman for providing me a
favorable environment where I was able to utilize my skills.

v
Acknowledgement is due to all my senior colleagues at the university who were
always there to help me in my work. Special thanks are due to my friends Obaid, Kaleem,
Mazhar, Khaja, Qaiyum, Khaliq, Imran, Sami, Basha, Shafeeq, Shujath, Omer, Awes, Saad,
Bilal, Sanaullah and all others who have provided wonderful company and good memories
that will last a life time. Thanks are also due to my flat mates, they made my stay at KFUPM
memorable.
Family support plays a vital role in the success of an individual. I am thankful to my
parents, brother and sister for their constant prayers, encouragement and inspiration. Also I
am grateful to all my relatives for their support, encouragement and prayers.

vi
TABLE OF CONTENTS
LIST OF TABLES .................................................................................................................. x
LIST OF FIGURES ............................................................................................................... xi
THESIS ABSTRACT (ENGLISH) ................................................................................... xvii
THESIS ABSTRACT (ARABIC)..................................................................................... xviii
NOMENCLATURE............................................................................................................. xix
CHAPTER 1............................................................................................................................ 1
INTRODUCTION................................................................................................................... 1
1.1 General Introduction.................................................................................................... 1
1.1.1 Types of Cooling...................................................................................................... 3
1.1.2 Overview of a Turbine Blade................................................................................... 4
1.2 Jet Impingement ........................................................................................................... 6
1.2.1 Literature review...................................................................................................... 9
1.2.1.1 Effect of nozzle-to-plate distance ................................................................... 18
1.2.1.2 Effect of cross-flow......................................................................................... 18
1.3 Motivation to investigate ............................................................................................ 21
1.4 Objective of the present study ................................................................................... 22
CHAPTER 2.......................................................................................................................... 24
EXPERIMENTAL SETUP AND PROCEDURE.............................................................. 24
2.1 General set-up and Apparatus................................................................................... 24
2.1.1 Construction details ............................................................................................... 27
2.1.2 Test section ............................................................................................................ 28
2.1.3 Outflow orientation................................................................................................ 31
2.1.4 Orifice plates.......................................................................................................... 33
2.1.5 Instrumentation and Data Acquisition ................................................................... 35
2.2 Data Reduction............................................................................................................ 40
2.2.1 Reynolds number calculations ............................................................................... 40

vii
2.2.2 Nusselt number calculations .................................................................................. 40
2.3 Procedure..................................................................................................................... 43
CHAPTER 3.......................................................................................................................... 45
UNCERTAINITY ANALYSIS............................................................................................ 45
3.1 Introduction................................................................................................................. 45
3.2 Measurement Errors .................................................................................................. 46
3.3 Uncertainty Evaluation Procedure............................................................................ 49
3.3.1 Uncertainty in Nusselt number .............................................................................. 50
3.3.2 Uncertainty in Jet Reynolds number...................................................................... 52
3.4 EES Program............................................................................................................... 53
3.5 Sample Uncertainty Calculations .............................................................................. 56
3.5.1 Orifice Plate – 1 ..................................................................................................... 56
3.5.2 Orifice Plate – 2 ..................................................................................................... 57
3.5.3 Orifice Plate – 3 ..................................................................................................... 58
3.5.4 Orifice Plate – 4 ..................................................................................................... 59
3.5.5 Uncertainty in jet Reynolds numbers..................................................................... 60
CHAPTER 4.......................................................................................................................... 62
ORIFICE PLATE - 1............................................................................................................ 62
4.1 Effect of feeding channel aspect ratio on local Nusselt number ............................. 64
4.2 Effect of jet Reynolds number on local Nusselt number......................................... 70
4.3 Effect of outflow orientation on local Nusselt number............................................ 77
4.4 Effect of jet-to-plate distance on local Nusselt number........................................... 83
4.5 Averaged Nusselt Number ......................................................................................... 89
4.5.1 Effect of feeding channel aspect ratio.................................................................... 89
4.5.2 Effect of outflow orientation.................................................................................. 90
4.5.3 Correlations of averaged Nusselt number.............................................................. 94
CHAPTER 5.......................................................................................................................... 97

viii
ORIFICE PLATE – 1 & 2.................................................................................................... 97
5.1 Effect of feeding channel aspect ratio on local Nusselt number ............................. 98
5.2 Effect of jet Reynolds number on local Nusselt number....................................... 105
5.3 Effect of outflow orientation on local Nusselt number.......................................... 113
5.4 Averaged Nusselt number ........................................................................................ 119
5.4.1 Effect of feeding channel aspect ratio.................................................................. 119
5.4.2 Effect of outflow orientation................................................................................ 120
5.4.3 Correlations of averaged Nusselt number............................................................ 123
CHAPTER 6........................................................................................................................ 126
ORIFICE PLATE - 2.......................................................................................................... 126
6.1 Effect of feeding channel aspect ratio on local Nusselt number ........................... 126
6.2 Effect of jet Reynolds number on local Nusselt number....................................... 133
6.3 Effect of outflow orientation on local Nusselt number.......................................... 140
6.4 Effect of Jet-to-plate distance on local Nusselt number ........................................ 146
6.5 Average Nusselt Number.......................................................................................... 152
6.5.1 Effect of feeding channel aspect ratio.................................................................. 152
6.5.2 Effect of outflow orientation................................................................................ 153
6.5.3 Correlations of Averaged Nusselt number........................................................... 156
CHAPTER 7........................................................................................................................ 159
ORIFICE PLATE - 3.......................................................................................................... 159
7.1 Effect of feeding channel aspect ratio on local Nusselt number ........................... 159
7.2 Effect of jet Reynolds number on local Nusselt number....................................... 166
7.3 Effect of outflow orientation on local Nusselt number.......................................... 173
7.4 Effect of jet-to-plate distance on local Nusselt number......................................... 179
7.5 Average Nusselt Number.......................................................................................... 185
7.5.1 Effect of feeding channel aspect ratio.................................................................. 185
ix
7.5.2 Effect of outflow orientation................................................................................ 186
7.5.3 Correlations of averaged Nusselt number............................................................ 189
CHAPTER 8........................................................................................................................ 192
ORIFICE PLATE - 4.......................................................................................................... 192
8.1 Effect of feeding channel aspect ratio on local Nusselt number ........................... 194
8.2 Effect of jet Reynolds number on local Nusselt number....................................... 200
8.3 Effect of outflow orientation on local Nusselt number.......................................... 207
8.4 Effect of jet-to-plate distance on local Nusselt number......................................... 213
8.5 Average Nusselt Number.......................................................................................... 219
8.5.1 Effect of feeding channel aspect ratio.................................................................. 219
8.5.2 Effect of outflow orientation................................................................................ 220
8.4.3 Correlations of averaged Nusselt number............................................................ 225
CHAPTER 9........................................................................................................................ 228
CONCLUSIONS ................................................................................................................. 228
8.1 Orifice plate – 1 ......................................................................................................... 228
8.2 Orifice plate 1 & 2..................................................................................................... 229
8.3 Orifice plate – 2 ......................................................................................................... 230
8.4 Orifice plate – 3 ......................................................................................................... 231
8.5 Orifice plate – 4 ......................................................................................................... 232
APPENDIX A...................................................................................................................... 234
SAMPLE CALCUATIONS OF LOCAL NUSSELT NUMBER.................................... 234
BIBLIOGRAPHY............................................................................................................... 236

x
LIST OF TABLES
Table 2.1 Instrumentation and software used for Data acquisition........................................ 37
Table 3.1 Sample Uncertainty calculations of Nusselt number for minimum value ............. 56
Table 3.2 Sample Uncertainty calculations of Nusselt number for maximum value............. 56
Table 3.3 Sample Uncertainty calculations of Nusselt number for minimum value ............. 57
Table 3.4 Sample Uncertainty calculations of Nusselt number for maximum value............. 57
Table 3.5 Sample Uncertainty calculations of Nusselt number for minimum value ............. 58
Table 3.6 Sample Uncertainty calculations of Nusselt number for maximum value............. 58
Table 3.7 Sample Uncertainty calculations of Nusselt number for minimum value ............. 59
Table 3.8 Sample Uncertainty calculations of Nusselt number for maximum value............. 59
Table 3.9 Sample Uncertainty calculations of Jet Reynolds number for 9300Re =j .......... 60
Table 3.10 Sample Uncertainty calculations of Jet Reynolds number for 14400Re =j ...... 60
Table 3.11 Sample Uncertainty calculations of Jet Reynolds number for 18800Re =j ...... 60
Table 3.12 The derived parameters used to find the uncertainty. .......................................... 61

xi
LIST OF FIGURES
Figure 1.1 Schematic of a Gas turbine (Fred Thomas [46]) .................................................... 2
Figure 1.2 A typical turbine blade cooling arrangement ......................................................... 5
Figure 1.3 Schematic of impingement cooling arrangement in a first-stage turbine inlet guide
vane. .................................................................................................................................. 7
Figure 1.4 Three commonly used nozzle arrangements for impinging jet arrays.................. 11
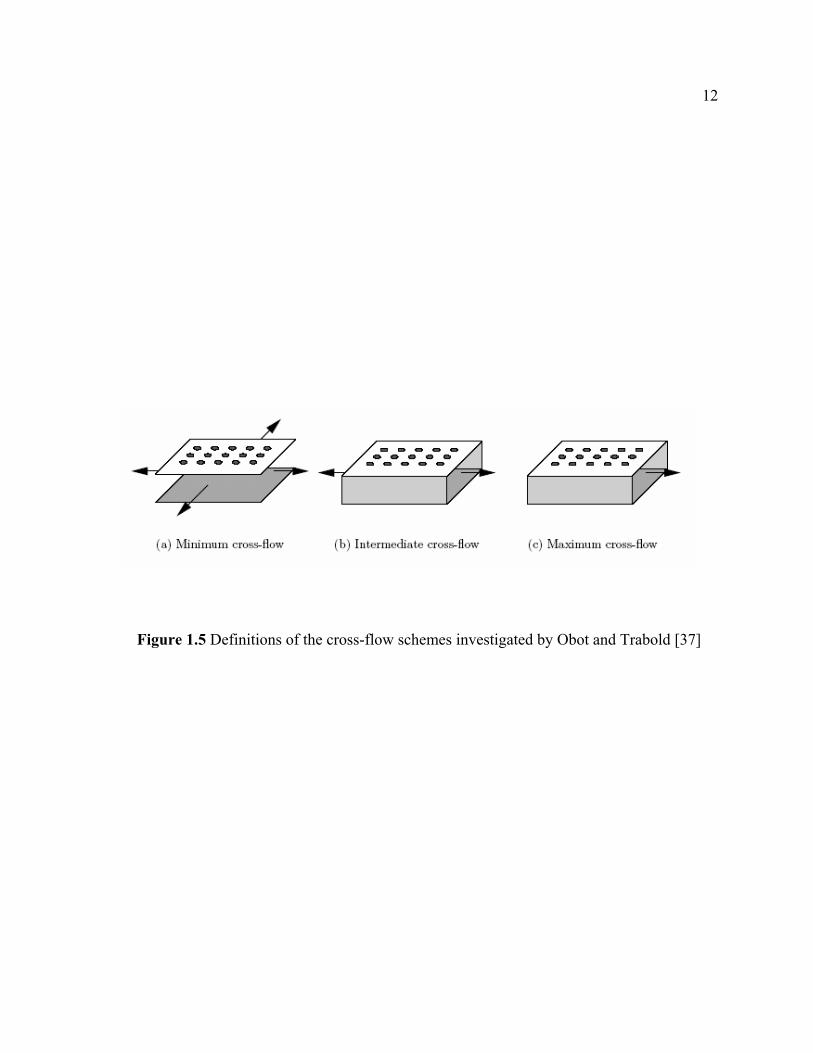
Figure 1.5 Definitions of the cross-flow schemes investigated by Obot and Trabold [37] ... 12
Figure 2.1 Schematic of the test section. ............................................................................... 26
Figure 2.2 Three-dimensional view of the test section for case 1.......................................... 30
Figure 2.3 Illustration of three exit outflow orientations. ...................................................... 32
Figure 2.4 Orifice plate orientations considered in this study ............................................... 34
Figure 2.5 Illustration of thermocouples mounted in a groove at the back of a copper plate.36
Figure 2.6 Photograph of the program being used................................................................. 39
Figure 3.1, Distribution of errors upon repeated measurements (Figliola, R.S. [47]) ........... 48
Figure 4.1 Effect of feeding channel aspect ratio 5.4/5.2 ≤≤ dH on local Nusselt number
distribution for case – 1 and jet-to-plate distance 3/ =dS . ........................................... 67
Figure 4.2 Effect of feeding channel aspect ratio 5.4/5.2 ≤≤ dH on local Nusselt number
distribution for case – 2 and jet-to-plate distance 3/ =dS . ........................................... 68
Figure 4.3 Effect of feeding channel aspect ratio 5.4/5.2 ≤≤ dH on local Nusselt number
distribution for case – 3 and jet-to-plate distance 3/ =dS . ........................................... 69
Figure 4.4 Effect of jet Reynolds number and feeding channel aspect ratio
5.4/5.2 ≤≤ dH on local Nusselt number distribution for 3/ =dS and case – 1. ....... 73
Figure 4.5 Effect of jet Reynolds number and feeding channel aspect ratio
5.4/5.2 ≤≤ dH on local Nusselt number distribution for 3/ =dS and case – 2. ....... 74
Figure 4.6 Effect of jet Reynolds number and feeding channel aspect ratio
5.4/5.2 ≤≤ dH on local Nusselt number distribution for 3/ =dS and case – 3. ....... 76
Figure 4.7 Effect of outflow orientation and feeding channel aspect ratio 5.4/5.2 ≤≤ dH on
local Nusselt number distribution for 3/ =dS and 5000Re =j . ................................. 78

xii
Figure 4.8 Effect of outflow orientation and feeding channel aspect ratio 5.4/5.2 ≤≤ dH on
local Nusselt number distribution for 3/ =dS and 7500Re =j ................................... 81
Figure 4.9 Effect of outflow orientation and feeding channel aspect ratio 5.4/5.2 ≤≤ dH on
local Nusselt number distribution for 3/ =dS and 10000Re =j ................................. 82
Figure 4.10 Effect of jet-to-plate distance and feeding channel aspect ratio
5.4/5.2 ≤≤ dH on local Nusselt number distribution for 10000Re =j and case – 1. 85
Figure 4.11 Effect of jet-to-plate distance and feeding channel aspect ratio
5.4/5.2 ≤≤ dH on local Nusselt number distribution for 10000Re =j and case – 2. 86
Figure 4.12 Effect of jet-to-plate distance and feeding channel aspect ratio
5.4/5.2 ≤≤ dH on local Nusselt number distribution for 10000Re =j and case – 3. 88
Figure 4.13 Effect of feeding channel aspect ratio 5.4/5.2 ≤≤ dH and jet-to-plate
distances on averaged Nusselt number for different outflow orientation. ...................... 92
Figure 4.14 Effect of outflow orientation and feeding channel aspect ratio on averaged
Nusselt number for different jet-to-plate distances )4/2( ≤≤ dS . ............................... 93
Figure 4.15 Averaged Nusselt number comparisons with the existing correlations.............. 96
Figure 5.1 Effect of feeding channel aspect ratio cmdHcm 5.4/5.2 ≤≤ on local Nusselt
number distribution for case – 1 and cmS 3= . (Filled symbol: cmd 1= and Unfilled
symbol: cmd 5.0= ) ..................................................................................................... 102
Figure 5.2 Effect of feeding channel aspect ratio cmdHcm 5.4/5.2 ≤≤ on local Nusselt
number distribution for case – 2 and cmS 3= . (Filled symbol: cmd 1= and Unfilled
symbol: cmd 5.0= ) ..................................................................................................... 103
Figure 5.3 Effect of feeding channel aspect ratio cmdHcm 5.4/5.2 ≤≤ on local Nusselt
number distribution for case – 3 and cmS 3= . (Filled symbol: cmd 1= and Unfilled
symbol: cmd 5.0= ) ..................................................................................................... 104
Figure 5.4 Effect of jet Reynolds number and feeding channel aspect ratio
cmdHcm 5.4/5.2 ≤≤ on local Nusselt number distribution for case – 1 and cmS 3= .
(Filled symbol: cmd 1= and Unfilled symbol: cmd 5.0= ) ....................................... 108

xiii
Figure 5.5 Effect of jet Reynolds number and feeding channel aspect ratio
cmdHcm 5.4/5.2 ≤≤ on local Nusselt number distribution for case – 2 and cmS 3= .
(Filled symbol: cmd 1= and Unfilled symbol: cmd 5.0= ) ....................................... 109
Figure 5.6 Effect of jet Reynolds number and feeding channel aspect ratio
cmdHcm 5.4/5.2 ≤≤ on local Nusselt number distribution for case – 3 and
cmS 3= .(Filled symbol: cmd 1= and Unfilled symbol: cmd 5.0= )........................ 112
Figure 5.7 Effect of outflow orientation and feeding channel aspect ratio
cmdHcm 5.4/5.2 ≤≤ on local Nusselt number distribution for 5000Re =j and
cmS 3= . (Filled symbol: cmd 1= and Unfilled symbol: cmd 5.0= )....................... 114
Figure 5.8 Effect of outflow orientation and feeding channel aspect ratio
cmdHcm 5.4/5.2 ≤≤ on local Nusselt number distribution for 7500Re =j and
cmS 3= . (Filled symbol: cmd 1= and Unfilled symbol: cmd 5.0= )....................... 117
Figure 5.9 Effect of outflow orientation and feeding channel aspect ratio
cmdHcm 5.4/5.2 ≤≤ on local Nusselt number distribution for 10000Re =j and
cmS 3= . (Filled symbol: cmd 1= and Unfilled symbol: cmd 5.0= )....................... 118
Figure 5.10 Effect of outflow orientation on averaged Nusselt number for different feeding
channel aspect ratios cmdHcm 5.4/5.2 ≤≤ and cmS 3= . (Filled symbol: cmd 1=
and Unfilled symbol: cmd 5.0= ) ................................................................................ 121
Figure 5.11 Effect of feeding channel aspect ratio cmdHcm 5.4/5.2 ≤≤ on the averaged
Nusselt number for different outflow orientations and cmS 3= . (Filled symbol:
cmd 1= and Unfilled symbol: cmd 5.0= ) ................................................................. 122
Figure 5.12 Averaged Nusselt number comparisons with the existing correlations............ 125
Figure 6.1 Effect of feeding channel aspect ratio 9/5 ≤≤ dH on local Nusselt number
distribution for case – 1 and jet-to-plate distance 6/ =dS . ........................................ 130
Figure 6.2 Effect of feeding channel aspect ratio 9/5 ≤≤ dH on local Nusselt number
distribution for case – 2 and jet-to-plate distance 6/ =dS . ........................................ 131
xiv
Figure 6.3 Effect of feeding channel aspect ratio 9/5 ≤≤ dH on local Nusselt number
distribution for case – 3 and jet-to-plate distance 6/ =dS ......................................... 132
Figure 6.4 Effect of jet Reynolds number and feeding channel aspect ratio 9/5 ≤≤ dH on
local Nusselt number distribution for 6/ =dS and case – 1. ...................................... 136
Figure 6.5 Effect of jet Reynolds number and feeding channel aspect ratio 9/5 ≤≤ dH on
local Nusselt number distribution for 6/ =dS and case – 2.. ..................................... 137
Figure 6.6 Effect of jet Reynolds number and feeding channel aspect ratio 9/5 ≤≤ dH on
local Nusselt number distribution for 6/ =dS and case – 3. ...................................... 139
Figure 6.7 Effect of outflow orientation and feeding channel aspect ratio 9/5 ≤≤ dH on
local Nusselt number distribution for 6/ =dS and 9300Re =j . ............................... 141
Figure 6.8 Effect of outflow orientation and feeding channel aspect ratio 9/5 ≤≤ dH on
local Nusselt number distribution for 6/ =dS and 14400Re =j . ............................. 144
Figure 6.9 Effect of outflow orientation and feeding channel aspect ratio 9/5 ≤≤ dH on
local Nusselt number distribution for 6/ =dS and 18800Re =j . ............................. 145
Figure 6.10 Effect of jet-to-plate distance and feeding channel aspect ratio 9/5 ≤≤ dH on
local Nusselt number distribution for 18800Re =j and case – 1. ............................... 148
Figure 6.11 Effect of jet-to-plate distance and feeding channel aspect ratio 9/5 ≤≤ dH on
local Nusselt number distribution for 18800Re =j and case – 2. ............................... 149
Figure 6.12 Effect of jet-to-plate distance and feeding channel aspect ratio 9/5 ≤≤ dH on
local Nusselt number distribution for 18800Re =j and case – 3. ............................... 151
Figure 6.13 Effect of feeding channel aspect ratio )9/5( ≤≤ dH and jet-to-plate distances
on averaged Nusselt number for different outflow orientation..................................... 154
Figure 6.14 Effect of outflow orientation and feeding channel aspect ratio on averaged
Nusselt number for different jet-to-plate distances )8/4( ≤≤ dS . ............................. 155
Figure 6.15 Averaged Nusselt number comparisons with the existing correlations............ 158
Figure 7.1 Effect of feeding channel aspect ratio 9/5 ≤≤ dH on local Nusselt number
distribution for case – 1 and jet-to-plate distance 6/ =dS . ........................................ 163

xv
Figure 7.2 Effect of feeding channel aspect ratio 9/5 ≤≤ dH on local Nusselt number
distribution for case – 2 and jet-to-plate distance 6/ =dS . ........................................ 164
Figure 7.3 Effect of feeding channel aspect ratio 9/5 ≤≤ dH on local Nusselt number
distribution for case – 3 and jet-to-plate distance 6/ =dS . ........................................ 165
Figure 7.4 Effect of jet Reynolds number on local Nusselt number distribution for 6/ =dS
and case – 1................................................................................................................... 169
Figure 7.5 Effect of jet Reynolds number on local Nusselt number distribution for 6/ =dS
and case – 2................................................................................................................... 170
Figure 7.6 Effect of jet Reynolds number on local Nusselt number distribution for 6/ =dS
and case – 3................................................................................................................... 172
Figure 7.7 Effect of outflow orientation on local Nusselt number distribution for 6/ =dS
and 9300Re =j ............................................................................................................ 174
Figure 7.8 Effect of outflow orientation on local Nusselt number distribution for 6/ =dS
and 14400Re =j . ......................................................................................................... 177
Figure 7.9 Effect of outflow orientation on local Nusselt number distribution for 6/ =dS
and 18800Re =j . ......................................................................................................... 178
Figure 7.10 Effect of jet-to-plate distance on local Nusselt number distribution for
18800Re =j and case – 1. ........................................................................................... 181
Figure 7.11 Effect of jet-to-plate distance on local Nusselt number distribution for
18800Re =j and case – 2. ........................................................................................... 182
Figure 7.12 Effect of jet-to-plate distance on local Nusselt number distribution for
18800Re =j and case – 3. ........................................................................................... 184
Figure 7.13 Effect of feeding channel aspect ratio )9/5( ≤≤ dH and jet-to-plate distances
on averaged Nusselt number for different outflow orientation..................................... 187
Figure 7.14 Effect of outflow orientation and feeding channel aspect ratio on averaged
Nusselt number for different jet-to-plate distances )8/4( ≤≤ dS . ............................. 188
Figure 7.15 Averaged Nusselt number comparisons with the existing correlations............ 191

xvi
Figure 8.1 Effect of feeding channel aspect ratio 9/5 ≤≤ dH on local Nusselt number
distribution for case – 1 and jet-to-plate distance 4/ =dS . ........................................ 197
Figure 8.2 Effect of feeding channel aspect ratio 9/5 ≤≤ dH on local Nusselt number
distribution for case – 2 and jet-to-plate distance 4/ =dS . ........................................ 198
Figure 8.3 Effect of feeding channel aspect ratio 9/5 ≤≤ dH on local Nusselt number
distribution for case – 3 and jet-to-plate distance 4/ =dS . ........................................ 199
Figure 8.4 Effect of jet Reynolds number and feeding channel aspect ratio 9/5 ≤≤ dH on
local Nusselt number distribution for 4/ =dS and case – 1. ...................................... 203
Figure 8.5 Effect of jet Reynolds number and feeding channel aspect ratio 9/5 ≤≤ dH on
local Nusselt number distribution for 4/ =dS and case – 2. ...................................... 204
Figure 8.6 Effect of jet Reynolds number and feeding channel aspect ratio 9/5 ≤≤ dH on
local Nusselt number distribution for 4/ =dS and case – 3. ...................................... 206
Figure 8.7 Effect of outflow orientation and feeding channel aspect ratio 9/5 ≤≤ dH on
local Nusselt number distribution for 4/ =dS and 9300Re =j . ............................... 208
Figure 8.8 Effect of outflow orientation and feeding channel aspect ratio 9/5 ≤≤ dH on
local Nusselt number distribution for 4/ =dS and 14400Re =j . ............................. 211
Figure 8.9 Effect of outflow orientation and feeding channel aspect ratio 9/5 ≤≤ dH on
local Nusselt number distribution for 4/ =dS and 18800Re =j . ............................. 212
Figure 8.10 Effect of jet-to-plate distance and feeding channel aspect ratio 9/5 ≤≤ dH on
local Nusselt number distribution for 18800Re =j and case – 1. ............................... 215
Figure 8.11 Effect of jet-to-plate distance and feeding channel aspect ratio 9/5 ≤≤ dH on
local Nusselt number distribution for 18800Re =j and case – 2. ............................... 216
Figure 8.12 Effect of jet-to-plate distance and feeding channel aspect ratio 9/5 ≤≤ dH on
local Nusselt number distribution for 18800Re =j and case – 3. ............................... 218
Figure 8.13 Effect of feeding channel aspect ratio )9/5( ≤≤ dH and jet-to-plate distances
on averaged Nusselt number for different outflow orientation..................................... 223
Figure 8.15 Averaged Nusselt number comparisons with the existing correlations............ 227

xvii
THESIS ABSTRACT (ENGLISH)
NAME: MOHAMMED KHALEEL AHMED TITLE: EFFECT OF OUTFLOW ORIENTATION AND
MULTIPLE JETS ORIFICE PLATE CONFIGURATIONS ON HEAT TRANSFER IN A RECTANGULAR DUCT
MAJOR: MECHANICAL ENGINEERING
DATE: MARCH, 2005
Experimental investigation is carried out to study the heat transfer characteristics in
a rectangular duct cooled by an array of impinging jets. Air ejected from an array of orifice jets is aimed at the heated target surface and exits from the radial outlets. The effect of outflow orientation, feeding channel aspect ratios 9/5 ≤≤ dH and jet to target plate distance 8/4 ≤≤ dS is investigated with a single array of equally spaced orifice jets. The effect of jet Reynolds number is also studied with the range for orifice plate 1 and 2 being
10000Re5000 ≤≤ j and for orifice plates 2, 3 and 4 being 18800Re9300 ≤≤ j . The effect of orifice jet diameter on the heat transfer distribution is also studied with cmandd 15.0= .
Results indicate that the outflow orientation causing crossflow effect significantly affects the Nusselt number distributions on the target surface. Local Nusselt number increases with an increase in jet Reynolds number over the entire impingement surface. Nusselt number is also significantly affected by the feeding channel aspect ratio dH / the jet-to-plate spacing
dS / . The feeding channel aspect ratio dH / which gives the maximum heat transfer is obtained for all the orifice plates. Similarly the jet-to-plate distance dS / which gives maximum heat transfer compared to the other jet-to-plate distances is also found for all the orifice plates studied individually. The highest Nusselt numbers are obtained for the outflow orientation where the flow exits in both the directions. Correlations were developed for averaged Nusselt number as a function of jet Reynolds number for all the orifice plates.
MASTER OF SCIENCE DEGREE
KING FAHD UNIVERSITY OF PETROLEUM & MINERALS
Dhahran, Saudi Arabia
MARCH, 2005

xviii
THESIS ABSTRACT (ARABIC)
الرسالة ملخص
خليل احمدمحمد : االســـــــــــــــم وفتحات النفث المتعدده على انتقال الحراره فى مجرى مستطيل توجيه السريانتأثير : الرسالة عنوان
يكانيكيهالهندسة الم: التخصــــــــص م2005مارس : التخــرج تاريخ
ل انبوب مستطيل المقطع يبرد بواسطه يهدف هذا البحث الى دراسه خصائص انتقال الحراره داخ
فالهواء الخارج من الفوهه يتم توجيهه . مصفوفه من المنافث المماسيه وذلك عن طريق التجارب العمليه والنسب البعديه للمجرى توجيه المنفثتم دراسه تأثير . على السطح الساخن ثم يخرج فى االتجاه القطرى
9/5 ≤≤ dH 8/4بعد المنفث عن السطح وايضا نسبه ≤≤ dS مع مصفوفه احاديه من المنافث ذات 10000Re5000 فى حدود 2 و 1 للسطح رقم رينولدآما تم دراسه تأثير . مسافات متساويه فيما بينها ≤≤ j
18800Re9300 فى حدود 4 و 3و 2ولالسطح ≤≤ j . انتقال الحراره تم وتأثير قطر الفوهه على توزيع . سنتيميتر1 و 0.5دراسته ايضا لقطرين
يسبب حدوث سريان متقاطع يوثر بشكل آبير على توزيع قيمه توجيه السريانوقد اوضحت النتاثج ان
. للمنفث على طول سطح التبريدرقم رينولد مع زياده قيمه رقم ناسلتتزداد قيم . على السطحرقم ناسلت تأثرا ملحوظا مع قيم النسبه البعديه للمجرى ونسبه مسافه الفوهه من قم ناسلتروآذلك يتأثر قيمه
تم الحصول على قيم النسب البعديه التى تعطى اعلى انتقال حراره على آل االسطح وبالمثل تم . السطحاآبر . الحصول على قيمه نسبه بعد المنفث عن السطح التى تعطى اعلى انتقال حراره على آل االسطح
تم تطوير . تم الحصول عليه لموضع السريان الذى يجعل السريان يخرج فى آال الجهتينلرقم ناسلتيم ق . للمنفث لجميع االسطحرقم رينولد المتوسطه آداله فى رقم ناسلتعالقات رياضيه تعطى قيم
الماجستيرةدرج الملك فهد للبترول والمعادنةجامع
ةسعودي الة العربية المملك-الظهران م2005مارس

xix
NOMENCLATURE
icpA , Area of the copper plate [m2]
d Diameter of the orifice jet [m]
ih Local convective heat transfer co-efficient [W/m2K]
H Width of the feeding channel [m]
I Current supplied to heater [Amp]
airk Thermal conductivity of air [W/m.K]
woodk Thermal conductivity of wood [W/m.K]
l Length of the copper plate [m]
Nu Local Nusselt number
avgNu Average Nusselt number
sNu Smooth tube average Nusselt number "q Heat flux from the heater [W/m]
icpQ , Heat input for each copper plate [W]
iactualQ , Actual heat released from target surface [W]
icondQ , Heat lost due to conduction [W]
iradQ , Heat lost due to radiation [W]
itotalQ , Total heat input [W]
jRe Jet Reynolds number
R Resistance of the heater [Ohms]
S Jet-to-plate distance [m]
t Thickness of wood block behind the heater [m]
inT Inlet temperature [ºC]
isT , Surface temperature [ºC]
surrT Temperature of the surroundings [ºC]
wT Wood block temperature [ºC]
i Index number for copper plate
U Uncertainty

xx
V Voltage supplied to the heater
avgV Average velocity of all jets
w Width of the copper plate
∀ Volume flow rate
X Distance in the x-direction
Subscript
cp Copper plate
i Index number for each copper plate j Jet
w Wood
Greek
ε Emissivity
σ Stefan- Boltzman constant

1
CHAPTER 1
INTRODUCTION
1.1 General Introduction
Modern gas turbines operate at high temperatures (on the order of Cο1400 ) to
achieve high thermal efficiency. The continuing trend toward higher inlet temperatures in gas
turbine engine development has resulted in increasing heat loads to turbine components. The
development of new materials as well as cooling schemes has seen the rapid growth of the
turbine inlet temperature (firing temperature) leading to high turbine efficiencies. Operating
gas turbines under such severe conditions causes high thermal stresses in the blade structure,
oxidation, creep rupture and in extreme cases melting which results in reduced blade
operation life. In general turbine blades, in order to withstand the higher inlet temperature of
the turbines must either be made from similar materials or have superior cooling designs or
both. No suitable material is presently available that can withstand the high level of thermal
stress in a hot operating environment of turbines. Therefore, standard metal blades with
special cooling techniques are used. Sophisticated external and internal cooling techniques
for turbine blades are needed to prevent the blades from burning away. In a typical gas
turbine, the blades are cooled with air from the air compressor.

2
Combustor
coolingsteamloopClosed
TurbineCompressor
aircooling
coolingairloopclosed ""
Figure 1.1 Schematic of a Gas turbine (Fred Thomas [46])

3
Recent advanced industrial gas turbines have been designed with so-called closed-loop blade
cooling shown in figure 1.1, in which air, or even steam, are used for blade cooling and then
routed to the combustor, in the case of air-cooled blades, or to a steam turbine, in the case of
steam-cooled blades. In the case of cooling the cool air is bled from the compressor and is
directed to the stator, the rotor, and other parts of the turbine rotor and casing to provide
adequate cooling. The effect of coolant depends on the aerodynamics depends on the type of
cooling involved, the mainstream temperature, the location and direction of coolant injection,
and the amount of coolant being used. A number of these factors are being studied
experimentally and numerically in the past few decades.
1.1.1 Types of Cooling
In high temperature gas turbines cooling systems need to be designed for turbine blades,
vanes, end walls, shroud, and other components to meet metal temperature limits. Different
types of air-cooling techniques are being employed in the past and are being used today.
Major advances have been made in incorporating cooling in aircraft bas turbines. The air-
cooling technique can be classified as follows
1. External cooling (For external stream temperature Kο1600> )
a. Local film cooling
b. Full-coverage film cooling
c. Transpiration cooling
2. Internal cooling (For external stream temperatures of Kο16001300 − )
a. Convection cooling
b. Impingement cooling

4
c. Internally air-cooled thermal barrier
1.1.2 Overview of a Turbine Blade
A typical turbine blade cooling arrangement is shown in figure 1.2. Non-uniform heat
loads are generated along the blade surface when hot gases impinge on the blade. The coolant
( Cο650 ) for the blades is air extracted from the compressor of the engine. Coolant passages
of different geometry are constructed inside the blade. Jet impingement, convection, and pin
fin cooling are widely used to remove excess heat loads from the blades as discussed above.
Roughness elements such as ribs are widely used to augment heat transfer inside the coolant
passages. Jet impingement cooling is widely used to augment the heat transfer inside the
coolant passages. Jet impingement cooling is widely used from the leading edge to the mid-
chord region of the blade, convection cooling is used in the mid-chord section, and pin fin
cooling is used in the trailing edge region of the blade. Film cooling minimizes the heat from
entering the blade surface. This is achieved by bleeding air from the coolant passages and
ejecting the coolant into the mainstream flow. Air extracted from the compressor to cool
turbine blades is expensive and ejection of coolant into the mainstream flow results in mixing
pressure losses. Therefore, it is important to optimize the use of coolant and also efficiency
design cooling schemes to reduce the thermal stresses in the blade structure and increase the
overall efficiency of the gas turbine engine.

5
Figure 1.2 A typical turbine blade cooling arrangement

6
1.2 Jet Impingement
Impingement heat transfer is considered as a promising heat transfer enhancement
technique. Jet impingement cooling systems have been used in advanced gas turbine engines,
which operate at a high temperature Cο15001300 − to improve thermal efficiency, and power
output. Among all convection heat transfer enhancement methods, it provides significantly
high local heat transfer coefficient. At the surface where a large amount of heat is to be
removed /addition, this technique can be employed directly through very simple design
involving a plenum chamber and orifices. The cooling air is blasted on the inner surface of
the airfoil by high-velocity air jets, permitting an increased amount of heat to be transferred
to the cooling air from the metal surface. For instance, in gas turbine cooling, jet
impingement heat transfer is suitable for the leading edge of a rotor airfoil, where the thermal
load is highest and a thicker cross-section enables accommodation of a coolant plenum and
impingement holes. This cooling method can be restricted to desired sections of the airfoil to
maintain even temperatures over the entire surface. For instance, the leading edge of the
blade needs to be cooled more than the mid-chord section or trailing edge, so the gas is
impinged. A major shortcoming of the convection cooling method is that this method does
not always cool effectively the leading edge of the blade. This problem can, however, be
improved by applying impingement cooling at the leading edge as show in figure 1.3.
‘Impingement’ means ‘collision’ that the coolant flow collides into the target surface and
guarantees a thin stagnant boundary layer at the stagnant core for cold coolant contacting the
hot surface without damping. Jet impingement cooling (or heating as well) is a very effective

7
Figure 1.3 Schematic of impingement cooling arrangement in a first-stage turbine inlet guide
vane.

8
heat transfer mechanism. The main reason is that jet impingement flow forms a very thin
boundary layer.
In jet impingement technique the cooling air is forced radially through a center core
of the blade, then turned perpendicular to the radial direction, and passed through a series of
holes so that it impinges on the inside of the blade. This method is very effective locally and
is well studied for the leading edge where the outside surface of the blade is approached by
the impinging very hot gas.
This technique is also employed in turbine guide vanes (stators). Other applications for jet
impingement could be combustor chamber wall, steam generators, ion thrusters, tempering of
glass, electronic devices cooling and paper drying, etc.
Figure 1.3 illustrates how jet impingement cooling is employed in a vane airfoil. This
is a typical jet impingement configuration for gas turbine vanes that consists with two
chambers separated by a perforated wall. One chamber is pressurized with coolant air.
Through the perforated wall, the opposite wall of the other chamber experiences
impingement heat transfer effect. Typically, more than one heat transfer enhancement
methods are used in the airfoils to protect it from being over-heated.

9
1.2.1 Literature review
This section presents an overview of the current knowledge of the flow and heat
transfer of multiple impinging jet arrays. The hydrodynamics of multiple jet heat transfer are
discussed in this section. The dependencies of the Nusselt number on geometrical parameters
and the Reynolds number are discussed on the basis of non-dimensional correlations. Next, a
short literature survey is presented on the category of rib roughened surfaces and the jet
impingement mechanism.
The flow from impinging jets in an array has the same three flow regions as single
impinging jets. However, there are some basic differences in the fluid mechanics of single
and multiple jets. Two types of interactions that do not occur in single jets may influence the
individual jets that make up a multi-jet system. First, there is possible interference between
adjacent jets prior to their impingement on the surface. The likelihood of such interference
effects is enhanced when the jets are closely spaced and when the distance between the
nozzle and the impingement plate (nozzle-to-plate distance) is relatively large. Second, there
is an interaction due to collision of wall jets associated with the adjacent impinged jets. These
collisions are expected to be of increased importance when the jets are closely spaced, the
nozzle-to-plate distance is small, and the jet velocity is high (Viskanta [43]).
Finally, the spatial arrangement of the nozzles in the array has an influence on the
flow characteristics of multiple impinging jets. There are numerous possible spatial

10
arrangements of the nozzles in an array. Figure 1.4 shows the three most common
arrangements for round nozzle arrays. The number of nearest neighbors of each nozzle and
the impinged area per nozzle differ per arrangement. Therefore, the arrangement of the
nozzles determines the way the jets interact with each other.

11
Figure 1.4 Three commonly used nozzle arrangements for impinging jet arrays.
12
Figure 1.5 Definitions of the cross-flow schemes investigated by Obot and Trabold [37]

13
Many researchers have contributed their efforts towards better understanding of
Impingement cooling. Studies on impingement heat transfer enhancement technique focused
on single jet impingement and then expanded to impingement jet arrays. The cross-flow is
another important parameter that affects jet impingement heat transfer performance. Cross-
flow is the spent jet flow upstream of the local jet and reinforced by the local jet flow after its
impingement. Strong cross-flow is a non-desirable factor in impingement heat transfers,
because cross flow tends to push the impinging airflow downstream and dilutes the
impinging jet intensity. However, for cross flow velocity less than 10% of the jet average
velocity, the surface heat transfer is enhanced. For any impingement jet array situations,
cross flow is inevitable. Some studies have shown how cross flow affects heat transfer. These
studies presented correlations that account for regular arrays of impingement jet holes with
low to moderate cross flow effect. Both correlations show monotonous decreases in Nusselt
number with stronger cross flow.
Chupp et al [6] evaluated the heat transfer coefficient for impingement cooling on the
leading edge of the turbine blade. They developed dimensionless empirical correlation,
which predicts heat transfer for impingement cooling with cross flow, with fixed geometry
and location and with the only variation of Reynolds number.
Metzger et al [36] studied the heat transfer characteristics for inline and staggered
arrays of circular jets with crossflow of spent air. They had the same mass flow rate through
each jet used for cooling. Heat transfer characteristics were presented based on the jet hole

14
diameter. Nusselt numbers are presented as a function of four geometric parameters; channel
height (z/d), chordwise and spanwise hole spacing (x/d and y/d) and the hole pattern. For 1 ≤
z/d ≤ 3, Nusselt numbers increase with channel height, for the same Reynolds number, for
upstream and for downstream the reverse is true. They suggest that the effect on Nusselt
number is more pronounced for the spanwise hole spacing. Nusselt numbers reach a
minimum as far upstream as the second or third row of holes after which the values increase
continuously. This possibility is significant since the implication of several prior studies of
similar prior studies of similar flow configurations is that increasing the crossflow always
tends to degrade the heat transfer performance.
Florschuetz et al, [13-14] performed experimental and theoretical investigations for
stream wise distributions of jet and cross flow velocities and measured the heat transfer
characteristics for inline and staggered arrays of circular jets impingement with initial cross
flow. Their results show that the initial cross flow lowers the impinging heat transfer
performance. As the initial cross flow rate increases, convective heat transfer will be more
dominated by the cross flow. They presented the characteristics periodic variations as a
function of geometric parameters, including the effect of hole pattern. They also presented
correlations for both inline and staggered hole patterns with cross flow.
Bunker and Metzger [35] conducted an experimental study to evaluate the heat
transfer coefficient in the leading edge region of a turbine blade with out film extraction.
The various parameters covered in their study are jet Reynolds number, jet spacing and jet

15
travel distance. The conclusions given by them are the heat transfer increase is by decreasing
the leading edge sharpness and by less jet travel distance, further conclusions are, the less jet
spacing induces high span wise heat transfer coefficient.
Goldstein and Behbahani [16] measured the heat transfer to an impinging air jet with
and without cross flow of air. The heat transfer co-efficient measurements were made for a
circular jet with a jet to plate spacing of 6 and 12 diameters in the presence of crossflow of
8.5m/s and 16.5m/s. The results specify that, at large jet-to-plate spacing the cross flow
diminish the peak heat transfer coefficient; at a smaller spacing cross flow increases the peak
heat transfer coefficient.
Huber and Viskanta [22] studied the effect of axisymmetric air jet arrays with spent
air exits located between the jets. The conclusions made by them are the decrease in jet
spacing causes less jet interference before impingement and the heat transfer coefficients are
same for single and array type jets. To maintain a uniform heat transfer over the entire
surface covered by a jet array the spent air exits are mandatory.
Huber and Viskanta [23] studied the heat transfer from the target plate perimeter and
center jet impingement in a confined impinging array of axisymmetric air jets. The results of
their study were the wall jets for the perimeter orifices have high rates of heat transfer where
as the centre jets having a resistance from the surrounding orifices do not have comparatively

16
high heat transfer. The difference between the heat transfer rates for the centre and perimeter
jets were resulted to be less than 12 %.
Huang et al [21] experimentally investigated the detailed heat transfer coefficient
distributions under an array of impinging inline jets under three different cross flow
directions using the transient liquid crystal technique. They had 12 rows of 4 circular holes
on the orifice plate and the distance between the jet orifice plate and the impingement target
surface was set to three times the diameter of the jet hole. They studied the Nusselt number
distribution for Reynolds numbers 4800, 9550, 12800 and 18300. The results discussed by
them are, when the spent flow has an opposite direction to incoming flow, Nusselt number
peak occurs at leading section of the heat transfer target wall. When spent flow has the same
direction as the incoming flow, the Nusselt number at the trailing part will be slightly higher
than the leading part, but with an overall performance of 40% lower. One more important
conclusion given by them is when both directions are allowed for spent air removal; Nusselt
number is uniformly high, and this case is said to be the best case. They have successfully
correlated the overall average Nusselt number with Reynolds number.
Hollworth and Dagan [20] conducted experiments on geometry by removing spent
airflow right after impinging in order to reduce the cross flow. They drilled holes on the
target plate at the same position with impingement jet holes and the positions in between.
The tests conducted by them for both inline arrangements and for staggered arrangements,
the latter always yielded higher average heat transfer. They reported 20-30% higher heat
transfer rate compared with side venting case. Ekkad [12] also studied a jet impingement

17
plate with holes to reduce cross-flow effect. They saw that the presence of holes on target
surface increases overall heat transfer

18
1.2.1.1 Effect of nozzle-to-plate distance
It appears that multiple jet arrays with low values of DH / produce high area-
averaged heat transfer coefficients. Metzger et al. [35] found a maximum average Nusselt
number at 0.1/ =DH , for values of the pitch between 1.67 and 6.67. Huber and Viskanta
[23] explain that the major degradation of the heat transfer coefficient for the jets in an array
is due to adjacent jet interactions, which occur before impingement. These interactions
increase the decay of the jet velocity and the entrainment of surrounding air (see also
Kataoka [29]). At smaller separation distances, adjacent jet interactions are strongly reduced
due to the smaller distance for the interactions to occur.
Gardon and Cobonpue [15] have found a correlation of the form
375.0625.0625.0 )/()/(Re993.0 −−= DSDHNuavg … (2.4)
Where avgNu is the area averaged Nusselt number. The DH / dependence is strong, due to
the interaction between adjacent jets.
1.2.1.2 Effect of cross-flow
Obot and Trabold [37] have investigated the influence of cross-flow on multiple
impinging jet heat transfer. Three cross-flow schemes, named minimum, intermediate, and
maximum cross-flow, were investigated. The definition of these schemes is shown in figure

19
1.5. Obot and Trabold [37] found that cross-flow lowers heat transfer coefficients, because
spent fluid from upstream jets in an array can sweep away the downstream jets and delay
impingement. Additionally, they found that the magnitude of this effect increases with
increasing nozzle-to-plate distance. The parameters 1α , 2α , and 3α in the non-dimensional
correlation
32 )/()/(Re 8.01
ααα DSDHNuavg = … (2.6)
are dependent on the cross-flow scheme used. The values of 3α could be stated as 0.815,
0.676, and 0.595 for minimum, intermediate, and maximum cross-flow, respectively. The
value of 2α depends on the pitch and the cross-flow scheme used. The exponent is more
negative for strong cross-flow and small values of the pitch. Matsumoto et al. [34]
investigated heat transfer from an impinging jet array with the same cross-flow schemes.
Their results agree well with the theory of Obot and Trabold [37].
Hwang et al [25] experimentally investigated the effect of outflow orientation on heat
transfer and pressure drop characteristics in a triangular duct cooled by array of tangential
jets using the transient liquid crystal technique. Three different outflow orientations were
studied similar to Huang et al [21]. They used higher range of Reynolds numbers,
12600≤Re≤42000 for this study. For the outflow orientations of the spent air flowing in the
same direction of incoming flow and in the opposite direction of incoming flow, jet flow rate
increases with the axial distance and the high jet flow rate near the downstream end is

20
induced by the significant crossflow of low static pressure. They describe that the case for the
outflow in both directions has a uniform jet flow rate because of the less crossflow. They
suggest that among all the three cases, the case with the outflow in both directions has
moderate pressure loss. They developed empirical correlation for Nusselt number in terms of
Reynolds number for three different outflow orientations for the first time.
Hwang et al [26] carried out an experimental investigation on the jet spacing effect on
the Impingement heat transfer in a triangular duct with a tangential jet array using the
transient liquid crystal technique. Their test section and outflow orientations are similar to
that of Hwang et al [25]. They studied the effect of jet Reynolds number (3000≤Re≤12600)
and jet spacing (1.5≤s/d≤6.0). They stated that with the same jet velocity, decreasing the jet
spacing increases the local heat transfer coefficient and for the same flow rate, reducing the
jet spacing reduces the heat transfer enhancement near the leading-edge apex. They also
stated that as the Reynolds number is increased the heat transfer on both the walls of the
triangular duct increases.
Pramanick et al [39] carried the detailed numerical analysis on flow predictions in a
two-pass channel connected by one or two holes on the divider walls with heat transfer
enhancement by impingement and swirl. They replaced the conventional design with 180° U-
bend by the divider plate with series of straight and angled circular holes. Two configurations
studied by them had one and two rows of 12 holes equally spaced axially. The analysis was
presented for Reynolds number equal to 25000. The enhanced cooling as said by them was

21
obtained by the combination of impingement and cross-flow induced swirl. They also
described that the production if impingement inside such channels with additional swirl
generation provides high velocity air to contact the hot surfaces of the channels and removes
heat more effectively than traditional rib turbulator channel.
1.3 Motivation to investigate
Many researchers, so far, have studied internal forced convection cooling of a gas
turbine rotor blade. They focused mainly on the effects of Reynolds number and the internal
geometry of the heat transfer surface and pressure drop in the uniformly heated square and
rectangular channels. Moreover concentration of many researchers was on the rectangular
channel separated by an orifice plate with number of arrays of jets to cool the leading edge
region of a gas turbine blade. All the studies showed that there is good amount of heat
transfer with this kind of an arrangement. However, with the advancement of gas turbine
technology, it became necessary to focus on the regions exposed to the most severe thermal
conditions, leading and trailing edge regions as shown in figure 1.2 in the Introduction
chapter. In particular, the leading edge region, due to the exposure to high temperatures and a
thicker cross-section of this portion of the blade can suitably accommodate for impingement
cooling. Jet impingement mechanism is commonly used to cool the leading edge region.
Apart from impingement, crossflow is also of great significance in this process of cooling.
The outflow openings cause different types of crossflow, which leads to the heat transfer
enhancement. Normally in the previous studies, a multiple array of jets were used for cooling
process, using this kind of arrangement of multiple arrays causes a huge amount of pressure
drop across the impingement orifice plate. The heat transfer characteristics were presented

22
with this kind of an orifice plate arrangement. To accomplish/attain the least pressure drop
across the orifice plate, which leads to an increase in the velocity and thus the heat transfer,
an orifice plate with a single array of equally spaced jets was used. This orifice plate is being
used to study the jet impingement heat transfer characteristics on a heated target surface with
the crossflow generated by different outflow orientations.
The ability to numerically predict the effects of crossflow on the flow field and heat
transfer, either in stationary or a rotating frame is limited. Therefore many experimental
investigations have been conducted in order to determine those configurations which produce
the optimum results in terms of both heat transfer and pressure drop.
1.4 Objective of the present study
In the present experimental work for the first time, the effect of feeding channel width
on the heated target surface is being investigated with the combined effect of three different
outflow orientations and the impingement channel width. In the present study we have
studied the heat transfer characteristics of the heated target surface using the single array of
impinging jets. Three different orifice plate configurations are being studied namely
centerline, staggered and tangential arrangement.
The purpose of the present work is to study the effect of the outflow orientation and
feeding channel width on the heat transfer characteristics of the impingement heated target
surface using a single array of equally spaced jets on a orifice plate in a rectangular duct.
Moreover, the effects of jet-to-plate spacing 8/4 ≤≤ dS and the feeding channel width
9/5 ≤≤ dH on the heat transfer characteristics are also studied. Three different outflow
orientations are being studied to get different crossflow effects i.e., the exit flow

23
Case - 1 (Coincident with the entry flow),
Case - 2 (Opposing to the entry flow),
Case - 3 (Passes out in both the directions).
Tests were conducted with two orifice plates having jet size of diameter 0.5 and 1 cm.
The heat transfer characteristics are being studied by varying the jet Reynolds number in the
following range of 10000Re5000 ≤≤ j for orifice plate 1 and 2 and 18800Re9300 ≤≤ j
for orifice plate 2, 3 and 4 by applying the constant heat flux to the target surface.

24
CHAPTER 2
EXPERIMENTAL SETUP AND PROCEDURE
The experimental apparatus and methods followed are described in detail in the
section below. The turbine blade-cooling channel was modeled by a rectangular channel with
two channels separated by an orifice plate consisting of an array of equally spaced orifice jets
to cause a jet-impingement setup.
2.1 General set-up and Apparatus
The schematic of the experimental facility is depicted in figure 2.1. The test rig used
to study the heat transfer characteristics was manufactured using Plexi-glass. The test section
consists of two channels, impingement channel (10) and the feeding channel (9). Air enters
the test section in the feeding channel and is directed onto the heated copper plates in the
impingement channel to study the heat transfer characteristics. The target plates made of
copper were heated using a constant flux heater, which was controlled by a variable
resistance transformer. The other side of the heater was insulated to get the heat transferred
only in one direction i.e. onto copper plates. The mass flow rate of the compressed air (1)
entering the test section was passed through a settling chamber (2) and was controlled with
the help of valves (3) and the pressure regulators (5). The pressure drop across pressure
regulators was measured using the pressure gauges (4).

25
Gas flow meters (7) were used to measure the mass flow rate entering the test rig,
which were protected by the air filters (6) of 50μ capacities. The average surface temperature
of each of the copper plates was determined from the readings of two T-type thermocouples
installed in the grooves drilled at the back surface of the plates to within 1 mm of the surface;
the analog signals generated by these temperature sensors were transmitted to the signal-
conditioning unit (12), where they were selectively processed (the following operations were
performed on the signals generated by the thermocouples: linearization, cold junction
compensation, amplification). The resulting analog signals were converted into digital signals
by a DAQ card installed on the motherboard of a personal computer and recorded with an
application developed in Lab VIEW.
The supply pressure was regulated by a pressure gauge fixed after the settling
chamber at the entrance. The entrance pressure and mass flow rate to the test section was
regulated by a pressure reducer valve mounted after the first pressure gauge, the second
pressure gauge was used to measure the inlet pressure supply to the test section. There upon
air was passed through a set of air filters of 50μ capacities to make sure complete dry air
passes to the test section. The airflow rate was measured using the mass flow rate-measuring
device fixed after the air filters.

26
Figure 2.1 Schematic of the test section.

27
2.1.1 Construction details
Plexiglas was used in the construction of the test section and orifice plate 1cm in size
throughout. Plexiglas is a good choice of material for the following reasons.
1. It is very smooth, reducing anomalous flow behavior, thereby reducing the number of
variables affecting the analysis.
2. It is easier to machine. Metal would be smoother and would hold better accuracy in
sizing, but was conductive.
3. It is very easy to glue acrylic parts together.
4. It gives transparent, facilitating observation and various measurements.
The length of the test section is 106.54 cm. The width of the feeding channel is
considered as H, and the width of the impingement channel is taken as S. The jet plate
geometry was chosen with reference to the previous studies. As discussed above copper
plates were glued upon the heater, which was glued to the wood material to get one
dimensional heat transfer from the heater. Two T-type thermocouples were fixed inside the
wooden plate upon which the copper plates were glued, on the other side, to measure the heat
being lost by conduction from the copper plates. The top and bottom plates of the test
section, made from Plexi-glass, were fastened to the wooden bars with the help of nuts and
bolts. To avoid the leakage from this joint, between the wooden plate and the Plexi-glass
sheet, proper care was taken by using a rubber insulation of thickness 3 mm. This insulation
provided good bonding, without glue, between the wood and the Plexiglas material to avoid

28
the leakage of the air supply in the test section. A provision to move the copper plates’
assembly was given in the top and bottom faceplates by providing grooves to adjust the
assembly to an appropriate distance as desired.
The feeding channel aspect ratio was controlled by placing plates made of Plexiglas.
Three plates of thickness 1 cm each were used to control the aspect ratio of the feeding
channel. Plates were used as per the size requirements of the feeding channel. These plates
were fastened to the other wooden piece of the test section, with the help of nuts and bolts.
The leaks from the feeding channel were also controlled in the same manner as discussed
above in the impingement channel. The plates used to control the aspect ratio of the feeding
channel were short in size compared to the length of the test section, so as to have less
disturbance of the incoming air.
A leak test was then performed. This consisted of letting airflow at or above maximum
pressure, and squirting soapy water onto all areas where air leaks might occur. Even a small
leak could produce a noticeable soap bubble. After the model dried, the leaks were sealed by
applying silicone. This process was repeated until no leaks were found (usually after the
second leak test).
2.1.2 Test section
Figure 2.2 shows the three-dimensional sketch of the test section. The test section as
mentioned above consists of two channels, impingement channel and the feeding channel. It
consists of two compartments joined by the orifice plate, which has a single array of equally
spaced jets. The jet orifice plate thickness is taken equal to the jet diameter. There are 13

29
circular jets drilled on the orifice plate. The jet-to-jet spacing is twice the jet-hole diameter,
measure between the centers of the two consecutive jets. The length of the test section is
106.54 cm. The width of the feeding channel is considered as H, and the width of the
impingement channel is taken as S. The jet plate geometry was chosen with reference to the
previous studies. The test section is made of Plexiglas material. The impingement target
surface constitutes a series of copper plates, each with 4.1 × 4.2 cm in size, arranged in
accordance with the orifice jets, such that the impingement jet hits the geometric center of the
copper plate. The copper plates are separated from each other by 1 mm distance to avoid the
relative heat conduction between each other, thus dividing the target surface into segments.
The thickness of the copper plate is 0.5 cm.

30
Figure 2.2 Three-dimensional view of the test section for case 1.

31
2.1.3 Outflow orientation
Figure 2.3 shows the schematic of the three different exit outflow orientations, which
are obtained by changing the discharge openings. The upper chamber is called as the Feeding
channel and the lower chamber in which the jets impinge on the target surface is the
impingement channel. The flow develops in the open area provided in the feeding channel
before entering the jets. The exit of jets in three different outflow orientations from the
impingement channel creates different crossflow effects. The three different outflow
orientations are represented with case numbers as shown in the figure 2.3.

32
Figure 2.3 Illustration of three exit outflow orientations.
inAir
outAir
Case 1
Impingement jetorifice plateImpingement
target surface
inAir
outAir
Case 2
Impingement jetorifice plateImpingement
target surface
inAir
outAiroutAir
Case 3
Impingement jetorifice plate
Impingementtarget surface

33
2.1.4 Orifice plates
Four different orifice plate geometries were taken in the present study. As shown in
the figure 2.4, one plate was taken with orifice jets of diameter 1 cm and the other three
plates were manufactured with the orifice jet size of 0.5 cm. The orifice plates were also
manufactured from the Plexiglas material. Each plate has 13 holes of similar diameter of jets
equally spaced. The distance between the two consecutive orifice plates is 2 times the orifice
jet diameter for orifice jet of size cmd 1= whereas it is 4 times the orifice jet diameter for
orifice jet of size cmd 5.0= . Similarly the thickness of orifice plates is equal to the diameter
of the jet for orifice jet of size cmd 1= , whereas it is equal to twice the diameter of the
orifice jet for orifice jet diameter of size cmd 5.0= .

34
Figure 2.4 Orifice plate orientations considered in this study

35
2.1.5 Instrumentation and Data Acquisition
Instruments used in the current experimental investigation are being listed in table
2.1. The temperature of the copper plates was measured using the T-type thermocouples. The
thermocouples beads were in contact with the copper plate in a groove prepared at the back.
Temperature of each plate was monitored with two thermocouples mounted at the back. Thus
the temperature of the plate was taken as the average of the two readings. Figure 2.5 shows
the arrangement of the thermocouples mounted at the back of the copper plates. They are
fixed in a groove of 2.5 mm thick, care was taken that the thermocouple bead touches the
copper plate and is not left in air in the groove. The thermocouple was fixed to the copper
plate with the help of epoxy glue.
The thermocouple wires were 0.01” in diameter and were covered with 0.006” thick
Teflon insulation. All the 13 plates were fixed with same T-type thermocouples mounted at
the back in a groove. The other end of the thermocouples were connected to the terminal
block that allowed the transmission of data to the Data acquisition system.

36
Figure 2.5 Illustration of thermocouples mounted in a groove at the back of a copper plate.

37
Table 2.1 Instrumentation and software used for Data acquisition
Characteristics Manufacturer
FMA – 1600 mass flow meter Accuracy: +1% Omega
SCXI - 1000 chassis - National Instruments
SCXI - 1380 high accuracy
isothermal terminal block Accuracy: +0.5% National Instruments
SCXI - 1100 32-channel
isolated analog input module
Offset error
+1.5mV/gain, gain
error: +0.03%
National Instruments
Lab VIEW 7.0 - National Instruments
SAI - T thermocouples Accuracy: 0.3% Omega

38
The data signals from the thermocouples were sent to a National Instruments SCXI
(Signal Conditioning eXtensions for Instrumentation) signal-conditioning module. The
conditioned signals were sent to a data-acquisition (DAQ) card mounted in a Dell Personal
computer. The signals were read into the computer using the National Instruments LabVIEW
(Laboratory Virtual Instruments Engineering Workbench) instrument and analysis software.
A T-type virtual instrument (VI) feature in LabVIEW was used to convert the voltage signals
to pressures and flows.
A program written using the LabVIEW software enabled continuous readout of the
experimental data. The data was displayed on the computer screen in a virtual instrument
format configured especially for the experiment. This program records the data continuously
with the specified interval of time. Figure 2.6 shows the LabVIEW program that is being
used in the current study. The user could write the data continuously from the virtual
instrument to a log file upon a command. Flow levels were set manually using a digital flow
meter in combination with a control valve and were monitored by the LabVIEW program.
Current supply to the heater fixed at the back of the copper plates, used to heat at constant
heat flux, was controlled by the user through a AC power transformer (variable resistance
transformer) and displayed along with the other data. The resistance of the heater was
measured with the multi-purpose meter manufactured by OmegaR. Mass flow rate of the air
coming into the test section was measured using the Digital mass flow meters manufactured
by OmegaR. The instrument was already calibrated by the manufacturer, but to make sure the
calibration is correct the instrument was recalibrated.

39
Figure 2.6 Photograph of the program being used

40
2.2 Data Reduction
2.2.1 Reynolds number calculations
Average velocity of all the orifice jets is calculated using the following expression with total
area taken as the summation of areas of all the 13 jets on the orifice plate
∑∑==
∀=
∀=
∀= 13
1
213
1 4iii
totavg
dAAV
π
(2.1)
Where iA – Area of the jet
∀ – Volume flow rate of the fluid entering the test section.
The Jet Reynolds number is calculated using the formula
μρ dVavg
j =Re
(2.2)
The data reduction equation for the jet Reynolds number is taken as:
2
413
Red
ddVavg
πμρ
μρ
×
∀==
(2.3)
2.2.2 Nusselt number calculations
The area of each plate is calculated by:
wlAcp ×= (2.4)
The total area of all the 13 plates is calculated using the expression:

41
13,2,1,, ... cpcpcptotalcp AAAA +++= (2.5)
The total power input to all the copper plates was computed using the voltage and current the
former being measured across the heater.
VIR
VQtotal ==2
(2.6)
The heat flux supplied to each copper plate is calculated using
total
total
AQ
q =" (2.7)
The heater gives the constant heat flux for each copper plate. The heat supplied to each
copper plate from the heater is calculated using the following procedure
icpi AqQ ," ×= (2.8)
Where, i - the index number for each copper plate.
The heat lost by conduction through the wood and to the surrounding by radiation is depicted
in figure 4 and is estimated using the following equations for each plate.
tTT
AkQ wisicpwoodicond
)( ,,,
−= (2.9)
)( 44,,, surrisicpirad TTAQ −= σε (2.10)
The actual heat supplied to each copper plate is found by deducting the losses from the total
heat supplied to the heater.
)( ,,,, iradicondicpiactual QQQQ +−= (2.11)

42
The local convective heat transfer coefficient for each of the copper plate is calculated using
)( ,,
,
inisicp
iactuali TTA
Qh
−= (2.12)
The average temperature of the heated target surface isT , is obtained as the average of the
readings of the two thermocouples fixed in each copper plate. To calculate h, inT was
considered instead of the bulk temperature or the reference temperature. Based on the
literature available, Obot and Trabold [37] discussed that the heat transfer coefficients do not
exceed 10% with the adiabatic wall or the reference temperature RT to replace the inlet
temperature inT in heat transfer coefficient equation above. In principle, RT should be the
average recovery temperature measured at the target surface at actual crossflow temperature,
but it is difficult to measure in practical experiment. Therefore, in the present paper, the inlet
temperature of the air is used as the reference temperature. It is measured at the test section
inlet, where the air first enters the feeding channel.
The data reduction equation for the convective heat transfer coefficient is considered along
with the heat losses by conduction and radiation.
)(
)()(
)()(
)( ,
44,,
2
,1,
,,
,,
,
inis
inisinisw
total
iniscp
iradicondi
inisicp
iactuali TT
TTTTt
kARV
TTAQQQ
TTAQ
h−
−−−−=
−
+−=
−=
εσ (2.13)
The non-dimensional heat transfer coefficient on the impingement target surface is
represented by Nusselt number as, with the hydraulic diameter is taken as the diameter of the
orifice jet.
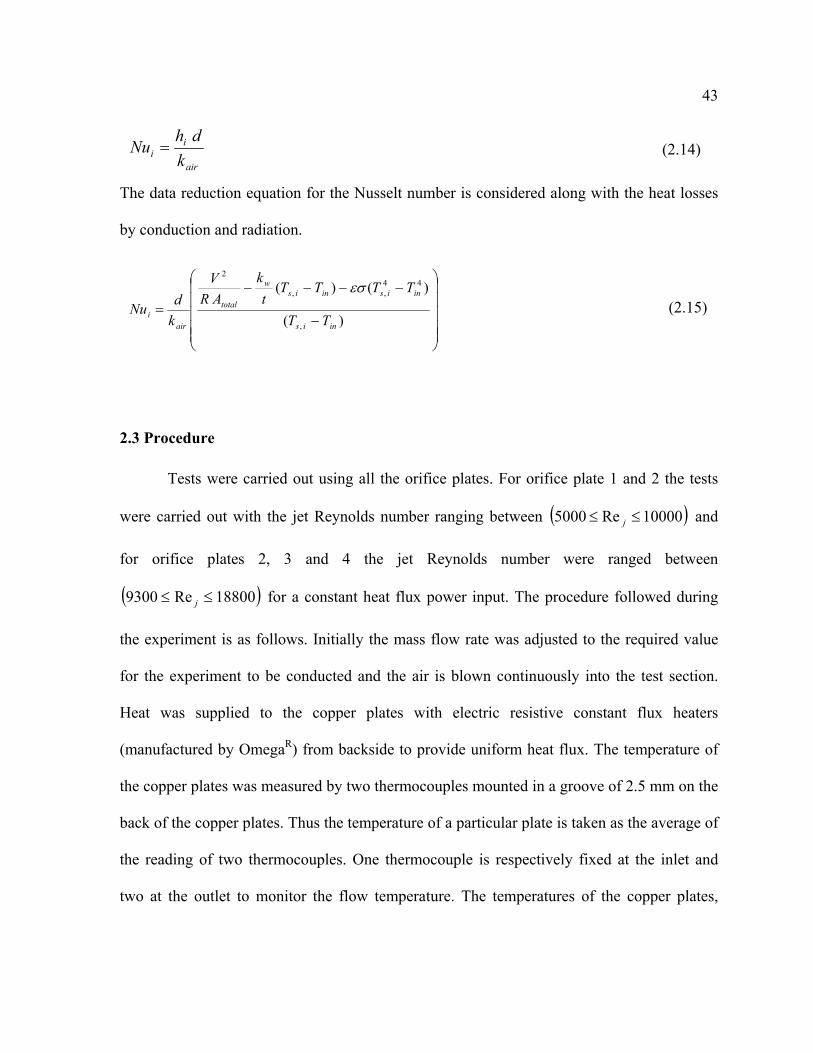
43
air
ii k
dhNu = (2.14)
The data reduction equation for the Nusselt number is considered along with the heat losses
by conduction and radiation.
⎟⎟⎟⎟⎟
⎠
⎞
⎜⎜⎜⎜⎜
⎝
⎛
−
−−−−=
)(
)()(
,
44,,
2
inis
inisinisw
total
airi TT
TTTTt
kARV
kdNu
εσ (2.15)
2.3 Procedure
Tests were carried out using all the orifice plates. For orifice plate 1 and 2 the tests
were carried out with the jet Reynolds number ranging between ( )10000Re5000 ≤≤ j and
for orifice plates 2, 3 and 4 the jet Reynolds number were ranged between
( )18800Re9300 ≤≤ j for a constant heat flux power input. The procedure followed during
the experiment is as follows. Initially the mass flow rate was adjusted to the required value
for the experiment to be conducted and the air is blown continuously into the test section.
Heat was supplied to the copper plates with electric resistive constant flux heaters
(manufactured by OmegaR) from backside to provide uniform heat flux. The temperature of
the copper plates was measured by two thermocouples mounted in a groove of 2.5 mm on the
back of the copper plates. Thus the temperature of a particular plate is taken as the average of
the reading of two thermocouples. One thermocouple is respectively fixed at the inlet and
two at the outlet to monitor the flow temperature. The temperatures of the copper plates,

44
pressure, temperature of the air at the inlet, the mass flow rate of the air were continuously
monitored. After the temperature of the copper plates reaches the steady state condition, all
the data was collected with Lab VIEW program. The Nusselt number was then calculated
based upon the collected data. The same procedure was repeated for the three outflow
orientations described in figure 3, with all the jet-to-plate distances ( )8/4 ≤≤ dS and
feeding channel aspect ratio ( )9/5 ≤≤ dH .

45
CHAPTER 3
UNCERTAINITY ANALYSIS
3.1 Introduction
An uncertainty analysis provides a powerful design tool for evaluating different
measurement systems and methods and for reporting measured data. It is a principal tool
used during the development of a test plan. In this chapter, a systematic approach to
identifying and quantifying errors that is used during the design, execution, and interpretation
of tests is presented.
As we know from our past knowledge that the measurement is the process of
assigning a value to a physical variable. The error in the measurement is simply the
difference between the true value of the variable and the value assigned by our measurement.
However, in any instrument, the true value is not known. Thus instead of the actual error, we
estimate the probable error in the measurement, called the uncertainty. Decreasing in the
range of the uncertainty means a more accurate result. It defines the interval about the
measured value within which we suspect the true value must fall. It is the process of
identifying and quantifying errors that is called uncertainty analysis.

46
3.2 Measurement Errors
Although no general discussion of errors can be complete in listing the elements
contributing to error in a particular measurement. In the discussion below errors are grouped
into two very general categories (Figliola, R.S. [47])
1. Bias error
2. Precision error.
In general, the classification of an error element as containing bias error, precision error,
or both can be simplified by considering the methods used to quantify the error. Treat an
error as a precision error if it can be statistically estimated in some manner; otherwise treat
the error as a bias error. If we consider the repeated measurement of a variable under
conditions that are expected to produce the same value of the measured variable. The
relationship between the true value and the measured data set, containing both bias and
precision errors, is illustrated in figure 3.1.
The total error in a single measurement is the sum of the bias and the precision errors in
that measurement. The total error contained in a set of measurements obtained under
seemingly fixed conditions can be described by an average bias error and a statistical
estimate of the precision errors in the measurements. Within a sample of many
measurements:
i. The bias errors will shift the sample mean away from the true mean of the measured
variable by a fixed amount.

47
ii. The precision errors bring about a normal distribution of measured values about the
sample mean.
Because accuracy deals with the difference between the true value and the measured value,
an accurate measurement has both small bias and precision errors.
The best estimate of the true value sought in a measurement is provided by its sample
mean value and the uncertainty (P%) in that value:
( )%' Puxx x±= (3.1)
Uncertainty is the method used to quantify the ux term.
The following assumptions are implicit in an uncertainty analysis:
1. The test objectives are known.
2. The measurement itself is a clearly defined process in which all known calibration
corrections for basis error have already been applied.
3. Data are obtained under fixed operating conditions.
It is expected that the user of the equipment have some experiences with the system
components.

48
Figure 3.1, Distribution of errors upon repeated measurements (Figliola, R.S. [47])

49
3.3 Uncertainty Evaluation Procedure
Uncertainty analysis equations used in the current experimental work are taken from
Coleman and Steele [7], which includes the precision, bias, and the resultant uncertainty. It is
stated by the authors that the bias errors are often neglected in books and articles on error
analysis or uncertainty analysis by a simple assumption that “all bias errors have been
eliminated by calibration”. Therefore we consider the precision uncertainty only to calculate
the amount of uncertainty in the current experimental investigation.
The method for performing the uncertainty analysis used in the present experimental
investigation is taken from Taylor B.N. [45] The theory for the current uncertainty analysis is
summarized in detail in the following discussion.
In many cases a dependent variable y is not measured directly, but is determined
from N other quantities Nxxxx ,......,,, 321 through a functional relation f
),......,,,( 321 Nxxxxfy = (3.2)
Included among the quantities ix are corrections, as well as quantities that take into account
other sources of variability, such as different observers, instruments samples, laboratories,
and times at which observations are made. The corrections that significantly affect the
measurement result are applied to compensate for each recognized systematic effect. The
correction may be either positive, negative, or zero.

50
The combined standard uncertainty of the measurement result y , designated by
)(yuc and taken to represent the estimated standard deviation of the result, is the positive
square root of the estimated variance )(2 yuc obtained from
)()( 22
1
2i
N
i ic xu
xfyu ∑
=⎟⎟⎠
⎞⎜⎜⎝
⎛∂∂
= (3.3)
It is of important note that the uncertainty equation is based on the first order Taylor series
approximation of ),......,,,( 321 Nxxxxfy = and is conveniently referred to as the law of
propagation of uncertainty. The partial derivatives ixf ∂∂ (often referred to as sensitivity
coefficients) evaluated at )( ixu which may be defined as the standard uncertainty associated
with the input estimate ix .
3.3.1 Uncertainty in Nusselt number
The data reduction equation for the Nusselt number is considered along with the heat losses
by conduction and radiation.
⎟⎟⎟⎟⎟
⎠
⎞
⎜⎜⎜⎜⎜
⎝
⎛
−
−−−−=
)(
)()(
,
44,,
2
inis
inisinisw
total
airi TT
TTTTt
kARV
kdNu
εσ (3.4)
Taking into consideration only the measured values, which have significant uncertainty, the
convective heat transfer coefficient is a function of:

51
),,,,,,,,,,,( ,, dkAkATTTTRVfNu airtotalwicpsurrwinisi ε= (3.5)
Thermal conductivity of wood, temperature of wood, temperature of the surroundings and
emissivity are not considered as the experiment is carried out in a controlled environment and
they contribute very less in the Nusselt number calculation. Temperature of the wood has a
very less effect on the uncertainty of heat transfer coefficient due to the large thickness of the
wood and also due to the insulation material attached to the wooden block. Temperature of
the surroundings also has a very less effect on the uncertainty as the work is carried out in a
controlled environment and the temperature of the surroundings is maintained within a
desired limit.
Thus the data reduction equation (3.5) reduces to the following simplified form
),,,,,( , dATTRVfNu totalinisi = (3.6)
The standard uncertainty in the Nusselt number neglecting the covariance is calculated using
( )22
22
,
222
, ,
⎟⎟⎠
⎞⎜⎜⎝
⎛∂
∂+⎟⎟
⎠
⎞⎜⎜⎝
⎛∂∂
+
⎟⎟⎠
⎞⎜⎜⎝
⎛∂∂
+⎟⎟⎠
⎞⎜⎜⎝
⎛
∂∂
+⎟⎠
⎞⎜⎝
⎛∂
∂+⎟
⎠
⎞⎜⎝
⎛∂
∂=
di
Atotal
i
Tin
iT
is
iR
iV
iNuc
ud
Nuu
ANu
uTNu
uTNu
uR
Nuu
VNu
U
total
inisi
(3.7)
Uncertainty propagation for the dependent variable in terms of the measured values is
calculated using the EES software. The measured variables 21 , xx etc have a random
variability that is referred to as its uncertainty, this uncertainty is displayed as xua ± . The

52
input to EES for calculating the uncertainty of a dependent variable is the magnitude of the
measured variable and the uncertainty in each measured variable.
3.3.2 Uncertainty in Jet Reynolds number
The data reduction equation for the jet Reynolds number is taken as:
2
413
Red
ddVavg
πμρ
μρ
×
∀==
(3.8)
Taking into consideration only the measured values, which have significant uncertainty, the
jet Reynolds number is a function of
),(Re df ∀= (3.9)
Density of air and the dynamic viscosity of air is not included in the measured variables since
it has negligible error in the computation of the uncertainty in jet Reynolds number.
( )22
2Re,
ReRe⎟⎟⎠
⎞⎜⎜⎝
⎛∂
∂+⎟⎟
⎠
⎞⎜⎜⎝
⎛∂∀
∂= ∀ d
jjc u
duU
j
(3.10)
Uncertainty propagation for the dependent variable in terms of the measured values is
calculated using the EES software. The measured variables 21 , xx etc have a random
variability that is referred to as its uncertainty, this uncertainty is displayed as xua ± . The
input to EES for calculating the uncertainty of a dependent variable is the magnitude of the
measured variable and the uncertainty in each measured variable. The Uncertainty results
obtained using EES displays the partial derivative of the calculated variable with respect to

53
each measured variable and the percentage of the total uncertainty in the calculated variable
resulting from the uncertainty in each measured variable.
Note: The percentage is calculated as the ratio of the square of the product of the partial
derivative and uncertainty in the calculated variable.
3.4 EES Program
Program to Calculate the Uncertainty in Nusselt number for a Tabular column T_s = 63.18 “[C]” R = 60.05 V = 77.69 “[V]” T_in = 21 “[C]” A_tot = 0.02386 “[m^2]” d = 0.005 “[m]” k_air = 0.0257 “[W/m K]” k_w = 0.087 “[W/m K]” T_surr = 21 “[C]” ep = 0.8 sig = 5.67e-8 A_cp = 0.00168 “[m^2]” t = 0.03 “[m]” T_w = 30.097035 “[C]” Vol = 458.77”[m/s]” ro = 1.225”[kg/s]” mu = 1.835*10e-5 A_tot1 = 10.2101*10e-4 “[m^2]” D_h = 0.01”[m]” Q_tot = (V^2/R) e_tot = Q_tot/A_tot Q_1 = e_tot*A_cp Q_cond1 = ((k_w/t)*A_cp*(T_s – T_w)) Q_rad1 = (ep*sig*A_cp*(T_s^4 – T_surr^4)) Q_actual1 = Q_1 – Q_cond1 – Q_rad1 h = (Q_actual1)/(A_cp*(T_s – T_in)) Nu = ((h*d)/k_air)

54
V_avg = (Vol*1.6667*10e-5)/A_tot1 Re = (ro*V_avg*d)/mu Program to Calculate the Uncertainty in Nusselt number for a single value T_s = 62.09489 “[C]” R = 60.05 V = 77.69 T_in = 21 “[C]” A_tot = 0.02386 “[m^2]” d = 0.005 “[m]” k_air = 0.0257 “[W/m C]” k_w = 0.087 “[W/m C]” T_surr = 21 “[C]” ep = 0.8 sig = 5.67e-8 A_cp = 0.00168 “[m^2]” t = 0.03 “[m]” T_w = 30.097035 “[C]” Vol = 458.77”[m/s]” ro = 1.225”[kg/s]” mu = 1.835*10e-5 A_tot1 = 10.2101*10e-4 “[m^2]” D_h = 0.01”[m]” Q_tot = (V^2/R) e_tot = Q_tot/A_tot Q_1 = e_tot*A_cp Q_cond1 = ((k_w/t)*A_cp*(T_s – T_w)) Q_rad1 = (ep*sig*A_cp*(T_s^4 – T_surr^4)) Q_actual1 = Q_1 – Q_cond1 – Q_rad1 h = (Q_actual1)/(A_cp*(T_s – T_in)) Nu = ((h*d)/k_air)

55
Program to Calculate the Uncertainty in Reynolds number for a Tabular column ro = 1.225”[kg/s]” mu = 1.835*10e-6 A_tot1 = 2.5545*10e-4 “[m^2]” V_avg = (Vol*1.6667*10e-5)/A_tot1 Re = (ro*V_avg*d)/mu Program to Calculate the Uncertainty in Reynolds number for a single value Vol = 458 d = 0.01 “[m]” ro = 1.225”[kg/s]” mu = 1.835*10e-6 A_tot1 = 2.5545*10e-4 “[m^2]” V_avg = (Vol*1.6667*10e-5)/A_tot1 Re = (ro*V_avg*d)/mu

56
3.5 Sample Uncertainty Calculations
3.5.1 Orifice Plate – 1
Table 3.1 Sample Uncertainty calculations of Nusselt number for minimum value
Variable ± Uncertainty Partial Derivative % of Uncertainty Nu = 12.14 ± 0.5964
cpA = 0.02386 ± 0.0001 (m2) cpANu ∂∂ = -529.6 0.79 % d = 0.01 ± 0.0001 (m) dNu ∂∂ = 2429 16.59 % R = 60.05 ± 1 (Ω) RNu ∂∂ = -0.2104 12.45 %
inT = 21 ± 2 (oC) inTNu ∂∂ = 0.1873 39.44 %
inT = 85.85 ± 0.3 (oC) sTNu ∂∂ = -0.1963 0.98 % V = 77.66 ± 1 (oC) VNu ∂∂ = 0.3253 29.76 %
Table 3.2 Sample Uncertainty calculations of Nusselt number for maximum value
Variable ± Uncertainty Partial Derivative % of Uncertainty Nu = 36.03 ± 3.5
cpA = 0.02386 ± 0.0001 (m2) cpANu ∂∂ = -1524 0.19 % d = 0.01 ± 0.0001 (m) dNu ∂∂ = 7206 4.24 % R = 60.05 ± 1 (Ω) RNu ∂∂ = -0.6056 2.99 %
inT = 21 ± 2 (oC) inTNu ∂∂ = 1.599 83.48 %
inT = 43.54 ± 0.3 (oC) sTNu ∂∂ = -1.624 1.94 % V = 77.66 ± 1 (oC) VNu ∂∂ = 0.9362 7.16 %
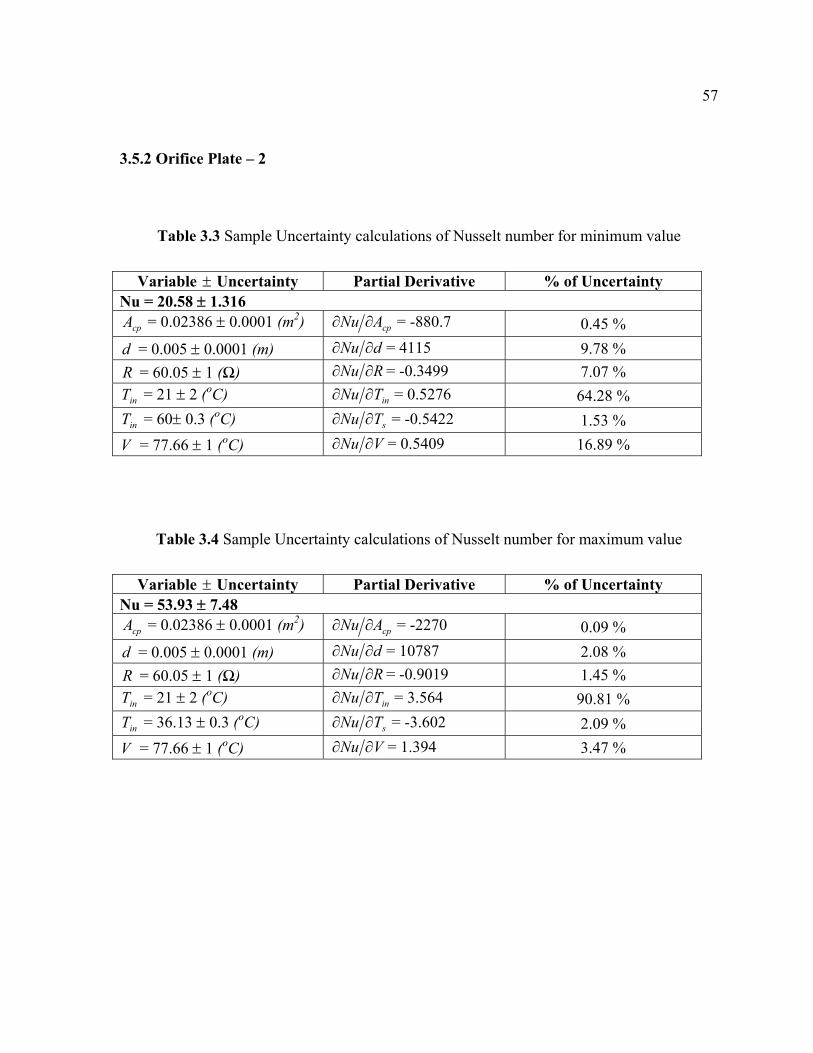
57
3.5.2 Orifice Plate – 2
Table 3.3 Sample Uncertainty calculations of Nusselt number for minimum value
Variable ± Uncertainty Partial Derivative % of Uncertainty Nu = 20.58 ± 1.316
cpA = 0.02386 ± 0.0001 (m2) cpANu ∂∂ = -880.7 0.45 % d = 0.005 ± 0.0001 (m) dNu ∂∂ = 4115 9.78 % R = 60.05 ± 1 (Ω) RNu ∂∂ = -0.3499 7.07 %
inT = 21 ± 2 (oC) inTNu ∂∂ = 0.5276 64.28 %
inT = 60± 0.3 (oC) sTNu ∂∂ = -0.5422 1.53 % V = 77.66 ± 1 (oC) VNu ∂∂ = 0.5409 16.89 %
Table 3.4 Sample Uncertainty calculations of Nusselt number for maximum value
Variable ± Uncertainty Partial Derivative % of Uncertainty Nu = 53.93 ± 7.48
cpA = 0.02386 ± 0.0001 (m2) cpANu ∂∂ = -2270 0.09 % d = 0.005 ± 0.0001 (m) dNu ∂∂ = 10787 2.08 % R = 60.05 ± 1 (Ω) RNu ∂∂ = -0.9019 1.45 %
inT = 21 ± 2 (oC) inTNu ∂∂ = 3.564 90.81 %
inT = 36.13 ± 0.3 (oC) sTNu ∂∂ = -3.602 2.09 % V = 77.66 ± 1 (oC) VNu ∂∂ = 1.394 3.47 %

58
3.5.3 Orifice Plate – 3
Table 3.5 Sample Uncertainty calculations of Nusselt number for minimum value
Variable ± Uncertainty Partial Derivative % of Uncertainty Nu = 16.1 ± 0.8946
cpA = 0.02386 ± 0.0001 (m2) cpANu ∂∂ = -694.3 0.60 % d = 0.005 ± 0.0001 (m) dNu ∂∂ = 3220 12.96 % R = 60.05 ± 1 (Ω) RNu ∂∂ = -0.2759 9.51 %
inT = 21 ± 2 (oC) inTNu ∂∂ = 0.3254 52.93 %
inT = 70.47± 0.3 (oC) sTNu ∂∂ = -0.3371 1.28 % V = 77.66 ± 1 (oC) VNu ∂∂ = 0.4264 22.72 %
Table 3.6 Sample Uncertainty calculations of Nusselt number for maximum value
Variable ± Uncertainty Partial Derivative % of Uncertainty Nu = 48.02 ± 5.992
cpA = 0.02386 ± 0.0001 (m2) cpANu ∂∂ = -2024 0.11 % d = 0.005 ± 0.0001 (m) dNu ∂∂ = 9604 2.57 % R = 60.05 ± 1 (Ω) RNu ∂∂ = -0.804 1.80 %
inT = 21 ± 2 (oC) inTNu ∂∂ = 2.829 89.16 %
inT = 37.97 ± 0.3 (oC) sTNu ∂∂ = -2.862 2.05 % V = 77.66 ± 1 (oC) VNu ∂∂ = 1.243 4.3 %

59
3.5.4 Orifice Plate – 4
Table 3.7 Sample Uncertainty calculations of Nusselt number for minimum value
Variable ± Uncertainty Partial Derivative % of Uncertainty Nu = 17.19 ± 0.9885
cpA = 0.02386 ± 0.0001 (m2) cpANu ∂∂ = -739.5 0.56 % d = 0.005 ± 0.0001 (m) dNu ∂∂ = 3437 12.09 % R = 60.05 ± 1 (Ω) RNu ∂∂ = -0.2938 8.84 %
inT = 21 ± 2 (oC) inTNu ∂∂ = 0.37 56.05 %
inT = 67.45± 0.3 (oC) sTNu ∂∂ = -0.3824 1.35 % V = 77.66 ± 1 (oC) VNu ∂∂ = 0.4542 21.12 %
Table 3.8 Sample Uncertainty calculations of Nusselt number for maximum value
Variable ± Uncertainty Partial Derivative % of Uncertainty Nu = 30.98 ± 2.659
cpA = 0.02386 ± 0.0001 (m2) cpANu ∂∂ = -1314 0.24 % d = 0.005 ± 0.0001 (m) dNu ∂∂ = 6195 5.43 % R = 60.05 ± 1 (Ω) RNu ∂∂ = -0.522 3.85 %
inT = 21 ± 2 (oC) inTNu ∂∂ = 1.185 79.41 %
inT = 47.15 ± 0.3 (oC) sTNu ∂∂ = -1.206 1.85 % V = 77.66 ± 1 (oC) VNu ∂∂ = 0.8069 9.21 %

60
3.5.5 Uncertainty in jet Reynolds numbers
Table 3.9 Sample Uncertainty calculations of Jet Reynolds number for 9300Re =j
Variable ± Uncertainty Partial Derivative % of Uncertainty Re = 9300 ± 185.907 ∀ = 458.8 ± 0.1 (lit/sec) Re∂ ∂∀ = 43.56 0.05 % d = 0.01 ± 0.0001 (m) Re d∂ ∂ = 1.995E+06 99.95 %
Table 3.10 Sample Uncertainty calculations of Jet Reynolds number for 14400Re =j
Variable ± Uncertainty Partial Derivative % of Uncertainty Re = 14400 ± 287.86 ∀ = 688.55 ± 0.1 (lit/sec) Re∂ ∂∀ = 21.78 0.05 % d = 0.01 ± 0.0001 (m) Re d∂ ∂ = 997441 99.95 %
Table 3.11 Sample Uncertainty calculations of Jet Reynolds number for 18800Re =j
Variable ± Uncertainty Partial Derivative % of Uncertainty Re = 18800 ± 375.84 ∀ = 688.55 ± 0.1 (lit/sec) Re∂ ∂∀ = 17.95 0.06 % d = 0.01 ± 0.0001 (m) Re d∂ ∂ = 1.6988E+06 99.94 %

61
Table 3.12 The derived parameters used to find the uncertainty.
Parameter Resultant Derivatives
VNu
∂∂
( ))(
2
inscpair TTAkRVd
−
RNu∂
∂ ( )
)(2
2
inscpair TTAkRVd
−−
sTNu
∂∂
2
443
)(
)()(
)(
4
inscpair
surrswsw
inscpair
sw
TTAk
TTTTt
kVId
TTAk
Tt
kd
−
⎟⎠⎞
⎜⎝⎛ −−−−
−−
⎟⎠⎞
⎜⎝⎛ −− σεσε
inTNu
∂∂
2
44
)(
)()(
inscpair
surrswsw
TTAk
TTTTt
kVId
−
⎟⎠⎞
⎜⎝⎛ −−−− σε
cpANu
∂∂
)(
)()(
2
44
inscpair
surrswsw
TTAk
TTTTt
kVId
−
⎟⎠⎞
⎜⎝⎛ −−−−
−σε
∂∀
∂ jRe dμ
ρ
d∂∂ Re 2dμ
ρ ∀−

62
CHAPTER 4
ORIFICE PLATE - 1
Jet impingement heat transfer is dependent on several flow and geometrical
parameters. The jet impingement Nusselt number is presented as a functional form of,
( )[ ]norientatiooutflowdH
dS
dXf
kdh
Nu jair
ii ,,,,Re=⎟⎟
⎠
⎞⎜⎜⎝
⎛= (4.1)
Where, jRe is the flow parameter, distance along the target surface dX / , and feeding
channel aspect ratio dH / are the geometric parameters. The flow exit direction is an
important parameter having a significant effect on impingement heat transfer. The jet inlet
condition is the direction in which the flow enters the impingement channel.
Figure 2.3 shows three outflow orientations where air comes into the feeding channel
and leaves through jets made in the orifice jet plate to impinge on the heated target surface
located in the impingement channel. For all the three cases air enters the feeding channel
at 15.57/ =dX . For case 1, air exits the impingement channel at low dX / )0/( =dX and
therefore the crossflow develops towards the exit. This case is typical of that seen by
Floursheutz et al [14]. For case 2, the flow exits the impingement channel at 15.57/ =dX
and as the flow moves forward from low dX / crossflow develops at low dX / and
increases towards large dX / )15.57/( =dX . For case 3, the flow exits the impingement

63
channel at both the directions i.e., at 15.570/ anddX = and the crossflow develops
towards both the ends of the test section.
Tests were carried out for three different outflow orientations with Reynolds number
ranging between 10000Re5000 ≤≤ j by varying the feeding channel aspect ratio )/( dH .
Three different values of the feeding channel aspect ratio 5.4/5.2 ≤≤ dH were considered
while carrying out the experiments.
Flow orientation affects the flow inside the impingement channel and leads into
different heat transfer characteristics. As air impinges on the target surface, crossflow starts
developing and grows continuously towards the exit resulting into thicker boundary layer,
which suppresses the jet impingement effect. In addition, crossflow causes distortion to the
jet impingement in which the jet is no longer impinging normally on the target surface.
All the results presented in this paper are for 15.57/0 ≤≤ dX over the entire span of
the target plates. Where X is defined from the opposite end of the feeding channel of the test
section as shown in figure 2.2. All the results presented below are being extracted using the
orifice plate with centerline jets of diameter 1cm.
The local Nusselt number distribution for all the three outflow orientations by varying
the jet-to-plate distance is presented in detail, as a function of non-dimensional location
dX / on the target surface for jet Reynolds number and the feeding channel aspect ratio
dH / in the forthcoming discussion.

64
4.1 Effect of feeding channel aspect ratio on local Nusselt number
Figure 4.1 – 4.3, gives a detail insight into the local Nusselt number distribution
presenting the effect of feeding channel aspect ratio 5.4/5.2 ≤≤ dH on the heat transfer
from the target surface. All the outflow orientations are discussed.
Figure 4.1 shows effect of feeding channel aspect ratio on the local Nusselt number
distribution over the entire length of the target surface for case – 1, where the flow exits at
low dX / )0/( =dX . The crossflow develops from large dX / to low dX / as the air exits
at low dX / . The heat transferred from the target surface decreases with an increase in
feeding channel aspect ratio from dH / = 2.5 to 4.5 for all the feeding channel aspect ratios
studied. Over the entire length of the target surface, the feeding channel aspect ratio
5.2/ =dH gives the maximum heat transfer for all the jet Reynolds numbers
10000Re5000 ≤≤ j studied. This is primarily due to the increase in the strength of the jets
with an decrease in the feeding channel ratios. Observing the effect of the feeding channel
aspect ratio on the local Nusselt number distribution for all the jet Reynolds numbers studied,
5.2/ =dH gives the maximum heat transfer among all the feeding channel aspect ratios
studied. 5.2/ =dH gives a margnial increase in the local Nusselt number compared to
5.3/ =dH , whereas 5.2/ =dH gives a maximum of 4% increase in local Nusselt number
is observed compared to 5.4/ =dH for all the jet Reynolds numbers studied. With an
increase in the feeding channel aspect ratio the difference in the magnitude of the local
Nusselt number also increases for an increase in the jet Reynolds number. Among all the
Reynolds numbers studied, 10000Re =j gives the maximum heat transfer. The local Nusselt
number distribution is more sensitive for higher values of jet Reynolds number compared to

65
the low values. As discussed earlier in figure 6, a peak of local Nusselt number at
2.40/ =dX is observed this is due to the flow entering the impingement channel at large
dX / , where the effect of crossflow is minimal. At 1.36/6.15 ≤≤ dX crossflow dominates
the impingement of jets and a linearly decreasing distribution of local Nusselt number is
observed towards the exit for all the feeding channel aspect ratios studied.
Figure 4.2 shows the effect of the feeding channel aspect ratio on the local Nusselt
number distribution for case – 2. For case – 2, the flow exits at low dX / )0/( =dX ,
causing crossflow development towards the exit. The magnitude of local Nusselt number
observed for case – 2 is less compared to the values of case – 1. 5.2/ =dH gives the
maximum heat transfer over the entire length of the target surface for all the jet Reynolds
numbers studied. For all the jet Reynolds numbers studied, 5.2/ =dH gives a marginal
increase in heat transfer from the entire length of the target surface compared to 5.3/ =dH
whereas 5.2/ =dH gives a maximum of 4.5% increase in heat transfer compared to
5.4/ =dH . It is also observed that the magnitude of the local Nusselt number increases with
an increase in the jet Reynolds number for all the feeding channel aspect ratios studied. The
variation in the local Nusselt number is more sensitive with respect to a change in feeding
channel aspect ratio at high jet Reynolds number whereas it is less sensitive at low jet
Reynolds numbers. At 15.57/2.40 ≤≤ dX the magnitude of local Nusselt number
decreases from 2.40/ =dX to 15.57/ =dX , this is due to the obstruction caused by the
crossflow to the impinging jets.
Figure 4.3 shows the effect of feeding channel aspect ratio on the local Nusselt
number distribution for case – 3. For case – 3 air exits at 0/ =dX and 15.57/ =dX , where

66
the crossflow has a predominant effect over the heat transfer characteristics. It is observed
that at 15/0 ≤≤ dX and 15.57/2.40 ≤≤ dX the local Nusselt number decreases towards
exit, this may be due to the crossflow at the exit and thus reduces the strength of the
impinging jets and the heat transferred from the target surface. The magnitude of local
Nusselt number at 1.36/6.15 ≤≤ dX is high compared to the other dX / locations this may
be due to the strong impingement of jets. For an increase in feeding channel aspect ratio a
corresponding increase in local Nusselt number is observed. 5.2/ =dH gives the maximum
values of feeding channel aspect ratio for all the jet Reynolds numbers studied. Considering
the effect of feeding channel aspect ratio for all jet Reynolds numbers on heat transfer
characteristics in detail, 5.2/ =dH gives the highest heat transfer similar to case – 1 and
case – 2. 5.2/ =dH gives a marginal increase in heat transfer compared to 5.3/ =dH ,
further 5.2/ =dH gives a maximum of 3% more heat transfer is observed compared to
5.4/ =dH . Similar to case – 1 and case – 2, with respect to the effect of feeding channel
aspect ratio on local Nusselt number characteristics it is observed that the local Nusselt
number is sensitive to a change in feeding channel aspect ratio at high jet Reynolds numbers.

67
10
20
30
40
Nu
H/d = 2.5 H/d = 3.5 H/d = 4.5
10
20
30
40
Nu
0 10 20 30 40 50 60
X/d
10
20
30
40
Nu
Rej = 5000
Rej = 7500
Rej = 10000
Figure 4.1 Effect of feeding channel aspect ratio 5.4/5.2 ≤≤ dH on local Nusselt number
distribution for case – 1 and jet-to-plate distance 3/ =dS .

68
10
20
30
40
Nu
H/d = 2.5 H/d = 3.5 H/d = 4.5
10
20
30
40
Nu
0 10 20 30 40 50 60
X/d
10
20
30
40
Nu
Rej = 5000
Rej = 7500
Rej = 10000
Figure 4.2 Effect of feeding channel aspect ratio 5.4/5.2 ≤≤ dH on local Nusselt number
distribution for case – 2 and jet-to-plate distance 3/ =dS .

69
10
20
30
40
Nu
H/d = 2.5 H/d = 3.5 H/d = 4.5
10
20
30
40
Nu
0 10 20 30 40 50 60
X/d
10
20
30
40
Nu
Rej = 5000
Rej = 7500
Rej = 10000
Figure 4.3 Effect of feeding channel aspect ratio 5.4/5.2 ≤≤ dH on local Nusselt number
distribution for case – 3 and jet-to-plate distance 3/ =dS .

70
4.2 Effect of jet Reynolds number on local Nusselt number
Figure 4.4 - 4.6 shows the local Nusselt number distribution for different jet Reynolds
numbers 10000Re5000 ≤≤ j , expressing the effect of the feeding channel aspect ratio on
the heat transfer from the heated target surface.
Figure 4.4 shows the local Nusselt number distribution plotted for case – 1, which
gives a detailed insight into the effect of the feeding channel aspect ratio. Three different
values of the feeding channel aspect ratios are considered in this part of the study
5.4/5.2 ≤≤ dH . The results are presented for three jet Reynolds numbers
10000Re5000 ≤≤ j . It is observed that for an increase in the jet Reynolds number there is a
corresponding increase in the magnitude of local Nusselt number. For case – 1, the flow exits
the impingement channel at low dX / )0/( =dX . A peak of local Nusselt number is
observed at 2.40/ =dX , this may be due to the strong impingement of jets as the air enters
the impingement channel at large dX / where the effect of crossflow is minimal resulting
into thinner boundary layer. Among all the feeding channel aspect ratios examined,
5.2/ =dH gives the maximum heat transfer for all the jet-to-plate distances studied.
5.2/ =dH gives a maximum of 5% increase in the local Nusselt number from the target
surface compared to 5.3/ =dH , whereas it gives a maximum of 7.6% more heat transfer
compared to 5.4/ =dH . At 1.36/6.15 ≤≤ dX uniformly decreasing heat transfer is
observed along the target surface for all the feeding channel aspect ratios studied, this is due
to the crossflow of the air which reduces the strength of the impinging jets. A considerable
increase in the Nusselt number is observed at large dX / ( 15.57/ =dX ) for 10000Re =j ,

71
whereas for 5000Re =j and 7500Re =j a uniform behavior of local Nusselt number is
observed this is due to the strong impingement at high velocities thus reducing the boundary
layer thickness which leads to high heat transfer.
Figure 4.5 shows the local Nusselt number distribution for case – 2 plotted for
different jet Reynolds numbers 10000Re5000 ≤≤ j by varying the feeding channel aspect
ratios 5.4/5.2 ≤≤ dH . For case – 2 air exits the impingement channel at 15.57/ =dX
opposite to the entry flow, this leads to the development of more crossflow towards
large dX / ( 15.57/ =dX ). Similar to the case – 1 an increase in jet Reynolds number leads
to a corresponding increase in local Nusselt number for all the dH / values studied. At large
dX / ( 15.57/ =dX ), the flow exits at this location causing greater amount of crossflow
obstructing the impingement of jets at this location, thus less magnitude of local Nusselt
number is observed. A uniform distribution of local Nusselt number is observed along the
entire length of the heated target surface except a peak of local Nusselt number at
2.40/ =dX which may due to the strong impingement of jets at that location. Although
similar behavior of local Nusselt number is observed for 5.2/ =dH and 5.3/ =dH , but
5.2/ =dH gives a marginal increase in local Nusselt number over the entire target surface
compared to 5.3/ =dH , whereas a maximum of 5.2% more heat transfer is observed over
the entire target surface is observed compared to 5.4/ =dH . The variation in the magnitude
of local Nusselt number is considerable for a change in jet Reynolds number from
5000Re =j to 7500Re =j for all the feeding channel aspect ratios studied, this is reflected
from the similar behavior of local Nusselt number. Whereas a marginal increase in the
magnitude of the local Nusselt number is observed for an increase of jet Reynolds number

72
from 7500Re =j to 10000Re =j . At 15.57/2.40 ≤≤ dX , a decrease in local Nusselt
number is observed from 2.40/ =dX towards the exit at 15.57/ =dX , this may be due to
the development of crossflow towards the exit, which obstructs the impingement of jets and
thickens the boundary layer. This behavior of local Nusselt number is observed for all the
dH / values studied.

73
10
20
30
40
50
Nu
Rej = 5000 Rej = 7500 Rej = 10000
10
20
30
40
50
Nu
0 10 20 30 40 50 60
X/d
10
20
30
40
50
Nu
H/d = 2.5
H/d = 3.5
H/d = 4.5
Figure 4.4 Effect of jet Reynolds number and feeding channel aspect ratio
5.4/5.2 ≤≤ dH on local Nusselt number distribution for 3/ =dS and case – 1.

74
10
20
30
40
50
Nu
Rej = 5000 Rej = 7500 Rej = 10000
10
20
30
40
50
Nu
0 10 20 30 40 50 60
X/d
10
20
30
40
50
Nu
H/d = 2.5
H/d = 3.5
H/d = 4.5
Figure 4.5 Effect of jet Reynolds number and feeding channel aspect ratio
5.4/5.2 ≤≤ dH on local Nusselt number distribution for 3/ =dS and case – 2.

75
Figure 4.6 presents the local Nusselt number distribution for case – 3 where the air
exits from both the directions at low dX / )0/( =dX and large dX / ( 15.57/ =dX ). It is
observed that the crossflow develops at both the exit directions, which reduces the heat
transferred from the target surfaces. Similar to case – 1 and case – 2, 5.2/ =dH has the
maximum heat transfer from the entire length of the target surface. 5.2/ =dH gives
minimum increase in heat transfer compared to 5.3/ =dH , whereas 5.2/ =dH gives a
maximum of 4.98% more heat transfer compared to 5.4/ =dH . The magnitude of local
Nusselt number between 1.36/6.15 ≤≤ dX and 15.57/2.40 ≤≤ dX is almost similar for
all the feeding channel aspect ratios dH / studied for case – 3, whereas for case – 1 and case
– 2 completely different distribution of local Nusselt number is observed. Similar to case – 1
and case – 2 the increase in the magnitude of the local Nusselt number for an increase in jet
Reynolds number from 5000Re =j to 7500Re =j is more compared to the increase from
7500Re =j to 10000Re =j .

76
10
20
30
40
50
Nu
Rej = 5000 Rej = 7500 Rej = 10000
10
20
30
40
50
Nu
0 10 20 30 40 50 60
X/d
10
20
30
40
50
Nu
H/d = 2.5
H/d = 3.5
H/d = 4.5
Figure 4.6 Effect of jet Reynolds number and feeding channel aspect ratio
5.4/5.2 ≤≤ dH on local Nusselt number distribution for 3/ =dS and case – 3.

77
4.3 Effect of outflow orientation on local Nusselt number
Figure 4.7 – 4.9 shows the effect of the outflow orientation on the local Nusselt
number distribution for different feeding channel aspect ratio 5.4/5.2 ≤≤ dH . All the jet
Reynolds numbers studied 10000Re5000 ≤≤ j are discussed individually.
Figure 4.7 presents the effect of the outflow orientation on the local Nusselt number
distribution plotted for different feeding channel aspect ratios 5.4/5.2 ≤≤ dH for
5000Re =j . Among all the dH / values studied very low variation of local Nusselt number
is observed with respect to outflow orientation at low dX / )1.16/0( ≤≤ dX . It is observed
that case – 3 has maximum heat transfer at 1.36/6.15 ≤≤ dX this is due to the strong
impingement in this region as the flow exits in both the directions. At 15.57/2.40 ≤≤ dX
case – 1 has the highest heat transfer due to the closed end and due to the less crossflow
effect resulting in stronger impingement reducing the boundary layer thickness followed by
case – 2 and case – 3 respectively. Case – 2 has the least values of local Nusselt number over
the entire length of the target surface for all the feeding channel aspect ratios studied. This
may be due to air exits in the opposite direction to the air coming in which in-turn causes
heavy crossflow and thus less values of local Nusselt number. Similar to the cases studied
before for the effect of feeding channel aspect ratio, 5.2/ =dH has the maximum heat
transfer over the entire length of the target surface.

78
10
20
30
40
50
Nu
Case - 1 Case - 2 Case - 3
10
20
30
40
50
Nu
0 10 20 30 40 50 60
X/d
10
20
30
40
50
Nu
H/d = 2.5, S/d = 3
H/d = 3.5, S/d = 3
H/d = 4.5, S/d = 3
Figure 4.7 Effect of outflow orientation and feeding channel aspect ratio 5.4/5.2 ≤≤ dH on
local Nusselt number distribution for 3/ =dS and 5000Re =j .

79
Figure 4.8 presents the effect of the outflow orientation on the local Nusselt number
distribution plotted for different feeding channel aspect ratios 5.4/5.2 ≤≤ dH for
7500Re =j . It is observed that as the jet Reynolds number increases from 5000 to 7500 a
maximum of 15% increase in local Nusselt number is observed. Similar to the local Nusselt
number distribution for 5000Re =j , case – 3 has maximum heat transfer at
1.36/6.15 ≤≤ dX due to the strong impingement of jets, whereas case – 1 and case – 2
gives less values of local Nusselt number due to the increase in the amount of the crossflow.
At 15.57/2.40 ≤≤ dX less variation in local Nusselt number is found as compared to
Nusselt number distribution for 5000Re =j , whereas the behavior of local Nusselt number
for case – 2 and case – 3 is almost similar as in both the cases air exits at large dX /
( 15.57/ =dX ) and for case – 3 air also exits at low dX / )0/( =dX . Similar to
5000Re =j , case – 1 has the highest magnitude of local Nusselt number at
15.57/2.40 ≤≤ dX and case – 2 has the least magnitude of local Nusselt number over the
entire length of the target surface for all the feeding channel aspect ratios studied. It is also
observed that the feeding channel aspect ratio 5.2/ =dH gives the maximum values of the
local Nusselt numbers compared to the other dH / values.
Figure 4.9 presents the effect of the outflow orientation on the local Nusselt number
distribution plotted for different feeding channel aspect ratios 5.4/5.2 ≤≤ dH for
10000Re =j . It is observed that, for 10000Re =j , a variation in the magnitude of local
Nusselt number values is observed over the entire length of the target surface for all the
outflow orientations studied compared to the other two jet Reynolds numbers, 5000Re =j

80
and 7500Re =j studied previously. Moreover as the dH / values increases from 2.5 to 4.5
a corresponding increase in the magnitude of local Nusselt number is observed. Maximum
heat transfer is observed for 5.2/ =dH similar to 75005000Re andj = where 5.2/ =dH
gives the maximum values of local Nusselt number. Similar to the other two jet Reynolds
number studied, at 1.36/6.15 ≤≤ dX , case – 3 has the highest magnitude of the local
Nusselt number compared to case – 1 and case – 2, whereas at 15.57/2.40 ≤≤ dX case – 1
has the highest heat transfer due to the stronger impingement of jets decreasing the boundary
layer thickness as the jets enters the impingement channel at this location thus having
minimum crossflow effect. The variation in magnitude of the local Nusselt number observed
at 15.57/2.40 ≤≤ dX for 10000Re =j is very high compared to the variation in the other
two jet Reynolds numbers 5000Re =j and 7500Re =j . The reason may be due to the
increase in the strength of the jets with an increase in the jet velocity which causes the
variation in the local Nusselt number to be less sensitive with respect to the outflow
orientation.

81
10
20
30
40
50
Nu
Case - 1 Case - 2 Case - 3
10
20
30
40
50
Nu
0 10 20 30 40 50 60
X/d
10
20
30
40
50
Nu
H/d = 2.5
H/d = 3.5
H/d = 4.5
Figure 4.8 Effect of outflow orientation and feeding channel aspect ratio 5.4/5.2 ≤≤ dH on
local Nusselt number distribution for 3/ =dS and 7500Re =j .

82
10
20
30
40
50
Nu
Case - 1 Case - 2 Case - 3
10
20
30
40
50
Nu
0 10 20 30 40 50 60
X/d
10
20
30
40
50
Nu
H/d = 2.5
H/d = 3.5
H/d = 4.5
Figure 4.9 Effect of outflow orientation and feeding channel aspect ratio 5.4/5.2 ≤≤ dH on
local Nusselt number distribution for 3/ =dS and 10000Re =j .

83
4.4 Effect of jet-to-plate distance on local Nusselt number
Figure 4.10 – 4.12, gives a detail insight into the effect of the feeding channel aspect
ratio 5.4/5.2 ≤≤ dH on the local Nusselt number distribution for different jet-to-plate
distances )4/2( ≤≤ dS with 10000Re =j for all the outflow orientations on the heat
transfer from the target surface. Jet Reynolds number 10000Re =j is selected as this gives
the maximum heat transfer among all the jet Reynolds numbers studied.
Figure 4.10 shows the local Nusselt number distribution over the entire length of the
target surface for case – 1, where the flow exits at low dX / )0/( =dX . The crossflow
develops from large dX / )15.57/( =dX to low dX / )0/( =dX therefore a
corresponding decrease in the heat transfer is observed from larger dX / to low dX / . The
above phenomenon is observed for all the dH / values 5.4/5.2 ≤≤ dH . The heat transfer
from the target surface decreases with an increase in jet-to-plate distance from dS / = 4 to 8,
this behavior is observed for all the feeding channel aspect ratios studied. Over the entire
length of the target surface, the jet-to-plate distance 2/ =dS gives the maximum heat
transfer and 4/ =dS gives the least heat transfer among all the dS / values and for all the
feeding channel aspect ratios studied. Observing the effect of the feeding channel aspect ratio
on the local Nusselt number distribution, 5.2/ =dH gives the maximum heat transfer for the
cases studied. 5.2/ =dH gives a maximum of 6% increase in local Nusselt number
compared to 5.3/ =dH , whereas a maximum of 11.8% more heat transfer is observed
compared to 5.4/ =dH . It is also observed that the magnitude of local Nusselt number at
15.57/2.40 ≤≤ dX is more compared to that at 1.36/6.15 ≤≤ dX , this is due to the strong
impingement of the jets and less crossflow effect as the flow first enters the impingement

84
channel at this location. At 1.36/6.15 ≤≤ dX crossflow dominates the impingement of jets
and leads to lesser magnitude of the local Nusselt number.
Figure 4.11 shows the effect of the jet-to-plate distance on the local Nusselt number
distribution for case – 2 comparing different feeding channel aspect ratios 5.4/5.2 ≤≤ dH
for 10000Re =j . For case – 2 the flow exits at low dX / )0/( =dX , which shows the
development of crossflow towards low dX / . Similar to case – 1, 2/ =dS has the
maximum heat transfer from the entire length of the target surface for all the dH / values
examined 5.4/5.2 ≤≤ dH . Among all the feeding channel aspect ratios studied,
5.2/ =dH gives the maximum amount of heat transfer from the entire target surface.
Although the Nusselt number distribution for 5.45.3/ anddH = is similar 5.2/ =dH has a
marginal increase in heat transfer from the target surface compared to 5.3/ =dH whereas a
maximum of 9.1% increase in heat transfer is observed compared to 5.4/ =dH . It is
observed that the local Nusselt number distribution for 9/ =dH is less sensitive for a
change in the jet-to-plate distance as the magnitude of local Nusselt number is similar with a
very less difference in magnitude. For the feeding channel aspect ratios 5.2/ =dH and
5.3/ =dH , the change in jet-to-plate distance has considerable variation on the local
Nusselt number distribution compared to 5.4/ =dH . The maximum variation in the
magnitude of the local Nusselt number for 5.45.3/ anddH = with respect to the jet-to-plate
distance is 5%.

85
10
20
30
40
50
Nu
S/d = 2 S/d = 3 S/d = 4
10
20
30
40
50
Nu
0 10 20 30 40 50 60
X/d
10
20
30
40
50
Nu
H/d = 2.5, Rej = 10000
H/d = 3.5, Rej = 10000
H/d = 4.5, Rej = 10000
Figure 4.10 Effect of jet-to-plate distance and feeding channel aspect ratio
5.4/5.2 ≤≤ dH on local Nusselt number distribution for 10000Re =j and case – 1.

86
10
20
30
40
50
Nu
S/d = 2 S/d = 3 S/d = 4
10
20
30
40
50
Nu
0 10 20 30 40 50 60
X/d
10
20
30
40
50
Nu
H/d = 2.5, Rej = 10000
H/d = 3.5, Rej = 10000
H/d = 4.5, Rej = 10000
Figure 4.11 Effect of jet-to-plate distance and feeding channel aspect ratio
5.4/5.2 ≤≤ dH on local Nusselt number distribution for 10000Re =j and case – 2.

87
Figure 4.12 shows the effect of the jet-to-plate distance on the local Nusselt number
distribution for case – 3 comparing different feeding channel aspect ratios 5.4/5.2 ≤≤ dH
for 10000Re =j . For case – 3 air exits at 0/ =dX and )15.57/( =dX , where the
crossflow has a predominant effect over the heat transfer characteristics. It is observed that at
15.57/2.40 ≤≤ dX the local Nusselt number decreases towards exit i.e. at large dX /
)15.57/( =dX for all the dH / values examined 5.4/5.2 ≤≤ dH . The heat transfer at
1.36/6.15 ≤≤ dX has less magnitude of local Nusselt number this may be due to the effect
of the crossflow dominating the strength of the impinging jets. For an increase in jet-to-plate
distance a corresponding decrease in local Nusselt number is observed. Investigating the
effect of feeding channel aspect ratio, 5.2/ =dH gives the highest heat transfer similar to
case – 1 and case – 2. 5.4/ =dH gives very less values of local Nusselt number compared
to 5.2/ =dH , further a maximum of 11% more heat transfer is observed compared to
5.3/ =dH . Among all the jet-to-plate distances investigated 2/ =dS gives the maximum
heat transfer over the entire length of the target surface, this is due to the strong impingement
of the jets, with less travel distance, which thins the boundary layer resulting in high values
of local Nusselt number. Whereas 4/ =dS gives the minimum values of the local Nusselt
number over the entire length of the target surface similar to the other two outflow
orientations discussed earlier.
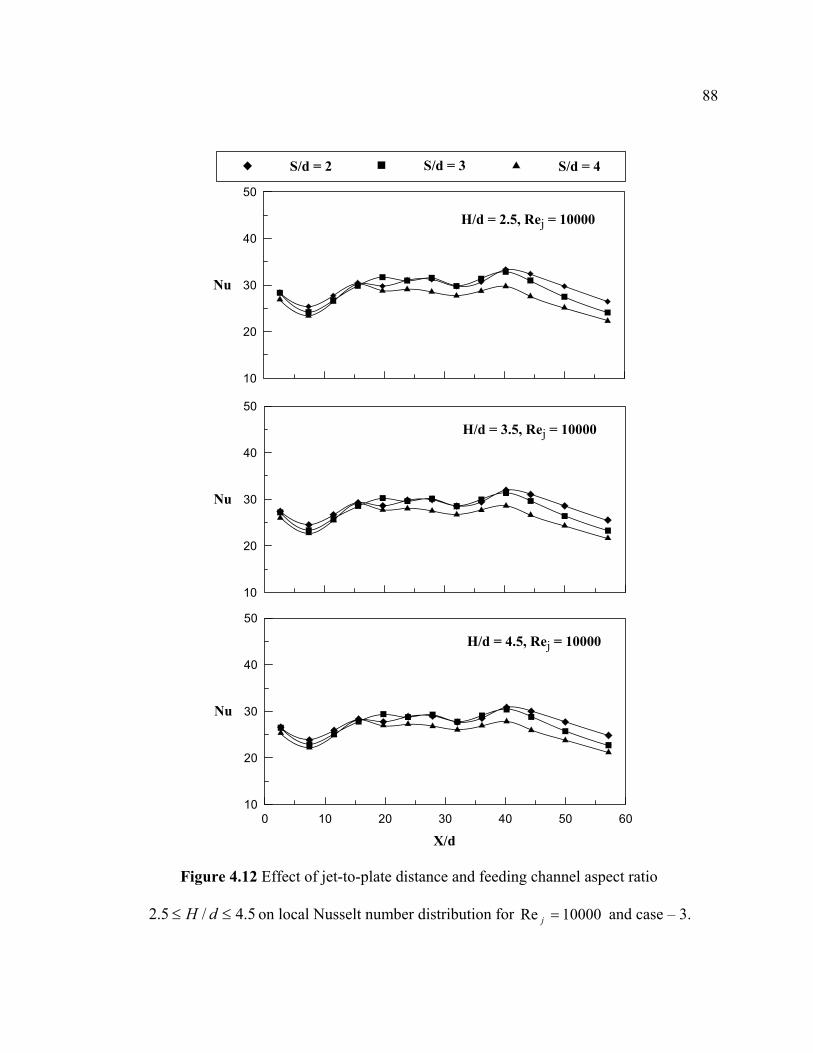
88
10
20
30
40
50
Nu
S/d = 2 S/d = 3 S/d = 4
10
20
30
40
50
Nu
0 10 20 30 40 50 60
X/d
10
20
30
40
50
Nu
H/d = 2.5, Rej = 10000
H/d = 3.5, Rej = 10000
H/d = 4.5, Rej = 10000
Figure 4.12 Effect of jet-to-plate distance and feeding channel aspect ratio
5.4/5.2 ≤≤ dH on local Nusselt number distribution for 10000Re =j and case – 3.

89
4.5 Averaged Nusselt Number
Figures 4.13 – 4.14 shows the averaged Nusselt number avgNu as a function of jet
Reynolds number jRe , considering all the outflow orientations, the feeding channel aspect
ratio 5.4/5.2 ≤≤ dH . The value of avgNu is an average of the detailed results on the entire
target plate surface. The detailed results from the present study are averaged over the entire
target plate to produce a single averaged Nusselt number.
4.5.1 Effect of feeding channel aspect ratio
Figure 4.13 shows the effect of the feeding channel aspect ratio 5.4/5.2 ≤≤ dH for
averaged Nusselt number as a function of the jet Reynolds number for all the outflow
orientations studied. The averaged Nusselt number increases linearly with an increase in the
jet Reynolds number. It is also observed that as the feeding channel aspect ratio dH /
increases from 2.5 to 3.5 there is a corresponding decrease in the magnitude of the averaged
Nusselt number and with an increase of dH / from 3.5 to 4.5 there is a corresponding
decrease in the magnitude of averaged Nusselt number, indicating decrease in the strength of
the impinging jets with an increase in the feeding channel aspect ratios. For 10000Re =j , the
difference in the magnitude of the average Nusselt number is quite large compared to the
other two jet Reynolds numbers studied. The jet Reynolds number 5000Re =j , is less
sensitive to the jet-to-plate distance as there is no much variation observed from the
magnitude of the averaged Nusselt number. Large variation in the averaged Nusselt number
is observed at less value of the feeding channel aspect ratios 5.2/ =dH and 5.3/ =dH ,

90
whereas the feeding channel aspect ratio 5.4/ =dH is less sensitive. Case – 1 and case – 3
have the maximum values of averaged Nusselt number compared to case – 2 as the flow exit
in opposite direction compared to the flow entry, which causes crossflow obstructing the
impingement of jets.
4.5.2 Effect of outflow orientation
Figure 4.14 shows the averaged Nusselt number distribution as a function of jet
Reynolds number. The effect of feeding channel aspect ratio 5.4/5.2 ≤≤ dH is shown in
detail. It is observed that as the feeding channel aspect ratio is increased from 2.5 to 3.5 there
is a corresponding decrease in the values of averaged Nusselt numbers, whereas a further
decrease in the feeding channel aspect ratio from 3.5 to 4.5 leads to a further decrease in the
averaged Nusselt number this may be due to the disturbance caused to the impinging jet with
an increase in the crossflow at high feeding channel aspect ratios. This implies that
5.2/ =dH gives the maximum values of heat transfer among all the feeding channel aspect
ratios studied. Among all the outflow orientations studied, case – 3, the case where the flow
exits in both the directions 0/ =dX and 15.57/ =dX has the high amount of heat
transferred from the target surface, where as case – 2 has the least amount of heat transferred
from the target surface for all the feeding channel aspect ratios examined, this may be
because of the flow exit in opposite direction as to that of the entry in the impingement
channel. Case – 2 has the least amount of heat transferred from the target surface, this may
also be due to the obstruction caused to the flow of jets at large dX / due to the crossflow of
the air at the exit of the impingement channel.

91
The feeding channel aspect ratio 5.4/ =dH gives a very less variation in the
averaged Nusselt number with respect to the outflow orientations at all the jet Reynolds
numbers, where as for 5.35.2/ anddH = a considerable variation in the magnitude of
averaged Nusselt number is observed. The jet Reynolds number 5000Re =j , is less sensitive
to the outflow orientation as there in no much variation observed in the magnitude of the
averaged Nusselt number at this location.
Among all the feeding channel aspect ratios studied 5.2/ =dH gives the highest
values of averaged Nusselt number indicating high heat transfer from the target surface for
all the jet-to-plate distances studied, whereas 5.4/ =dH gives the least amount of heat
transfer. The feeding channel aspect ratio 5.4/ =dH gives the less values of averaged
Nusselt number compared to 5.3/ =dH because of the disturbance caused to the boundary
layer due to crossflow, which becomes more severe at very less dH / values, a maximum
difference of 4% is observed in the magnitude of the averaged Nusselt number.

92
10
20
30
Nu a
vg
H/d = 2.5 H/d = 3.5
10
20
30
10
20
30
H/d = 4.5
S/d = 2, Case - 1
10
20
30
Nu a
vg
4000 6000 8000 10000 12000
Rej
10
20
30
Nu a
vg
10
20
30
10
20
30
4000 6000 8000 10000 12000
Rej
10
20
30
4000 6000 8000 10000 12000
Rej
10
20
30
S/d = 3, Case - 1 S/d = 4, Case - 1
S/d = 2, Case - 2 S/d = 3, Case - 2 S/d = 4, Case - 2
S/d = 2, Case - 3 S/d = 3, Case - 3 S/d = 4, Case - 3
Figure 4.13 Effect of feeding channel aspect ratio 5.4/5.2 ≤≤ dH and jet-to-plate
distances on averaged Nusselt number for different outflow orientation.

93
10
20
30
Nu a
vg
Case - 1 Case - 2
10
20
30
10
20
30
Case - 3
H/d = 2.5, S/d = 2
10
20
30
Nu a
vg
4000 6000 8000 10000 12000
Rej
10
20
30
Nu a
vg
10
20
30
10
20
30
4000 6000 8000 10000 12000
Rej
10
20
30
4000 6000 8000 10000 12000
Rej
10
20
30
H/d = 3.5, S/d = 2 H/d = 4.5, S/d = 2
H/d = 2.5, S/d = 3 H/d = 3.5, S/d = 3 H/d = 4.5, S/d = 3
H/d = 4.5, S/d = 4 H/d = 3.5, S/d = 4 H/d = 4.5, S/d = 4
Figure 4.14 Effect of outflow orientation and feeding channel aspect ratio on averaged
Nusselt number for different jet-to-plate distances )4/2( ≤≤ dS .

94
4.5.3 Correlations of averaged Nusselt number
The results for three different outflow orientations are correlated for the jet Reynolds
number jRe and the normalized jet-to-plate distance dS / dependence as
DCBjavg dHdSANu )/()/()(Re= (4.2)
The present results are correlated for all outflow orientations individually for jet Reynolds
number jRe dependence as shown in Figure 4.15. Previous studies in the field of jet
impingement have involved in developing correlations for the averaged Nusselt number as a
function of the jet Reynolds number by considering many parameters. Correlations by Huang
et al [21], Kercher and Tabakoff [30] and Florscheutz et al [14] are compared to the averaged
Nusselt number in the present investigation. Huang et al [21] studied the outflow orientations
similar to ones used in the present study. They presented results for the outflow orientation 1
and 2 correlating for Reynolds number dependence as 76.0Re035.0=Nu , whereas for
outflow orientation 3 which has the highest magnitude of heat transferred from the target
surface is correlated as 727.0Re082.0=Nu . Kercher and Tabakoff [30] also studied the effect
of crossflow and it is similar to the case – 1 in the present study. They varied the jet hole
diameter, the hole spacing x, y and the jet to target plate distance. Based on all of these
geometrical parameters, they proposed a correlation of the form
3191.0
21 Pr)/(Re dzNu mφφ= , where 1φ and 2φ are constants based on dX / and dY / ,
respectively. Florschuetz et al [14] presented the correlations with different coefficients of

95
inline and staggered rows. The correlation for jet impingement with minimum crossflow is
given as 31554.0068.0422.0554.0 PrRe)()()(363.0 −−−= jdZdYdXNu .
The detailed values of the local Nusselt number are averaged over the entire length of
the target surface to obtain an single averaged Nusselt number. The averaged Nusselt
numbers for each outflow orientation are plotted against the jet Reynolds number. The
present results are correlated for the jet Reynolds number dependence as
795.1611.0757.0 )/()/()(Re0407.0 dHdSNu javg = for case 1 and 2. The correlations for Huang et
al [21] for case 1 and 2 are in good comparison with the present study. Kercher and Tabakoff
[30] presented the results for the outflow orientation – 1 and the results of the present study
are in good comparison with the existing correlation. The case with maximum heat transfer
from the target surface, outflow orientation – 3, is correlated for the jet Reynolds number
dependence as 183.2243.0694.0 )/()/()(Re0387.0 dHdSNu javg = . The correlation used from
Florschuetz et al [14] is for the case with minimum crossflow. Huang et al [21] also
presented a separate correlation for the case with high heat transfer, this case in their study
had the less crossflow effect. The results from the present study for case – 3 are lower than
the existing correlations, which includes the crossflow effect. The correlation for case – 3 in
the present study is in good agreement with the correlation presented by Florschuetz et al
[14] and Huang et al [21]. Thus it is evident from the above discussion that the crossflow
effect is more dominant on outflow orientation 1 and 2 compared to outflow orientation – 3.

96
1000 100002000 5000 20000 5000010
100
20
40
60
80
200Huang et al[17] (case 1 & 2)Kercher & Tabakoff [10]Huang et al [17] (case - 3)Florschuetz et al [2]Case - 1Case - 2Case - 3
Nuavg = 0.0387 (Rej)0.694(S/d)0.243(H/d)2.183
[2][10]
[17]
Nuavg = 0.0407 (Rej)0.757(S/d)0.611(H/d)1.795
Figure 4.15 Averaged Nusselt number comparisons with the existing correlations

97
CHAPTER 5
ORIFICE PLATE – 1 & 2
Jet impingement heat transfer is dependent on several flow and geometrical
parameters. The jet impingement Nusselt number is presented as a functional form of,
( )Re , , , ,ii j
air
h dNu f X H outflow orientation orifice jet sizek
⎛ ⎞⎡ ⎤= =⎜ ⎟ ⎣ ⎦
⎝ ⎠ (5.1)
Where, jRe is the flow parameter, jet spacing to the Hydraulic diameter (considered as the
width of the feeding channel) ratio X and jet-to-plate distance S are the geometric
parameters. The flow exit direction, orifice jet diameter and the jet-to-plate distance are also
important parameters having a significant effect on impingement heat transfer.
Figure 2.3 shows three cases where air comes into the feeding channel and leaves
through jets made in the orifice jet plate to impinge on the heated target surface located in the
impingement channel. For all the three cases air enters the feeding channel at cmX 15.57= .
For case 1, air exits the impingement channel at low X )0( cmX = and therefore the
crossflow develops towards the exit. This case is typical of that seen by 2Floursheutz et al.
For case 2, the flow exits the impingement channel at cmX 15.57= and as the flow moves
forward from low X crossflow develops at low X and increases towards large X
( cmX 15.57= ). For case 3, flow exits the impingement channel at both the directions i.e., at
cmandX 15.570= and the crossflow develops towards both the ends of the test section.

98
Tests were carried out for three different outflow orientations with Reynolds number
ranging between 10000Re5000 ≤≤ j and with two-orifice jet diameters cmandd 15.0=
respectively by varying the feeding channel width H . Three different values of jet-to-plate
distances ( )cmHcm 5.45.2 ≤≤ were considered while carrying out the experiments.
Outflow orientation affects the flow inside the impingement channel and leads into
different heat transfer characteristics. As air impinges on the target surface, crossflow starts
developing and grows continuously towards the exit resulting into thicker boundary layer,
which suppresses the jet impingement effect. In addition, crossflow causes distortion to the
jet impingement in which the jet is no longer impinging normally on the target surface.
All the results presented in this paper are for cmXcm 15.5765.2 ≤≤ over the entire span of
the target plates. Where X is defined from the opposite end of the feeding channel of the test
section as shown in figure 2.2. All the results discussed in the sections followed are being
extracted using the orifice plates with jet diameters 0.5 and 1 cm respectively.
The local Nusselt number distribution for all the three outflow orientations by varying
the jet-to-plate distance is presented in detail, as a function of non-dimensional location X
on the target surface for jet Reynolds number jRe and jet-to-plate distance S in the
forthcoming discussion.
5.1 Effect of feeding channel aspect ratio on local Nusselt number
Figure 5.1 – 5.3, gives a detail insight into the local Nusselt number distribution
presenting the effect of feeding channel width ( )cmHcm 5.45.2 ≤≤ on the heat transfer from
the target surface. All the outflow orientations are discussed.

99
Figure 5.1 shows effect of feeding channel width and two orifice jet sizes cmandd 15.0=
on the local Nusselt number distribution over the entire length of the target surface for case –
1, where the flow exits at low X )0( cmX = . The crossflow develops from large X to low
X as the air exits at low X . The heat transferred from the target surface decreases with an
increase in feeding channel width from cmH 5.2= to cmH 5.4= for all the feeding channel
widths for both the orifice jet sizes. Over the entire length of the target surface, the feeding
channel width cmH 5.2= gives the maximum heat transfer for all the jet Reynolds numbers
( )10000Re5000 ≤≤ j studied. This is primarily due to the increase in the strength of the jets
at low feeding channel widths. Observing the effect of the feeding channel width on the local
Nusselt number distribution for all the jet Reynolds numbers studied, cmH 5.2= gives the
maximum heat transfer among all the feeding channel widths studied. The difference in the
magnitude of the local Nusselt number for all the feeding channel widths studied is very less
for all the jet Reynolds number studied. This is observed from the marginal difference in
magnitude for orifice jet size cmd 1= , whereas the increase in the magnitude of the local
Nusselt number from cmH 5.3= to cmH 5.2= is high at low jet Reynolds numbers for
orifice jet size cmd 5.0= Among all the jet Reynolds numbers studied, 10000Re =j gives
the maximum heat transfer. As discussed earlier in figure 6, a peak of local Nusselt number
at cmX 02.40= is observed this is due to the flow entering the impingement channel at large
dX / , where the effect of crossflow is minimal. At cmXcm 1.366.15 ≤≤ crossflow
dominates the impingement of jets and a linearly decreasing distribution of local Nusselt
number is observed towards the exit.

100
Figure 5.2 shows the effect of the feeding channel width and two orifice jet sizes
cmandd 15.0= on the local Nusselt number distribution for case – 2. For case – 2 the flow
exits at low X )0( cmX = , causing crossflow development towards the exit. The magnitude
of local Nusselt number observed for the case – 2 is less compared to case – 1. cmH 5.2=
gives the maximum heat transfer over the entire length of the target surface for both the
orifice jet sizes and all the jet Reynolds numbers studied. For all the jet Reynolds numbers
studied, cmH 5.2= gives a marginal increase in heat transfer from the target surface
compared to cmH 5.3= whereas cmH 5.2= gives a maximum of 4% increase in heat
transfer is observed compared to cmH 5.4= , for orifice jet size cmd 1= . Whereas for
cmd 5.0= , a considerable increase in local Nusselt number is observed for an decrease in
feeding channel width from cmH 5.3= to cmH 5.2= . It is also observed that the
magnitude of the local Nusselt number increases with an increase in the jet Reynolds number
for all the feeding channel widths studied. The variation in the local Nusselt number is more
sensitive with respect to a change in feeding channel width at high jet Reynolds number
whereas it is less sensitive at low jet Reynolds numbers. At cmXcm 15.5702.40 ≤≤ the
magnitude of local Nusselt number decreases from cmX 02.40= to cmX 15.57= , this is
due to the obstruction caused by the crossflow to the impinging jets.
Figure 5.3 shows the effect of feeding channel width and two orifice jet sizes cmandd 15.0= on
the local Nusselt number distribution for case – 3 . For case – 3 air exits at )0( cmX = and
)15.57( cmX = , where the crossflow has a predominant effect over the heat transfer characteristics. For both
the orifice jet sizes studied, it is observed that at cmXcm 6.150 ≤≤ and cmXcm 15.5702.40 ≤≤ the

101local Nusselt number decreases towards exit, this may be due to the crossflow at the exit that reduces the
strength of the impinging jets and the heat transferred from the target surface. The magnitude of local Nusselt
number at cmXcm 1.366.15 ≤≤ is high compared to the other dX / locations this may be due to the
strong impingement of jets. For an increase in feeding channel width a corresponding decrease in local Nusselt
number is observed. cmH 5.2= gives the maximum values of local Nusselt numbers for all the jet Reynolds
numbers and both the orifice jet sizes studied. Considering the effect of feeding channel width for all jet
Reynolds numbers on heat transfer characteristics in detail, cmH 5.2= gives the highest heat transfer similar
to case – 1 and case – 2. For cmd 1= , the increase in magnitude of Nusselt number for an increase in the
feeding channel ratio is marginal. Whereas for cmd 5.0= , cmH 5.2= gives a marginal increase in heat
transfer compared to cmH 5.3= , further cmH 5.2= gives a maximum of 5% more heat transfer
compared to cmH 5.4= . The distribution of the local Nusselt number for cmd 5.0= is uniform over the
entire length of the target surfaces as studied in the previous cases. Similar to case – 1 and case – 2, with respect
to the effect of feeding channel width on local Nusselt number characteristics it is observed that the local
Nusselt number is sensitive to a change in feeding channel width at high jet Reynolds numbers.

102
10
15
20
25
30
35
Nu
H = 2.5 cm H = 3.5 cm H = 4.5 cm
10
15
20
25
30
35
Nu
0 10 20 30 40 50 60
X
10
15
20
25
30
35
Nu
Rej = 5000
Rej = 7500
Rej = 10000
Figure 5.1 Effect of feeding channel aspect ratio cmdHcm 5.4/5.2 ≤≤ on local Nusselt
number distribution for case – 1 and cmS 3= . (Filled symbol: cmd 1= and Unfilled
symbol: cmd 5.0= )

103
10
15
20
25
30
35
Nu
H = 2.5 cm H = 3.5 cm H = 4.5 cm
10
15
20
25
30
35
Nu
0 10 20 30 40 50 60
X
10
15
20
25
30
35
Nu
Rej = 5000
Rej = 7500
Rej = 10000
Figure 5.2 Effect of feeding channel aspect ratio cmdHcm 5.4/5.2 ≤≤ on local Nusselt
number distribution for case – 2 and cmS 3= . (Filled symbol: cmd 1= and Unfilled
symbol: cmd 5.0= )

104
10
15
20
25
30
35
Nu
H = 2.5 cm H = 3.5 cm H = 4.5 cm
10
15
20
25
30
35
Nu
0 10 20 30 40 50 60
X
10
15
20
25
30
35
Nu
Rej = 5000
Rej = 7500
Rej = 10000
Figure 5.3 Effect of feeding channel aspect ratio cmdHcm 5.4/5.2 ≤≤ on local Nusselt
number distribution for case – 3 and cmS 3= . (Filled symbol: cmd 1= and Unfilled
symbol: cmd 5.0= )

105
5.2 Effect of jet Reynolds number on local Nusselt number
Figure 5.4 – 5.6, gives a detail insight into the local Nusselt number distribution
presenting the effect of jet Reynolds number ( )10000Re5000 ≤≤ j on the heat transfer from
the target surface. All the outflow orientations are discussed.
Figure 5.4 shows the local Nusselt number distribution plotted for case – 1, which
gives a detailed insight into the effect of the feeding channel width. Three different values of
the feeding channel width and two orifice jet sizes cmandd 15.0= are considered in this part
of the study ( )cmHcm 5.45.2 ≤≤ . The results are presented for three jet Reynolds numbers
( )10000Re5000 ≤≤ j . The distribution of the local Nusselt number is uniform across the
entire length of the target surface for orifice jet size cmd 5.0= . It is observed that for an
increase in the jet Reynolds number there is a corresponding increase in the magnitude of
local Nusselt number. Highest values of local Nusselt number are observed for 10000Re =j
compared to the other two jet Reynolds numbers. Increasing the jet Reynolds number from
5000Re =j to 7500Re =j gives a maximum of 11% increase in the local Nusselt number
values whereas for an increase from 7500Re =j to 10000Re =j a marginal increase in the
magnitude of local Nusselt number is observed indicating the increase in strength of jets with
an increase in jet Reynolds number for orifice jet size cmd 1= . Whereas, for cmd 5.0= , 5%
increase in the magnitude of Nusselt number is observed. For case – 1, the flow exits the
impingement channel at low X )0( cmX = . At large X )2.40( cmX = a peak of local
Nusselt number is observed this may be due to strong impingement of the air jets and also
because the effect of crossflow is minimal, which reduces the boundary layer thickness.

106
Among all the feeding channel widths examined ( )cmHcm 5.45.2 ≤≤ , cmH 5.2= gives
the maximum values of local Nusselt number for all the jet-to-plate distances studied.
cmH 5.2= gives a marginal increase in the local Nusselt number from the target surface
compared to cmH 5.3= , whereas 6% increase in local Nusselt number is observed
compared to cmH 5.4= . At cmXcm 1.366.15 ≤≤ a uniform decrease in magnitude of local
Nusselt number is observed, for both the orifice jet sizes, along the target surface from
cmX 1.36= to cmX 0= for all the feeding channel widths studied, this may be due to the
crossflow of the air generated towards the exit.
Figure 5.5 shows the effect of feeding channel width and two orifice jet sizes
cmandd 15.0= on the local Nusselt number distribution for case – 2 as a function of jet
Reynolds numbers ( )10000Re5000 ≤≤ j. For case – 2 air exits the impingement channel at
cmX 15.57= , this leads to the development of crossflow towards the exit. Similar to the
case – 1 an increase in jet Reynolds number leads to the corresponding increase in the local
Nusselt number for all the feeding channel widths studied. The heat transfer observed from
orifice jet size cmd 1= is twice to that observed using cmd 5.0= . As observed in case – 1
the local Nusselt number distribution for cmd 5.0= is uniform across the entire length of the
target surface. The magnitude of local Nusselt number at cmXcm 1.366.15 ≤≤ is more
compared to the other dX / locations this may be due to the strong impingement of jets at
this location. Although similar distribution of local Nusselt number is observed for
cmH 5.2= and cmH 5.3= , but cmH 5.4= gives a marginal increase in heat transfer from
the entire target surface compared to cmH 5.3= and cmH 5.2= gives a maximum of 7%

107
more heat transfer from the entire target surface compared to cmH 5.4= . The local Nusselt
number is sensitive for a change in jet Reynolds number, this is observed from the difference
in magnitude of local Nusselt number varying with respect to jet Reynolds number. For
cmd 1= , 10000Re =j gives the maximum values of local Nusselt number for all the
feeding channel widths studied. Nusselt number distribution for 5000Re =j and
7500Re =j is close with a maximum difference in magnitude being 60%. At
cmXcm 15.5702.40 ≤≤ , a decrease in local Nusselt number is observed from
cmX 02.40= towards the exit at cmX 15.57= , this is due to the development of crossflow
towards the exit, which obstructs the impingement of jets and thickens the boundary layer.
For cmd 5.0= , a uniform increase in the local Nusselt number is observed for an increase in
jet Reynolds number from 5000Re =j to 7500Re =j and to 10000Re =j . This behavior
of local Nusselt number at large dX / is observed for all the feeding channel widths studied.

108
0
10
20
30
40
Nu
Rej = 5000 Rej = 7500 Rej = 10000
0
10
20
30
40
Nu
0 10 20 30 40 50 60
X
0
10
20
30
40
Nu
H = 2.5 cm
H = 3.5 cm
H = 4.5 cm
Figure 5.4 Effect of jet Reynolds number and feeding channel aspect ratio
cmdHcm 5.4/5.2 ≤≤ on local Nusselt number distribution for case – 1 and cmS 3= .
(Filled symbol: cmd 1= and Unfilled symbol: cmd 5.0= )

109
0
10
20
30
40
Nu
Rej = 5000 Rej = 7500 Rej = 10000
0
10
20
30
40
Nu
0 10 20 30 40 50 60
X
0
10
20
30
40
Nu
H = 2.5 cm
H = 3.5 cm
H = 4.5 cm
Figure 5.5 Effect of jet Reynolds number and feeding channel aspect ratio
cmdHcm 5.4/5.2 ≤≤ on local Nusselt number distribution for case – 2 and cmS 3= .
(Filled symbol: cmd 1= and Unfilled symbol: cmd 5.0= )

110
Figure 5.6 presents the effect of feeding channel width and two orifice jet sizes
cmandd 15.0= on local Nusselt number distribution for case – 3 where the air exits from
both the directions at low X )0( cmX = and at large X )15.57( cmX = . As observed in
case – 1 and case – 2 the heat transfer observed from orifice jet size cmd 1= is twice
compared to the heat transfer observed from cmd 1= . It is observed that the crossflow
develops at both the exit directions, which reduces the heat transferred from the target
surfaces. Similar to heat transfer observed from case – 1 and case – 2, cmH 5.2= has the
maximum heat transfer for case – 3. cmH 5.2= gives a maximum of 8.1% more heat
transfer compared to cmH 5.3= and cmH 5.2= gives a maximum of 12.3% more heat
transfer compared to cmH 5.4= , for both the orifice jet sizes studied. For cmd 1= , the
magnitude of local Nusselt number at cmXcm 1.366.15 ≤≤ is more compared to the other
dX / locations this is due to the strong impingement of jets at the centre of the target surface
compared to the exit locations where the crossflow more less dominant over the impingement
effect. Small peaks of local Nusselt number are observed at cmX 02.40= and cmX 32=
which are the result of the stronger jet impingement. At cmXcm 6.150 ≤≤ and
cmXcm 15.5702.40 ≤≤ a linearly decreasing local Nusselt number distribution is observed
towards the exit this is primarily due to the crossflow obstructing the impinging jets towards
the exit of impingement channel. For cmd 5.0= , the distribution of local Nusselt number is
uniform over the entire length of the target surface as observed in case – 1 and case – 2. The
difference in the magnitude of local Nusselt number for an increase of jet Reynolds number
from 5000Re =j to 7500Re =j is similar to the increase in magnitude from 7500Re =j

111
and 10000Re =j for all the feeding channel widths studied. Similar to the outflow
orientations 1 and 2, 10000Re =j gives the maximum values of local Nusselt number
compared to the other jet Reynolds numbers studied.

112
0
10
20
30
40
Nu
Rej = 5000 Rej = 7500 Rej = 10000
0
10
20
30
40
Nu
0 10 20 30 40 50 60
X
0
10
20
30
40
Nu
H = 2.5 cm
H = 3.5 cm
H = 4.5 cm
Figure 5.6 Effect of jet Reynolds number and feeding channel aspect ratio
cmdHcm 5.4/5.2 ≤≤ on local Nusselt number distribution for case – 3 and
cmS 3= .(Filled symbol: cmd 1= and Unfilled symbol: cmd 5.0= )

113
5.3 Effect of outflow orientation on local Nusselt number
Figure 5.7 – 5.9 shows the effect of the outflow orientation for different feeding
channel widths ( )cmHcm 5.45.2 ≤≤ and two orifice jet sizes cmandd 15.0= on local
Nusselt number. All the jet Reynolds numbers studied ( )10000Re5000 ≤≤ j are discussed
individually.
Figure 5.7 represents the effect of the outflow orientation on the local Nusselt number
distribution plotted for different feeding channel widths ( )cmHcm 5.45.2 ≤≤ and two
orifice jet sizes cmandd 15.0= for 5000Re =j . Among all the feeding channel widths
studied very less variation in the magnitude of local Nusselt number is observed with respect
to outflow orientation at cmXcm 1.366.15 ≤≤ for case – 2 and case – 3. Whereas, for case –
1 a linearly decreasing local Nusselt number distribution is observed from cmX 02.40= to
cmX 6.15= , this may be due to the crossflow getting intensified towards the exit, opposing
and decreasing the strength of the impingement jets. At cmXcm 15.5702.40 ≤≤ for all the
feeding channel widths studied, case – 1 has the highest heat transfer due to air entering the
impingement channel at this location resulting in stronger impingement reducing the
boundary layer thickness. At cmXcm 1.366.15 ≤≤ , case – 3 has the highest heat transfer
from the target surface. Similar to the above discussions, cmH 5.2= gives the maximum
heat transfer over the entire length of the target surface. For cmd 5.0= , the variation in the
magnitude of the local Nusselt number is very less with respect to the change in outflow
orientation. It is also observed that case – 2 has the least magnitude of local Nusselt number
over the entire length of the target surface for all the feeding channel widths studied.

114
5
15
25
35
45
Nu
Case - 1 Case - 2 Case - 3
5
15
25
35
45
Nu
0 10 20 30 40 50 60
X
5
15
25
35
45
Nu
H = 2.5 cm
H = 3.5 cm
H = 4.5 cm
Figure 5.7 Effect of outflow orientation and feeding channel aspect ratio
cmdHcm 5.4/5.2 ≤≤ on local Nusselt number distribution for 5000Re =j and cmS 3= .
(Filled symbol: cmd 1= and Unfilled symbol: cmd 5.0= )

115
Figure 5.8 shows the effect of feeding channel width and two orifice jet sizes
cmandd 15.0= on the local Nusselt number distribution for different outflow orientations
studied and for 7500Re =j . It is observed that as the jet Reynolds number increases from
5000 to 7500 a maximum of 21% increase in the magnitude of local Nusselt number is
found. Similar to 5000Re =j , case – 1 has maximum heat transfer at
cmXcm 15.5702.40 ≤≤ due to the strong impingement of jets for both the orifice jet sizes
studied. Whereas case – 2 has the least magnitude of local Nusselt number due to the
obstruction to the impinging jets caused by the crossflow. The local Nusselt number
distribution at cmXcm 1.366.15 ≤≤ is uniform for case – 3 and case – 2 whereas a linearly
decreasing local Nusselt number distribution is observed at cmX 5.12= towards cmX 0= .
At cmXcm 1.366.15 ≤≤ , case – 3 has the highest magnitude of local Nusselt number
compared to the other two outflow orientations. Similar to 5000Re =j , cmH 5.2= has the
highest magnitude of local Nusselt number compared to the other two feeding channel widths
studied. For cmd 1= , unlike 5000Re =j , where the variation in the magnitude of local
Nusselt number is very less, for 7500Re =j the variation with respect to outflow orientation
is more comparatively for all the feeding channel widths studied. For cmd 5.0= , the
variation in the magnitude of the local Nusselt number with respect to the outflow orientation
is very less comparatively.
Figure 5.9 shows the effect of feeding channel width and two orifice jet sizes
cmandd 15.0= on the local Nusselt number distribution for all the outflow orientations and

116
10000Re =j . It is observed that as the jet Reynolds number increases from 7500 to 10000 a
maximum of 26% increase in local Nusselt number is found similar to 7500Re =j . It is also
observed that very less variation in local Nusselt number is observed at large X
cmXcm 15.5702.40 ≤≤ compared to 5000Re =j and 7500Re =j for all the outflow
orientations and the orifice jet sizes studied. Moreover as the H values increase from 2.5 to
4.5 a corresponding decrease in the magnitude of local Nusselt number is observed. Similar
to the other two jet Reynolds number investigated, at cmXcm 1.366.15 ≤≤ , case – 3 and
case – 2 have the uniform distribution of local Nusselt number whereas case – 1 has a
linearly decreasing local Nusselt number from cmX 02.40= to cmX 6.15= , the reason
being explained previously. Maximum heat transfer is observed for cmH 5.2= similar to
5000Re =j and 7500Re =j followed by cmH 5.3= and cmH 5.4= .

117
5
15
25
35
45
Nu
Case - 1 Case - 2 Case - 3
5
15
25
35
45
Nu
0 10 20 30 40 50 60
X
5
15
25
35
45
Nu
H = 2.5 cm
H = 3.5 cm
H = 4.5 cm
Figure 5.8 Effect of outflow orientation and feeding channel aspect ratio
cmdHcm 5.4/5.2 ≤≤ on local Nusselt number distribution for 7500Re =j and cmS 3= .
(Filled symbol: cmd 1= and Unfilled symbol: cmd 5.0= )

118
5
15
25
35
45
Nu
Case - 1 Case - 2 Case - 3
5
15
25
35
45
Nu
0 10 20 30 40 50 60
X
5
15
25
35
45
Nu
H = 2.5 cm
H = 3.5 cm
H = 4.5 cm
Figure 5.9 Effect of outflow orientation and feeding channel aspect ratio
cmdHcm 5.4/5.2 ≤≤ on local Nusselt number distribution for 10000Re =j and cmS 3= .
(Filled symbol: cmd 1= and Unfilled symbol: cmd 5.0= )

119
5.4 Averaged Nusselt number
Figures 5.10 - 5.11 shows the average Nusselt number avgNu as a function of jet
Reynolds number jRe , plotted for all outflow orientations and the feeding channel aspect
ratio ( )cmHcm 5.45.2 ≤≤ . The value of avgNu is an average of the detailed results on the
target surface.
5.4.1 Effect of feeding channel aspect ratio
Figure 5.10 shows the effect of the feeding channel width and two orifice jet sizes
cmandd 15.0= on average Nusselt number for different outflow orientations. The averaged
Nusselt number increases linearly with an increase in the jet Reynolds number. Among all
the feeding channel widths studied cmH 5.2= has the maximum values of the avgNu for
orifice jet size cmd 1= , for all the outflow orientations, the reason being the strong
impingement of jets with minimum effect of crossflow. Whereas for orifice jet size,
cmd 5.0= , similar behavior of heat transfer distribution is observed for all the feeding
channel widths, with cmH 5.2= giving the highest heat transfer. The avgNu values
decreases with an increase in the feeding channel width, this is primarily due to the increase
in the crossflow effect which reduces the strength of the impingement jets. In detail, the
averaged Nusselt number distribution for all the feeding channel widths is almost similar for
all the outflow orientations studied for orifice jet size cmd 5.0= and cmd 1= with a
difference in the magnitude of avgNu . The behavior of average Nusselt number is almost

120
similar with a maximum difference in magnitude equal to 11%. The difference in magnitude
of average Nusselt number for cmH 5.2= is very high compared to the other jet-to-plate
distances studied for orifice jet size cmd 5.0= , whereas for cmd 1= , a uniform increase in
the magnitude of average Nusselt number is observed for all the outflow orientations studied.
5.4.2 Effect of outflow orientation
Figure 5.11 shows the effect of outflow orientation and two orifice jet sizes
cmandd 15.0= on the average Nusselt number for different feeding channel widths studied
( )cmHcm 5.45.2 ≤≤ . It is observed that the averaged Nusselt number increases linearly
with an increase in the jet Reynolds number, as stated in the previous discussion. Case – 3
has the highest heat transfer from the target surface for all the jet-to-plate distances studied
and for all the orifice jet sizes investigated, the only exception being the case – 1 having high
values of the averaged Nusselt number for all the feeding channel widths at jet Reynolds
number 7500Re =j . The reason for case – 3 giving the highest values of local Nusselt
number is the less crossflow in the impingement channel compared to the other two outflow
orientations where crossflow is dominant. Case – 2 has the lowest values of the average
Nusselt number for all the jet-to-plate distances studied and for all the orifice jet sizes
investigated, this may be due to the exit flow from the impingement channel being in the
opposite direction of the inlet flow into the feeding channel.

121
10
14
18
22
26
30
Nu a
vg
Case - 1 Case - 2 Case - 3
10
14
18
22
26
30
Nu a
vg
4000 6000 8000 10000 12000Rej
10
14
18
22
26
30
Nu a
vg
H = 2.5 cm
H = 3.5 cm
H = 4.5 cm
Figure 5.10 Effect of outflow orientation on averaged Nusselt number for different feeding
channel aspect ratios cmdHcm 5.4/5.2 ≤≤ and cmS 3= . (Filled symbol: cmd 1= and
Unfilled symbol: cmd 5.0= )

122
10
14
18
22
26
30
Nu a
vg
H = 2.5 cm H = 3.5 cm H = 4.5 cm
10
14
18
22
26
30
Nu a
vg
4000 6000 8000 10000 12000Rej
10
14
18
22
26
30
Nu a
vg
Case - 1
Case - 2
Case - 3
Figure 5.11 Effect of feeding channel aspect ratio cmdHcm 5.4/5.2 ≤≤ on the averaged
Nusselt number for different outflow orientations and cmS 3= . (Filled symbol: cmd 1=
and Unfilled symbol: cmd 5.0= )

123
5.4.3 Correlations of averaged Nusselt number
The results for three different outflow orientations are correlated for the jet Reynolds
number jRe and the normalized jet-to-plate distance dS / dependence as
Bjavg ANu )(Re= (5.2)
The present results are correlated for all outflow orientations individually for jet Reynolds
number jRe dependence. Previous studies in the field of jet impingement have involved in
developing correlations for the averaged Nusselt number as a function of the jet Reynolds
number by considering many parameters. Correlations by Huang et al [14], Kercher and
Tabakoff [30] and Florscheutz et al [14] are compared to the averaged Nusselt number in the
present investigation. Huang et al [21] studied the outflow orientations similar to ones used
in the present study. They presented results for the outflow orientation 1 and 2 correlating for
Reynolds number dependence as 76.0Re035.0=Nu , whereas for outflow orientation 3 which
has the highest magnitude of heat transferred from the target surface is correlated as
727.0Re082.0=Nu . Kercher and Tabakoff [30] also studied the effect of crossflow and it is
similar to the case – 1 in the present study. They varied the jet hole diameter, the hole
spacing x, y and the jet to target plate distance. Based on all of these geometrical parameters,
they proposed a correlation of the form 3191.0
21 Pr)/(Re dzNu mφφ= , where 1φ and 2φ are
constants based on dX / and dY / , respectively. Florschuetz et al [14] presented the
correlations with different coefficients of inline and staggered rows. The correlation for jet

124
impingement with minimum crossflow is given as
31554.0068.0422.0554.0 PrRe)()()(363.0 −−−= jdZdYdXNu .
The detailed values of the local Nusselt number are averaged over the entire length of
the target surface to obtain an single averaged Nusselt number. The averaged Nusselt
numbers for each outflow orientation are plotted against the jet Reynolds number. The
present results are correlated for the jet Reynolds number dependence as
8922.0Re0098.0=Nu for case 1 and 2. The correlations for Huang et al [21] for case 1 and 2
are in good comparison with the present study. Kercher and Tabakoff [30] presented the
results for the outflow orientation – 1 and the results of the present study are in good
comparison with the existing correlation. The case with maximum heat transfer from the
target surface, outflow orientation – 3, is correlated for the jet Reynolds number dependence
as 6619.0Re1033.0=Nu . The correlation used from Florschuetz et al [14] is for the case with
minimum crossflow. Huang et al [21] also presented a separate correlation for the case with
high heat transfer, this case in their study had the less crossflow effect. The results from the
present study for case – 3 are lower than the existing correlations, which includes the
crossflow effect. The correlation for case – 3 in the present study is in good agreement with
the correlation presented by Florschuetz et al [14] and Huang et al [21]. Thus it is evident
from the above discussion that the crossflow effect is more dominant on outflow orientation
1 and 2 compared to outflow orientation – 3.

125
1000 100002000 5000 20000 5000010
100
20
40
60
80
200Huang et al[17] (case 1 & 2)Kercher & Tabakoff [10]Huang et al [17] (case - 3)Florschuetz et al [2]Case - 1Case - 2Case - 3
Nuavg = 0.0098 Rej0.8922
Nuavg = 0.1033 Rej0.6619
[2][10]
[17]
Figure 5.12 Averaged Nusselt number comparisons with the existing correlations

126
CHAPTER 6
ORIFICE PLATE - 2
In this chapter a detailed discussion on the results obtained by using the orifice plate 2
(centreline arrangement of jets) with jet diameter cmd 5.0= are presented. Nusselt number
distribution is presented as a function of non-dimensional distance along the entire length of
the heated target surface and also as a function of the jet Reynolds number. As presented in
the earlier chapter 4, Nusselt number distributions are shown for all the feeding channel
aspect ratios studied 9/5 ≤≤ dH , the jet-to-plate distance 8/4 ≤≤ dS , and for three jet
Reynolds numbers being investigated 18800Re9300 ≤≤ j . First a detail insight into the
effect of jet Reynolds number onto the Nusselt number distribution, which also covers the
effect of feeding channel aspect ratio on the Nusselt number. Next, the effect of the jet-to-
plate distance onto the Nusselt number behavior is presented. Next, the effect of the outflow
orientation on the Nusselt number distribution along the entire surface is investigated. Finally
the average Nusselt number distribution is plotted as a function of the jet Reynolds number.
6.1 Effect of feeding channel aspect ratio on local Nusselt number
Figure 6.1 – 6.3, gives a detail insight into the local Nusselt number distribution
presenting the effect of feeding channel aspect ratio 9/5 ≤≤ dH on the heat transfer from
the target surface. All the outflow orientations are discussed.
127
Figure 6.1 shows effect of feeding channel aspect ratio on the local Nusselt number
distribution over the entire length of the target surface for case – 1, where the flow exits at
low dX / )0/( =dX . The crossflow develops from large dX / to low dX / as the air exits
at low dX / . The heat transferred from the target surface decreases with an decrease in
feeding channel aspect ratio from dH / = 9 to 5 for all the feeding channel aspect ratios.
Over the entire length of the target surface, the feeding channel aspect ratio 9/ =dH gives
the maximum heat transfer for all the jet Reynolds numbers 18800Re9300 ≤≤ j studied.
This is primarily due to the decrease in the crossflow and increase in the strength of the jets
with an increase in the feeding channel ratios. Observing the effect of the feeding channel
aspect ratio on the local Nusselt number distribution for all the jet Reynolds numbers studied,
9/ =dH gives the maximum heat transfer among all the feeding channel aspect ratios
studied. 7/ =dH gives a maximum of 5% increase in the local Nusselt number compared to
5/ =dH , whereas 9/ =dH gives 34% increase in local Nusselt number is observed
compared to 7/ =dH . With an increase in the feeding channel aspect ratio the difference in
the magnitude of the local Nusselt number also increases for an increase in the jet Reynolds
number. Among all the Reynolds numbers studied, 18800Re =j gives the maximum heat
transfer. A peak of local Nusselt number at 4.80/ =dX is observed this is due to the flow
entering the impingement channel at large dX / , where the effect of crossflow is minimal.
At 2.72/2.31 ≤≤ dX crossflow dominates the impingement of jets and a linearly
decreasing distribution of local Nusselt number is observed towards the exit.
Figure 6.2 shows the effect of the feeding channel aspect ratio on the local Nusselt
number distribution for case – 2 and for jet-to-plate distance 6/ =dS . For case – 2 the flow

128
exits at low dX / )0/( =dX , causing crossflow development towards the exit. 9/ =dH
gives the maximum heat transfer over the entire length of the target surface for all the jet
Reynolds numbers studied. For all the jet Reynolds numbers studied, 7/ =dH gives 20%
more heat transfer from the target surface compared to 5/ =dH whereas 9/ =dH gives a
maximum of 16% increase in heat transfer is observed compared to 7/ =dH . It is also
observed that the magnitude of the local Nusselt number increases with an increase in the jet
Reynolds number for all the feeding channel aspect ratios studied. The variation in the local
Nusselt number is more sensitive with respect to a change in feeding channel aspect ratio at
high jet Reynolds number whereas it is less sensitive at low jet Reynolds numbers. At
3.114/4.80 ≤≤ dX the magnitude of local Nusselt number decreases from 4.80/ =dX to
3.114/ =dX , this is due to the obstruction caused by the crossflow to the impinging jets.
Figure 6.3 shows the effect of feeding channel aspect ratio on the local Nusselt
number distribution for case – 3 and for jet-to-plate distance 6/ =dS . For case – 3 air exits
at 0/ =dX and 3.114/ =dX , where the crossflow has a predominant effect over the heat
transfer characteristics. It is observed that at 30/0 ≤≤ dX and 3.114/4.80 ≤≤ dX the
local Nusselt number decreases towards exit, this may be due to the crossflow at the exit and
thus reduces the strength of the impinging jets and the heat transferred from the target
surface. The magnitude of local Nusselt number at 2.72/2.31 ≤≤ dX is high compared to
the other dX / locations this may be due to the strong impingement of jets. For an increase
in feeding channel aspect ratio a corresponding increase in local Nusselt number is observed.
9/ =dH gives the maximum values of feeding channel aspect ratio for all the jet Reynolds
numbers studied. Considering the effect of feeding channel aspect ratio for all jet Reynolds

129
numbers on heat transfer characteristics in detail, 9/ =dH gives the highest heat transfer
similar to case – 1 and case – 2. 9/ =dH gives a maximum of 21% more heat transfer
compared to 7/ =dH , further 7/ =dH gives a maximum of 10% more heat transfer is
observed compared to 5/ =dH . The feeding channel aspect ratios 5/ =dH and 7/ =dH
gives less heat transfer due to high crossflow which dominates the strength of the impinging
jets, thus thinning the boundary layer resulting in high heat transfer. Similar to case – 1 and
case – 2, with respect to the effect of feeding channel aspect ratio on local Nusselt number
characteristics it is observed that the local Nusselt number is sensitive to a change in feeding
channel aspect ratio at high jet Reynolds numbers.

130
10
20
30
40
50
60
70
Nu
H/d = 5 H/d = 7 H/d = 9
10
20
30
40
50
60
70
Nu
0 30 60 90 120
X/d
10
20
30
40
50
60
70
Nu
Rej = 9300
Rej = 14400
Rej = 18800
Figure 6.1 Effect of feeding channel aspect ratio 9/5 ≤≤ dH on local Nusselt number
distribution for case – 1 and jet-to-plate distance 6/ =dS .

131
10
20
30
40
50
60
70
Nu
H/d = 5 H/d = 7 H/d = 9
10
20
30
40
50
60
70
Nu
0 30 60 90 120
X/d
10
20
30
40
50
60
70
Nu
Rej = 9300
Rej = 14400
Rej = 18800
Figure 6.2 Effect of feeding channel aspect ratio 9/5 ≤≤ dH on local Nusselt number
distribution for case – 2 and jet-to-plate distance 6/ =dS .

132
10
20
30
40
50
60
70
Nu
H/d = 5 H/d = 7 H/d = 9
10
20
30
40
50
60
70
Nu
0 30 60 90 120
X/d
10
20
30
40
50
60
70
Nu
Rej = 9300
Rej = 14400
Rej = 18800
Figure 6.3 Effect of feeding channel aspect ratio 9/5 ≤≤ dH on local Nusselt number
distribution for case – 3 and jet-to-plate distance 6/ =dS

133
6.2 Effect of jet Reynolds number on local Nusselt number
Figure 6.4 – 6.6 shows the local Nusselt number distribution for different jet
Reynolds numbers 18800Re9300 ≤≤ j , for jet-to-plate distance 6/ =dS , expressing the
effect of the feeding channel aspect ratio on the heat transfer from the heated target surface.
Among all the jet-to-plate distances studied 6/ =dS is considered, as it is the best case in
which maximum heat is transferred from the target surface.
Figure 6.4 shows the local Nusselt number distribution plotted for case – 1, which
gives a detailed insight into the effect of the feeding channel aspect ratio. Three different
values of the feeding channel aspect ratio are considered in this part of the study
9/5 ≤≤ dH . The results are presented for three jet Reynolds numbers 18800Re9300 ≤≤ j .
It is observed that for an increase in the jet Reynolds number there is a corresponding
increase in the magnitude of local Nusselt number. High values of local Nusselt number are
observed for 18800Re =j compared to the other two jet Reynolds numbers. Increasing the
jet Reynolds number from 9300Re =j to 14400Re =j a maximum of 10.7% increase in the
local Nusselt number values is observed whereas for an increase from 14400Re =j to
18800Re =j a large increase of 40% in magnitude of local Nusselt number is observed
indicating the increase in strength of jets with an increase in jet Reynolds number. For case –
1, the flow exits the impingement channel at low dX / )0/( =dX . At large
dX / )4.80/( =dX a peak of local Nusselt number is observed this may be due to strong
impingement of the air jets and also because the effect of crossflow is minimal, which
reduces the boundary layer thickness. Among all the feeding channel aspect ratios examined

134
9/5 ≤≤ dH , 5/ =dH gives the maximum values of local Nusselt number for all the jet-to-
plate distances studied. 7/ =dH gives a maximum of 14% increase in the local Nusselt
number from the target surface compared to 5/ =dH , whereas 35% increase in local
Nusselt number is observed compared to 9/ =dH . At 2.72/2.31 ≤≤ dX a uniform
decrease in magnitude of local Nusselt number is observed along the target surface from
2.72/ =dX to 0/ =dX for all the feeding channel aspect ratios studied, this may be due to
the crossflow of the air generated towards the exit.
Figure 6.5 shows the effect of feeding channel aspect ratio on the local Nusselt
number distribution for case – 2 as a function of jet Reynolds numbers 18800Re9300 ≤≤ j .
For case – 2 air exits the impingement channel at 3.114/ =dX , this leads to the
development of crossflow towards the exit. Similar to the case – 1 an increase in jet Reynolds
number leads to the corresponding increase in the local Nusselt number for all the feeding
channel aspect ratios studied. The magnitude of local Nusselt number at 2.72/2.31 ≤≤ dX
is more compared to the other dX / locations this may be due to the strong impingement of
jets at this location. Although similar distribution of local Nusselt number is observed for
5/ =dH and 7/ =dH , but 7/ =dH gives a maximum of 12% more heat transfer from
the entire target surface compared to 5/ =dH and 9/ =dH gives a maximum of 25% more
heat transfer from the entire target surface compared to 7/ =dH . The local Nusselt number
is sensitive for a change in jet Reynolds number, this is observed from the difference in
magnitude of local Nusselt number varying with respect to jet Reynolds number.
18800Re =j gives the maximum values of local Nusselt number for all the feeding channel
aspect ratios studied. Nusselt number distribution for 9300Re =j and 14400Re =j is close

135
with a maximum difference in magnitude being 30%. At 3.114/02.80 ≤≤ dX , a decrease in
local Nusselt number is observed from 02.80/ =dX towards the exit at 3.114/ =dX , this
is due to the development of crossflow towards the exit, which obstructs the impingement of
jets and thickens the boundary layer. This behavior of local Nusselt number at large dX / is
observed for all the feeding channel aspect ratios studied.

136
10
20
30
40
50
60
70
Nu
Rej = 9300 Rej = 14400 Rej = 18800
10
20
30
40
50
60
70
Nu
0 30 60 90 120
X/d
10
20
30
40
50
60
70
Nu
H/d = 5
H/d = 7
H/d = 9
Figure 6.4 Effect of jet Reynolds number and feeding channel aspect ratio 9/5 ≤≤ dH on
local Nusselt number distribution for 6/ =dS and case – 1.

137
10
20
30
40
50
60
70
Nu
Rej = 9300 Rej = 14400 Rej = 18800
10
20
30
40
50
60
70
Nu
0 30 60 90 120
X/d
10
20
30
40
50
60
70
Nu
H/d = 5
H/d = 7
H/d = 9
Figure 6.5 Effect of jet Reynolds number and feeding channel aspect ratio 9/5 ≤≤ dH on
local Nusselt number distribution for 6/ =dS and case – 2..

138
Figure 6.6 presents the local Nusselt number distribution for case – 3 where the air
exits from both the directions at low dX / )0/( =dX and large dX / )3.114/( =dX . It is
observed that the crossflow develops at both the exit directions, which reduces the heat
transferred from the target surfaces. Similar to heat transfer observed from case – 1 and case
– 2, 9/ =dH has the maximum heat transfer for case – 3. 9/ =dH gives a maximum of
32% more heat transfer compared to 7/ =dH and 7/ =dH gives a maximum of 17%
more heat transfer compared to 5/ =dH . The magnitude of local Nusselt number at
2.72/2.31 ≤≤ dX is more compared to the other dX / locations this is due to the strong
impingement of jets at the centre of the target surface compared to the exit locations where
the crossflow dominates the impingement effect. Small peaks of local Nusselt number are
observed at 80/ =dX and 60/ =dX . At 30/0 ≤≤ dX and 3.114/4.80 ≤≤ dX a linearly
decreasing local Nusselt number distribution is observed towards the exit this is primarily
due to the crossflow obstructing the impinging jets towards the exit of impingement channel.
The difference in the magnitude of local Nusselt number for an increase of jet Reynolds
number from 9300Re =j to 14400Re =j is similar to the increase in magnitude from
14400Re =j and 18800Re =j for all the feeding channel aspect ratios studied. Similar to
the outflow orientations 1 and 2, 18800Re =j gives the maximum values of local Nusselt
number compared to the other jet Reynolds numbers studied.

139
10
20
30
40
50
60
70
Nu
Rej = 9300 Rej = 14400 Rej = 18800
10
20
30
40
50
60
70
Nu
0 30 60 90 120
X/d
10
20
30
40
50
60
70
Nu
H/d = 5
H/d = 7
H/d = 9
Figure 6.6 Effect of jet Reynolds number and feeding channel aspect ratio 9/5 ≤≤ dH on
local Nusselt number distribution for 6/ =dS and case – 3.

140
6.3 Effect of outflow orientation on local Nusselt number
Figure 6.7 – 6.9 shows the effect of the outflow orientation for different feeding
channel aspect ratios 9/5 ≤≤ dH on local Nusselt number. The results are presented for
6/ =dS , due to the highest amount of heat transfer observed among all the jet-to-plate
distances investigated. All the jet Reynolds numbers studied 18800Re9300 ≤≤ j are
discussed individually.
Figure 6.7 represents the effect of the outflow orientation on the local Nusselt number
distribution plotted for different feeding channel aspect ratios 9/5 ≤≤ dH for 9300Re =j .
Among all the feeding channel aspect ratios studied very less variation in the magnitude of
local Nusselt number is observed with respect to outflow orientation at 2.72/2.31 ≤≤ dX
for case – 2 and case – 3. Whereas, for case – 1 a linearly decreasing local Nusselt number
distribution is observed from 4.80/ =dX to 2.31/ =dX , this may be due to the crossflow
getting intensified towards the exit, opposing and decreasing the strength of the impingement
jets. At 3.114/4.80 ≤≤ dX for all the feeding channel aspect ratios studied, case – 1 has the
highest heat transfer due to air entering the impingement channel at this location resulting in
stronger impingement reducing the boundary layer thickness. Similar to the above
discussions, 9/ =dH has the maximum heat transfer over the entire length of the target
surface. It is also observed that case – 2 has the least magnitude of local Nusselt number over
the entire length of the target surface for all the feeding channel aspect ratios studied.

141
10
20
30
40
50
60
Nu
Case - 1 Case - 2 Case - 3
10
20
30
40
50
60
Nu
0 30 60 90 120
X/d
10
20
30
40
50
60
Nu
H/d = 5
H/d = 7
H/d = 9
Figure 6.7 Effect of outflow orientation and feeding channel aspect ratio 9/5 ≤≤ dH on
local Nusselt number distribution for 6/ =dS and 9300Re =j .

142
Figure 6.8 shows the effect of feeding channel aspect ratio on the local Nusselt
number distribution for different outflow orientations studied and for 14400Re =j . It is
observed that as the jet Reynolds number increases from 9300 to 14400 a maximum of 33%
increase in local Nusselt number is found similar to 9300Re =j , case – 1 has maximum heat
transfer at 3.114/4.80 ≤≤ dX due to the strong impingement of jets. Whereas case – 2 has
the least magnitude of local Nusselt number due to the obstruction to the impinging jets
caused by the crossflow. Similar to 9300Re =j , the local Nusselt number distribution at
2.72/2.31 ≤≤ dX is uniform for case – 3 and case – 2 whereas a linearly decreasing local
Nusselt number distribution is observed at 23/ =dX towards 0/ =dX . Similar to
9300Re =j , 9/ =dH has the highest magnitude of local Nusselt number compared to the
other two feeding channel aspect ratios studied. Unlike 9300Re =j , where the variation in
the magnitude of local Nusselt number is very less, for 14400Re =j the variation with
respect to outflow orientation is more comparatively for all the feeding channel aspect ratios
studied.
Figure 6.9 shows the effect of feeding channel aspect ratio on the local Nusselt
number distribution for all the outflow orientations and for 18800Re =j . It is observed that
very less variation in local Nusselt number values is observed at large dX /
)3.114/4.80( ≤≤ dX compared to 9300Re =j and 14400Re =j for all the outflow
orientations studied. Moreover as the dH / values increase from 5 to 9 a corresponding
increase in the magnitude of local Nusselt number is observed. Similar to the other to jet

143
Reynolds number investigated at 2.72/2.31 ≤≤ dX , case – 3 and case – 2 have the uniform
distribution of local Nusselt number whereas case – 1 has a linearly decreasing local Nusselt
number from 4.80/ =dX to 2.31/ =dX , the reason being explained previously. Maximum
heat transfer is observed for 9/ =dH similar to 7500&5000Re =j followed by 7/ =dH
and 5/ =dH .
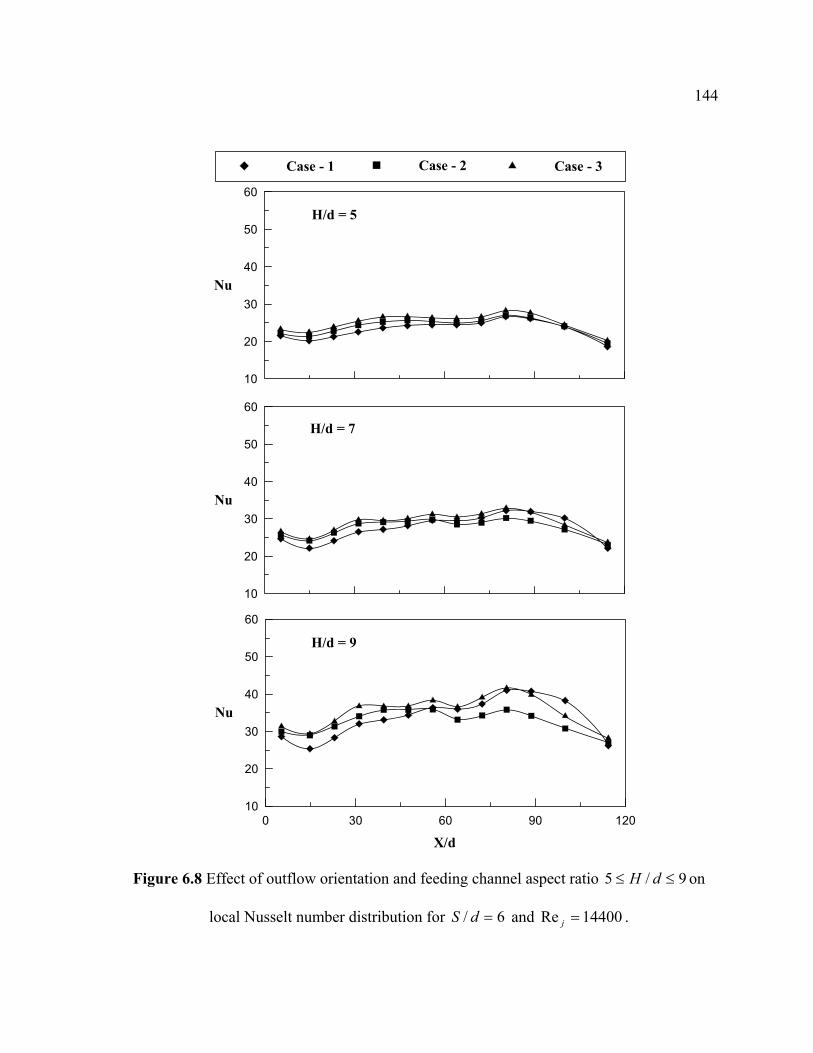
144
10
20
30
40
50
60
Nu
Case - 1 Case - 2 Case - 3
10
20
30
40
50
60
Nu
0 30 60 90 120
X/d
10
20
30
40
50
60
Nu
H/d = 5
H/d = 7
H/d = 9
Figure 6.8 Effect of outflow orientation and feeding channel aspect ratio 9/5 ≤≤ dH on
local Nusselt number distribution for 6/ =dS and 14400Re =j .

145
10
20
30
40
50
60
Nu
Case - 1 Case - 2 Case - 3
10
20
30
40
50
60
Nu
0 30 60 90 120
X/d
10
20
30
40
50
60
Nu
H/d = 5
H/d = 7
H/d = 9
Figure 6.9 Effect of outflow orientation and feeding channel aspect ratio 9/5 ≤≤ dH on
local Nusselt number distribution for 6/ =dS and 18800Re =j .

146
6.4 Effect of Jet-to-plate distance on local Nusselt number
Figure 6.10 – 6.12, gives a detail insight into the local Nusselt number distribution for
different jet-to-plate distances 8/4 ≤≤ dS and 18800Re =j presenting the effect of
feeding channel aspect ratio 9/5 ≤≤ dH on the heat transfer from the target surface. Jet
Reynolds number 18800Re =j is selected for presenting the results as this gives the
maximum heat transfer among all the jet Reynolds numbers studied. All the outflow
orientations are discussed.
Figure 6.10 shows effect of feeding channel aspect ratio on the local Nusselt number
distribution over the entire length of the target surface for case – 1, where the flow exits at
low dX / )0/( =dX . The crossflow develops from large dX / to low dX / as the air exits
at low dX / . The heat transferred from the target surface decreases with an increase in jet-to-
plate distance from dS / = 4 to 8 for all the feeding channel aspect ratios. Over the entire
length of the target surface, the jet-to-plate distance 4/ =dS gives the maximum heat
transfer for all the feeding channel aspect ratios 9/5 ≤≤ dH studied. Observing the effect
of the feeding channel aspect ratio on the local Nusselt number distribution, 9/ =dH gives
the maximum heat transfer among all the feeding channel aspect ratios studied. 7/ =dH
gives a maximum of 5% increase in the local Nusselt number compared to 5/ =dH ,
whereas 9/ =dH gives 34% increase in local Nusselt number is observed compared to
7/ =dH . As discussed earlier in figure 6.1, a peak of local Nusselt number at 4.80/ =dX
is observed this is due to the flow entering the impingement channel at large dX / , where
the effect of crossflow is minimal. At 2.72/2.31 ≤≤ dX crossflow dominates the

147
impingement of jets and a linearly decreasing distribution of local Nusselt number is
observed towards the exit.
Figure 6.11 shows the effect of the feeding channel aspect ratio on the local Nusselt
number distribution for case – 2 comparing with all the jet-to-plate distances studied. For
case – 2 the flow exits at low dX / )0/( =dX , causing crossflow development towards the
exit. 4/ =dS has the maximum heat transfer from the entire length of the target surface for
the feeding channel aspect ratios 5/ =dH and 7/ =dH . For 9/ =dH , 6/ =dS gives the
maximum amount of heat transfer from the entire target surface. For case – 2, 7/ =dH
gives 20% more heat transfer from the target surface compared to 5/ =dH whereas
9/ =dH gives a maximum of 16% increase in heat transfer is observed compared to
7/ =dH . It is also observed that the local Nusselt number distribution is sensitive to a
change in jet-to-plate distance for 4/ =dS and 6/ =dS for the feeding channel aspect ratio
7/ =dH , whereas some variation in the magnitude of the local Nusselt number is observed
for a change in the jet-to-plate distance for other feeding channel aspect ratios studied.

148
20
30
40
50
60
70
Nu
S/d = 4 S/d = 6 S/d = 8
20
30
40
50
60
70
Nu
0 30 60 90 120
X/d
20
30
40
50
60
70
Nu
H/d = 5, Rej = 18800
H/d = 7, Rej = 18800
H/d = 9, Rej = 18800
Figure 6.10 Effect of jet-to-plate distance and feeding channel aspect ratio 9/5 ≤≤ dH on
local Nusselt number distribution for 18800Re =j and case – 1.
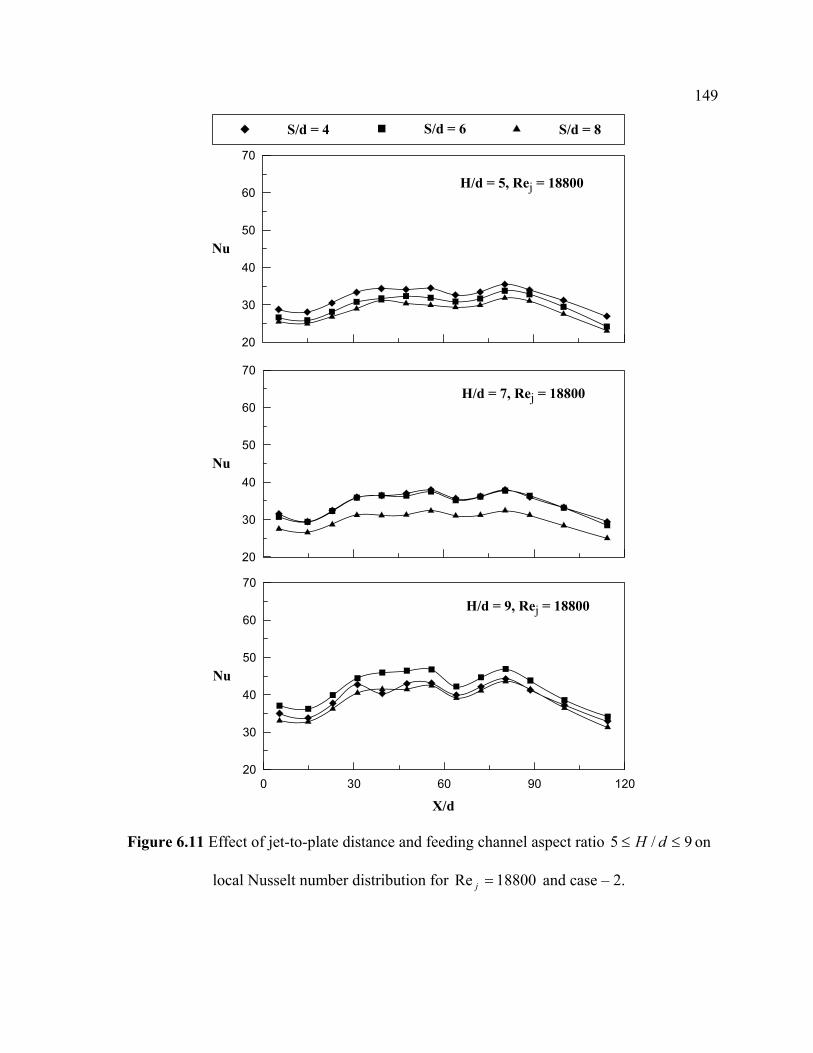
149
20
30
40
50
60
70
Nu
S/d = 4 S/d = 6 S/d = 8
20
30
40
50
60
70
Nu
0 30 60 90 120
X/d
20
30
40
50
60
70
Nu
H/d = 5, Rej = 18800
H/d = 7, Rej = 18800
H/d = 9, Rej = 18800
Figure 6.11 Effect of jet-to-plate distance and feeding channel aspect ratio 9/5 ≤≤ dH on
local Nusselt number distribution for 18800Re =j and case – 2.

150
Figure 6.12 shows the effect of feeding channel aspect ratio on the local Nusselt
number distribution for case – 3 and for different jet-to-plate distances 8/4 ≤≤ dS . For case
– 3 air exits at 0/ =dX and 3.114/ =dX , where the crossflow has a predominant effect
over the heat transfer characteristics. It is observed that at 30/0 ≤≤ dX and
3.114/4.80 ≤≤ dX the local Nusselt number decreases towards exit, this may be due to the
crossflow at the exit and thus reduces the strength of the impinging jets and the heat
transferred from the target surface. The magnitude of local Nusselt number at
2.72/2.31 ≤≤ dX is high compared to the other dX / locations this may be due to the
strong impingement of jets. For an increase in jet-to-plate distance a corresponding decrease
in local Nusselt number is found for 5/ =dH and 7/ =dH , whereas 6/ =dS has
maximum values of local Nusselt number for 9/ =dH . Considering the effect of feeding
channel aspect ratio on heat transfer characteristics in detail, 9/ =dH gives the highest heat
transfer similar to case – 1 and case – 2. 9/ =dH gives a maximum of 31% more heat
transfer compared to 7/ =dH , further 7/ =dH gives a maximum of 11% more heat
transfer is observed compared to 5/ =dH . Among all the jet-to-plate distances investigated
4/ =dS gives the maximum heat transfer over the entire target surface for 5/ =dH and
7/ =dH , this is due to the strong impingement of the jets, with less jet travel distance,
which thins the boundary layer resulting in high heat transfer. With respect to the effect of
jet-to-plate distance, it is observed that the variation in local Nusselt number is minimum to a
change in jet-to-plate distance for all the feeding channel aspect ratios.

151
20
30
40
50
60
70
Nu
S/d = 4 S/d = 6 S/d = 8
20
30
40
50
60
70
Nu
0 30 60 90 120
X/d
20
30
40
50
60
70
Nu
H/d = 5, Rej = 18800
H/d = 7, Rej = 18800
H/d = 9, Rej = 18800
Figure 6.12 Effect of jet-to-plate distance and feeding channel aspect ratio 9/5 ≤≤ dH on
local Nusselt number distribution for 18800Re =j and case – 3.

152
6.5 Average Nusselt Number
Figures 6.13 – 6.14 shows the average Nusselt number avgNu as a function of jet
Reynolds number jRe , plotted for all outflow orientations and the jet-to-plate distance
8/4 ≤≤ dS . The value of avgNu is an average of the detailed results on the target surface.
6.5.1 Effect of feeding channel aspect ratio
Figure 6.14 shows the effect of feeding channel aspect ratio studied 9/5 ≤≤ dH on
the averaged Nusselt number for different outflow orientation. It is observed that the
averaged Nusselt number increases linearly with an increase in the jet Reynolds number, as
stated in the previous discussion. Considering the effect of jet-to-plate distance, 4/ =dS
gives the maximum values of averaged Nusselt number due to the stronger impingement of
jets and 8/ =dS gives the least values of averaged Nusselt number as the crossflow
dominates the impingement of jets. Averaged Nusselt number is sensitive for a change in jet-
to-plate distance for the feeding channel aspect ratio 5/ =dH , whereas it is less sensitive for
the other two feeding channel aspect ratios as no much variation is observed with an increase
in jet-to-plate distance comparatively. For 14400Re =j , less variation in the magnitude of
avgNu is observed for a change in the jet-to-plate distance compared to the other two jet
Reynolds numbers for feeding channel aspect ratios 7/ =dH and 9/ =dH .
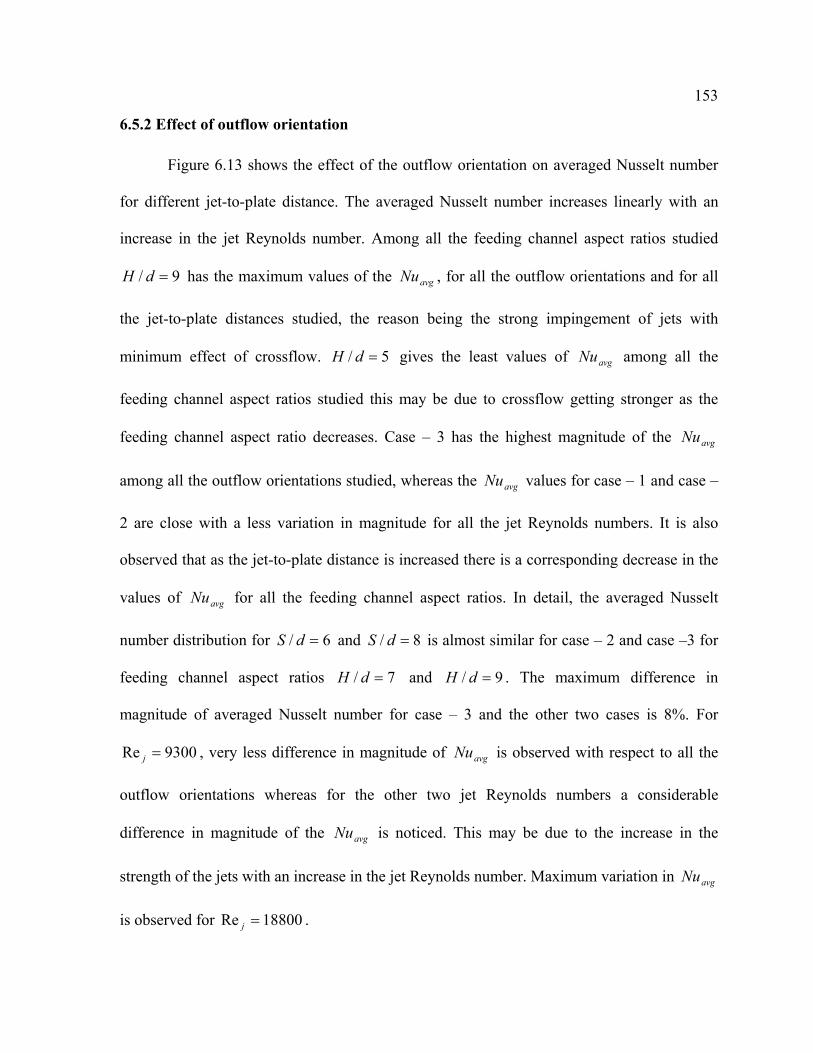
153
6.5.2 Effect of outflow orientation
Figure 6.13 shows the effect of the outflow orientation on averaged Nusselt number
for different jet-to-plate distance. The averaged Nusselt number increases linearly with an
increase in the jet Reynolds number. Among all the feeding channel aspect ratios studied
9/ =dH has the maximum values of the avgNu , for all the outflow orientations and for all
the jet-to-plate distances studied, the reason being the strong impingement of jets with
minimum effect of crossflow. 5/ =dH gives the least values of avgNu among all the
feeding channel aspect ratios studied this may be due to crossflow getting stronger as the
feeding channel aspect ratio decreases. Case – 3 has the highest magnitude of the avgNu
among all the outflow orientations studied, whereas the avgNu values for case – 1 and case –
2 are close with a less variation in magnitude for all the jet Reynolds numbers. It is also
observed that as the jet-to-plate distance is increased there is a corresponding decrease in the
values of avgNu for all the feeding channel aspect ratios. In detail, the averaged Nusselt
number distribution for 6/ =dS and 8/ =dS is almost similar for case – 2 and case –3 for
feeding channel aspect ratios 7/ =dH and 9/ =dH . The maximum difference in
magnitude of averaged Nusselt number for case – 3 and the other two cases is 8%. For
9300Re =j , very less difference in magnitude of avgNu is observed with respect to all the
outflow orientations whereas for the other two jet Reynolds numbers a considerable
difference in magnitude of the avgNu is noticed. This may be due to the increase in the
strength of the jets with an increase in the jet Reynolds number. Maximum variation in avgNu
is observed for 18800Re =j .

154
10
20
30
40
50
Nu a
vg
H/d = 5 H/d = 7
10
20
30
40
50
10
20
30
40
50
H/d = 9
S/d = 4, Case - 1
10
20
30
40
50
Nu a
vg
8000 12000 16000 20000
Rej
10
20
30
40
50
Nu a
vg
10
20
30
40
50
10
20
30
40
50
8000 12000 16000 20000
Rej
10
20
30
40
50
8000 12000 16000 20000
Rej
10
20
30
40
50
S/d = 6, Case - 1 S/d = 8, Case - 1
S/d = 4, Case - 2 S/d = 6, Case - 2 S/d = 8, Case - 2
S/d = 4, Case - 3 S/d = 6, Case - 3 S/d = 8, Case - 3
Figure 6.13 Effect of feeding channel aspect ratio )9/5( ≤≤ dH and jet-to-plate distances
on averaged Nusselt number for different outflow orientation.

155
10
20
30
40
50
Nu a
vg
Case - 1 Case - 2
10
20
30
40
50
10
20
30
40
50
Case - 3
H/d = 5, S/d = 4
10
20
30
40
50
Nu a
vg
8000 12000 16000 20000
Rej
10
20
30
40
50
Nu a
vg
10
20
30
40
50
10
20
30
40
50
8000 12000 16000 20000
Rej
10
20
30
40
50
8000 12000 16000 20000
Rej
10
20
30
40
50
H/d = 7, S/d = 4 H/d = 9, S/d = 4
H/d = 5, S/d = 6 H/d = 7, S/d = 6 H/d = 9, S/d = 6
H/d = 9, S/d = 8 H/d = 7, S/d = 8 H/d = 9, S/d = 8
Figure 6.14 Effect of outflow orientation and feeding channel aspect ratio on averaged
Nusselt number for different jet-to-plate distances )8/4( ≤≤ dS .

156
6.5.3 Correlations of Averaged Nusselt number
The results for three different outflow orientations are correlated for the jet Reynolds
number jRe and the normalized jet-to-plate distance dS / dependence as
DCBjavg dHdSANu )/()/()(Re= (6.1)
The present results are correlated for all outflow orientations individually for jet Reynolds
number jRe dependence. Previous studies in the field of jet impingement have involved in
developing correlations for the averaged Nusselt number as a function of the jet Reynolds
number by considering many parameters. Correlations by Huang et al [21],Kercher and
Tabakoff [30] and Florscheutz et al [14] are compared to the averaged Nusselt number in the
present investigation. Huang et al [21] studied the outflow orientations similar to ones used
in the present study. They presented results for the outflow orientation 1 and 2 correlating for
Reynolds number dependence as 76.0Re035.0=Nu , whereas for outflow orientation 3 which
has the highest magnitude of heat transferred from the target surface is correlated as
727.0Re082.0=Nu . Kercher and Tabakoff [30] also studied the effect of crossflow and it is
similar to the case – 1 in the present study. They varied the jet hole diameter, the hole
spacing x, y and the jet to target plate distance. Based on all of these geometrical parameters,
they proposed a correlation of the form 3191.0
21 Pr)/(Re dzNu mφφ= , where 1φ and 2φ are
constants based on dX / and dY / , respectively. Florschuetz et al [14] presented the
correlations with different coefficients of inline and staggered rows. The correlation for jet

157
impingement with minimum crossflow is given as
31554.0068.0422.0554.0 PrRe)()()(363.0 −−−= jdZdYdXNu .
The detailed values of the local Nusselt number are averaged over the entire length of
the target surface to obtain a single averaged Nusselt number. The averaged Nusselt numbers
for each outflow orientation are plotted against the jet Reynolds number. The present results
are correlated for the jet Reynolds number dependence as
180.2415.0794.0 )/()/()(Re0399.0 dHdSNu javg = for case 1 and 2. The correlations for Huang
et al [21] for case 1 and 2 are in good comparison with the present study. Kercher and
Tabakoff [30] presented the results for the outflow orientation – 1 and the results of the
present study are in good comparison with the existing correlation. The case with maximum
heat transfer from the target surface, outflow orientation – 3, is correlated for the jet
Reynolds number dependence as 675.4354.0785.0 )/()/()(Re0479.0 dHdSNu javg = . The
correlation used from Florschuetz et al [14] is for the case with minimum crossflow. Huang
et al [21] also presented a separate correlation for the case with high heat transfer; this case in
their study had the less crossflow effect. The results from the present study for case – 3 are
lower than the existing correlations, which includes the crossflow effect. The correlation for
case – 3 in the present study is in good agreement with the correlation presented by
Florschuetz et al [14] and Huang et al [21]. Thus it is evident from the above discussion that
the crossflow effect is more dominant on outflow orientation 1 and 2 compared to outflow
orientation – 3.

158
10000 20000 40000800060004000
100
200
300
50
30
20
Huang et al[17] (case 1 & 2)Kercher & Tabakoff [10]Huang et al [17] (case - 3)Florschuetz et al [2]Case - 1Case - 2Case - 3
Nuavg = 0.0479 (Rej)0.785(S/d)0.354(H/d)4.675
[2]
[10]
[17]Nuavg = 0.0399 (Rej)
0.794(S/d)0.415(H/d)2.180
Figure 6.15 Averaged Nusselt number comparisons with the existing correlations

159
CHAPTER 7
ORIFICE PLATE - 3
In this chapter a detailed discussion on the results obtained by using the orifice plate 3
(staggered arrangement of jets) with jet diameter cmd 5.0= are presented. Nusselt number
distribution is presented as a function of non-dimensional distance along the entire length of
the heated target surface and also as a function of the jet Reynolds number. As presented in
the earlier chapters 5 and 6, Nusselt number distributions are shown for all the feeding
channel aspect ratios studied 9/5 ≤≤ dH , the jet-to-plate distance 8/4 ≤≤ dS , and for
three jet Reynolds numbers being investigated 18800Re9300 ≤≤ j . First a detail insight into
the effect of jet Reynolds number onto the Nusselt number distribution, which also covers the
effect of feeding channel aspect ratio on the Nusselt number. Next, the effect of the jet-to-
plate distance onto the Nusselt number behavior is presented. Next, the effect of the outflow
orientation on the Nusselt number distribution along the entire surface is investigated. Finally
the average Nusselt number distribution is plotted as a function of the jet Reynolds number.
7.1 Effect of feeding channel aspect ratio on local Nusselt number
Figure 7.1 – 7.3, gives a detail insight into the local Nusselt number distribution
presenting the effect of feeding channel aspect ratio 9/5 ≤≤ dH on the heat transfer from
the target surface.

160
All the results are presented for jet-to-plate distance 6/ =dS as this jet-to-plate
distance gives maximum heat transfer. All the outflow orientations are discussed.
Figure 7.1 shows effect of feeding channel aspect ratio on the local Nusselt number
distribution over the entire length of the target surface for case – 1, where the flow exits at
low dX / )0/( =dX . The crossflow develops from large dX / to low dX / as the air exits
at low dX / . The heat transferred from the target surface decreases with an decrease in
feeding channel aspect ratio from dH / = 9 to 5 for all the feeding channel aspect ratios.
Over the entire length of the target surface, the feeding channel aspect ratio 5/ =dH gives
the maximum heat transfer for all the jet Reynolds numbers 18800Re9300 ≤≤ j studied.
This is primarily due to the increase in the strength of the jets at low feeding channel aspect
ratios. Observing the effect of the feeding channel aspect ratio on the local Nusselt number
distribution for all the jet Reynolds numbers studied, 5/ =dH gives the maximum heat
transfer among all the feeding channel aspect ratios studied. The difference in the magnitude
of the local Nusselt number for all the feeding channel aspect ratios is very less for all the jet
Reynolds number studied. This is observed by the curves overlapping over each other. With
an increase in the feeding channel aspect ratio the difference in the magnitude of the local
Nusselt number also increases for an increase in the jet Reynolds number. Among all the
Reynolds numbers studied, 18800Re =j gives the maximum heat transfer. As discussed
earlier in figure 7.1, a peak of local Nusselt number at 4.80/ =dX is observed this is due to
the flow entering the impingement channel at large dX / , where the effect of crossflow is
minimal. At 2.72/2.31 ≤≤ dX crossflow dominates the impingement of jets and a linearly
decreasing distribution of local Nusselt number is observed towards the exit.

161
Figure 7.2 shows the effect of the feeding channel aspect ratio on the local Nusselt
number distribution for case – 2 and for jet-to-plate distance 6/ =dS . For case – 2 the flow
exits at low dX / )0/( =dX , causing crossflow development towards the exit. 5/ =dH
gives the maximum heat transfer over the entire length of the target surface for all the jet
Reynolds numbers studied. For all the jet Reynolds numbers studied, 5/ =dH gives a
marginal increase in heat transfer from the target surface compared to 7/ =dH whereas
5/ =dH gives a maximum of 4% increase in heat transfer is observed compared to
9/ =dH . It is also observed that the magnitude of the local Nusselt number increases with
an increase in the jet Reynolds number for all the feeding channel aspect ratios studied. The
variation in the local Nusselt number is more sensitive with respect to a change in feeding
channel aspect ratio at high jet Reynolds number whereas it is less sensitive at low jet
Reynolds numbers. At 3.114/4.80 ≤≤ dX the magnitude of local Nusselt number decreases
from 4.80/ =dX to 3.114/ =dX , this is due to the obstruction caused by the crossflow to
the impinging jets.
Figure 7.3 shows the effect of feeding channel aspect ratio on the local Nusselt
number distribution for case – 3 and for jet-to-plate distance 6/ =dS . For case – 3 air exits
at 0/ =dX and 3.114/ =dX , where the crossflow has a predominant effect over the heat
transfer characteristics. It is observed that at 30/0 ≤≤ dX and 3.114/4.80 ≤≤ dX the
local Nusselt number decreases towards exit, this may be due to the crossflow at the exit and
thus reduces the strength of the impinging jets and the heat transferred from the target
surface. The magnitude of local Nusselt number at 2.72/2.31 ≤≤ dX is high compared to
the other dX / locations this may be due to the strong impingement of jets. For an increase

162
in feeding channel aspect ratio a corresponding increase in local Nusselt number is observed.
5/ =dH gives the maximum values of local Nusselt numbers for all the jet Reynolds
numbers studied. Considering the effect of feeding channel aspect ratio for all jet Reynolds
numbers on heat transfer characteristics in detail, 5/ =dH gives the highest heat transfer
similar to case – 1 and case – 2. 5/ =dH gives a marginal increase in heat transfer
compared to 7/ =dH , further 5/ =dH gives a maximum of 5% more heat transfer
compared to 9/ =dH . Similar to case – 1 and case – 2, with respect to the effect of feeding
channel aspect ratio on local Nusselt number characteristics it is observed that the local
Nusselt number is sensitive to a change in feeding channel aspect ratio at high jet Reynolds
numbers.

163
10
20
30
40
50
60
Nu
H/d = 5 H/d = 7 H/d = 9
10
20
30
40
50
60
Nu
0 30 60 90 120
X/d
10
20
30
40
50
60
Nu
Rej = 9300
Rej = 14400
Rej = 18800
Figure 7.1 Effect of feeding channel aspect ratio 9/5 ≤≤ dH on local Nusselt number
distribution for case – 1 and jet-to-plate distance 6/ =dS .

164
10
20
30
40
50
60
Nu
H/d = 5 H/d = 7 H/d = 9
10
20
30
40
50
60
Nu
0 30 60 90 120
X/d
10
20
30
40
50
60
Nu
Rej = 9300
Rej = 14400
Rej = 18800
Figure 7.2 Effect of feeding channel aspect ratio 9/5 ≤≤ dH on local Nusselt number
distribution for case – 2 and jet-to-plate distance 6/ =dS .

165
10
20
30
40
50
60
Nu
H/d = 5 H/d = 7 H/d = 9
10
20
30
40
50
60
Nu
0 30 60 90 120
X/d
10
20
30
40
50
60
Nu
Rej = 9300
Rej = 14400
Rej = 18800
Figure 7.3 Effect of feeding channel aspect ratio 9/5 ≤≤ dH on local Nusselt number
distribution for case – 3 and jet-to-plate distance 6/ =dS .

166
7.2 Effect of jet Reynolds number on local Nusselt number
Figure 7.4 – 7.6 shows the local Nusselt number distribution for different jet
Reynolds numbers 18800Re9300 ≤≤ j , for jet-to-plate distance 6/ =dS , expressing the
effect of the feeding channel aspect ratio on the heat transfer from the heated target surface.
Among all the jet-to-plate distances studied 6/ =dS is considered, as it is the best case in
which maximum heat is transferred from the target surface.
Figure 7.4 shows the local Nusselt number distribution plotted for case – 1, which
gives a detailed insight into the effect of the feeding channel aspect ratio. Three different
values of the feeding channel aspect ratio are considered in this part of the study
9/5 ≤≤ dH . The results are presented for three jet Reynolds numbers 18800Re9300 ≤≤ j .
It is observed that for an increase in the jet Reynolds number there is a corresponding
increase in the magnitude of local Nusselt number. Highest values of local Nusselt number
are observed for 18800Re =j compared to the other two jet Reynolds numbers. Increasing
the jet Reynolds number from 9300Re =j to 14400Re =j gives a maximum of 11%
increase in the local Nusselt number values whereas for an increase from 14400Re =j to
18800Re =j a large increase of 42% in magnitude of local Nusselt number is observed
indicating the increase in strength of jets with an increase in jet Reynolds number. For case –
1, the flow exits the impingement channel at low dX / )0/( =dX . At large
dX / )4.80/( =dX a peak of local Nusselt number is observed this may be due to strong
impingement of the air jets and also because the effect of crossflow is minimal, which
reduces the boundary layer thickness. Among all the feeding channel aspect ratios examined

167
9/5 ≤≤ dH , 5/ =dH gives the maximum values of local Nusselt number for all the jet-to-
plate distances studied. 5/ =dH gives a marginal increase in the local Nusselt number from
the target surface compared to 7/ =dH , whereas 7% increase in local Nusselt number is
observed compared to 9/ =dH . At 2.72/2.31 ≤≤ dX a uniform decrease in magnitude of
local Nusselt number is observed along the target surface from 2.72/ =dX to 0/ =dX for
all the feeding channel aspect ratios studied, this may be due to the crossflow of the air
generated towards the exit.
Figure 7.5 shows the effect of feeding channel aspect ratio on the local Nusselt
number distribution for case – 2 as a function of jet Reynolds numbers 18800Re9300 ≤≤ j .
For case – 2 air exits the impingement channel at 3.114/ =dX , this leads to the
development of crossflow towards the exit. Similar to the case – 1 an increase in jet Reynolds
number leads to the corresponding increase in the local Nusselt number for all the feeding
channel aspect ratios studied. The magnitude of local Nusselt number at 2.72/2.31 ≤≤ dX
is more compared to the other dX / locations this may be due to the strong impingement of
jets at this location. Although similar distribution of local Nusselt number is observed for
5/ =dH and 7/ =dH , but 5/ =dH gives a marginal increase in heat transfer from the
entire target surface compared to 7/ =dH and 5/ =dH gives a maximum of 6% more
heat transfer from the entire target surface compared to 9/ =dH . The local Nusselt number
is sensitive for a change in jet Reynolds number, this is observed from the difference in
magnitude of local Nusselt number varying with respect to jet Reynolds number.
18800Re =j gives the maximum values of local Nusselt number for all the feeding channel
aspect ratios studied. Nusselt number distribution for 9300Re =j and 14400Re =j is close

168
with a maximum difference in magnitude being 27%. At 3.114/02.80 ≤≤ dX , a decrease in
local Nusselt number is observed from 02.80/ =dX towards the exit at 3.114/ =dX , this
is due to the development of crossflow towards the exit, which obstructs the impingement of
jets and thickens the boundary layer. This behavior of local Nusselt number at large dX / is
observed for all the feeding channel aspect ratios studied.

169
10
20
30
40
50
60
70
Nu
Rej = 9300 Rej = 14400 Rej = 18800
10
20
30
40
50
60
70
Nu
0 30 60 90 120
X/d
10
20
30
40
50
60
70
Nu
H/d = 5
H/d = 7
H/d = 9
Figure 7.4 Effect of jet Reynolds number on local Nusselt number distribution for 6/ =dS
and case – 1.

170
10
20
30
40
50
60
70
Nu
Rej = 9300 Rej = 14400 Rej = 18800
10
20
30
40
50
60
70
Nu
0 30 60 90 120
X/d
10
20
30
40
50
60
70
Nu
H/d = 5
H/d = 7,
H/d = 9
Figure 7.5 Effect of jet Reynolds number on local Nusselt number distribution for 6/ =dS
and case – 2.

171
Figure 7.6 presents the local Nusselt number distribution for case – 3 where the air
exits from both the directions at low dX / )0/( =dX and large dX / )3.114/( =dX . It is
observed that the crossflow develops at both the exit directions, which reduces the heat
transferred from the target surfaces. Similar to heat transfer observed from case – 1 and case
– 2, 5/ =dH has the maximum heat transfer for case – 3. 5/ =dH gives a maximum of
6.1% more heat transfer compared to 7/ =dH and 5/ =dH gives a maximum of 10.2%
more heat transfer compared to 9/ =dH . The magnitude of local Nusselt number at
2.72/2.31 ≤≤ dX is more compared to the other dX / locations this is due to the strong
impingement of jets at the centre of the target surface compared to the exit locations where
the crossflow is less dominant to the impingement effect. Small peaks of local Nusselt
number are observed at 80/ =dX and 60/ =dX which are the result of the stronger jet
impingement. At 30/0 ≤≤ dX and 3.114/4.80 ≤≤ dX a linearly decreasing local Nusselt
number distribution is observed towards the exit this is primarily due to the crossflow
obstructing the impinging jets towards the exit of impingement channel. The difference in the
magnitude of local Nusselt number for an increase of jet Reynolds number from 9300Re =j
to 14400Re =j is similar to the increase in magnitude from 14400Re =j and 18800Re =j
for all the feeding channel aspect ratios studied. Similar to the outflow orientations 1 and 2,
18800Re =j gives the maximum values of local Nusselt number compared to the other jet
Reynolds numbers studied.

172
10
20
30
40
50
60
70
Nu
Rej = 9300 Rej = 14400 Rej = 18800
10
20
30
40
50
60
70
Nu
0 30 60 90 120
X/d
10
20
30
40
50
60
70
Nu
H/d = 5
H/d = 7
H/d = 9
Figure 7.6 Effect of jet Reynolds number on local Nusselt number distribution for 6/ =dS
and case – 3.

173
7.3 Effect of outflow orientation on local Nusselt number
Figure 7.7 – 7.9 shows the effect of the outflow orientation for different feeding
channel aspect ratios 9/5 ≤≤ dH on local Nusselt number. The results are presented for
6/ =dS , due to the highest amount of heat transfer observed among all the jet-to-plate
distances investigated. All the jet Reynolds numbers studied 18800Re9300 ≤≤ j are
discussed individually.
Figure 7.7 represents the effect of the outflow orientation on the local Nusselt number
distribution plotted for different feeding channel aspect ratios 9/5 ≤≤ dH for 9300Re =j .
Among all the feeding channel aspect ratios studied very less variation in the magnitude of
local Nusselt number is observed with respect to outflow orientation at 2.72/2.31 ≤≤ dX
for case – 2 and case – 3. Whereas, for case – 1 a linearly decreasing local Nusselt number
distribution is observed from 4.80/ =dX to 2.31/ =dX , this may be due to the crossflow
getting intensified towards the exit, opposing and decreasing the strength of the impingement
jets. At 3.114/4.80 ≤≤ dX for all the feeding channel aspect ratios studied, case – 1 has the
highest heat transfer due to air entering the impingement channel at this location resulting in
stronger impingement reducing the boundary layer thickness. Similar to the above
discussions, 5/ =dH gives the maximum heat transfer over the entire length of the target
surface. It is also observed that case – 2 has the least magnitude of local Nusselt number over
the entire length of the target surface for all the feeding channel aspect ratios studied.

174
10
20
30
40
50
60
Nu
Case - 1 Case - 2 Case - 3
10
20
30
40
50
60
Nu
0 30 60 90 120
X/d
10
20
30
40
50
60
Nu
H/d = 5
H/d = 7
H/d = 9
Figure 7.7 Effect of outflow orientation on local Nusselt number distribution for 6/ =dS
and 9300Re =j .

175
Figure 7.8 shows the effect of feeding channel aspect ratio on the local Nusselt
number distribution for different outflow orientations studied and for 14400Re =j . It is
observed that as the jet Reynolds number increases from 9300 to 14400 a maximum of 23%
increase in local Nusselt number is found similar to 9300Re =j , case – 1 has maximum heat
transfer at 3.114/4.80 ≤≤ dX due to the strong impingement of jets. Whereas case – 2 has
the least magnitude of local Nusselt number due to the obstruction to the impinging jets
caused by the crossflow. Similar to 9300Re =j , the local Nusselt number distribution at
2.72/2.31 ≤≤ dX is uniform for case – 3 and case – 2 whereas a linearly decreasing local
Nusselt number distribution is observed at 23/ =dX towards 0/ =dX . Similar to
9300Re =j , 5/ =dH has the highest magnitude of local Nusselt number compared to the
other two feeding channel aspect ratios studied. Unlike 9300Re =j , where the variation in
the magnitude of local Nusselt number is very less, for 14400Re =j the variation with
respect to outflow orientation is more comparatively for all the feeding channel aspect ratios
studied.
Figure 7.9 shows the effect of feeding channel aspect ratio on the local Nusselt
number distribution for all the outflow orientations and for 18800Re =j . It is observed that
as the jet Reynolds number increases from 14400 to 18800 a maximum of 37% increase in
local Nusselt number is found similar to 14400Re =j . It is also observed that very less
variation in local Nusselt number is observed at large dX / )3.114/4.80( ≤≤ dX compared
to 9300Re =j and 14400Re =j for all the outflow orientations studied. Moreover as the

176
dH / values increase from 5 to 9 a corresponding decrease in the magnitude of local Nusselt
number is observed. Similar to the other two jet Reynolds number investigated at
2.72/2.31 ≤≤ dX , case – 3 and case – 2 have the uniform distribution of local Nusselt
number whereas case – 1 has a linearly decreasing local Nusselt number from 4.80/ =dX
to 2.31/ =dX , the reason being explained previously. Maximum heat transfer is observed
for 5/ =dH similar to 14400&9300Re =j followed by 7/ =dH and 9/ =dH .

177
10
20
30
40
50
60
Nu
Case - 1 Case - 2 Case - 3
10
20
30
40
50
60
Nu
0 30 60 90 120
X/d
10
20
30
40
50
60
Nu
H/d = 5
H/d = 7
H/d = 9
Figure 7.8 Effect of outflow orientation on local Nusselt number distribution for 6/ =dS
and 14400Re =j .

178
10
20
30
40
50
60
Nu
Case - 1 Case - 2 Case - 3
10
20
30
40
50
60
Nu
0 30 60 90 120
X/d
10
20
30
40
50
60
Nu
H/d = 5
H/d = 7
H/d = 9
Figure 7.9 Effect of outflow orientation on local Nusselt number distribution for 6/ =dS
and 18800Re =j .

179
7.4 Effect of jet-to-plate distance on local Nusselt number
Figure 7.10 – 7.12, gives a detail insight into the local Nusselt number distribution for
different jet-to-plate distances 8/4 ≤≤ dS and 18800Re =j presenting the effect of
feeding channel aspect ratio 9/5 ≤≤ dH on the heat transfer from the target surface. Jet
Reynolds number 18800Re =j is selected for presenting the results as this gives the
maximum heat transfer among all the jet Reynolds numbers studied. All the outflow
orientations are discussed.
Figure 7.10 shows the effect of feeding channel aspect ratio on the local Nusselt
number distribution over the entire length of the target surface for case – 1, where the flow
exits at low dX / )0/( =dX . The crossflow develops from large dX / to low dX / as the
air exits at low dX / . The heat transferred from the target surface decreases with an increase
in jet-to-plate distance from dS / = 4 to 8 for all the feeding channel aspect ratios. Over the
entire length of the target surface, the jet-to-plate distance 4/ =dS gives the maximum heat
transfer for all the feeding channel aspect ratios 9/5 ≤≤ dH studied. Observing the effect
of the feeding channel aspect ratio on the local Nusselt number distribution, 5/ =dH gives
the maximum heat transfer among all the feeding channel aspect ratios studied. 5/ =dH
gives a marginal increase in the local Nusselt number compared to 7/ =dH , whereas
5/ =dH gives 6% increase in local Nusselt number is observed compared to 9/ =dH . As
discussed earlier in figure 5.1, a peak of local Nusselt number at 4.80/ =dX is observed
this is due to the flow entering the impingement channel at large dX / , where the effect of
crossflow is minimal. At 2.72/2.31 ≤≤ dX crossflow dominates the impingement of jets
and a linearly decreasing distribution of local Nusselt number is observed towards the exit.

180
Figure 7.11 shows the effect of the feeding channel aspect ratio on the local Nusselt
number distribution for case – 2 comparing with all the jet-to-plate distances studied. For
case – 2 the flow exits at low dX / )0/( =dX , causing crossflow development towards the
exit. 4/ =dS has the maximum heat transfer from the entire length of the target surface for
the feeding channel aspect ratios 5/ =dH and 7/ =dH . For 9/ =dH , 6/ =dS gives the
maximum amount of heat transfer from the entire target surface. For case – 2, 5/ =dH
gives 6.1% more heat transfer from the target surface compared to 7/ =dH whereas
5/ =dH gives a maximum of 9.2% increase in heat transfer is observed compared to
9/ =dH . It is also observed that the local Nusselt number distribution is sensitive to a
change in jet-to-plate distance for 4/ =dS and 6/ =dS for all the feeding channel aspect
ratios, whereas some variation in the magnitude of the local Nusselt number is observed for a
change in the jet-to-plate distance from 6/ =dS to 8/ =dS for all the feeding channel
aspect ratios studied.

181
20
30
40
50
60
70
Nu
S/d = 4 S/d = 6 S/d = 8
20
30
40
50
60
70
Nu
0 30 60 90 120
X/d
20
30
40
50
60
70
Nu
H/d = 5, Rej = 18800
H/d = 7, Rej = 18800
H/d = 9, Rej = 18800
Figure 7.10 Effect of jet-to-plate distance on local Nusselt number distribution for
18800Re =j and case – 1.

182
20
30
40
50
60
70
Nu
S/d = 4 S/d = 6 S/d = 8
20
30
40
50
60
70
Nu
0 30 60 90 120
X/d
20
30
40
50
60
70
Nu
H/d = 5, Rej = 18800
H/d = 7, Rej = 18800
H/d = 9, Rej = 18800
Figure 7.11 Effect of jet-to-plate distance on local Nusselt number distribution for
18800Re =j and case – 2.

183
Figure 7.12 shows the effect of feeding channel aspect ratio on the local Nusselt
number distribution for case – 3 and for three different jet-to-plate distances 8/4 ≤≤ dS .
For case – 3 air exits at 0/ =dX and 3.114/ =dX , where the crossflow has a predominant
effect over the heat transfer characteristics. It is observed that at 30/0 ≤≤ dX and
3.114/4.80 ≤≤ dX the local Nusselt number decreases towards exit, this may be due to the
crossflow at the exit which obstructs the jet impingement and thus reduces the strength of the
impinging jets and thus the heat transferred from the target surface. The magnitude of local
Nusselt number at 2.72/2.31 ≤≤ dX is high compared to the other dX / locations this may
be due to the strong impingement of jets where the effect of crossflow is minimum. For an
increase in jet-to-plate distance a corresponding decrease in local Nusselt number is found
for 5/ =dH and 9/ =dH , whereas 6/ =dS has maximum values of local Nusselt number
for 7/ =dH . Considering the effect of feeding channel aspect ratio on heat transfer
characteristics in detail, 5/ =dH gives the highest heat transfer similar to case – 1 and case
– 2. 5/ =dH gives a maximum of 12% more heat transfer compared to 7/ =dH , further
5/ =dH gives a maximum of 17% more heat transfer is observed compared to 9/ =dH .
Among all the jet-to-plate distances investigated 4/ =dS gives the maximum heat transfer
over the entire target surface for 5/ =dH and 9/ =dH , this is due to the strong
impingement of the jets, with less jet travel distance, which thins the boundary layer resulting
in high heat transfer. With respect to the effect of jet-to-plate distance, it is observed that the
variation in local Nusselt number is less for a change in jet-to-plate distance compared to
case – 1 and case – 2 for all the feeding channel aspect ratios.

184
20
30
40
50
60
70
Nu
S/d = 4 S/d = 6 S/d = 8
20
30
40
50
60
70
Nu
0 30 60 90 120
X/d
20
30
40
50
60
70
Nu
H/d = 5, Rej = 18800
H/d = 7, Rej = 18800
H/d = 9, Rej = 18800
Figure 7.12 Effect of jet-to-plate distance on local Nusselt number distribution for
18800Re =j and case – 3.

185
7.5 Average Nusselt Number
Figures 7.13 – 7.14 shows the average Nusselt number avgNu as a function of jet
Reynolds number jRe , plotted for all outflow orientations and the jet-to-plate distance
8/4 ≤≤ dS . The value of avgNu is an average of the detailed results on the target surface.
7.5.1 Effect of feeding channel aspect ratio
Figure 7.13 shows the effect of feeding channel aspect ratio 9/5 ≤≤ dH on the
averaged Nusselt number for different outflow orientation. It is observed that the averaged
Nusselt number increases linearly with an increase in the jet Reynolds number, as stated in
the previous discussion. Considering the effect of jet-to-plate distance, 6/ =dS gives the
maximum values of averaged Nusselt number due to the stronger impingement of jets and
8/ =dS gives the least values of averaged Nusselt number as the crossflow dominates the
impingement of jets. Averaged Nusselt number is less sensitive for a change in jet-to-plate
distance for the feeding channel aspect ratio 5/ =dH as a large variation in the magnitude is
observed, whereas it is less sensitive for the other two feeding channel aspect ratios as no
much variation is observed with an increase in jet-to-plate distance comparatively. For
14400Re =j , less variation in the magnitude of avgNu is observed for a change in the jet-to-
plate distance compared to the other two jet Reynolds numbers for feeding channel aspect
ratios 7/ =dH and 9/ =dH .

186
7.5.2 Effect of outflow orientation
Figure 7.14 shows the effect of the outflow orientation on averaged Nusselt number
for different jet-to-plate distance. The averaged Nusselt number increases linearly with an
increase in the jet Reynolds number. Among all the feeding channel aspect ratios studied
5/ =dH has the maximum values of the avgNu , for all the outflow orientations and for all
the jet-to-plate distances studied, the reason being the strong impingement of jets with
minimum effect of crossflow. 9/ =dH gives the least values of avgNu among all the
feeding channel aspect ratios studied this may be due to less impingement effect of the jets at
larger feeding channel aspect ratios. Case – 3 has the highest magnitude of the avgNu among
all the outflow orientations studied, whereas the avgNu values for case – 1 and case – 2 are
close with a less variation in magnitude for all the jet Reynolds numbers. It is also observed
that as the jet-to-plate distance is increased there is a corresponding decrease in the values of
avgNu for all the feeding channel aspect ratios. In detail, the averaged Nusselt number
distribution for 6/ =dS and 8/ =dS is almost similar for case – 2 and case –3 for all the
feeding channel aspect ratios. The maximum difference in magnitude of averaged Nusselt
number for case – 3 and the other two cases is 7%. For 9300Re =j , very less difference in
magnitude of avgNu is observed with respect to all the outflow orientations whereas for the
other two jet Reynolds numbers a considerable difference in magnitude of the avgNu is
noticed. This may be due to the increase in the strength of the jets with an increase in the jet
Reynolds number. Maximum variation in avgNu is observed for 18800Re =j .
.
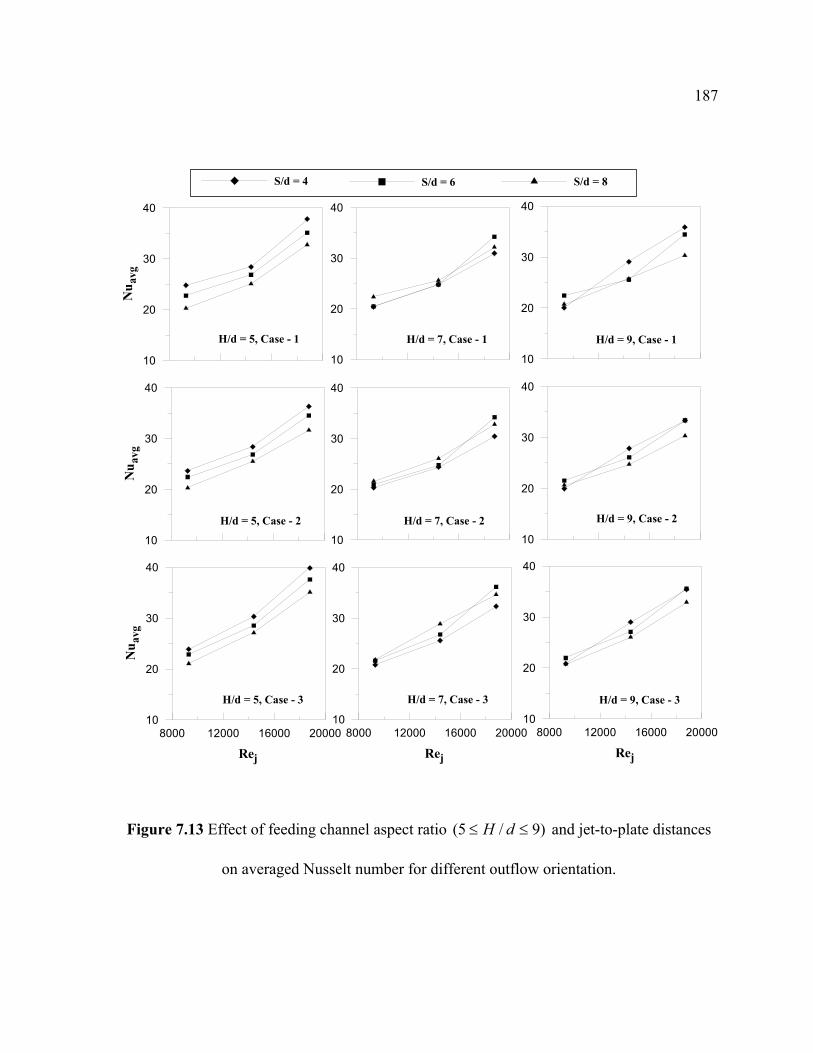
187
10
20
30
40
Nu a
vg
S/d = 4 S/d = 6
10
20
30
40
10
20
30
40
S/d = 8
H/d = 5, Case - 1
10
20
30
40
Nu a
vg
8000 12000 16000 20000
Rej
10
20
30
40
Nu a
vg
10
20
30
40
10
20
30
40
8000 12000 16000 20000
Rej
10
20
30
40
8000 12000 16000 20000
Rej
10
20
30
40
H/d = 7, Case - 1 H/d = 9, Case - 1
H/d = 5, Case - 2 H/d = 7, Case - 2 H/d = 9, Case - 2
H/d = 5, Case - 3 H/d = 7, Case - 3 H/d = 9, Case - 3
Figure 7.13 Effect of feeding channel aspect ratio )9/5( ≤≤ dH and jet-to-plate distances
on averaged Nusselt number for different outflow orientation.

188
10
20
30
40
Nu a
vg
Case - 1 Case - 2
10
20
30
40
10
20
30
40
Case - 3
H/d = 5, S/d = 4
10
20
30
40
Nu a
vg
8000 12000 16000 20000
Rej
10
20
30
40
Nu a
vg
10
20
30
40
10
20
30
40
8000 12000 16000 20000
Rej
10
20
30
40
8000 12000 16000 20000
Rej
10
20
30
40
H/d = 7, S/d = 4 H/d = 9, S/d = 4
H/d = 5, S/d = 6 H/d = 7, S/d = 6 H/d = 9, S/d = 6
H/d = 9, S/d = 8 H/d = 7, S/d = 8 H/d = 9, S/d = 8
Figure 7.14 Effect of outflow orientation and feeding channel aspect ratio on averaged
Nusselt number for different jet-to-plate distances )8/4( ≤≤ dS .

189
7.5.3 Correlations of averaged Nusselt number
The results for three different outflow orientations are correlated for the jet Reynolds
number jRe and the normalized jet-to-plate distance dS / dependence as
DCBjavg dHdSANu )/()/()(Re= (7.1)
The present results are correlated for all outflow orientations individually for jet Reynolds
number jRe dependence. Previous studies in the field of jet impingement have involved in
developing correlations for the averaged Nusselt number as a function of the jet Reynolds
number by considering many parameters. Correlations by Huang et al [21],Kercher and
Tabakoff [30] and Florscheutz et al [14] are compared to the averaged Nusselt number in the
present investigation. Huang et al [21] studied the outflow orientations similar to ones used
in the present study. They presented results for the outflow orientation 1 and 2 correlating for
Reynolds number dependence as 76.0Re035.0=Nu , whereas for outflow orientation 3 which
has the highest magnitude of heat transferred from the target surface is correlated as
727.0Re082.0=Nu . Kercher and Tabakoff [30] also studied the effect of crossflow and it is
similar to the case – 1 in the present study. They varied the jet hole diameter, the hole
spacing x, y and the jet to target plate distance. Based on all of these geometrical parameters,
they proposed a correlation of the form 3191.0
21 Pr)/(Re dzNu mφφ= , where 1φ and 2φ are
constants based on dX / and dY / , respectively. Florschuetz et al [14] presented the
correlations with different coefficients of inline and staggered rows. The correlation for jet

190
impingement with minimum crossflow is given as
31554.0068.0422.0554.0 PrRe)()()(363.0 −−−= jdZdYdXNu .
The detailed values of the local Nusselt number are averaged over the entire length of
the target surface to obtain a single averaged Nusselt number. The averaged Nusselt numbers
for each outflow orientation are plotted against the jet Reynolds number. The present results
are correlated for the jet Reynolds number dependence as
090.2415.0653.0 )/()/()(Re00547.0 dHdSNu javg = for case 1 and 2. The correlations for Huang
et al [21] for case 1 and 2 are in good comparison with the present study. Kercher and
Tabakoff [30] presented the results for the outflow orientation – 1 and the results of the
present study are in good comparison with the existing correlation. The case with maximum
heat transfer from the target surface, outflow orientation – 3, is correlated for the jet
Reynolds number dependence as 575.4354.0745.0 )/()/()(Re000437.0 dHdSNu javg = . The
correlation used from Florschuetz et al [14] is for the case with minimum crossflow. Huang
et al [21] also presented a separate correlation for the case with high heat transfer; this case in
their study had the less crossflow effect. The results from the present study for case – 3 are
lower than the existing correlations, which includes the crossflow effect. The correlation for
case – 3 in the present study is in good agreement with the correlation presented by
Florschuetz et al [14] and Huang et al [21]. Thus it is evident from the above discussion that
the crossflow effect is more dominant on outflow orientation 1 and 2 compared to outflow
orientation – 3.

191
1000 10000 1000002000 5000 20000 5000010
100
20
40
6080
200
400Huang et al[17] (case 1 & 2)Kercher & Tabakoff [10]Huang et al [17] (case - 3)Florschuetz et al [2]Case - 1Case - 2Case - 3
Nuavg = 0.00547 (Rej)0.653(S/d)0.415(H/d)2.090
[2]
[10]
Nuavg = 0.000437 (Rej)0.745(S/d)0.354(H/d)4.575
[17]
Figure 7.15 Averaged Nusselt number comparisons with the existing correlations

192
CHAPTER 8
ORIFICE PLATE - 4
Jet impingement heat transfer is dependent on several flow and geometrical
parameters. The jet impingement Nusselt number is presented as a functional form of,
( )[ ]norientatiooutflowdH
dS
dXf
kdh
Nu jair
ii ,,,,Re=⎟⎟
⎠
⎞⎜⎜⎝
⎛= (8.1)
Where, jRe is the flow parameter, distance along the target surface dX / , feeding channel
aspect ratio dH / , and jet-to-plate distance dS / are the geometric parameters. The flow exit
direction and the jet-to-plate distance are also important parameters having a significant
effect on impingement heat transfer. The jet inlet condition is the direction in which the flow
enters the inlet channel.
Figure 2.3 shows three outflow orientations where air comes into the feeding channel
and leaves through jets made in the orifice jet plate to impinge on the heated target surface
located in the impingement channel. For all the three cases air enters the feeding channel
at 3.114/ =dX . For case 1, air exits the impingement channel at low dX / )0/( =dX and
therefore the crossflow develops towards the exit. For case 2, the flow exits the impingement
channel at 15.57/ =dX and as the flow moves forward from low dX / crossflow develops
at low dX / and increases towards large dX / )3.114/( =dX .

193
For case 3, the flow exits the impingement channel at both the directions i.e., at
3.1140/ anddX = and the crossflow develops towards both the ends of the test section.
Tests were carried out for three different outflow orientations with Reynolds number
ranging between ( )10000Re5000 ≤≤ j by varying the jet-to-plate distance ratio )/( dS and
also the feeding channel aspect ratio )/( dH . Three different values of jet-to-plate distances
8/4 ≤≤ dS and the feeding channel aspect ratio 9/5 ≤≤ dH were considered while
carrying out the experiments.
Flow orientation affects the flow inside the impingement channel and leads into
different heat transfer characteristics. As air impinges on the target surface, crossflow starts
developing and grows continuously towards the exit resulting into thicker boundary layer,
which suppresses the jet impingement effect. In addition, crossflow causes distortion to the
jet impingement in which the jet is no longer impinging normally on the target surface.
All the results presented in this paper are for 3.114/0 ≤≤ dX over the entire span of
the target plates. Where X is defined from the opposite end of the feeding channel of the test
section as shown in figure 2.2. All the results presented below are being extracted using the
orifice plate with tangential jets of diameter 0.5cm.
The local Nusselt number distribution for all the three outflow orientations by varying
the jet-to-plate distance is presented in detail, as a function of non-dimensional location
dX / on the target surface for jet Reynolds number jRe , jet-to-plate distance dS / , and the
feeding channel aspect ratio dH / in the forthcoming discussion.

194
8.1 Effect of feeding channel aspect ratio on local Nusselt number
Figure 8.1 – 8.3, gives a detail insight into the local Nusselt number distribution
presenting the effect of feeding channel aspect ratio 9/5 ≤≤ dH on the heat transfer from
the target surface. All the results are presented for jet-to-plate distance 6/ =dS as this jet-
to-plate distance gives maximum heat transfer. All the outflow orientations are discussed.
Figure 8.1 shows effect of feeding channel aspect ratio on the local Nusselt number
distribution over the entire length of the target surface for case – 1, where the flow exits at
low dX / )0/( =dX . The crossflow develops from large dX / to low dX / as the air exits
at low dX / . The heat transferred from the target surface decreases with an decrease in
feeding channel aspect ratio from dH / = 9 to 5 for all the feeding channel aspect ratios.
Over the entire length of the target surface, the feeding channel aspect ratio 7/ =dH gives
the maximum heat transfer for all the jet Reynolds numbers 18800Re9300 ≤≤ j studied.
This is primarily due to the increase in the strength of the jets with an increase in the feeding
channel ratios. Observing the effect of the feeding channel aspect ratio on the local Nusselt
number distribution for all the jet Reynolds numbers studied, 7/ =dH gives the maximum
heat transfer among all the feeding channel aspect ratios studied. 7/ =dH gives a margnial
increase in the local Nusselt number compared to 5/ =dH , whereas 7/ =dH gives a
maximum of 4% increase in local Nusselt number is observed compared to 9/ =dH for all
the jet Reynolds numbers studied. With an increase in the feeding channel aspect ratio the
difference in the magnitude of the local Nusselt number also increases for an increase in the
jet Reynolds number. Among all the Reynolds numbers studied, 18800Re =j gives the
maximum heat transfer. As discussed earlier in figure 8.1, a peak of local Nusselt number at

195
4.80/ =dX is observed this is due to the flow entering the impingement channel at large
dX / , where the effect of crossflow is minimal. At 2.72/2.31 ≤≤ dX crossflow dominates
the impingement of jets and a linearly decreasing distribution of local Nusselt number is
observed towards the exit.
Figure 8.2 shows the effect of the feeding channel aspect ratio on the local Nusselt
number distribution for case – 2 and for jet-to-plate distance 6/ =dS . For case – 2 the flow
exits at low dX / )0/( =dX , causing crossflow development towards the exit. 7/ =dH
gives the maximum heat transfer over the entire length of the target surface for all the jet
Reynolds numbers studied. For all the jet Reynolds numbers studied, 7/ =dH gives a
maximum of 5% more heat transfer from the target surface compared to 5/ =dH whereas
7/ =dH gives a marginal increase in heat transfer compared to 9/ =dH . It is also
observed that the magnitude of the local Nusselt number increases with an increase in the jet
Reynolds number for all the feeding channel aspect ratios studied. The variation in the local
Nusselt number is more sensitive with respect to a change in feeding channel aspect ratio at
high jet Reynolds number whereas it is less sensitive at low jet Reynolds numbers. At
3.114/4.80 ≤≤ dX the magnitude of local Nusselt number decreases from 4.80/ =dX to
3.114/ =dX , this is due to the obstruction caused by the crossflow to the impinging jets.
Figure 8.3 shows the effect of feeding channel aspect ratio on the local Nusselt
number distribution for case – 3 and for jet-to-plate distance 6/ =dS . For case – 3 air exits
at 0/ =dX and 3.114/ =dX , where the crossflow has a predominant effect over the heat
transfer characteristics. It is observed that at 30/0 ≤≤ dX and 3.114/4.80 ≤≤ dX the
local Nusselt number decreases towards exit, this may be due to the crossflow at the exit and

196
thus reduces the strength of the impinging jets and the heat transferred from the target
surface. The magnitude of local Nusselt number at 2.72/2.31 ≤≤ dX is high compared to
the other dX / locations this may be due to the strong impingement of jets. For an increase
in feeding channel aspect ratio a corresponding increase in local Nusselt number is observed.
7/ =dH gives the maximum values of feeding channel aspect ratio for all the jet Reynolds
numbers studied. Considering the effect of feeding channel aspect ratio for all jet Reynolds
numbers on heat transfer characteristics in detail, 7/ =dH gives the highest heat transfer
similar to case – 1 and case – 2. 7/ =dH gives a marginal increase in heat transfer
compared to 9/ =dH , further 7/ =dH gives a maximum of 3% more heat transfer is
observed compared to 5/ =dH . Similar to case – 1 and case – 2, with respect to the effect
of feeding channel aspect ratio on local Nusselt number characteristics it is observed that the
local Nusselt number is sensitive to a change in feeding channel aspect ratio at high jet
Reynolds numbers.

197
10
20
30
40
50
60
Nu
H/d = 5 H/d = 7 H/d = 9
10
20
30
40
50
60
Nu
0 30 60 90 120
X/d
10
20
30
40
50
60
Nu
Rej = 9300
Rej = 14400
Rej = 18800
Figure 8.1 Effect of feeding channel aspect ratio 9/5 ≤≤ dH on local Nusselt number
distribution for case – 1 and jet-to-plate distance 4/ =dS .

198
10
20
30
40
50
60
Nu
H/d = 5 H/d = 7 H/d = 9
10
20
30
40
50
60
Nu
0 30 60 90 120
X/d
10
20
30
40
50
60
Nu
Rej = 9300
Rej = 14400
Rej = 18800
Figure 8.2 Effect of feeding channel aspect ratio 9/5 ≤≤ dH on local Nusselt number
distribution for case – 2 and jet-to-plate distance 4/ =dS .

199
10
20
30
40
50
60
Nu
H/d = 5 H/d = 7 H/d = 9
10
20
30
40
50
60
Nu
0 30 60 90 120
X/d
10
20
30
40
50
60
Nu
Rej = 9300
Rej = 14400
Rej = 18800
Figure 8.3 Effect of feeding channel aspect ratio 9/5 ≤≤ dH on local Nusselt number
distribution for case – 3 and jet-to-plate distance 4/ =dS .

200
8.2 Effect of jet Reynolds number on local Nusselt number
Figure 8.4 - 8.6 shows the local Nusselt number distribution for different jet Reynolds
numbers 18800Re9300 ≤≤ j , for jet-to-plate distance 6/ =dS , expressing the effect of the
feeding channel aspect ratio on the heat transfer from the heated target surface. Among all
the jet-to-plate distances studied 6/ =dS is selected, as it is the best case in which
maximum heat is transferred from the target surface.
Figure 8.4 shows the local Nusselt number distribution plotted for case – 1, which
gives a detailed insight into the effect of the feeding channel aspect ratio. Three different
values of the feeding channel aspect ratios are considered in this part of the study
9/5 ≤≤ dH . The results are presented for three jet Reynolds numbers 18800Re9300 ≤≤ j .
It is observed that for an increase in the jet Reynolds number there is a corresponding
increase in the magnitude of local Nusselt number. For case – 1, the flow exits the
impingement channel at low dX / )0/( =dX . A peak of local Nusselt number is observed
at 4.80/ =dX , this may be due to the strong impingement of jets as the air enters the
impingement channel at large dX / where the effect of crossflow is minimal resulting into
thinner boundary layer. Among all the feeding channel widths examined, 7/ =dH gives the
maximum heat transfer for all the jet-to-plate distances studied. 7/ =dH gives a maximum
of 11.8% increase in the local Nusselt number from the target surface compared to 5/ =dH ,
whereas it gives a maximum of 9.7% more heat transfer compared to 9/ =dH . At
2.72/2.31 ≤≤ dX uniformly decreasing heat transfer is observed along the target surface
for all the feeding channel aspect ratios studied, this is due to the crossflow of the air. A
considerable increase in the Nusselt number is observed at large dX / )3.114/( =dX for

201
10000Re =j , whereas for 9300Re =j and 14400Re =j a uniform behavior of local
Nusselt number is observed this is due to the strong impingement at high velocities which
leads to high heat transfer.
Figure 8.5 shows the local Nusselt number distribution for case – 2 plotted for
different jet Reynolds numbers 18800Re9300 ≤≤ j for a fixed jet-to-plate distance
6/ =dS and by varying the feeding channel aspect ratio 9/5 ≤≤ dH . For case – 2 air exits
the impingement channel at 3.114/ =dX opposite to the entry flow, this leads to the
development of more crossflow towards large dX / )3.114/( =dX . Similar to the case – 1
an increase in jet Reynolds number leads to a corresponding increase in local Nusselt number
for all the dH / values studied. At large dX / )3.114/( =dX , the flow exits at this location
causing greater amount of crossflow obstructing the impingement of jets at this location, thus
less magnitude of local Nusselt number is observed. A uniform distribution of local Nusselt
number is observed along the entire length of the heated target surface except a peak of local
Nusselt number at 4.80/ =dX which may due to the strong impingement of jets at that
location. Although similar behavior of local Nusselt number is observed for 5/ =dH and
7/ =dH , but 7/ =dH gives a marginal increase in local Nusselt number over the entire
target surface compared to 5/ =dH , whereas a maximum of 7.36% more heat transfer is
observed over the entire target surface is observed compared to 9/ =dH . The variation in
the magnitude of local Nusselt number is less for a change in jet Reynolds number for all the
feeding channel aspect ratios studied, this is reflected from the similar behavior of local
Nusselt number. At 3.114/4.80 ≤≤ dX , a decrease in local Nusselt number is observed
from 4.80/ =dX towards the exit at 3.114/ =dX , this may be due to the development of

202
crossflow towards the exit, which obstructs the impingement of jets and thickens the
boundary layer. This behavior of local Nusselt number is observed for all the dH / values
studied.
203
10
20
30
40
50
60
70
Nu
Rej = 9300 Rej = 14400 Rej = 18800
10
20
30
40
50
60
70
Nu
0 30 60 90 120
X/d
10
20
30
40
50
60
70
Nu
H/d = 5
H/d = 7
H/d = 9
Figure 8.4 Effect of jet Reynolds number and feeding channel aspect ratio 9/5 ≤≤ dH on
local Nusselt number distribution for 4/ =dS and case – 1.

204
10
20
30
40
50
60
70
Nu
Rej = 9300 Rej = 14400 Rej = 18800
10
20
30
40
50
60
70
Nu
0 30 60 90 120
X/d
10
20
30
40
50
60
70
Nu
H/d = 5
H/d = 7
H/d = 9
Figure 8.5 Effect of jet Reynolds number and feeding channel aspect ratio 9/5 ≤≤ dH on
local Nusselt number distribution for 4/ =dS and case – 2.

205
Figure 8.3 presents the local Nusselt number distribution for case – 3 where the air
exits from both the directions at low dX / )0/( =dX and large dX / )3.114/( =dX . It is
observed that the crossflow develops at both the exit directions, which reduces the heat
transferred from the target surfaces. Unlike case – 1 and case – 2, where 7/ =dH had the
maximum heat transfer, in case – 3 5/ =dH gives the maximum heat transfer from the
target surface. 5/ =dH gives minimum increase in heat transfer compared to 7/ =dH ,
whereas 5/ =dH gives a maximum of 7.81% more heat transfer compared to 9/ =dH .
The magnitude of local Nusselt number between 2.72/2.31 ≤≤ dX and
3.114/4.80 ≤≤ dX is almost similar for all the feeding channel aspect ratios dH / studied
for case – 3, whereas for case – 1 and case – 2 completely different distribution of local
Nusselt number is observed.

206
10
20
30
40
50
60
70
Nu
Rej = 9300 Rej = 14400 Rej = 18800
10
20
30
40
50
60
70
Nu
0 30 60 90 120
X/d
10
20
30
40
50
60
70
Nu
H/d = 5
H/d = 7
H/d = 9
Figure 8.6 Effect of jet Reynolds number and feeding channel aspect ratio 9/5 ≤≤ dH on
local Nusselt number distribution for 4/ =dS and case – 3.

207
8.3 Effect of outflow orientation on local Nusselt number
Figure 8.7 – 8.9 shows the effect of the outflow orientation on the local Nusselt
number distribution for different feeding channel aspect ratio 9/5 ≤≤ dH . The results are
being presented for jet-to-plate distance 6/ =dS , due to the highest amount of heat transfer
observed with this particular jet-to-plate distance among all the jet-to-plate distances studied.
All the jet Reynolds numbers studied 18800Re9300 ≤≤ j are discussed individually.
Figure 8.7 presents the effect of the outflow orientation on the local Nusselt number
distribution plotted for different feeding channel aspect ratios 9/5 ≤≤ dH for 5000Re =j .
Among all the dH / values studied very low variation of local Nusselt number is observed
with respect to outflow orientation at low dX / )2.32/3.5( ≤≤ dX . It is observed that case
– 3 has maximum heat transfer at 2.72/2.32 ≤≤ dX this is due to the strong impingement
in this region as the flow exits in both the directions. At 3.114/4.80 ≤≤ dX case – 1 has the
highest heat transfer due to the closed end and due to the less crossflow effect resulting in
stronger impingement reducing the boundary layer thickness followed by case – 2 and case –
3 respectively. Case – 2 has the least values of local Nusselt number over the entire length of
the target surface for all the feeding channel aspect ratios studied. This may be due to the air
going out in the opposite direction to the air coming in which in-turn causes heavy crossflow
and thus less values of local Nusselt number. Similar to the cases studied before for the effect
of feeding channel aspect ratio, 7/ =dH has the maximum heat transfer over the entire
length of the target surface.
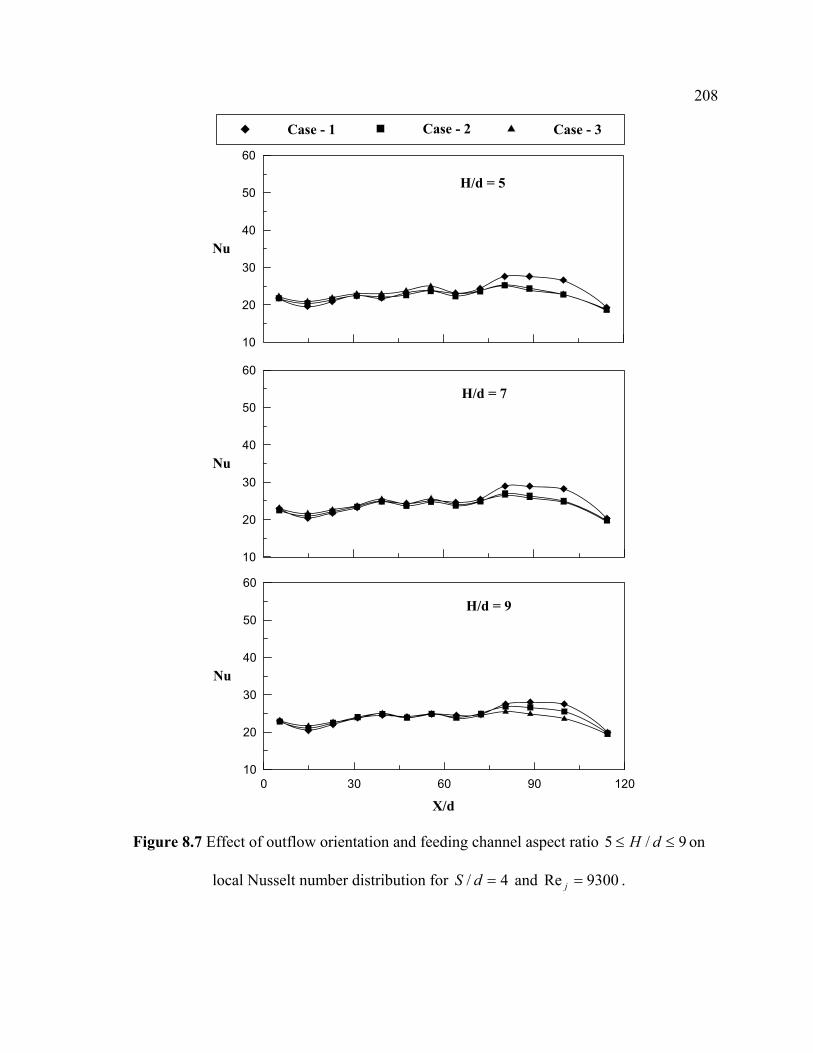
208
10
20
30
40
50
60
Nu
Case - 1 Case - 2 Case - 3
10
20
30
40
50
60
Nu
0 30 60 90 120
X/d
10
20
30
40
50
60
Nu
H/d = 5
H/d = 7
H/d = 9
Figure 8.7 Effect of outflow orientation and feeding channel aspect ratio 9/5 ≤≤ dH on
local Nusselt number distribution for 4/ =dS and 9300Re =j .

209
Figure 8.8 presents the effect of the outflow orientation on the local Nusselt number
distribution plotted for different feeding channel aspect ratios 9/5 ≤≤ dH for
14400Re =j . It is observed that as the jet Reynolds number increases from 9300 to 14400 a
maximum of 37% increase in local Nusselt number is observed. Similar to the local Nusselt
number distribution for 5000Re =j , case – 3 has maximum heat transfer at
2.72/2.32 ≤≤ dX due to the strong impingement of jets, whereas case – 1 and case – 2
gives less values of local Nusselt number due to the increase in the amount of the crossflow.
At 3.114/4.80 ≤≤ dX less variation in local Nusselt number is found as compared to
Nusselt number distribution for 9300Re =j , whereas the behavior of local Nusselt number
for case – 2 and case – 3 is almost similar as in both the cases air exits at large dX /
)3.114/( =dX and for case – 3 air also exits at low dX / )0/( =dX . Similar to
9300Re =j , case – 1 has the highest magnitude of local Nusselt number at
3.114/4.80 ≤≤ dX and case – 2 has the least magnitude of local Nusselt number over the
entire length of the target surface for all the feeding channel aspect ratios studied. It is also
observed that the feeding channel aspect ratio 7/ =dH gives the maximum values of the
local Nusselt numbers compared to the other dH / values.
Figure 8.9 presents the effect of the outflow orientation on the local Nusselt number
distribution plotted for different feeding channel aspect ratios 9/5 ≤≤ dH for
18800Re =j . It is observed that, for 18800Re =j , a variation in the magnitude of local
Nusselt number values is observed over the entire length of the target surface for all the
outflow orientations studied compared to the other two jet Reynolds numbers, 9300Re =j

210
and 14400Re =j studied previously. Moreover as the dH / values increases from 5 to 9 a
corresponding decrease in the magnitude of local Nusselt number is observed. Maximum
heat transfer is observed for 7/ =dH similar to 144009300Re andj = where 7/ =dH
gives the maximum values of local Nusselt number. Similar to the other two jet Reynolds
number studied, at 2.72/2.32 ≤≤ dX , case – 3 has the highest magnitude of the local
Nusselt number compared to case – 1 and case – 2, whereas at 3.114/4.80 ≤≤ dX case – 1
has the highest heat transfer due to the stronger impingement of jets decreasing the boundary
layer as the jets enters the impingement channel at this location thus having minimum
crossflow effect. The variation in magnitude of the local Nusselt number observed at
3.114/4.80 ≤≤ dX for 18800Re =j is very high compared to the variation in the other two
jet Reynolds numbers 9300Re =j and 14400Re =j . The reason may be due to the increase
in the strength of the jets with an increase in the jet velocity which causes the variation in the
local Nusselt number to be less sensitive with respect to the outflow orientation.

211
10
20
30
40
50
60
Nu
Case - 1 Case - 2 Case - 3
10
20
30
40
50
60
Nu
0 30 60 90 120
X/d
10
20
30
40
50
60
Nu
H/d = 5
H/d = 7
H/d = 9
Figure 8.8 Effect of outflow orientation and feeding channel aspect ratio 9/5 ≤≤ dH on
local Nusselt number distribution for 4/ =dS and 14400Re =j .

212
10
20
30
40
50
60
Nu
Case - 1 Case - 2 Case - 3
10
20
30
40
50
60
Nu
0 30 60 90 120
X/d
10
20
30
40
50
60
Nu
H/d = 5
H/d = 7
H/d = 9
Figure 8.9 Effect of outflow orientation and feeding channel aspect ratio 9/5 ≤≤ dH on
local Nusselt number distribution for 4/ =dS and 18800Re =j .

213
8.4 Effect of jet-to-plate distance on local Nusselt number
Figure 8.10 –8.12, gives a detail insight into the effect of the feeding channel aspect
ratio 9/5 ≤≤ dS on the local Nusselt number distribution for different jet-to-plate distances
8/4 ≤≤ dS with 18800Re =j for all the outflow orientations on the heat transfer from the
target surface. Jet Reynolds number 18800Re =j is selected as this gives the maximum heat
transfer among all the jet Reynolds numbers studied.
Figure 8.10 shows the local Nusselt number distribution over the entire length of the
target surface for case – 1, where the flow exits at low dX / )0/( =dX . The crossflow
develops from large dX / )3.114/( =dX to low dX / )0/( =dX therefore a
corresponding decrease in the heat transfer is observed from larger dX / to low dX / . The
above phenomenon is observed for all the dH / values 9/5 ≤≤ dH . The heat transfer from
the target surface decreases with an increase in jet-to-plate distance from dS / = 4 to 8, this
behavior is observed for all the feeding channel aspect ratios studied. Over the entire length
of the target surface, the jet-to-plate distance 4/ =dS gives the maximum heat transfer and
8/ =dS gives the least heat transfer among all the dS / values and for all the feeding
channel aspect ratios studied. Observing the effect of the feeding channel aspect ratio on the
local Nusselt number distribution, 7/ =dH gives the maximum heat transfer for the cases
studied. 7/ =dH gives a maximum of 6% increase in local Nusselt number compared to
5/ =dH , whereas a maximum of 11.8% more heat transfer is observed compared to
9/ =dH . It is also observed that the magnitude of local Nusselt number at
3.114/4.80 ≤≤ dX is more compared to that at 2.72/2.31 ≤≤ dX , this is due to the strong
impingement of the jets and less crossflow effect as the flow first enters the impingement

214
channel at this location. At 2.72/2.31 ≤≤ dX crossflow dominates the impingement of jets
and leads to lesser magnitude of the local Nusselt number.
Figure 8.11 shows the effect of the jet-to-plate distance on the local Nusselt number
distribution for case – 2 comparing different feeding channel aspect ratios 9/5 ≤≤ dS for
18800Re =j . For case – 2 the flow exits at low dX / )0/( =dX , which shows the
development of crossflow towards low dX / . Similar to case – 1, 4/ =dS has the
maximum heat transfer from the entire length of the target surface for all the dH / values
examined 9/5 ≤≤ dH . Among all the feeding channel aspect ratios studied, 7/ =dH
gives the maximum amount of heat transfer from the entire target surface. Although the
Nusselt number distribution for 75/ anddH = is similar 7/ =dH has a marginal increase
in heat transfer from the target surface compared to 5/ =dH whereas a maximum of 9.1%
increase in heat transfer is observed compared to 9/ =dH . It is observed that the local
Nusselt number distribution for 9/ =dH is less sensitive for a change in the jet-to-plate
distance as the magnitude of local Nusselt number is similar with a very less difference in
magnitude. For the feeding channel aspect ratios 5/ =dH and 7/ =dH , the change in jet-
to-plate distance has considerable variation on the local Nusselt number distribution
compared to 9/ =dH . The maximum variation in the magnitude of the local Nusselt
number for 75/ anddH = with respect to the jet-to-plate distance is 5%.

215
20
30
40
50
60
70
Nu
S/d = 4 S/d = 6 S/d = 8
20
30
40
50
60
70
Nu
0 30 60 90 120
X/d
20
30
40
50
60
70
Nu
H/d = 5, Rej = 18800
H/d = 7, Rej = 18800
H/d = 9, Rej = 18800
Figure 8.10 Effect of jet-to-plate distance and feeding channel aspect ratio 9/5 ≤≤ dH on
local Nusselt number distribution for 18800Re =j and case – 1.

216
20
30
40
50
60
70
Nu
S/d = 4 S/d = 6 S/d = 8
20
30
40
50
60
70
Nu
0 30 60 90 120
X/d
20
30
40
50
60
70
Nu
H/d = 5, Rej = 18800
H/d = 7, Rej = 18800
H/d = 9, Rej = 18800
Figure 8.11 Effect of jet-to-plate distance and feeding channel aspect ratio 9/5 ≤≤ dH on
local Nusselt number distribution for 18800Re =j and case – 2.

217
Figure 8.12 shows the effect of the jet-to-plate distance on the local Nusselt number
distribution for case – 3 comparing different feeding channel aspect ratios 9/5 ≤≤ dS for
18800Re =j . For case – 3 air exits at 0/ =dX and 3.114/ =dX , where the crossflow has
a predominant effect over the heat transfer characteristics. It is observed that at
3.114/4.80 ≤≤ dX the local Nusselt number decreases towards exit i.e. at large dX /
)3.114/( =dX for all the dH / values examined 9/5 ≤≤ dH . The heat transfer at
2.72/2.32 ≤≤ dX has less magnitude of local Nusselt number this may be due to the effect
of the crossflow dominating the strength of the impinging jets. For an increase in jet-to-plate
distance a corresponding decrease in local Nusselt number is observed. Investigating the
effect of feeding channel aspect ratio, 7/ =dH gives the highest heat transfer similar to
case – 1 and case – 2. 9/ =dH gives very less values of local Nusselt number compared to
5/ =dH , further a maximum of 11% more heat transfer is observed compared to 7/ =dH .
Among all the jet-to-plate distances investigated 4/ =dS gives the maximum heat transfer
over the entire length of the target surface, this is due to the strong impingement of the jets,
with less travel distance, which thins the boundary layer resulting in high values of local
Nusselt number. Whereas 8/ =dS gives the minimum values of the local Nusselt number
over the entire length of the target surface similar to the other two outflow orientations
discussed earlier.

218
20
30
40
50
60
70
Nu
S/d = 4 S/d = 6 S/d = 8
20
30
40
50
60
70
Nu
0 30 60 90 120
X/d
20
30
40
50
60
70
Nu
H/d = 5, Rej = 18800
H/d = 7, Rej = 18800
H/d = 9, Rej = 18800
Figure 8.12 Effect of jet-to-plate distance and feeding channel aspect ratio 9/5 ≤≤ dH on
local Nusselt number distribution for 18800Re =j and case – 3.

219
8.5 Average Nusselt Number
Figures 8.13 - 8.14 shows the average Nusselt number avgNu as a function of jet
Reynolds number jRe , considering all the outflow orientations, the feeding channel aspect
ratio 9/5 ≤≤ dH and the jet-to-plate distances 8/4 ≤≤ dS . The value of avgNu is an
average of the detailed results on the entire target plate surface. The detailed results from the
present study are averaged over the entire target plate to produce a single averaged Nusselt
number.
8.5.1 Effect of feeding channel aspect ratio
Figure 8.13 shows the feeding channel aspect ratio )9/5( ≤≤ dH for averaged
Nusselt number as a function of the jet Reynolds number for all the outflow orientations
studied. The averaged Nusselt numbers are shown for all the jet-to-plate distances
)8/4( ≤≤ dS and for all the outflow orientations. The averaged Nusselt number increases
linearly with an increase in the jet Reynolds number. Among all the jet-to-plate distances
studied the jet-to-plate distance 4/ =dS has the highest values of the averaged Nusselt
number indicating the optimum jet-to-plate distance. The magnitude of averaged Nusselt
number is almost the same for the remaining two jet-to-plate distances 4 and 8 with a
maximum variation of 6%. It is also observed that as the feeding channel aspect ratio dH /
increases from 5 to 7 there is a corresponding increase in the magnitude of the average
Nusselt number and with an increase of dH / from 7 to 9 there is a corresponding decrease
in the magnitude of averaged Nusselt number, indicating decrease in the strength of the

220
impinging jets with an increase in the feeding channel aspect ratios. For 18800Re =j , the
difference in the magnitude of the average Nusselt number is quite large compared to the
other two jet Reynolds numbers studied. The jet Reynolds number 9300Re =j , is less
sensitive to the jet-to-plate distance as there in no much variation observed from the
magnitude of the averaged Nusselt number. Large variation in the averaged Nusselt number
is observed at less value of the feeding channel aspect ratios 5/ =dH and 7/ =dH with
respect to the jet-to-plate distances, whereas the feeding channel aspect ratio 9/ =dH is less
sensitive to a change in the jet-to-plate distance as very less variation is observed in the
averaged Nusselt number. Case – 1 and case – 3 have the maximum values of averaged
Nusselt number compared to case – 2 as the flow exit in opposite direction compared to the
flow entry, which causes crossflow obstructing the impingement of jets.
8.5.2 Effect of outflow orientation
Figure 8.14 shows the averaged Nusselt number distribution as a function of jet
Reynolds number. The effect of feeding channel aspect ratio )9/5( ≤≤ dH and the effect of
the jet-to-plate distance )8/4( ≤≤ dS are shown in detail. It is observed that as the feeding
channel aspect ratio is decreased from 9 to 7 there is a corresponding increase in the values
of averaged Nusselt numbers, whereas a further decrease in the feeding channel aspect ratio
from 7 to 5 leads to a decrease in the average Nusselt number this may be due to the
disturbance caused to the impinging jet with an increase in the crossflow at low feeding
channel aspect ratios. This indicates that 7/ =dH gives the maximum values of heat

221
transfer among all the feeding channel aspect ratios studied. Moreover it is also observed that
an increase in the jet-to-plate distance )/( dS leads to a corresponding decrease in the
average Nusselt number values. Among all the outflow orientations studied, case – 3, the
case where the flow exits in both the directions 0/ =dX and 3.114/ =dX has the high
amount of heat transferred from the target surface, where as case – 2 has the least amount of
heat transferred from the target surface for all the feeding channel aspect ratios examined,
this may be because of the flow exit in opposite direction as to that of the entry in the
impingement channel. Outflow orientation – 2 has the least amount of heat transferred from
the target surface, this may also be due to the obstruction caused to the flow of jets at large
dX / due to the crossflow of the air at the exit of the impingement channel.
The feeding channel aspect ratio 9/ =dH gives a very less variation in the averaged
Nusselt number with respect to the outflow orientations at all the jet Reynolds numbers,
where as for 75/ anddH = a considerable variation in the magnitude of averaged Nusselt
number is observed for outflow orientation – 3 with respect to the other two outflow
orientations. The jet Reynolds number 9300Re =j , is less sensitive to the outflow
orientation as there in no much variation observed in the magnitude of the average Nusselt
number at this present location.
Among all the feeding channel aspect ratios studied 7/ =dH gives the highest values of
averaged Nusselt number indicating high heat transfer from the target surface for all the jet-
to-plate distances studied, whereas 9/ =dH gives the least amount of heat transfer. The
feeding channel aspect ratio 5/ =dH gives the less values of averaged Nusselt number
compared to 7/ =dH because of the disturbance caused to the boundary layer due to the

222
effect of the crossflow becoming more severe at very less dH / values, a maximum
difference of 4% is observed in the magnitude of the averaged Nusselt number.

223
20
25
30
35
40
45
Nu a
vg
S/d = 4 S/d = 6
20
25
30
35
40
45
20
25
30
35
40
45
S/d = 8
H/d = 5, Case - 1
20
25
30
35
40
45
Nu a
vg
8000 12000 16000 20000
Rej
20
25
30
35
40
45
Nu a
vg
20
25
30
35
40
45
20
25
30
35
40
45
8000 12000 16000 20000
Rej
20
25
30
35
40
45
8000 12000 16000 20000
Rej
20
25
30
35
40
45
H/d = 7, Case - 1 H/d = 9, Case - 1
H/d = 5, Case - 2 H/d = 7, Case - 2 H/d = 9, Case - 2
H/d = 5, Case - 3 H/d = 7, Case - 3 H/d = 9, Case - 3
Figure 8.13 Effect of feeding channel aspect ratio )9/5( ≤≤ dH and jet-to-plate distances
on averaged Nusselt number for different outflow orientation.

224
20
25
30
35
40
45
Nu a
vg
Case - 1 Case - 2
20
25
30
35
40
45
20
25
30
35
40
45
Case - 3
H/d = 5, S/d = 4
20
25
30
35
40
45
Nu a
vg
8000 12000 16000 20000
Rej
20
25
30
35
40
45
Nu a
vg
20
25
30
35
40
45
20
25
30
35
40
45
8000 12000 16000 20000
Rej
20
25
30
35
40
45
8000 12000 16000 20000
Rej
20
25
30
35
40
45
H/d = 7, S/d = 4 H/d = 9, S/d = 4
H/d = 5, S/d = 6 H/d = 7, S/d = 6 H/d = 9, S/d = 6
H/d = 9, S/d = 8 H/d = 7, S/d = 8 H/d = 9, S/d = 8
Figure 8.14 Effect of outflow orientation and feeding channel aspect ratio on averaged
Nusselt number for different jet-to-plate distances )8/4( ≤≤ dS .

225
8.4.3 Correlations of averaged Nusselt number
The results for three different outflow orientations are correlated for the jet Reynolds number
jRe and the normalized jet-to-plate distance dS / dependence as
DCBjavg dHdSANu )/()/()(Re= (8.2)
The present results are correlated for all outflow orientations individually for jet Reynolds
number jRe dependence. Previous studies in the field of jet impingement have involved in
developing correlations for the averaged Nusselt number as a function of the jet Reynolds
number by considering many parameters. Correlations by Huang et al [21],Kercher and
Tabakoff [30] and Florscheutz et al [14] are compared to the averaged Nusselt number in the
present investigation. Huang et al [21] studied the outflow orientations similar to ones used
in the present study. They presented results for the outflow orientation 1 and 2 correlating for
Reynolds number dependence as 76.0Re035.0=Nu , whereas for outflow orientation 3 which
has the highest magnitude of heat transferred from the target surface is correlated as
727.0Re082.0=Nu . Kercher and Tabakoff [30] also studied the effect of crossflow and it is
similar to the case – 1 in the present study. They varied the jet hole diameter, the hole
spacing x, y and the jet to target plate distance. Based on all of these geometrical parameters,
they proposed a correlation of the form 3191.0
21 Pr)/(Re dzNu mφφ= , where 1φ and 2φ are
constants based on dX / and dY / , respectively. Florschuetz et al [14] presented the
correlations with different coefficients of inline and staggered rows. The correlation for jet

226
impingement with minimum crossflow is given as
31554.0068.0422.0554.0 PrRe)()()(363.0 −−−= jdZdYdXNu .
The detailed values of the local Nusselt number are averaged over the entire length of the
target surface to obtain an single averaged Nusselt number. The averaged Nusselt numbers
for each outflow orientation are plotted against the jet Reynolds number. The present results
are correlated for the jet Reynolds number dependence as
815.2611.0674.0 )/()/()(Re000869.0 dHdSNu javg = for case 1 and 2. The correlations for
Huang et al [21] for case 1 and 2 are in good comparison with the present study. Kercher and
Tabakoff [30] presented the results for the outflow orientation – 1 and the results of the
present study are in good comparison with the existing correlation. The case with maximum
heat transfer from the target surface, outflow orientation – 3, is correlated for the jet
Reynolds number dependence as 575.4354.0745.0 )/()/()(Re000437.0 dHdSNu javg = . The
correlation used from Florschuetz et al [14] is for the case with minimum crossflow. Huang
et al [21] also presented a separate correlation for the case with high heat transfer; this case in
their study had the less crossflow effect. The results from the present study for case – 3 are
lower than the existing correlations, which includes the crossflow effect. The correlation for
case – 3 in the present study is in good agreement with the correlation presented by
Florschuetz et al [14] and Huang et al [21]. Thus it is evident from the above discussion that
the crossflow effect is more dominant on outflow orientation 1 and 2 compared to outflow
orientation – 3.
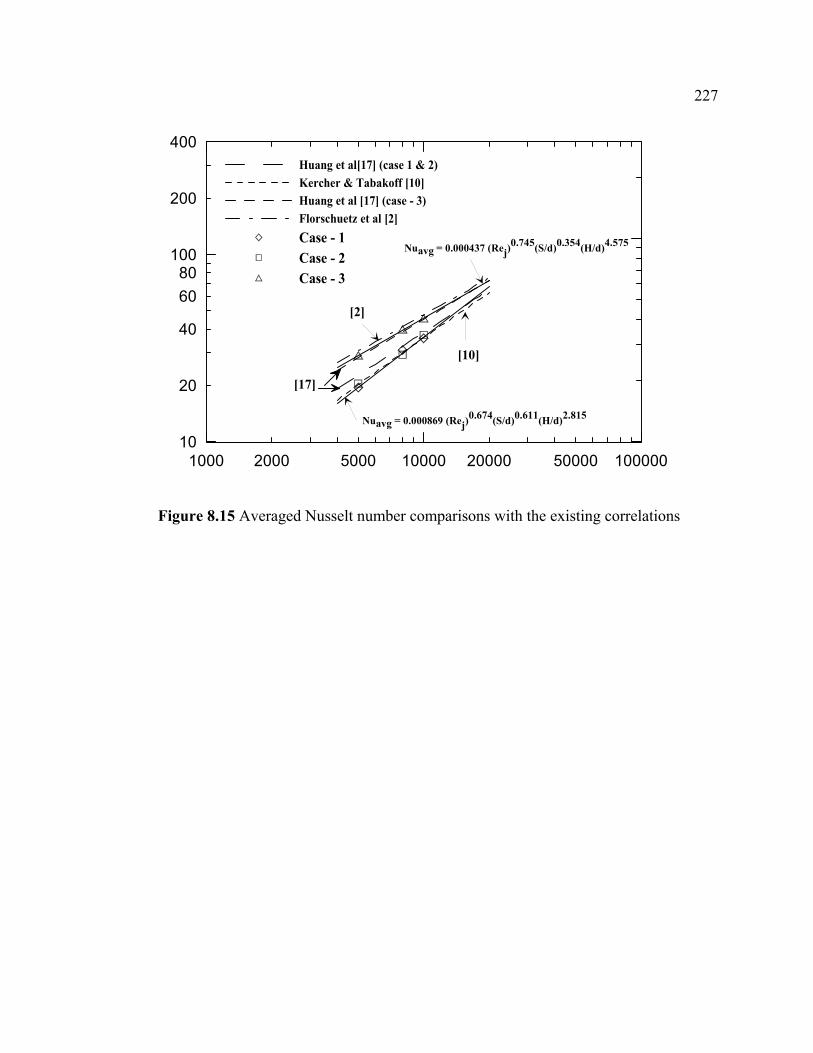
227
1000 10000 1000002000 5000 20000 5000010
100
20
40
6080
200
400Huang et al[17] (case 1 & 2)Kercher & Tabakoff [10]Huang et al [17] (case - 3)Florschuetz et al [2]Case - 1Case - 2Case - 3
Nuavg = 0.000869 (Rej)0.674(S/d)0.611(H/d)2.815
[2]
[10]
Nuavg = 0.000437 (Rej)0.745(S/d)0.354(H/d)4.575
[17]
Figure 8.15 Averaged Nusselt number comparisons with the existing correlations

228
CHAPTER 9
CONCLUSIONS
In this chapter a detailed conclusion about the heat transfer characteristics obtained by
using different orifice plates in the current experimental investigation is presented. The effect
of feeding channel aspect ratio, outflow orientation, jet-to-plate distance and the orifice jet
size and pattern on the heat transfer in a rectangular duct with an array of equally spaced jets
is studied using the jet impingement technique.
8.1 Orifice plate – 1
The effect of outflow orientation and the feeding channel aspect ratio 5.4/5.2 ≤≤ dH
on local Nusselt number using jet impingement technique (single array of tangential jets), for
a jet Reynolds numbers 10000Re5000 ≤≤ j is investigated. The conclusions are as follows.
1. The Nusselt number is significantly affected by the outflow orientation, based upon
the average Nusselt number calculation, under the same jet Reynolds number,
outflow orientation – 3 gives the maximum heat transfer over the entire target surface
among all the outflow orientations studied, whereas outflow orientation – 2 has the
least values of averaged Nusselt number.

229
2. The feeding channel aspect ratio also significantly affects the heat transfer
characteristics all along the target surface. 5.2/ =dH gives the highest heat transfer
among all the feeding channel aspect ratios investigated. This may be due to the
impinging jets dominating the crossflow effect to give the higher magnitude of
Nusselt number.
3. Correlations of average Nusselt numbers in the present rectangular duct with single
array of impinging jets have been developed in terms of the jet Reynolds number for
three different outflow orientations individually.
8.2 Orifice plate 1 & 2
The effect of outflow orientation on local Nusselt number using jet impingement
technique (single array of jets), for a jet Reynolds numbers )10000Re5000( ≤≤ j , the
feeding channel aspect ratio )5.45.2( cmHcm ≤≤ and also by varying the orifice jet
diameter cmandd 15.0= is investigated. The conclusions are as follows.
1. The Nusselt number distribution is significantly affected by the outflow orientation,
based upon the average Nusselt number calculation, under the same jet Reynolds
number for cmd 5.0= , case – 3 gives the maximum heat transfer over the entire
target surface among all the outflow orientations studied, whereas case – 2 has the
least values of average Nusselt number.

230
2. Under the same Reynolds number for cmd 1= , case – 3gives the maximum heat
transfer among all the outflow orientations studied, whereas case – 1has the least
values of average Nusselt number.
3. The feeding channel aspect ratio significantly affects the heat transfer coefficient. It is
also observed that the feeding channel aspect ratio 5.2/ =dH provides the
maximum heat transfer for both the orifice jet sizes.
4. Correlations of averaged Nusselt numbers in the present rectangular duct with single
array of impinging jets have been developed in terms of the jet Reynolds number for
three different outflow orientations individually.
8.3 Orifice plate – 2
The effect of outflow orientation on local Nusselt number using jet impingement
technique (single array of jets), for a jet Reynolds numbers )18800Re9300( ≤≤ j , jet-to-
plate distance ( )8/4 ≤≤ dS , the feeding channel aspect ratio ( )9/5 ≤≤ dH and with orifice
jet diameter cmd 5.0= is investigated. The conclusions are as follows.
1. The Nusselt number is significantly affected by the outflow orientation, based upon
the average Nusselt number calculation, under the same jet Reynolds number for
cmd 5.0= , case – 3 gives the maximum heat transfer over the entire target surface
among all the outflow orientations studied, whereas case – 2 has the least values of
average Nusselt number.

231
2. The jet-to-plate distance dS / also significantly affects the Nusselt number. It is also
observed that the case for jet-to-plate distance 6/ =dS provides the maximum heat
transfer, this is because at less dS / values the crossflow dominates and at high dS /
values the less jet strength results in lesser magnitude of Nusselt number.
3. The feeding channel aspect ratio dH / also significantly affects the Nusselt number.
It is also observed that the case for jet-to-plate distance 9/ =dH provides the
maximum heat transfer. The crossflow dominates the strength of the impinging jets at
low dH / values resulting in lesser magnitude of Nusselt numbers. Increasing the
dH / values results in stronger impinging jets overcoming the crossflow effect and
thus higher magnitudes of Nusselt number.
4. Correlations of average Nusselt numbers in the present rectangular duct with single
array of impinging jets have been developed in terms of the jet Reynolds number for
three different outflow orientations individually.
8.4 Orifice plate – 3
The effect of outflow orientation and the feeding channel aspect ratio 9/5 ≤≤ dH on
local Nusselt number using jet impingement technique (single array of staggered jets), for a
jet Reynolds numbers )18800Re9300( ≤≤ j , jet-to-plate distance 8/4 ≤≤ dS is
investigated. The conclusions are as follows.
5. The Nusselt number is significantly affected by the outflow orientation, based upon
the average Nusselt number calculation, under the same jet Reynolds number for
cmd 5.0= , case – 3 gives the maximum heat transfer over the entire target surface

232
among all the outflow orientations studied, whereas case – 2 has the least values of
average Nusselt number.
6. The jet-to-plate distance dS / also significantly affects the Nusselt number. It is also
observed that the case for jet-to-plate distance 6/ =dS provides the maximum heat
transfer, this is because at less dS / values the crossflow dominates and at high dS /
values the less jet strength results in lesser magnitude of Nusselt number.
7. The feeding channel aspect ratio dH / also significantly affects the heat transfer
coefficient. It is also observed that the case for jet-to-plate distance 5/ =dH
provides the maximum heat transfer. The crossflow dominates the strength of the
impinging jets at low dH / values resulting in lesser magnitude of Nusselt numbers.
Increasing the dH / values results in stronger impinging jets overcoming the
crossflow effect and thus higher magnitudes of Nusselt number.
1. Correlations of average Nusselt numbers in the present rectangular duct with single
array of impinging jets have been developed in terms of the jet Reynolds number for
three different outflow orientations individually.
8.5 Orifice plate – 4
The effect of outflow orientation and the feeding channel aspect ratio 9/5 ≤≤ dH on
local Nusselt number using jet impingement technique (single array of tangential jets), for a
jet Reynolds numbers )18800Re9300( ≤≤ j , jet-to-plate distance 8/4 ≤≤ dS is
investigated. The conclusions are as follows.
2. The Nusselt number is significantly affected by the outflow orientation, based upon
the average Nusselt number calculation, under the same jet Reynolds number,

233
outflow orientation 3 gives the maximum heat transfer over the entire target surface
among all the outflow orientations studied, whereas outflow orientation 2 has the
least values of average Nusselt number.
3. The feeding channel also significantly affects the heat transfer characteristics all
along the target surface. 7/ =dH gives the highest heat transfer among all the
feeding channel aspect ratios investigated.
4. The jet-to-plate distance dS / also significantly affects the heat transfer coefficient. It
is also observed that the case for jet-to-plate distance 4/ =dS provides the
maximum heat transfer for both the orifice jet sizes, whereas 8/ =dS gives the least
heat transfer over the heated target surface.
5. Correlations of average Nusselt numbers in the present rectangular duct with single
array of impinging jets have been developed in terms of the jet Reynolds number for
three different outflow orientations individually.

234
APPENDIX A
SAMPLE CALCUATIONS OF LOCAL NUSSELT NUMBER
All the independent parameters like the temperature of the copper plates, mass flow
rate of air, voltage supplied to the heater, resistance by the heater, inlet temperature of the air
coming into the test section are measured using the Data Acquisition system.
The magnitude of the local Nusselt number is evaluated using the equations 2.4 to
2.17 shown in chapter 2. All the experiments for the local Nusselt number evaluation are
carried out for the constant heat flux condition, thus the voltage supplied to the heater is kept
constant through all the experiments.
Sample calculation
The present set of calculations are presented for orifice plate – 2, Case – 2 with 9300Re =j ,
4/ =dS and 9/ =dH , for orifice plate – 1.
Parameters Values Voltage supplied to heater 77.66 V Resistance of the heater 60.05 Ω Inlet Temperature 21oC Thickness of wood 0.03 m Thermal conductivity of wood 0.087 W/m2K Thermal conductivity of air 0.0257 W/m2K

235
The temperature of the copper plates sT , is the average of the two readings of temperature
taken for each copper plate.
X/d Plate no
Ts (oC)
Area of
plates (m2)
Qtotal (W)
Qcond (W)
Qrad (W)
Qactual (W)
h (W/m2K) Nu
2.65 1 61.26 0.00223 9.38 0.21 0.0014 9.16 102.26 19.90 7.4 2 65.27 0.00168 7.08 0.18 0.0014 6.90 92.73 18.04
11.5 3 61.93 0.00168 7.08 0.16 0.0011 6.91 100.53 19.56 15.6 4 58.60 0.00168 7.08 0.15 0.0009 6.93 109.71 21.34 19.7 5 59.44 0.00168 7.08 0.15 0.0009 6.93 107.23 20.86 23.8 6 56.37 0.00168 7.08 0.14 0.0008 6.94 116.80 22.72 27.9 7 55.04 0.00168 7.08 0.13 0.0007 6.95 121.50 23.64 32 8 54.81 0.00168 7.08 0.13 0.0007 6.95 122.34 23.80
36.1 9 54.16 0.00168 7.08 0.13 0.0006 6.95 124.80 24.28 40.2 10 52.14 0.00168 7.08 0.12 0.0005 6.96 133.09 25.89 44.3 11 52.68 0.00168 7.08 0.12 0.0006 6.96 130.74 25.43 49.95 12 52.32 0.00168 7.08 0.12 0.0006 6.96 132.31 25.74 57.15 13 60.95 0.00315 13.27 0.30 0.0019 12.97 103.07 20.05

236
BIBLIOGRAPHY
1. Arjocu, S. C. and Liburdy, J. A. (1999). “Near surface characterization of an
impinging elliptic jet array”. Trans. ASME - J. Fluids Eng., 121:384–390.
2. Barata, J. M. M. (1996). “Fountain flows produced by multiple impinging jets in a
crossflow”. AIAA Journal, 34 (12) 2523–2530.
3. Baughn, J. W., Anderson, M. R., Mayhew, J. E., and Wolf, J. D. (1999). “Hysteresis
of thermo chromic liquid crystal temperature measurement based on hue”. Trans.
ASME - J. Heat Transfer, 121 (4) 1067–1072.
4. Baughn, J. W. and Shimizu, S. (1989). “Heat transfer measurements from a surface
with uniform heat flux and an impinging jet”. Trans. ASME - J. Heat Transfer,
111:1096–1098.
5. Chang Haipang, Zhang Dalin, Huan Taipang, “Impingement Heat Transfer From Rib
Roughened surface Within Arrays of Circular Jets. The effect of relative position o
fjet hole to the ribs” ASME Journal of Heat transfer, 97-GT-331 June 2- June 5,
1997.
6. Chupp, R. E., Helms, H. E., McFadden, P. W., and Brown, T. R., 1969, “evaluation
of Internal Heat-transfer coefficients for impingement-cooled turbine airfoils,” J.
Aircraft, 6, pp. 203-208.
7. Coleman, H. W. and Steele, W. G., 1999, “Experimental and Uncertainty Analysis
for Engineers,” Wiley, New York.

237
8. Colucci, D. W. and Viskanta, R. (1996). “Effect of nozzle geometry on local
convective heat transfer to a confined impinging air jet”. Exp. Thermal Fluid Sci.,
(13) pp. 71–80.
9. Cooper, D., Jackson, D. C., Launder, B. E., and Liao, G. X. (1993). “Impinging jet
studies for turbulence model assessment — I Flow-field experiments”. Int. J. Heat
Mass Transfer, 36 (10) pp. 2675–2684.
10. Dittus, F. W., and Boelter, L. M. K., University of California at Berkeley,
Publications in Engineering, Vol. 2, p. 443.
11. Ekkad, S. V. and Han, J. C., 1997, “Detailed Heat transfer distributions in two-pass
square channels with ribs turbulators,” International Journal of Heat & Mass
Transfer, Vol. 40, pp.2525-2537.
12. Ekkad, S. V., Huang, Y., and Han, J.C., “Impingement Heat transfer on a Target Plate
with Film Cooling Holes,” Journal of Thermophysics and Heat transfer,Vol. 13, No.
4, Oct 1999, pp.522-528.
13. Florschuetz, L. W., Truman, C. R., and Metzger, D. E., “Stream-wise flow and heat
transfer distributions for jet impingement with cross flow.” Journal of Heat transfer,
Vol 103, No. 2, 1981, pp. 337-342.
14. Florschuetz, L. W., Metzger, D. E., Su, C. C., Isoda, Y., and Tseng, H. H., “Heat
transfer Characteristics for Jet Array Impingement with Initial Cross flow,” Journal
of Heat Transfer, Vol. 106, No. 1, 1984, pp.34-41.

238
15. Gardon, R. and Cobonpue, J. (1962). “Heat transfer between a flat plate and jets of air
impinging on it. In International Developments in Heat Transfer”, pages 454–460,
New York. ASME.
16. Goldstein R. J. and A. I. Behbahani, 1982 “Impingement of a circular jet with and
without cross flow,” International Journal of Heat and Mass transfer, Vol. 25, No. 9,
pp. 1377-1382.
17. Han, J. C., Chanra, P. R., and Lau. S. C., 1988, “Local Heat/Mass Transfer
Distributions around sharp 180o turns in Two-pass smooth and Rib-roughened
channels,” ASME Journal of Heat transfer, Vol. 110, pp 91-98.
18. Han, J. C., and Zhang, P., 1991, “Effect of Rib-Angle Direction on Local Mass
Transfer Distribution in a Three-Pass Rib-Roughened Channel,” ASME Journal of
Turbomachinery, 113, pp. 123-130.
19. Han, J. C., and Zhang, Y. M. and Lee, C. P., 1991, “Augmented Heat transfer in
Square channel with parallel, crossed, and V-shaped Angled ribs,” ASME Journal of
Heat transfer, 113, pp. 590-596.
20. Hollworth B. R., L. Dagan, “Arrays of Impinging Jets with spent fluid removal
through vent holes on the Target surface.” Journal of Engineering for power. Vol
102, Oct 1980, pp. 994-999.
21. Huang, Y., Ekkad, S. V., and Han, J. C., 1998, “Detailed Heat transfer Distributions
Under an Array of Orthogonal impinging Jets,” AIAA. J. Thermo physics. Heat
Transfer, 12, pp. 73-79.

239
22. Huber, A.M., and Viskanta, R., “Effect of Jet-Jet Spacing on convective Heat transfer
to confined, Impinging Arrays of Axisymmetric Air jets,” International Journal of
Heat and Mass transfer, Vol. 37, No. 10, 1994a, pp.2859-2869.
23. Huber, A. M., and Viskanta, R., “Comparison of convective Heat transfer to
perimeter and center jet in a confined, Impinging Array of Axisymmetric Air Jets,”
International Journal of Heat and Mass Transfer, Vol. 37, No.10, 1994b, pp.3025-
3030.
24. Huber, A. M. and Viskanta, R. (1994c). “Impingement heat transfer with a single
rosette Nozzle”. Exp. Thermal Fluid Sci., (9) pp. 320–329.
25. Hwang, J. J., and Chang, B. Y., 2000, “Effect of Outflow Orientation on Heat transfer
and Pressure drop in an Triangular Duct with an Array of Tangential Jets,” J. of Heat
Transfer ASME, Vol. 122, pp. 669-678.
26. Hwang, J. J., Shih, N. C., Cheng, C. S., Shih, K. T., and Tsai, Y. P., “Jet Spacing
Effect on Impinged Heat transfer ina Triangular duct with a Tangential Jet-Array”,
International Journal of Transport Phenomena, Vol. 5, 2003, pp.65-74.
27. Ichimiya, K. (1994). “Heat transfer and flow characteristics of a single circular
impinging jet considered on heat conduction in a heated section”. In Int. Symp. Turb.,
Heat Mass Transfer, volume 1, pages 2.2.1–2.2.6, Lisbon.
28. Incropera, F. P., and De-Witt, P. D., “Fundamentals of Heat transfer”, John Wiley &
Sons, New York, 1981.

240
29. Kataoka, K. (1990). “Impingement heat transfer augmentation due to large scale
eddies”. In Heat Transfer 1990, volume 1 of Proc. 9th Int. Heat Transfer Conf., pages
255–273.
30. Kercher, D. M., and Tabakoff, W., “Heat transfer by a square array of round ai rjets
impinging perpendicular to a flat surface including the effect of spent air,” Journal of
Engineering for power, Vol. 92, No. 1,1970, pp. 73-82.
31. Kline, S. J., and McClintock, F, A., “Describing Uncertainities in Single-Sample
experiments,” Mech Engg. (ASME), Vol 75, pp. 3-8.
32. Lee, J. and Lee, S.-J. (2000). “The effect of nozzle configuration on stagnation region
heat transfer enhancement of axisymmetric jet impingement”. Int. J. Heat Mass
Transfer, 43:3497–3509.
33. Livingood, J. N. B. and Hrycak, P. (1973). “Impingement heat transfer from turbulent
air stream jets to flat plates – a literature survey”. NASA TM X-2778, NASA.
34. Matsumoto, R., Ishihara, I., Yabe, T., Ikeda, K., Kikkawa, S., and Senda, M. (1999).
“Impingement heat transfer within arrays of circular jets including the effect of
crossflow” (AJTE99-6386). In Proc. 5th ASME/JSME Joint Thermal Eng. Conf.,
pages 1–8.
35. Metzger, D. E., and Bunker, R. S., “Local Heat transfer in internally cooled Turbine
Airfoil Leading Edge Regions: Part I – Impingement cooling without film coolant
Extraction,” Journal of Turbo machinery, Vol.112, No. 3, 1990, pp. 451-458.

241
36. Metzger, D. E., Florschuetz, L. W., Takeuchi, D. I., Behee, R. D., and Berry, R. A.
(1979). “Heat transfer characteristics for inline and staggered arrays of circular jets
with crossflow of spent air”. Trans. ASME - J. Heat Transfer, 101:526–531.
37. Obot, N. T. and Trabold, T. A. (1987). “Impingement heat transfer within arrays of
circular jets: Part 1 – effects of minimum, intermediate, and complete crossflow for
small and large spacings”. Trans. ASME - J. Heat Transfer, 109:872–879.
38. Popiel, C. O. and Boguslawski, L. (1986). “Mass or heat transfer in impinging single,
round jets emitted by a bell-shaped nozzle and sharp-ended orifice. In Heat Transfer”
1986, volume 3 of Proc. 8th Int. Heat Transfer Conf., pages 1187–1192.
39. Pramanick, A., Ekkad, S. V., and Yang, H., “Flow predictions in a two-pass channel
with heat transfer enhancement by impingement and swirl”, ISHMT-ASME, Heat
and Mass transfer Conference, Calcutta, India, 2001.
40. Taslim M. E. and T. Li, “Measurements of Heat transfer coefficients in Rib
roughened trailing edge cavities with crossover jets.” AMSE 98-GT-435.1998.
41. Todd S. Griffith, Luai Al-Hadrami, and Je-Chin Han, 2002, “Heat Transfer in rotating
rectangular cooling channels (AR=4) with angled ribs,” Journal of Heat Transfer,
Vol. 124, pp. 617-625.
42. Trabold, T. and A Obot, N., “Impingement Heat Transfer Within Arrays of Circular
Jets. Part I: Effects of Minimum, Intermediate, and complete cross flow for small and
large spacings,” Journal of Heat transfer, Vol. 109, No. 4, 1987, pp.872-879.
43. Viskanta, R. (1993). “Heat transfer to impinging isothermal gas and flame jets”. Exp.
Thermal Fluid Sci., 6:111–134.

242
44. Yule, A. J. (1978). “Large-scale structure in the mixing layer of a round jet”. J. Fluid
Mech., 89 (3) pp. 413–432.
45. Taylor B.N. and Kuyatt C. E., “Guidelines for Evaluating and Expressing the
Uncertainty of NIST Measurement Results”, National Institute of Standards and
Technology Technical Note 1297, 1994
46. Fred Thomas, W., “An Experimental study of the effects of rotation on convective
heat transfer in smooth and pin fin ducts of narrow cross-section”, PhD dissertation,
Rensselaer Polytechnic Institute, New York, 1999.
47. Figliola R. S., and Beasely, D. E., “Theory and Design of Mechanical
measurements”, 2000, 3rd Edition, Wiley Publishing house.

243
VITAE
• Born in Hyderbad, India on October 12, 1981.
• Pursued B. Tech in Mechanical Engineering in 2002 from Jawaharlal Nehru
Technological University, Hyderabad, India.
• Pursued M.S. in Mechanical Engineering (Thermofluids and Heat Transfer) in 2005
from King Fahd University of Petroleum and Minerals, Dhahran, Saudi Arabia.
• Email: [email protected]
PUBLICATIONS
• Effect of Outflow orientation on heat transfer in a rectangular channel with a
single array of impinging jets, Luai M. Al-Hadhrami, and Khaleel Ahmed. M.,
Proceedings of 6th World Conference on Experimental Heat transfer, Fluid Mechanics
and Thermodynamics, 5 – b – 16, Japan.
• Effect of orifice jet size and outflow orientation on heat transfer in a rectangular
channel with a single array of impingement jets, Khaleel Ahmed. M., and Luai M.
Al-Hadhrami. International symposium of Transport Phenomenon - 16, Prague, Czech
Republic.