EFFECT OF LIMESTONE AND INORGANIC PROCESSING ADDITION …docs.trb.org/prp/14-4801.pdf · 1 EFFECT...
17
Ibrahim, Issa, Al-Obaidi, Huang, Dahhan, and Lopez EFFECT OF LIMESTONE AND INORGANIC PROCESSING ADDITION ON THE 1 PERFORMANCE OF CONCRETE FOR PAVEMENT AND BRIDGE DECKS 2 Mustapha A. Ibrahim 3 Research Assistant 4 Phone: 313-231-5069 5 [email protected] 6 7 Mohsen A. Issa (Corresponding Author) 8 Professor 9 2095 Engineering Research Facility 10 842 West Taylor Street, Chicago, IL 60607, 11 Phone:(312) 996-3432 12 Mobile: (312) 375-8186 13 Fax:(312) 996-2426 14 [email protected] 15 16 Mustafa Al-Obaidi 17 Former UIC Research Assistant 18 Staff Structural Engineer 19 HBM Engineering Group, LLC 20 Phone: 312-863-1755 21 [email protected] 22 23 John Huang 24 IDOT, District 1 25 Area Construction Supervisor 26 Phone: 847-846-7261 27 [email protected] 28 29 Abdul Dahhan 30 IDOT, District 1 31 Bureau Chief of Materials 32 Phone: 847-705-4361 33 [email protected] 34 35 Carmen Lopez 36 IDOT, District 1 37 [email protected] 38 39 Civil and Materials Department 40 University of Illinois at Chicago 41 842 W. Taylor St 42 Chicago, Illinois 60607 43 44 A Paper Submitted for Presentation at the 2014 Annual Meeting of the Transportation 45 Research Board 46 47 Total words = 5,487 + 250*8 (5 Tables and 3 Figures) = 7,487 48 49 50 51 52 1 TRB 2014 Annual Meeting Paper revised from original submittal.
Transcript of EFFECT OF LIMESTONE AND INORGANIC PROCESSING ADDITION …docs.trb.org/prp/14-4801.pdf · 1 EFFECT...

Ibrahim, Issa, Al-Obaidi, Huang, Dahhan, and Lopez
EFFECT OF LIMESTONE AND INORGANIC PROCESSING ADDITION ON THE 1 PERFORMANCE OF CONCRETE FOR PAVEMENT AND BRIDGE DECKS 2
Mustapha A. Ibrahim 3 Research Assistant 4 Phone: 313-231-5069 5 [email protected] 6 7 Mohsen A. Issa (Corresponding Author) 8 Professor 9 2095 Engineering Research Facility 10 842 West Taylor Street, Chicago, IL 60607, 11 Phone:(312) 996-3432 12 Mobile: (312) 375-8186 13 Fax:(312) 996-2426 14 [email protected] 15 16 Mustafa Al-Obaidi 17 Former UIC Research Assistant 18 Staff Structural Engineer 19 HBM Engineering Group, LLC 20 Phone: 312-863-1755 21 [email protected] 22 23 John Huang 24 IDOT, District 1 25 Area Construction Supervisor 26 Phone: 847-846-7261 27 [email protected] 28 29 Abdul Dahhan 30 IDOT, District 1 31 Bureau Chief of Materials 32 Phone: 847-705-4361 33 [email protected] 34 35 Carmen Lopez 36 IDOT, District 1 37 [email protected] 38 39 Civil and Materials Department 40 University of Illinois at Chicago 41 842 W. Taylor St 42 Chicago, Illinois 60607 43 44
A Paper Submitted for Presentation at the 2014 Annual Meeting of the Transportation 45 Research Board 46
47 Total words = 5,487 + 250*8 (5 Tables and 3 Figures) = 7,487 48
49 50 51 52
1
TRB 2014 Annual Meeting Paper revised from original submittal.
Ibrahim, Issa, Al-Obaidi, Huang, Dahhan, and Lopez
ABSTRACT 53 The Illinois Department of Transportation (IDOT) is making several changes to concrete mix 54 designs, using revisions to cement specification ASTM C150/AASHTO M 85 and ASTM 55 C465/AASHTO M 327. These proposed revisions will enable use of more sustainable materials 56 for concrete pavements, overlays, and bridge decks. Accordingly, a study was conducted by the 57 University of Illinois at Chicago (UIC) to test the performance of concrete batched with cement 58 comprising less (conventional) and more (modified) than 5% by weight of limestone and 59 inorganic processing additions (IPA) specified in ASTM C465/AASHTO M 327, and/or 60 insoluble residue (IR) content above the specified limit by ASTM C150. 61
Twenty-four concrete mixes with different cementitious combinations and aggregates 62 were developed for this study. Each cement source was batched in a concrete mixture by 63 replacing 30% of the total cement content with fly ash or slag. Also, each cementitious 64 combination was batched with fine aggregates (natural or combined sand) and coarse aggregate 65 (crushed limestone). 66
The study included measuring fresh properties such as slump, air content, unit weight, 67 and setting time. The hardened properties included measuring the strength and durability for each 68 concrete mix combination. The strength results were measured in terms of compressive and 69 flexural strength, and the durability results were measured in terms of rapid chloride penetration 70 resistance (coulombs) and water permeability (DIN 1048). 71
The study found similar performance in terms of strength and durability of concrete 72 between the conventional and modified cements and demonstrated their performance with fly ash 73 or slag replacements and fine aggregate types. 74 75 KEYWORDS: Air content, chemical admixtures, chloride penetration, compressive strength, 76 durability, flexural strength, fly ash, hardened entrained air, inorganic processing addition, 77 insoluble residue, permeability, limestone, setting time, slag, workability 78 79 80
2
TRB 2014 Annual Meeting Paper revised from original submittal.

Ibrahim, Issa, Al-Obaidi, Huang, Dahhan, and Lopez
INTRODUCTION 81 The addition of limestone and alternative raw materials to cement to reduce CO2 emissions in the 82 cement production and concrete industries has been used in Europe for decades, with quantities 83 up to 35% replacement of cement by weight. The Canadian Standards Association (CSA A3000) 84 recently approved the addition of limestone in cement up to 15% by weight. The success in 85 modifying cement production in both Europe and Canada prompted the United States to move 86 toward a more sustainable approach in the cement production and concrete industries. The 87 current ASTM C150/AASHTO M 85 and ASTM C465/AASHTO M 327 specifications state that 88 maximum limestone and IPA of cement is limited to 5% by weight. 89
IDOT is pushing forward in its efforts to modify the ASTM specifications to approve the 90 use of limestone and IPA with more than 5% replacement of cement by weight. If this 91 modification is approved, it will have both an environmental and economic impact on the 92 concrete industry in the United States. 93
From a sustainability standpoint, cement production is energy intensive and harmful to 94 the environment because of the high temperatures required to burn the raw materials and also 95 because of the emission of gaseous by-products in that process. On average, each ton of cement 96 produced from a cement plant accounts for 0.92 tons of CO2 emissions (1). 97
The emission of CO2 and other gases from cement production is attributed primarily to 98 the calcination process of limestone and fuel combustion. Calcination is necessary in the process 99 of cement production and now it accounts for more than 60% of total CO2 emissions (1). 100
The addition of more than 5% limestone and IPA to cement, as proposed by IDOT, will 101 mitigate some environmental problems by reducing the amount of raw materials burned to 102 produce cement and to reduce the carbon footprint by at least 3% to 4% of total CO2 emissions. 103 The modification will also help reduce the depletion of natural resources and will offer a low-104 cost, efficient method to secure waste materials. 105 106 BACKGROUND 107 Most studies were conducted in Europe and Canada to document the performance of Portland 108 cement when replaced by alternative materials with different quantities and properties. Studies 109 conducted on adding IPA to cement were very limited for this research. Therefore, the literature 110 focused on studies investigated adding limestone to cement by blending or intergrinding. Studies 111 that were conducted in Canada were initiated after the Canadian Cementitious Materials 112 Compendium CAN/CSA A 3000 adopted the use of up to 15% Portland-limestone cement. For 113 Portland cement with limestone, it is noted the following: “the appropriate choice of clinker 114 quality, limestone quality, % limestone content and cement fineness can lead to the production of 115 a limestone cement with the desired properties”(2). Accordingly, the effect of adding limestone 116 to cement in concrete has been attributed through many studies to the quality and quantity of 117 limestone, production method whether it was blended or interground with cement, cement 118 particle size distribution and shape, Blaine fineness, and adding other cementitious and 119 pozzolanic materials. Tsivilis et al. (2) observed that cement with up to 10% limestone with 120 fineness up to a limit value, showed insignificant strength reduction compared to pure cement. 121 Most recently, three major studies were published in Canada on the effect of limestone addition 122 on the strength and durability properties of concrete. These studies were conducted by Thomas et 123 al (3), Thomas et al (4), and Hooton et al. (5). Their results strongly supported the validation to 124 increase the limestone content up to 15% replacement to cement by weight in Canada. 125
3
TRB 2014 Annual Meeting Paper revised from original submittal.

Ibrahim, Issa, Al-Obaidi, Huang, Dahhan, and Lopez
IDOT is making several changes to concrete mix designs, using revisions to cement 126 specification ASTM C150/AASHTO M 85 and ASTM C465/AASHTO M 327 for the new 127 IDOT Standard Specifications book. Current specifications allow addition of limestone and IPA 128 content up to 5% and IR content up to 0.75% of cement weight. The addition of more than 5% 129 limestone and IPA and the increase in IR content above 0.75% require strength and durability 130 testing. Because of the lack of experimental test data, an experimental investigation was 131 conducted at UIC to assess the strength gain, ultimate strength, and durability characteristics of 132 concrete mixes containing Portland cements with more than 5% limestone and IPA, and/or with 133 IR exceeding 0.75% in combination with fly ash or slag. 134 135 MATERIAL SELECTION AND MIX DESIGN 136 The sources of materials procured for the study are: (a) two sources of cement, (b) one source of 137 coarse aggregate, (c) two sources of fine aggregate, and (d) one source of class C fly ash and one 138 source of Grade 100 slag. Each cement source (Cem1 and Cem3) provided cement with 139 limestone and IPA less than and exceeding 5% in accordance with ASTM C465. Ground, 140 granulated blast furnace slag was used as IPA for cement with more than 5% limestone and IPA. 141 The cement properties are shown in Table 1. 142
Cem1 source was prepared by intergrinding limestone and partially intergrinding IPA at 143 CTL laboratory in Skokie, Illinois. Cem3 was produced by intergrinding limestone and 144 homogeneously blending IPA. Because of a shortage of Cem3, the producer delivered a new 145 shipment labeled Cem3R because it has 0.8% limestone more than the original Cem3. The IR 146 content of ASTM C150 and AASHTO M 85 Portland cements is limited per the specifications to 147 a maximum of 0.75% by weight. Cem2 is made by blending Cem1 with fly ash that has 0.49% 148 and 32.41% IR, respectively, to give Cem2 with 0.75% IR and Cem2 with 1.5% IR. 149
As a result, Cem1 and Cem3 were produced to test the performance of concrete mixes 150 with cement exceeding 5% of limestone and IPA, and Cem2 was prepared to test the 151 performance of cement in concrete with higher amount of IR. The designations for cements with 152 less than 5% limestone and IPA, or with 0.75% IR is Cem<5%, and the designation for cements 153 with more than 5% limestone and IPA, or with 1.5% IR is Cem>5%. 154
155 TABLE 1 Amount of Limestone and IPA to Cement and their Blaine Fineness 156
Cement Source
% of Limestone and Inorganic Processing Additions
Insoluble Residue
(%)
Blaine Fineness (m2/Kg)
Compressive Strength, psi 1 Day 3 Day 7 Day 28 Day
Limestone Inorganic Process Total
Cem1<5% 4.2 0 380 0.49 380 2070 3800 5020 6130 Cem1>5% 3.8 4.5 407 0.50 407 2010 3940 4650 6400 Cem2<5% 4.2 0.75
1.5
Cem2>5% 4.2
Cem3<5% 2.6 0 385 0.20 385 2960 4340 5070 Cem 3>5% 2.5 3 383 0.18 383 2920 4160 5020 Cem3R<5% 3.4 0 378 0.21 378 2910 4043 4648 5973 Cem3R>5% 3.1 3 386 0.15 386 3183 4413 5220 6390
Note: 1 Mpa = 145.037 psi
Note: Cem2<5% and Cem2>5% were prepared by blending Cem1<5% and fly ash at UIC laboratory 157 158 Only aggregates demonstrating a history of good performance for durability are used in 159
this study. The coarse aggregate was provided by Hanson MS Thornton quarry with a minimum 160 45% passing ½ in. sieve. The fine aggregate was provided by MS Romeoville and Bluff City 161
4
TRB 2014 Annual Meeting Paper revised from original submittal.

Ibrahim, Issa, Al-Obaidi, Huang, Dahhan, and Lopez
material in South Beloit. The Grade 100 slag and Class C fly ash were provided by Holcim 162 Skyway and Pleasant Prairie, respectively. 163
Twenty-four concrete mixes were conducted at the UIC concrete research laboratory. 164 Each mix was batched with Cem<5% and Cem>5% and with 30% replacement by weight with 165 slag or fly ash. A total of 535 lb/yd3 of cementitous materials were used for the concrete mix 166 proportioning. The concrete mix design contained 375 lb/yd3 cement and 160 lb/yd3 Grade 100 167 slag or 160 lb/yd3 class C fly ash, 0.4 to 0.44 w/cm by weight, freeze/thaw-resistant coarse 168 aggregate, fine aggregate of natural sand or combined sand (50% natural and 50% crushed 169 limestone), and a mortar factor of 0.88. 170
171 EXPERIMENTAL PROGRAM 172 The mixture design proportioning was based on 1 yd3. Several 1–3 ft³ trial batches were made for 173 each mix and were calibrated to yield an air content ranging between 5 and 8% and 174 approximately 3.5 in. slump. The fresh properties for each concrete mix included measuring the 175 slump, unit weight, air content, setting times, concrete mix temperature, and ambient 176 temperature. The hardened properties included the evaluation of strength and durability. Each 177 mix required 18 ft3 of fresh concrete that was divided into three 6 ft3 batches to cast the 178 specimens for the strength and durability study. The first batch was used to cast the specimens 179 for compressive strength, the second to cast the specimens for flexural strength, and the third to 180 cast the required specimens for the durability study. Table 2 lists the tests performed for the 181 fresh, strength, and durability properties of each concrete mix. 182
183 TABLE 2 ASTM/AASHTO Test Methods for Concrete Mixtures 184
Tests Test Method Suggested Values Curing Period Testing Periods
Fresh Properties
Slump ASTM C143
2- 4 in, (3.5 in)
After 0 and 12 minutes from discharge
AASHTO T 119 Yield Unit Weight
ASTM C138
AASTHO T 121
Air Content ASTM C231
6.5±1.5%, (6.5 %)
AASHTO T 121
Setting Time ASTM C403
AASTHO T 197
Strength Properties Compressive Strength
ASTM C39 3500 psi after 14 days
Moisture room until testing
3, 7, 14, 28, and 56 day
AASHTO T 22
Flexural Strength ASTM C78
600 psi after 14 days AASHTO T 97
Durability Properties
Rapid Chloride Ion Permeability
ASTM C1202 28, 152, 332 days
wet curing 28 days dry curing
After 56, 180, 360 days total curing
AASTHO T 277
Water Permeability
DIN 1048 50 mm maximum penetration
Note: DIN 1048 is a German standard test 185 186
Hardened Concrete Strength Properties 187 The compressive and flexural strength tests were conducted according to ASTM C39/AASHTO 188 T 22 and ASTM C78/AASHTO T 97, respectively, at 3, 7, 14, 28, and 56 day. The compressive 189 specimens were capped with plastic covers, and the flexural specimens were covered with wet 190 burlaps and stored indoors under ambient temperature for 24 hours after casting. The specimens 191
5
TRB 2014 Annual Meeting Paper revised from original submittal.

Ibrahim, Issa, Al-Obaidi, Huang, Dahhan, and Lopez
were then demolded and stored in the moisture room under a controlled temperature of 23°C 192 (73°F) and 100% humidity (according to ASTM C511/AASHTO M 201) until the testing dates. 193 194 Hardened Concrete Durability Properties 195 The durability tests included the rapid chloride ion penetration test (RCPT) and water 196 permeability. 197 198 Rapid Chloride Ion Penetration Test (RCPT) 199 Six 4x8 cylinders were cast for each concrete mix. The cylinders were divided into three sets. 200 Each set was cured in the moisture room [23°C (73°F) and 100% humidity] for 28, 152, and 332 201 days, respectively, and was then subject to 28 days of dry curing before testing. Each concrete 202 cylinder was cut using a diamond saw to obtain three 4x2 disks. The RCPT was conducted in 203 accordance with ASTM C1202/AASHTO T 277, which determines the electrical conductivity of 204 concrete as an indicator of its resistance to the penetration of chloride ions. The test was 205 conducted on each concrete mix at 56, 180, and 360 days. 206
207 Water Permeability Test 208 Nine 8x8x5 prisms were cast for each concrete mix. The concrete prisms were divided into 209 three sets. The curing procedure and testing days are same as the RCPT test. The prisms were 210 assembled in test cells, then a 100 kPa (1 bar) water pressure was applied by means of a water 211 tank connected to an air compressor through a valve for the first 48 hours, followed by 300 kPa 212 (3 bar) and 700 kPa (7 bar) pressures for 24 hours each. 213
The prisms were then removed from the cells, surface dried, and split in half 214 perpendicular to the injected surface. The maximum depth of water penetration was measured on 215 the two halves of the split specimen by means of a Vernier Caliper, and the average depth was 216 deduced. The resulting values explained water permeability of concrete in terms of the depth of 217 water penetration. For all practical purposes, it is classified 'watertight' when the penetration 218 depth is less than 50 mm. 219 220 DISCUSSION OF TESTING RESULTS 221 The testing results were reported for the fresh, strength, and durability properties of each 222 concrete mix. The investigation of testing results included studying the effect of the following: 223
Effect of limestone and IPA, and IR on the fresh and hardened properties of concrete 224 Effect of fly ash or slag replacements 225 Effect of fine aggregate sources (natural or combined sand) 226
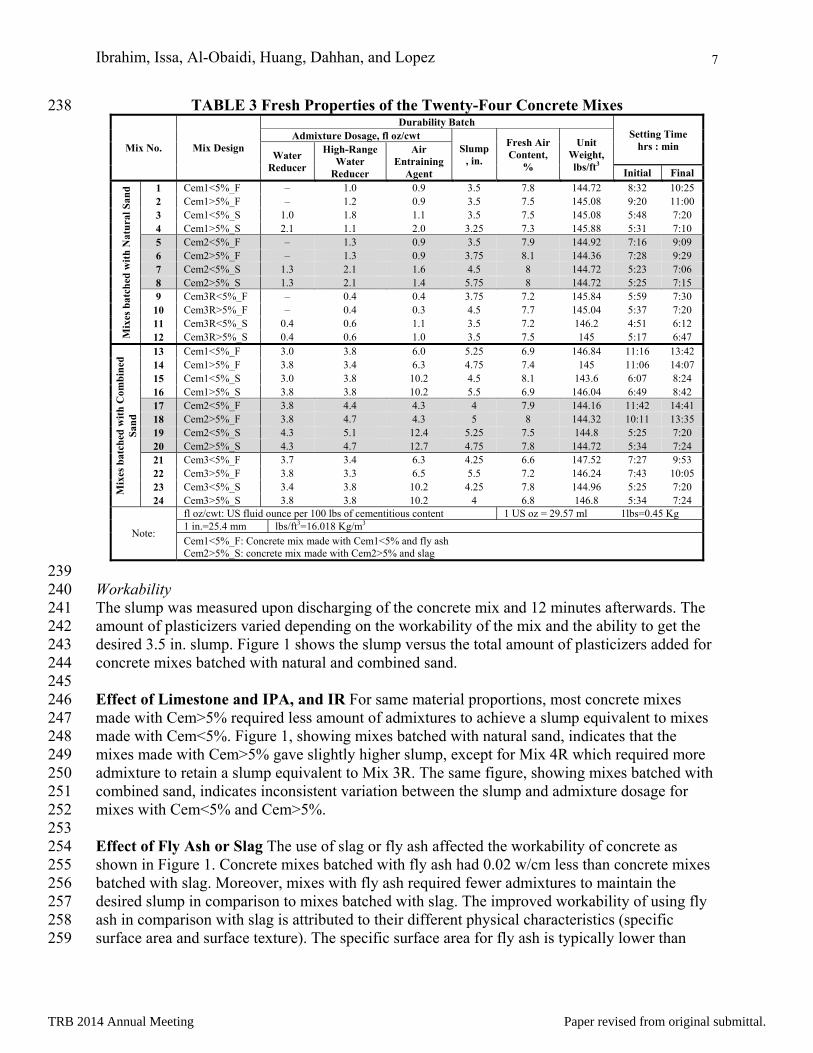
227 Fresh Properties 228 The mix design and fresh properties for the twenty-four concrete mixes (Mix 1–Mix 24) are 229 shown in Table 3. Mix 1–Mix 12 were batched with natural sand and Mix 13–Mix 24 were 230 batched with combined sand. Cem1 was used for Mix 1–Mix 4 and Mix 13–Mix 16. Cem2 was 231 used for Mix 5–Mix 8 and Mix 17‒Mix 20. Cem3R and Cem3 were used for Mix 9–Mix 12 and 232 Mix 21‒Mix 24, respectively. Presented in Table 3 are the slumps, percentage of fresh air 233 content, unit weight, setting times, and admixture dosage for the durability batches of each 234 concrete mix combination. 235
236 237
6
TRB 2014 Annual Meeting Paper revised from original submittal.
Ibrahim, Issa, Al-Obaidi, Huang, Dahhan, and Lopez
TABLE 3 Fresh Properties of the Twenty-Four Concrete Mixes 238
Mix No. Mix Design
Durability Batch Setting Time
hrs : min Admixture Dosage, fl oz/cwt
Slump, in.
Fresh Air Content,
%
Unit Weight, lbs/ft3
Water Reducer
High-Range Water
Reducer
Air Entraining
Agent Initial Final
Mix
es b
atch
ed w
ith
Nat
ura
l San
d 1 Cem1<5%_F – 1.0 0.9 3.5 7.8 144.72 8:32 10:25
2 Cem1>5%_F – 1.2 0.9 3.5 7.5 145.08 9:20 11:00 3 Cem1<5%_S 1.0 1.8 1.1 3.5 7.5 145.08 5:48 7:20 4 Cem1>5%_S 2.1 1.1 2.0 3.25 7.3 145.88 5:31 7:10 5 Cem2<5%_F – 1.3 0.9 3.5 7.9 144.92 7:16 9:09 6 Cem2>5%_F – 1.3 0.9 3.75 8.1 144.36 7:28 9:29 7 Cem2<5%_S 1.3 2.1 1.6 4.5 8 144.72 5:23 7:06 8 Cem2>5%_S 1.3 2.1 1.4 5.75 8 144.72 5:25 7:15 9 Cem3R<5%_F – 0.4 0.4 3.75 7.2 145.84 5:59 7:30 10 Cem3R>5%_F – 0.4 0.3 4.5 7.7 145.04 5:37 7:20 11 Cem3R<5%_S 0.4 0.6 1.1 3.5 7.2 146.2 4:51 6:12 12 Cem3R>5%_S 0.4 0.6 1.0 3.5 7.5 145 5:17 6:47
Mix
es b
atch
ed w
ith
Com
bin
ed
San
d
13 Cem1<5%_F 3.0 3.8 6.0 5.25 6.9 146.84 11:16 13:42 14 Cem1>5%_F 3.8 3.4 6.3 4.75 7.4 145 11:06 14:07 15 Cem1<5%_S 3.0 3.8 10.2 4.5 8.1 143.6 6:07 8:24 16 Cem1>5%_S 3.8 3.8 10.2 5.5 6.9 146.04 6:49 8:42 17 Cem2<5%_F 3.8 4.4 4.3 4 7.9 144.16 11:42 14:41 18 Cem2>5%_F 3.8 4.7 4.3 5 8 144.32 10:11 13:35 19 Cem2<5%_S 4.3 5.1 12.4 5.25 7.5 144.8 5:25 7:20 20 Cem2>5%_S 4.3 4.7 12.7 4.75 7.8 144.72 5:34 7:24 21 Cem3<5%_F 3.7 3.4 6.3 4.25 6.6 147.52 7:27 9:53 22 Cem3>5%_F 3.8 3.3 6.5 5.5 7.2 146.24 7:43 10:05 23 Cem3<5%_S 3.4 3.8 10.2 4.25 7.8 144.96 5:25 7:20 24 Cem3>5%_S 3.8 3.8 10.2 4 6.8 146.8 5:34 7:24
Note:
fl oz/cwt: US fluid ounce per 100 lbs of cementitious content 1 US oz = 29.57 ml 1lbs=0.45 Kg 1 in.=25.4 mm lbs/ft3=16.018 Kg/m3 Cem1<5%_F: Concrete mix made with Cem1<5% and fly ash Cem2>5%_S: concrete mix made with Cem2>5% and slag
239 Workability 240 The slump was measured upon discharging of the concrete mix and 12 minutes afterwards. The 241 amount of plasticizers varied depending on the workability of the mix and the ability to get the 242 desired 3.5 in. slump. Figure 1 shows the slump versus the total amount of plasticizers added for 243 concrete mixes batched with natural and combined sand. 244
245 Effect of Limestone and IPA, and IR For same material proportions, most concrete mixes 246 made with Cem>5% required less amount of admixtures to achieve a slump equivalent to mixes 247 made with Cem<5%. Figure 1, showing mixes batched with natural sand, indicates that the 248 mixes made with Cem>5% gave slightly higher slump, except for Mix 4R which required more 249 admixture to retain a slump equivalent to Mix 3R. The same figure, showing mixes batched with 250 combined sand, indicates inconsistent variation between the slump and admixture dosage for 251 mixes with Cem<5% and Cem>5%. 252 253 Effect of Fly Ash or Slag The use of slag or fly ash affected the workability of concrete as 254 shown in Figure 1. Concrete mixes batched with fly ash had 0.02 w/cm less than concrete mixes 255 batched with slag. Moreover, mixes with fly ash required fewer admixtures to maintain the 256 desired slump in comparison to mixes batched with slag. The improved workability of using fly 257 ash in comparison with slag is attributed to their different physical characteristics (specific 258 surface area and surface texture). The specific surface area for fly ash is typically lower than 259
7
TRB 2014 Annual Meeting Paper revised from original submittal.

260 261 262 263 264 265 266 267 268
269 270 271 272 273
Ibrahim,
slag, andrough, an
Effect ofreducer afrom 0.42hand, mixw/cm rat
Issa, Al-Ob
d the surface ngular-shape
f Fine Aggreand air entrai2 to 0.44 forxes made wiio was, there
Figur
aidi, Huang,
texture for fed grains (6)
egate Sourcining agent tr all mixes mith fly ash anefore, reduce
re 1. Total a
, Dahhan, an
fly ash is sph.
ce Combinedto maintain w
made with sland natural saed from 0.42
admixture d
nd Lopez
herical in sha
d sand requirworkability. ag and batchand experien2 to 0.40.
dosage vs. sl
ape in comp
red a high do Consequent
hed with comnced higher s
lump for con
parison with
osage of hightly, the w/cm
mbined sand.slump than d
ncrete mixe
slag, which
h-range watem ratio incre. On the othedesired and t
es.
has
er eased er the
8
TRB 2014 Annual Meeting Paper revised from original submittal.

Ibrahim, Issa, Al-Obaidi, Huang, Dahhan, and Lopez
Initial and Final Setting Times of Concrete 274 The setting time were measured in accordance to ASTM C403 (Time of Setting of Concrete 275 Mixtures by Penetration). Initial and final setting results indicated ±5% difference for most 276 concrete mixes having the same mix proportioning and cement source with Cem<5% or 277 Cem>5%. However, Cem2 mixes with combined sand and fly ash showed a decrease in the 278 initial set by 13% and final set by 8% for Mix 18 (Cem2>5%) with respect to Mix 17 279 (Cem2<5%). 280 281 Effect of Limestone and IPA, and IR The setting time results for the 24 mixes indicated that 282 the initial and final set times were slightly higher for concrete mixes with Cem>5% than concrete 283 mixes with Cem<5%, knowing that both mixes had the same mix proportions. Table 4 shows the 284 average setting time of different mix combinations and the difference in the setting time between 285 mixes with Cem<5% and Cem>5%. Table 4 also compares using fly ash vs. slag and natural 286 sand vs. combined sand. Most concrete mixes made with Cem>5% experienced slight increase in 287 initial and final setting times. This increase is attributed to a slowdown in the hydration process 288 between cement and water because of the addition of more limestone and IPA, and/or IR. These 289 materials are considered inert and had negligible effect on the chemical reaction of cement paste. 290 291 Effect of Fly Ash or Slag The addition of fly ash or slag to concrete mixes showed a significant 292 difference in setting times. Fly ash prolonged initial and final set times in comparison with slag. 293 As shown in Table 4, the average time needed to reach the initial and final set times for concrete 294 mixes batched with fly ash and natural sand was, respectively, 37% and 31% longer than the set 295 times for concrete mixes batched with slag and natural sand. In addition, the average time needed 296 to reach the initial and final set times for concrete mixes batched with fly ash and combined sand 297 was, respectively, 70% and 63% longer than the set times for mixes batched with slag and 298 combined sand. 299 300 Effect of Fine Aggregate Source Natural sand resulted in quicker set time in concrete in 301 comparison with combined sand. The initial and final set times for mixes made with Cem1 were 302 significantly longer in the mixes batched with combined sand (Mix 13–Mix 16) than mixes 303 batched with natural sand (Mix 1–Mix 4). In addition, the performance of mixes made with 304 Cem2 and Cem3 was similar to Cem1 mixes. As shown in Table 4, the average time needed to 305 reach the initial and final set for concrete mixes batched with fly ash and combined sand was, 306 respectively, 34% and 39% higher than the set times for concrete mixes batched with fly ash and 307 natural sand. Moreover, the average time needed to reach the initial and final set times for 308 concrete mixes batched with slag and combined sand was, respectively, 8% and 11% higher than 309 the set times for concrete mixes batched with slag and natural sand. 310 311 312 313 314 315 316 317 318 319
9
TRB 2014 Annual Meeting Paper revised from original submittal.

Ibrahim, Issa, Al-Obaidi, Huang, Dahhan, and Lopez
TABLE 4 Avg Setting Times for Different Mix Combinations and their Difference in % 320
Mix Combination Average Set
Times, hrs:min
Difference in the Average Set Time, %
Cem>5% vs. Cem<5%
Fly Ash vs. Slag
CS vs. NS
F.A. Cement SCM Initial Final Initial Final Initial Final Initial Final
Nat
ura
l S
and
(N
S)
Cem<5% Fly Ash
7:15 9:01 2.9 2.8
37.1 31.2
with Fly Ash Cem>5% 7:28 9:16
34.4 38.6 Cem<5% Slag
5:20 6:52 1.1 2.7
Cem>5% 5:24 7:04
Com
bin
ed S
and
(C
S)
Cem<5% Fly Ash
10:08 12:45 -4.7 -1.3
70.2 63.3
with Slag (9:21) (11:47)
8.2 11.3 Cem>5%
9:40 12:35 (0.5) (2.6)
(9:24) (12:06) Cem<5%
Slag 5:39 7:41
5.9 1.9 Cem>5% 5:59 7:50
Note: For average of Set Time results for Mixes with combined sand and Fly Ash excluding Mix 17 and Mix 18 Note: SCM: supplementary cementitious material (fly ash or slag)
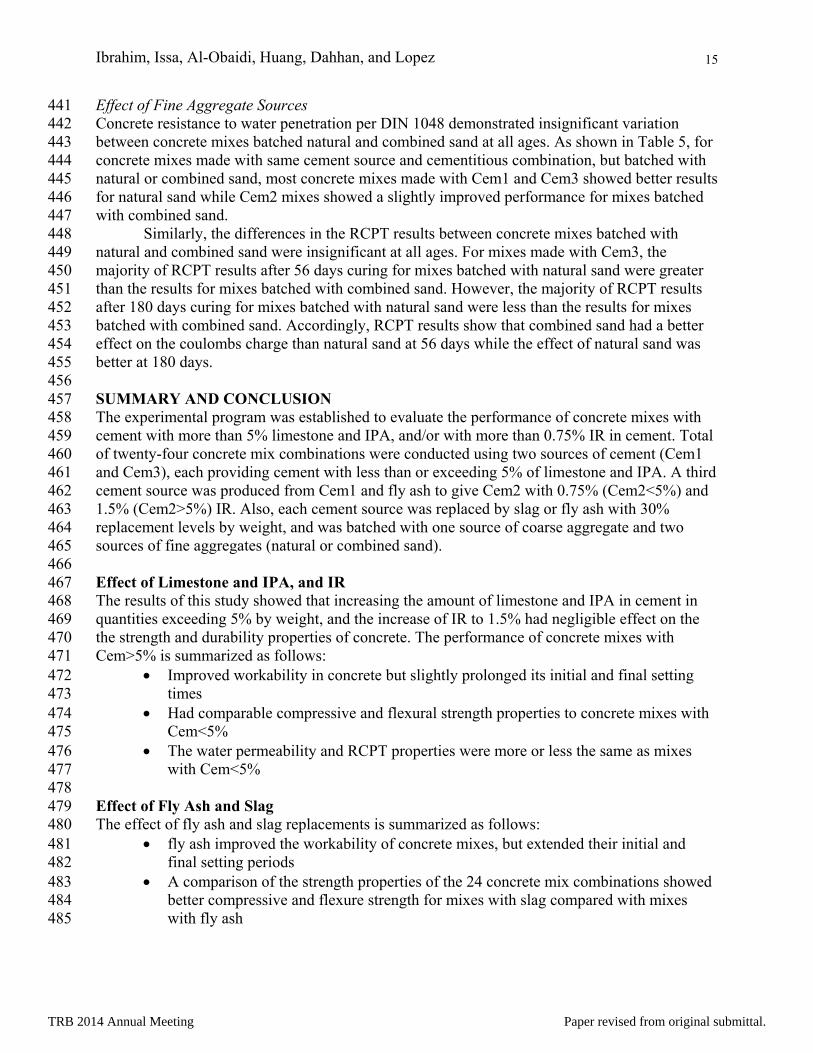
321 Hardened Strength Properties 322 Figure 2 and Figure 3 show plots for the compressive and flexural strength results for concrete 323 mixes batched with natural and combined sand. 324
The results are the average of three concrete cylinders for compression and two beams for 325 flexural strength. The compressive strength properties for the cement sources per ASTM C109 326 are presented in Table 1. The table shows that the strength results are slightly higher for 327 Cem>5% in comparison to Cem<5%, except for Cem3 which shows similar strength. 328
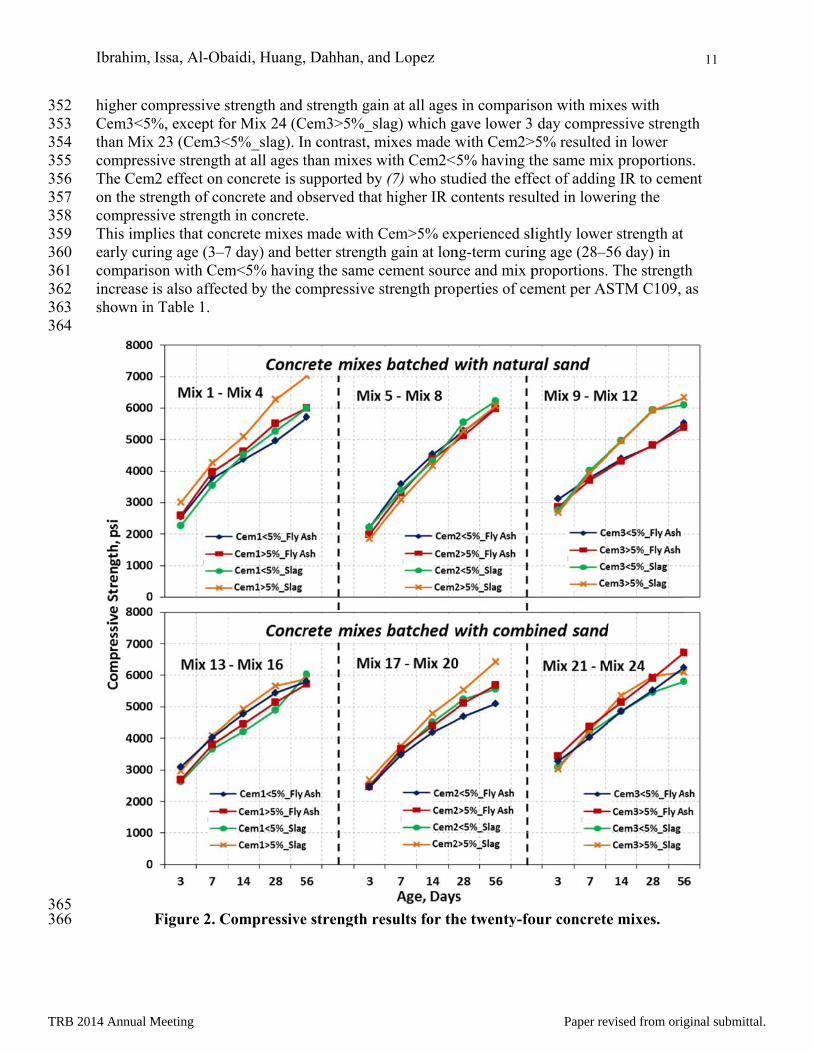
329 Compressive strength 330 Effect of Limestone and IPA, and IR For the same cement source and mix proportioning, the 331 compressive strength results for concrete mixes batched with natural sand showed that most 332 mixes with Cem>5% experienced slightly lower compressive strength at early curing age in 333 comparison with mixes with Cem<5%. However, most mixes with Cem>5% demonstrated better 334 strength gain over a 56 day curing period compared with Cem<5% mixes. 335 Figure 2, showing mixes batched with natural sand (Mix 1–Mix 12), indicates that the 3 day 336 compressive strength for mixes made with Cem2 and Cem3>5% was less than the compressive 337 strength of mixes made with Cem2 and Cem3<5%, respectively. However, the 56 day 338 compressive strength test results varied for each concrete mix. Mixes made with Cem1 (Mix 1–339 Mix 4) was the only to yield better strength and strength gain at all ages for mixes made with 340 Cem1>5% in comparison with mixes made with Cem1<5% and having same mix proportion. In 341 contrast, the compressive strength for mixes made with Cem2>5% was less at all ages than the 342 strength for mixes made with Cem2<5% and having same mix proportion. However, the mixes 343 made with Cem2>5% demonstrated a slight strength gain compared with mixes made with 344 Cem2<5% at all ages. 345 As shown in Figure 2, the compressive strength of concrete mixes batched with combined sand 346 (Mix 13–Mix 24) showed similar trends in terms of strength gain to concrete mixes batched with 347 natural sand. For mixes made with Cem1, Mix 13 (Cem1<5%_fly ash) demonstrated better 3 day 348 compressive strength and equivalent 56 day strength compared with Mix 14 (Cem1>5%_fly 349 ash). Mix 15 (Cem1<5%_slag) demonstrated lower compressive strength than Mix 16 350 (Cem1>5%_slag) at all ages except at 56 day. Similarly, mixes with Cem3>5% resulted in 351
10
TRB 2014 Annual Meeting Paper revised from original submittal.
352 353 354 355 356 357 358 359 360 361 362 363 364
365 366
Ibrahim,
higher coCem3<5%than MixcompressThe Cemon the strcompressThis impearly curcomparisincrease shown in
Issa, Al-Ob
ompressive s%, except fo
x 23 (Cem3<sive strength
m2 effect on crength of consive strength
plies that conring age (3–7son with Cemis also affec
n Table 1.
Figure 2. C
aidi, Huang,
strength and or Mix 24 (C<5%_slag). Inh at all ages tconcrete is sncrete and oh in concretencrete mixes 7 day) and bem<5% havinted by the co
Compressive
, Dahhan, an
strength gaiCem3>5%_sln contrast, mthan mixes wsupported bybserved that
e. made with Cetter strength
ng the same compressive s
e strength re
nd Lopez
in at all ageslag) which g
mixes made wwith Cem2<5y (7) who stut higher IR c
Cem>5% exh gain at loncement sourstrength prop
esults for th
s in comparisgave lower 3with Cem2>5% having t
udied the effcontents resu
xperienced slng-term curinrce and mix pperties of ce
he twenty-fo
son with mix day compre
>5% resultedthe same mixfect of addingulted in lowe
lightly lowerng age (28–5proportions. ement per AS
our concrete
xes with essive strengd in lower x proportiong IR to ceme
ering the
r strength at 56 day) in The strengtSTM C109,
e mixes.
gth
ns. ent
th as
11
TRB 2014 Annual Meeting Paper revised from original submittal.
Ibrahim, Issa, Al-Obaidi, Huang, Dahhan, and Lopez
Effect of Fly Ash or Slag When slag was compared with fly ash for the same cement source and 367 fine aggregate source, it was observed that the majority of concrete mixes batched with slag had 368 better strength and strength gain than mixes batched with fly ash. Figure 2 show that, for the 369 same cement source and fine aggregate type, concrete mixes made with slag gave better 56 day 370 compressive strength than the mixes made with fly ash, except for mixes made with Cem3 and 371 batched with combined sand (Mix 21–Mix 24); those mixes showed lower strength at all ages 372 and lower strength development compared with the mixes made with fly ash. This strength drop 373 was also affected by the higher w/cm ratio used in mixes made with slag and combined sand 374 (0.44) compared with the w/cm ratio used in the mixes made with fly ash and combined sand 375 (0.42). 376
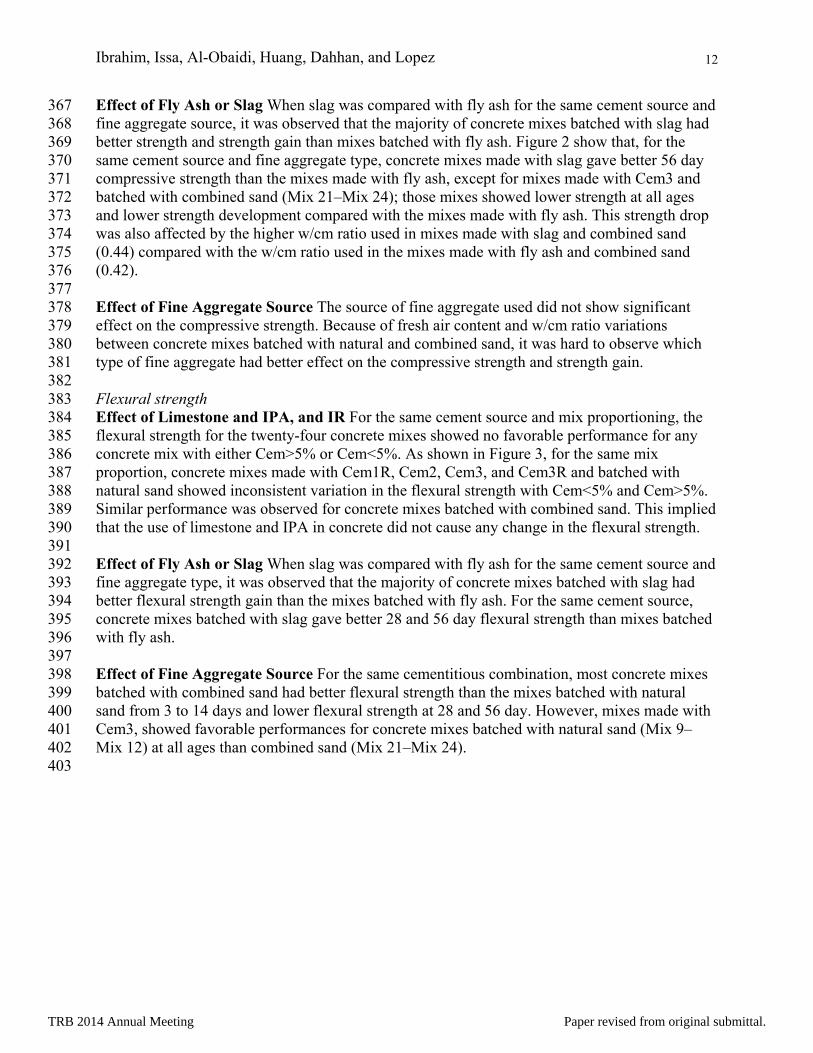
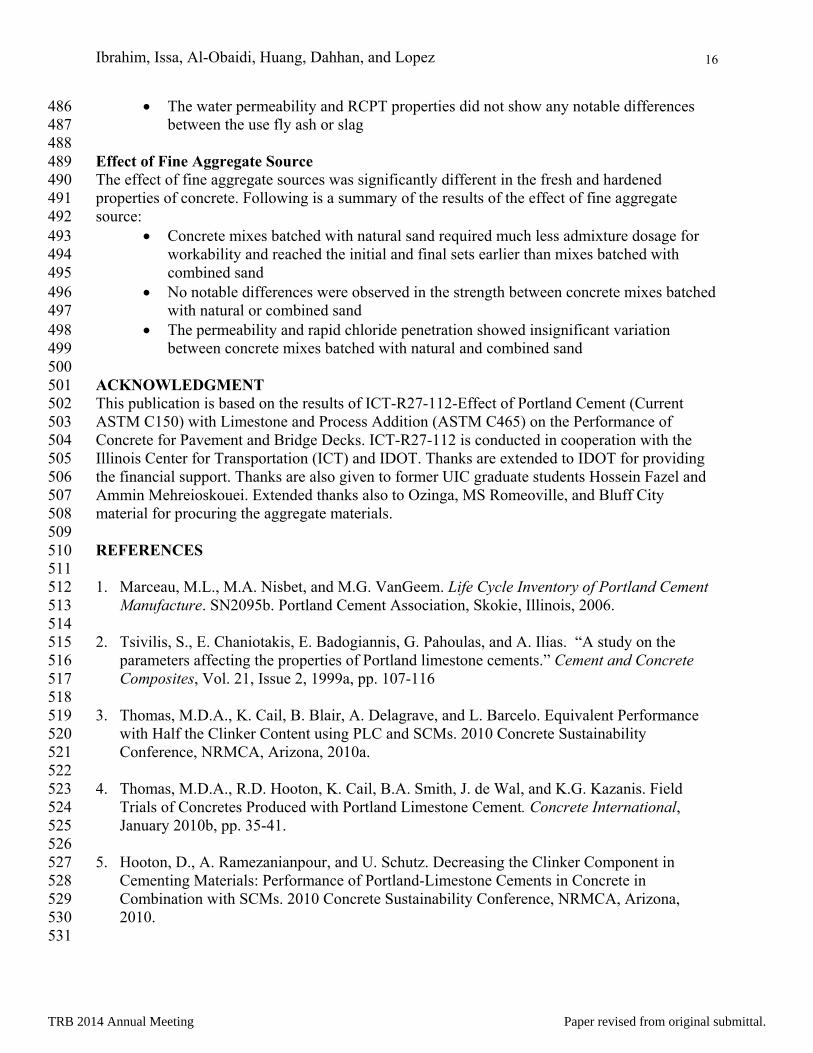
377 Effect of Fine Aggregate Source The source of fine aggregate used did not show significant 378 effect on the compressive strength. Because of fresh air content and w/cm ratio variations 379 between concrete mixes batched with natural and combined sand, it was hard to observe which 380 type of fine aggregate had better effect on the compressive strength and strength gain. 381 382 Flexural strength 383 Effect of Limestone and IPA, and IR For the same cement source and mix proportioning, the 384 flexural strength for the twenty-four concrete mixes showed no favorable performance for any 385 concrete mix with either Cem>5% or Cem<5%. As shown in Figure 3, for the same mix 386 proportion, concrete mixes made with Cem1R, Cem2, Cem3, and Cem3R and batched with 387 natural sand showed inconsistent variation in the flexural strength with Cem<5% and Cem>5%. 388 Similar performance was observed for concrete mixes batched with combined sand. This implied 389 that the use of limestone and IPA in concrete did not cause any change in the flexural strength. 390 391 Effect of Fly Ash or Slag When slag was compared with fly ash for the same cement source and 392 fine aggregate type, it was observed that the majority of concrete mixes batched with slag had 393 better flexural strength gain than the mixes batched with fly ash. For the same cement source, 394 concrete mixes batched with slag gave better 28 and 56 day flexural strength than mixes batched 395 with fly ash. 396 397 Effect of Fine Aggregate Source For the same cementitious combination, most concrete mixes 398 batched with combined sand had better flexural strength than the mixes batched with natural 399 sand from 3 to 14 days and lower flexural strength at 28 and 56 day. However, mixes made with 400 Cem3, showed favorable performances for concrete mixes batched with natural sand (Mix 9– 401 Mix 12) at all ages than combined sand (Mix 21–Mix 24). 402 403
12
TRB 2014 Annual Meeting Paper revised from original submittal.

404 405
406 407 408 409 410 411 412 413 414 415 416 417
Ibrahim,
DurabiliTable 5 r360 days Effect of The wateMix 12) example,Mix 1 (Clower at lower thafor Mix 9
Issa, Al-Ob
Figure 3.
ity Propertireports the ws. Areas that
f Limestone aer permeabilindicate insi, for Cem1 m
Cem1<5%_fl180 days; wan that in Mi9 (Cem3<5%
aidi, Huang,
. Flexural st
es of Hardewater permea
are left blan
and IPA, andity (DIN 104ignificant vamixes and naly ash) were
whereas, the dix 4 (Cem1>
%_fly ash) w
, Dahhan, an
trength resu
ened Concreability (DIN nk are yet to
d IR 48) results fo
ariation betwatural sand (Mhigher than
depth of perm>5%_slag) atwas higher at
nd Lopez
ults for the t
ete 1048), RCPbe tested.
or concrete mween mixes w
Mix 1–Mix 4those of Mi
meability in t 56 days. Fo56 days and
twenty-four
PT (ASTM C
mixes batchewith the same4), the measix 2 (Cem1>Mix 3 (Cem
or Cem3 mixd lower at 36
r concrete m
C1202) result
ed with natue cement sou
sured permea>5% _fly ashm1<5%_slagxes, the perm60 days than
mixes.
ts at 56, 180
ural sand (Miurce. For ability depthh) at 56 days g) prisms wameability depn Mix 10
0, and
ix 1–
hs of but s pth
13
TRB 2014 Annual Meeting Paper revised from original submittal.
Ibrahim, Issa, Al-Obaidi, Huang, Dahhan, and Lopez
(Cem3>5%_fly ash). This inconsistency is also apparent in the permeability results for concrete 418 mixes batched with combined sand (Mix 13–Mix 24) at 56 and 180 days for a 419
The RCPT results shown in Table 5, which slightly contradict with DIN 1048 results, 420 indicate that most concrete mixes made with Cem>5% had slightly higher rapid chloride 421 coulomb charge compared with concrete mixes made with Cem<5%. First, for concrete mixes 422 batched with natural sand (Mix 1–Mix 12), the RCPT results for mixes made with Cem>5% 423 were greater or equivalent to those made with Cem<5% at 56 and 180 days. For mixes batched 424 with combined sand, all concrete mixes made with Cem>5% had slightly higher charge than 425 those made with Cem<5% at 180 days but varied at 56 days. 426
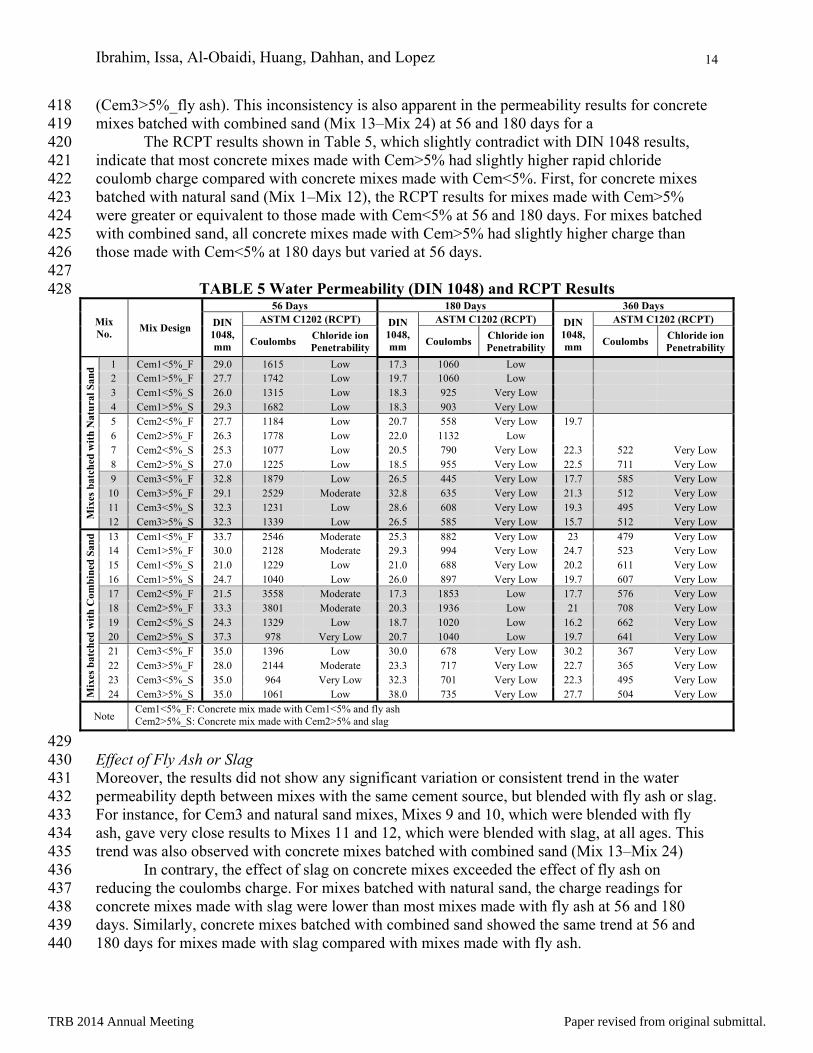
427 TABLE 5 Water Permeability (DIN 1048) and RCPT Results 428
Mix No.
Mix Design
56 Days 180 Days 360 Days
DIN 1048,mm
ASTM C1202 (RCPT) DIN 1048, mm
ASTM C1202 (RCPT) DIN 1048, mm
ASTM C1202 (RCPT)
Coulombs Chloride ion Penetrability
Coulombs Chloride ion Penetrability
Coulombs Chloride ion Penetrability
Mix
es b
atch
ed w
ith
Nat
ura
l San
d 1 Cem1<5%_F 29.0 1615 Low 17.3 1060 Low
2 Cem1>5%_F 27.7 1742 Low 19.7 1060 Low 3 Cem1<5%_S 26.0 1315 Low 18.3 925 Very Low 4 Cem1>5%_S 29.3 1682 Low 18.3 903 Very Low 5 Cem2<5%_F 27.7 1184 Low 20.7 558 Very Low 19.7 6 Cem2>5%_F 26.3 1778 Low 22.0 1132 Low 7 Cem2<5%_S 25.3 1077 Low 20.5 790 Very Low 22.3 522 Very Low 8 Cem2>5%_S 27.0 1225 Low 18.5 955 Very Low 22.5 711 Very Low 9 Cem3<5%_F 32.8 1879 Low 26.5 445 Very Low 17.7 585 Very Low 10 Cem3>5%_F 29.1 2529 Moderate 32.8 635 Very Low 21.3 512 Very Low 11 Cem3<5%_S 32.3 1231 Low 28.6 608 Very Low 19.3 495 Very Low 12 Cem3>5%_S 32.3 1339 Low 26.5 585 Very Low 15.7 512 Very Low
Mix
es b
atch
ed w
ith
Com
bin
ed S
and
13 Cem1<5%_F 33.7 2546 Moderate 25.3 882 Very Low 23 479 Very Low 14 Cem1>5%_F 30.0 2128 Moderate 29.3 994 Very Low 24.7 523 Very Low 15 Cem1<5%_S 21.0 1229 Low 21.0 688 Very Low 20.2 611 Very Low 16 Cem1>5%_S 24.7 1040 Low 26.0 897 Very Low 19.7 607 Very Low 17 Cem2<5%_F 21.5 3558 Moderate 17.3 1853 Low 17.7 576 Very Low 18 Cem2>5%_F 33.3 3801 Moderate 20.3 1936 Low 21 708 Very Low 19 Cem2<5%_S 24.3 1329 Low 18.7 1020 Low 16.2 662 Very Low 20 Cem2>5%_S 37.3 978 Very Low 20.7 1040 Low 19.7 641 Very Low 21 Cem3<5%_F 35.0 1396 Low 30.0 678 Very Low 30.2 367 Very Low 22 Cem3>5%_F 28.0 2144 Moderate 23.3 717 Very Low 22.7 365 Very Low 23 Cem3<5%_S 35.0 964 Very Low 32.3 701 Very Low 22.3 495 Very Low 24 Cem3>5%_S 35.0 1061 Low 38.0 735 Very Low 27.7 504 Very Low
Note Cem1<5%_F: Concrete mix made with Cem1<5% and fly ash Cem2>5%_S: Concrete mix made with Cem2>5% and slag
429 Effect of Fly Ash or Slag 430 Moreover, the results did not show any significant variation or consistent trend in the water 431 permeability depth between mixes with the same cement source, but blended with fly ash or slag. 432 For instance, for Cem3 and natural sand mixes, Mixes 9 and 10, which were blended with fly 433 ash, gave very close results to Mixes 11 and 12, which were blended with slag, at all ages. This 434 trend was also observed with concrete mixes batched with combined sand (Mix 13–Mix 24) 435
In contrary, the effect of slag on concrete mixes exceeded the effect of fly ash on 436 reducing the coulombs charge. For mixes batched with natural sand, the charge readings for 437 concrete mixes made with slag were lower than most mixes made with fly ash at 56 and 180 438 days. Similarly, concrete mixes batched with combined sand showed the same trend at 56 and 439 180 days for mixes made with slag compared with mixes made with fly ash. 440
14
TRB 2014 Annual Meeting Paper revised from original submittal.
Ibrahim, Issa, Al-Obaidi, Huang, Dahhan, and Lopez
Effect of Fine Aggregate Sources 441 Concrete resistance to water penetration per DIN 1048 demonstrated insignificant variation 442 between concrete mixes batched natural and combined sand at all ages. As shown in Table 5, for 443 concrete mixes made with same cement source and cementitious combination, but batched with 444 natural or combined sand, most concrete mixes made with Cem1 and Cem3 showed better results 445 for natural sand while Cem2 mixes showed a slightly improved performance for mixes batched 446 with combined sand. 447 Similarly, the differences in the RCPT results between concrete mixes batched with 448 natural and combined sand were insignificant at all ages. For mixes made with Cem3, the 449 majority of RCPT results after 56 days curing for mixes batched with natural sand were greater 450 than the results for mixes batched with combined sand. However, the majority of RCPT results 451 after 180 days curing for mixes batched with natural sand were less than the results for mixes 452 batched with combined sand. Accordingly, RCPT results show that combined sand had a better 453 effect on the coulombs charge than natural sand at 56 days while the effect of natural sand was 454 better at 180 days. 455 456 SUMMARY AND CONCLUSION 457 The experimental program was established to evaluate the performance of concrete mixes with 458 cement with more than 5% limestone and IPA, and/or with more than 0.75% IR in cement. Total 459 of twenty-four concrete mix combinations were conducted using two sources of cement (Cem1 460 and Cem3), each providing cement with less than or exceeding 5% of limestone and IPA. A third 461 cement source was produced from Cem1 and fly ash to give Cem2 with 0.75% (Cem2<5%) and 462 1.5% (Cem2>5%) IR. Also, each cement source was replaced by slag or fly ash with 30% 463 replacement levels by weight, and was batched with one source of coarse aggregate and two 464 sources of fine aggregates (natural or combined sand). 465 466 Effect of Limestone and IPA, and IR 467 The results of this study showed that increasing the amount of limestone and IPA in cement in 468 quantities exceeding 5% by weight, and the increase of IR to 1.5% had negligible effect on the 469 the strength and durability properties of concrete. The performance of concrete mixes with 470 Cem>5% is summarized as follows: 471
Improved workability in concrete but slightly prolonged its initial and final setting 472 times 473
Had comparable compressive and flexural strength properties to concrete mixes with 474 Cem<5% 475
The water permeability and RCPT properties were more or less the same as mixes 476 with Cem<5% 477
478 Effect of Fly Ash and Slag 479 The effect of fly ash and slag replacements is summarized as follows: 480
fly ash improved the workability of concrete mixes, but extended their initial and 481 final setting periods 482
A comparison of the strength properties of the 24 concrete mix combinations showed 483 better compressive and flexure strength for mixes with slag compared with mixes 484 with fly ash 485
15
TRB 2014 Annual Meeting Paper revised from original submittal.
Ibrahim, Issa, Al-Obaidi, Huang, Dahhan, and Lopez
The water permeability and RCPT properties did not show any notable differences 486 between the use fly ash or slag 487 488
Effect of Fine Aggregate Source 489 The effect of fine aggregate sources was significantly different in the fresh and hardened 490 properties of concrete. Following is a summary of the results of the effect of fine aggregate 491 source: 492
Concrete mixes batched with natural sand required much less admixture dosage for 493 workability and reached the initial and final sets earlier than mixes batched with 494 combined sand 495
No notable differences were observed in the strength between concrete mixes batched 496 with natural or combined sand 497
The permeability and rapid chloride penetration showed insignificant variation 498 between concrete mixes batched with natural and combined sand 499
500 ACKNOWLEDGMENT 501 This publication is based on the results of ICT-R27-112-Effect of Portland Cement (Current 502 ASTM C150) with Limestone and Process Addition (ASTM C465) on the Performance of 503 Concrete for Pavement and Bridge Decks. ICT-R27-112 is conducted in cooperation with the 504 Illinois Center for Transportation (ICT) and IDOT. Thanks are extended to IDOT for providing 505 the financial support. Thanks are also given to former UIC graduate students Hossein Fazel and 506 Ammin Mehreioskouei. Extended thanks also to Ozinga, MS Romeoville, and Bluff City 507 material for procuring the aggregate materials. 508
509 REFERENCES 510
511 1. Marceau, M.L., M.A. Nisbet, and M.G. VanGeem. Life Cycle Inventory of Portland Cement 512
Manufacture. SN2095b. Portland Cement Association, Skokie, Illinois, 2006. 513 514
2. Tsivilis, S., E. Chaniotakis, E. Badogiannis, G. Pahoulas, and A. Ilias. “A study on the 515 parameters affecting the properties of Portland limestone cements.” Cement and Concrete 516 Composites, Vol. 21, Issue 2, 1999a, pp. 107-116 517
518 3. Thomas, M.D.A., K. Cail, B. Blair, A. Delagrave, and L. Barcelo. Equivalent Performance 519
with Half the Clinker Content using PLC and SCMs. 2010 Concrete Sustainability 520 Conference, NRMCA, Arizona, 2010a. 521
522 4. Thomas, M.D.A., R.D. Hooton, K. Cail, B.A. Smith, J. de Wal, and K.G. Kazanis. Field 523
Trials of Concretes Produced with Portland Limestone Cement. Concrete International, 524 January 2010b, pp. 35-41. 525
526 5. Hooton, D., A. Ramezanianpour, and U. Schutz. Decreasing the Clinker Component in 527
Cementing Materials: Performance of Portland-Limestone Cements in Concrete in 528 Combination with SCMs. 2010 Concrete Sustainability Conference, NRMCA, Arizona, 529 2010. 530
531
16
TRB 2014 Annual Meeting Paper revised from original submittal.

Ibrahim, Issa, Al-Obaidi, Huang, Dahhan, and Lopez
6. Kosmatka, S.H., and M.L. Wilson. Design and Control of Concrete Mixes. EB001, 15th 532 edition, Portland Cement Association, Illinois, 2011. 533
534 7. Kiattikomol, K., C. Jaturapitakkul, and J. Tangpagasit. Effect of insoluble residue on 535
properties of Portland cement. Cement and Concrete Research, Vol. 30, 2000, pp. 1209-536 1214. 537
538 8. Tsivilis, S., G. Batis, E. Chaniotakis, Gr. Grigoriadis and D. Theodossis. Properties and 539
behavior of limestone cement concrete and mortar.” Cement and Concrete Research, Vol. 30, 540 Issue 10, 2000, pp. 1679-1683. 541
542 9. Ezziane, K., E.H. Kadri, A. Hallal, and R. Duval. Effect of Mineral Additives on the Setting 543
of Blended Cement by the Maturity Method. Materials and Structures, Vol. 43, 2010, pp. 544 393-401. 545
546 10. Hawkins, P, Tennis, P.D. and R.J. Detwiler. The use of limestone in portland cement: A 547
state-of-the-art review. EB227, Portland Cement Association, Skokie, Illinois, 2003. 548 549
11. Tennis, P. D., M.D.A. Thomas, and W.J. Weiss. State-of-the-Art Report on Use of Limestone 550 in Cements at Levels of up to 15%. SN3148, Portland Cement Association, Skokie, Illinois, 551 2011. 552
553 12. Hooton, M.D., M. Nokken, and M.D.A. Thomas. Portland-Limestone Cement: State-of the-554
Art Report and Gap Analysis for CSA A3000. SN3053, Cement Association of Canada, 2007. 555 556
13. Tsivilis, S., E. Chaniotakis, G. Batis, C. Meletiou, V. Kasselouri, G. Kakali, A. Sakellariou, 557 G. Pavlakis, and C. Psimadas. “The effect of clinker and limestone quality on the gas 558 permeability, water absorption and pore structure of limestone cement concrete. Cement and 559 Concrete Composites, Vol. 21, Issue 2, 1999b, pp. 139-146 560
561 14. Issa, M., A.A. Khalil, S. Islam, and P.D. Krauss, Mechanical Properties and Durability of 562
High Performance Concrete for Bridge Decks. Precast/Prestress Concrete Institute Journal, , 563 Vol. 53, No. 4, July-August 2008, pp.108-130. 564
565
17
TRB 2014 Annual Meeting Paper revised from original submittal.