Effect of Intraoperative Goal-directed Balanced ...
17
PERIOPERATIVE MEDICINE 728 MAY 2019 ANESTHESIOLOGY, V 130 • NO 5 ABSTRACT Background: Crystalloid solutions leave the circulation quickly, whereas colloids remain for hours, thus promoting hemodynamic stability. However, colloids are expensive and promote renal toxicity in critical care patients. This study tested the hypothesis that goal-directed colloid administration during elective abdominal surgery decreases 30-day major complications more than goal-directed crystalloid administration. Methods: In this parallel-arm double-blinded multicenter randomized trial, adults having moderate- to high-risk open and laparoscopically assisted abdominal surgery with general anesthesia were randomly assigned to Doppler-guided intraoperative volume replacement with 6% hydroxyethyl starch 130/0.4 (n = 523) or lactated Ringer’s solution (n = 534). The pri- mary outcome was a composite of serious postoperative cardiac, pulmonary, infectious, gastrointestinal, renal, and coagulation complications that were assessed with a generalized estimating equation multivariate model. The pri- mary safety outcome was a change in serum creatinine concentration up to 6 months postoperatively, compared to baseline concentrations. Results: A total of 1,057 patients were included in the analysis. Patients assigned to crystalloid received a median [quartile 1, quartile 3] amount of 3.2 l [2.3, 4.4] of crystalloid, and patients assigned to colloid received 1.0 l [0.5, 1.5] of colloid and 1.8 l [1.2, 2.4] of crystalloid. The estimated intention-to-treat common effect relative risk for the primary composite was 0.90 for colloids versus crystalloids (95% CI: 0.65 to 1.23, P = 0.51), and 18% (91 of 523) of colloid patients and 20% (103 of 534) of crystalloid patients incurred at least one component of the primary outcome composite. There was no evidence of renal toxicity at any time. Conclusions: Doppler-guided intraoperative hydroxyethyl starch admin- istration did not significantly reduce a composite of serious complications. However, there was also no indication of renal or other toxicity. (ANESTHESIOLOGY 2019; 130:728–44) EDITOR’S PERSPECTIVE What We Already Know about This Topic • Crystalloid solutions leave the circulation quickly, whereas colloids remain for hours, thus promoting hemodynamic stability. However, colloids are expensive and promote renal toxicity in critical care patients. Whether goal-directed intraoperative tetrastarch colloid administration reduces complications or promotes renal injury remains unknown. What This Article Tells Us That Is New • In a large randomized trial comparing intraoperative goal-directed 6% hydroxyethyl starch with goal-directed lactated Ringer’s solu- tion in patients having major abdominal surgery, 6% hydroxyethyl starch reduced neither a composite of serious complications nor the duration of hospitalization. However, 6% hydroxyethyl starch did not cause acute or long-term renal toxicity. Effect of Intraoperative Goal-directed Balanced Crystalloid versus Colloid Administration on Major Postoperative Morbidity A Randomized Trial Barbara Kabon, M.D., Daniel I. Sessler, M.D., Andrea Kurz, M.D., on behalf of the Crystalloid–Colloid Study Team* Anesthesiology 2019; 130:728–44 This article is featured in “This Month in Anesthesiology,” page 1A. This article is accompanied by an editorial on p. 677. This article has a visual abstract available in the online version. Submitted for publication February 8, 2018. Accepted for publication November 30, 2018. From the Department of Anesthesia and Intensive Care Medicine, Medical University of Vienna, Vienna, Austria (B.K.); and the Departments of Outcomes Research (D.I.S., A.K.) and General Anesthesiology (A.K.), Anesthesiology Institute, Cleveland Clinic, Cleveland, Ohio. *Members of the Crystalloid–Colloid Study Team are listed in appendix 1. Copyright © 2019, the American Society of Anesthesiologists, Inc. Wolters Kluwer Health, Inc. All Rights Reserved. Anesthesiology 2019; 130:728–44 A key role for anesthesiologists is to maintain intraop- erative hemodynamic stability, a task that is compli- cated by large fluid losses consequent to major surgery. Volume replacement is the major compensation for fluid loss. Crystalloid salt solutions are the most commonly used perioperative fluids because they are inexpensive, read- ily available, and relatively nontoxic. 1 However, crystal- loid solutions start to leave the intravascular space within minutes, thereafter providing little hemodynamic support. Crystalloids also accumulate in tissues including lungs and incision sites, thus promoting edema, weight gain, and pro- longed recovery. 2–4 In contrast, colloids remain in the circulation for hours, thus promoting hemodynamic stability. 5,6 Albumin was the original colloid volume replacement fluid and has been used since the 1940s. 7 However, being a human product, albumin is expensive, and the supply is sometimes limited. Consequently, starch preparations are now by far the most commonly used colloid volume expander. 8 In septic and critically ill patients, starch preparations cause renal injury and death, 9–12 which has alarmed the European Medicines Agency 13 and the U.S. Food and Drug Administration. 14 Short-term use of starches has not been associated with renal toxicity, 15 but their effectiveness and safety has yet to be evaluated in a robust perioperative trial. 16 Furthermore, despite limited evidence worldwide, the issuing of IV fluid solutions to hospital departments has Copyright © 2019, the American Society of Anesthesiologists, Inc. Wolters Kluwer Health, Inc. Unauthorized reproduction of this article is prohibited. Downloaded from http://pubs.asahq.org/anesthesiology/article-pdf/130/5/728/390636/20190500_0-00018.pdf by guest on 20 July 2021
Transcript of Effect of Intraoperative Goal-directed Balanced ...
PerioPerative Medicine
728 MAY 2019 ANESTHESIOLOGY, V 130 • NO 5
aBStractBackground: Crystalloid solutions leave the circulation quickly, whereas colloids remain for hours, thus promoting hemodynamic stability. However, colloids are expensive and promote renal toxicity in critical care patients. This study tested the hypothesis that goal-directed colloid administration during elective abdominal surgery decreases 30-day major complications more than goal-directed crystalloid administration.
Methods: In this parallel-arm double-blinded multicenter randomized trial, adults having moderate- to high-risk open and laparoscopically assisted abdominal surgery with general anesthesia were randomly assigned to Doppler-guided intraoperative volume replacement with 6% hydroxyethyl starch 130/0.4 (n = 523) or lactated Ringer’s solution (n = 534). The pri-mary outcome was a composite of serious postoperative cardiac, pulmonary, infectious, gastrointestinal, renal, and coagulation complications that were assessed with a generalized estimating equation multivariate model. The pri-mary safety outcome was a change in serum creatinine concentration up to 6 months postoperatively, compared to baseline concentrations.
results: A total of 1,057 patients were included in the analysis. Patients assigned to crystalloid received a median [quartile 1, quartile 3] amount of 3.2 l [2.3, 4.4] of crystalloid, and patients assigned to colloid received 1.0 l [0.5, 1.5] of colloid and 1.8 l [1.2, 2.4] of crystalloid. The estimated intention-to-treat common effect relative risk for the primary composite was 0.90 for colloids versus crystalloids (95% CI: 0.65 to 1.23, P = 0.51), and 18% (91 of 523) of colloid patients and 20% (103 of 534) of crystalloid patients incurred at least one component of the primary outcome composite. There was no evidence of renal toxicity at any time.
conclusions: Doppler-guided intraoperative hydroxyethyl starch admin-istration did not significantly reduce a composite of serious complications. However, there was also no indication of renal or other toxicity.
(ANESTHESIOLOGY 2019; 130:728–44)
editor’S PerSPective
What We Already Know about This Topic
• Crystalloid solutions leave the circulation quickly, whereas colloids remain for hours, thus promoting hemodynamic stability. However, colloids are expensive and promote renal toxicity in critical care patients. Whether goal-directed intraoperative tetrastarch colloid administration reduces complications or promotes renal injury remains unknown.
What This Article Tells Us That Is New
• In a large randomized trial comparing intraoperative goal-directed 6% hydroxyethyl starch with goal-directed lactated Ringer’s solu-tion in patients having major abdominal surgery, 6% hydroxyethyl starch reduced neither a composite of serious complications nor the duration of hospitalization. However, 6% hydroxyethyl starch did not cause acute or long-term renal toxicity.
Effect of Intraoperative Goal-directed Balanced Crystalloid versus Colloid Administration on Major Postoperative MorbidityA Randomized TrialBarbara Kabon, M.D., Daniel I. Sessler, M.D., Andrea Kurz, M.D., on behalf of the Crystalloid–Colloid Study Team*
Anesthesiology 2019; 130:728–44
This article is featured in “This Month in Anesthesiology,” page 1A. This article is accompanied by an editorial on p. 677. This article has a visual abstract available in the online version.
Submitted for publication February 8, 2018. Accepted for publication November 30, 2018. From the Department of Anesthesia and Intensive Care Medicine, Medical University of Vienna, Vienna, Austria (B.K.); and the Departments of Outcomes Research (D.I.S., A.K.) and General Anesthesiology (A.K.), Anesthesiology Institute, Cleveland Clinic, Cleveland, Ohio.
*Members of the Crystalloid–Colloid Study Team are listed in appendix 1.
Copyright © 2019, the American Society of Anesthesiologists, Inc. Wolters Kluwer Health, Inc. All Rights Reserved. Anesthesiology 2019; 130:728–44
A key role for anesthesiologists is to maintain intraop-erative hemodynamic stability, a task that is compli-
cated by large fluid losses consequent to major surgery. Volume replacement is the major compensation for fluid loss. Crystalloid salt solutions are the most commonly used perioperative fluids because they are inexpensive, read-ily available, and relatively nontoxic.1 However, crystal-loid solutions start to leave the intravascular space within minutes, thereafter providing little hemodynamic support. Crystalloids also accumulate in tissues including lungs and incision sites, thus promoting edema, weight gain, and pro-longed recovery.2–4
In contrast, colloids remain in the circulation for hours, thus promoting hemodynamic stability.5,6 Albumin was the original colloid volume replacement fluid and has been used since the 1940s.7 However, being a human product, albumin is expensive, and the supply is sometimes limited. Consequently, starch preparations are now by far the most commonly used colloid volume expander.8
In septic and critically ill patients, starch preparations cause renal injury and death,9–12 which has alarmed the European Medicines Agency13 and the U.S. Food and Drug Administration.14 Short-term use of starches has not been associated with renal toxicity,15 but their effectiveness and safety has yet to be evaluated in a robust perioperative trial.16 Furthermore, despite limited evidence worldwide, the issuing of IV fluid solutions to hospital departments has
Copyright © 2019, the American Society of Anesthesiologists, Inc. Wolters Kluwer Health, Inc. Unauthorized reproduction of this article is prohibited.
Dow
nloaded from http://pubs.asahq.org/anesthesiology/article-pdf/130/5/728/390636/20190500_0-00018.pdf by guest on 20 July 2021
Anesthesiology 2019; 130:728–44 729
Crystalloid versus Colloid
Kabon et al.
changed in recent years to less colloids, particularly syn-thetic solutions, and relatively more crystalloids, particularly buffered solutions.17,18
We therefore tested the primary hypothesis that a 30-day composite of serious complications is reduced by intraop-erative administration of colloid (Voluven, Fresenius Kabi, Germany) versus crystalloid (lactated Ringer’s solution) in patients having moderate to high-risk open and laparoscop-ically assisted abdominal surgery with general anesthesia. Our secondary hypothesis was that colloid administration reduces the primary composite outcome augmented by 30-day all-cause mortality and hospital readmission and that colloid administration reduces a composite of minor complications. A tertiary hypothesis was that colloid admin-istration reduces hospital length of stay. Our primary safety outcome was the change in serum creatinine concentration at various postoperative times.
A difficulty with comparing crystalloids and colloids is that volume requirements with each fluid differ. Because colloids remain intravascular longer than crystalloids, less fluid is required; but how much less depends on the specific colloid used and patient status, both of which vary over time. There is thus little justification in comparing specific volume ratios of crystalloids and colloids.19,20 We therefore used guided fluid management—based on optimizing car-diovascular performance—to provide physiologically simi-lar quantities of each fluid type throughout surgery.21–23
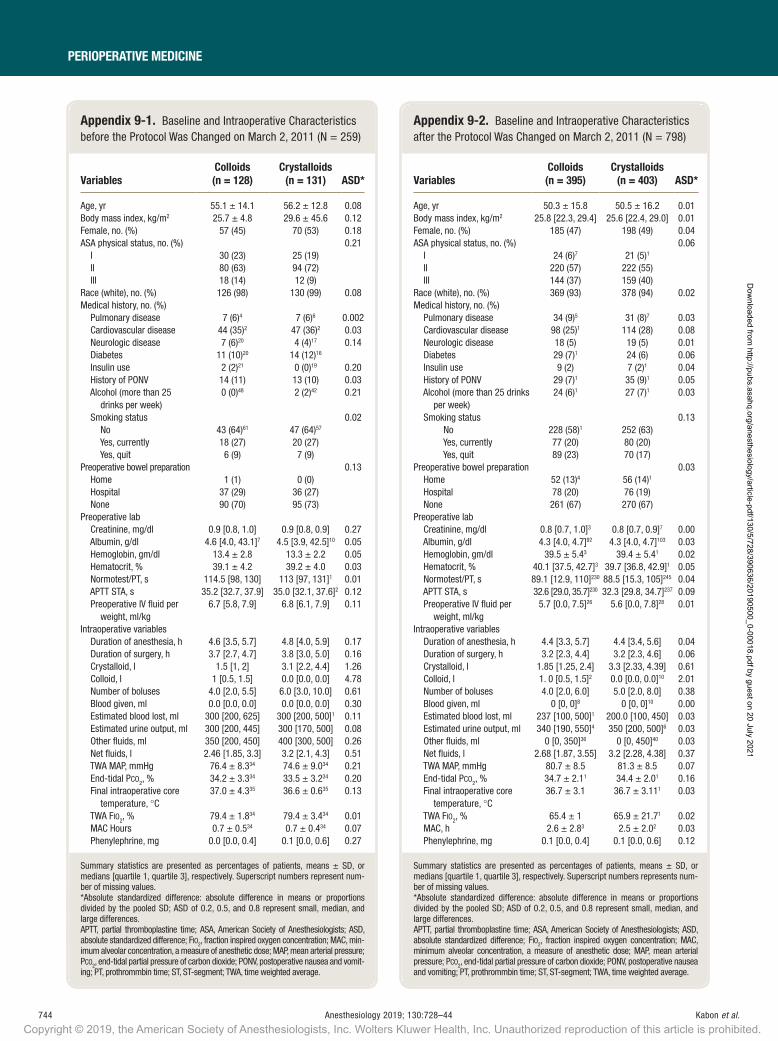
Materials and MethodsThis trial was conducted with institutional review board approvals at three participating institutions and was regis-tered at ClinicalTrials.gov (the trial was initially registered at NCT00517127 when it started at the Medical University of Vienna [Vienna, Austria] and was reregistered at NCT01195883 when the Cleveland Clinic [Cleveland, Ohio] joined the study). The trial was originally initiated at the Medical University of Vienna and registered in 2007. After 259 patients were enrolled in Vienna, in 2010, the Cleveland Clinic and thereafter thereafter the Ohio State University (Columbus, Ohio) joined, the trial was reregistered by the Cleveland Clinic. With the reregistration in 2010, we also improved our study protocol. Especially individual parts of the major and minor complications were outlined in more detail. Thus, the second trial registration was more detailed than the first. Nevertheless, the same outcome data were prospec-tively evaluated in all patients. Treatment was also consistent throughout the entire trial. Several sub-studies, which were performed at the Medical University of Vienna only, were in the initial trial registration and are not part of this manuscript.
Written consent was obtained from all patients. We eval-uated patients scheduled for open or laparoscopic-assisted abdominal surgery expected to last at least 2 h who were age 18 to 80 yr, were American Society of Anesthesiologists (ASA) physical status I–III, and had a body mass index of less than 35 kg/m2. We excluded patients who had
compromised kidney function (estimated creatinine clear-ance less than 30 ml/min), estimated cardiac ejection frac-tion less than 35%, severe chronic obstructive pulmonary disease, coagulopathies, or known esophageal or aortic abnormalities. Patients were given 5 to 7 ml/kg of lactated Ringer’s solution during anesthetic induction, followed by 3 to 5 ml · kg−1 · h−1 of the solution for maintenance, nor-malized to ideal body weight, throughout surgery.
Randomization and Masking
Shortly before induction of anesthesia, patients were ran-domized 1:1, stratified by study site, to either goal-directed crystalloid administration (lactated Ringer’s solution) or goal-directed colloid administration (hydroxyethyl starch 6% 130/0.4, Voluven, Fresenius Kabi, Germany). The maximum dose of the colloid was 1,500 ml. We chose hydroxyethyl starch 130/0.4 because it was the newest starch and associated with least renal or coagulation side effects. Furthermore, it was the most commonly used starch in Europe at the time. The randomization sequence was generated by the study statistician (E.J.M.) using the PLAN procedure in SAS statistical software (SAS Institute, USA) using randomly sized blocks and stratified by clinical site. Allocation was initially concealed with sequentially num-bered sealed envelopes and then later in the study with a web-based system. A trained study coordinator at each site evaluated eligibility, obtained informed consent, and then on the day of surgery enrolled the participants by either opening the concealed envelope or accessing the web-based system. Intraoperative investigators and clinicians were not blinded to treatment. However, an observer strictly blinded to group assignment evaluated complications during hospi-talization. Subsequently, a blinded investigator called patients 30 days after surgery to assess postdischarge complications (primary outcome) and hospital readmission and vital status (secondary outcomes) described in this section below.
Intraoperative investigators administered the study flu-ids strictly following our fluid algorithm. Intraoperative fluid administration was guided by esophageal Doppler (CardioQ, Deltex Medical Group PLC, United Kingdom) using a previously published algorithm.22 Based on stroke volume and corrected aortic flow time, boluses of 250 ml of the designated fluid were given over 5 min. Specifically, one fluid bolus was given preoperatively, and baseline fluid was started during induction of anesthesia. Fluid bolus as by randomization started after insertion of the esophageal Doppler probe.
Anesthesia management was standardized. We used bal-anced anesthesia with inhalational agents. Epidural cathe-ters were allowed. However, dosing had to be initiated at the end of the study for postoperative analgesia.
Target intraoperative hematocrit was maintained at 30% in patients having both cardiovascular disease and an age more than 65 yr and 28% in patients with one or the other, and 26% in those with neither. Significant cardiovascular disease
Copyright © 2019, the American Society of Anesthesiologists, Inc. Wolters Kluwer Health, Inc. Unauthorized reproduction of this article is prohibited.
Dow
nloaded from http://pubs.asahq.org/anesthesiology/article-pdf/130/5/728/390636/20190500_0-00018.pdf by guest on 20 July 2021
730 Anesthesiology 2019; 130:728–44 Kabon et al.
PerioPerative Medicine
was defined by previous myocardial infarction, angina, con-gestive heart failure, cardiomyopathy, hypertension requiring treatment (or having a diastolic blood pressure exceeding 90 mmHg), or peripheral vascular disease. In the postopera-tive recovery unit we administered fluid at 2 ml · kg−1 · h−1, with additional fluid given as deemed clinically necessary. Postoperative analgesia was provided per institutional routine.
The primary outcome was postoperative morbid-ity, defined by a composite of major complications, sim-ilar to those used in many fluid management studies.24,25 It included cardiac, pulmonary, infectious, gastrointestinal, renal, and coagulation complication.
Preplanned secondary outcomes included: (1) a com-posite of minor complications including superficial inci-sional infection as per Centers for Disease Control and Prevention (Atlanta, Georgia) criteria, postoperative fever, urinary tract infection, ST-segment change, nonventricular arrhythmias, hemodynamic disturbances requiring vasoactive drugs, unplanned intensive care unit admission, small perito-neal pleural effusions, gastrointestinal paralysis, deep venous thrombosis, acute kidney injury, and transient neurologic complications; and (2) the primary composite augmented by readmission and mortality. We also evaluated the duration of hospitalization as a tertiary outcome. Our safety outcome was in-hospital serum creatinine concentrations and, as available, serum creatinine concentration up to 6 months postopera-tively. (See appendix 2).
Statistical Analyses
The colloid and crystalloid groups were compared for bal-ance on demographic and baseline characteristics using standard summary statistics and absolute standardized dif-ference, defined as the difference in means or proportions divided by the pooled SD. Any variable with an absolute standardized difference greater than 0.20 was considered imbalanced and would be adjusted for in all analyses.
Primary Outcome The primary analysis was intention to treat so that all ran-domized patients were included in all analyses. For the primary outcome of major complications, we assigned outcome values for missing outcome data (i.e., postran-domization through 30 days) using last observation carried forward (n = 14 cases) when the outcome for a component of the composite was known at hospital discharge but not between discharge and 30 days. Five patients had a single major outcome component missing with all other compo-nents being negative; for analysis, we assumed that they did not have had any complications.
We assessed the treatment effect on the major compli-cations via a common effect “global” relative risk estimated across six outcomes of interest. In this multivariate anal-ysis, each patient was represented once for each outcome event. The within-subject correlation among the outcomes was accounted for using a generalized estimating equation
model with an unstructured working correlation matrix. Treatment-by-site interaction was assessed in a separated generalized estimating equations model.
As a sensitivity analysis we assessed the treatment effect on the collapsed composite of the six major complications (i.e., any vs. none) using a chi-square test. The Breslow–Day test was used to assess whether the treatment effect on the collapsed composite outcome differed across the three hos-pitals. Due to the protocol change after 259 patients were enrolled, we also conducted a sensitivity analysis to assess whether there was an interaction effect between treatment group and the protocol change.
Secondary and Tertiary Outcomes We assessed the treatment effect on the collapsed composite of any minor complication and on a collapsed composite of any major complications plus 30-day mortality and 30-day readmission, each with a chi-square test. The minor com-plication analysis was a per-protocol analysis because more than 10% of patients (n = 145) had at least one minor com-ponent missing, making an intention-to-treat analysis with conservative assignment unrealistic.
Duration of hospitalization and readmission were ana-lyzed as time to discharge alive and time to readmission, and the treatment effects were assessed using Cox propor-tional hazards models. To avoid bias from considering early deaths as short hospitalizations and thus favorable lengths of stay, patients who died in the hospital were assigned the longest observed hospital stay of any patient and censored at that time (i.e., not discharged alive). Patients who died within 30 days after surgery were censored at the date of death for the time to readmission analysis. Because only 1% of patients died within 30 days, a competing risks analysis was unnecessary.
Safety Outcomes Because harm was reported in septic critical care patients during the course of our study,9–12 the Data Safety and Monitoring Board (Cleveland, Ohio) added renal toxicity as a safety outcome. We compared colloids and crystalloids groups on the maximum postoperative serum creatinine concentration during hospitalization and within 6 months thereafter with analysis of covariance adjusted for the preop-erative serum creatinine. Because serum creatinine concen-trations were not normally distributed, we analyzed them on a log scale, with treatment effect reported as the ratio of geo-metric means. We also assessed between-group differences in creatinine changes over time using linear mixed models to adjust for within-patient correlation: (1) over postoperative days 1 to 14 and (2) over postoperative months 1 to 6.
Interim Analyses We used a group-sequential design in which four interim analyses were planned with a maximum enrollment of 1,112 patients, using the γ spending values of −4 for efficacy and −1 for futility. At the final analysis, primary outcome CI used the interim-adjusted α of 0.04.
Copyright © 2019, the American Society of Anesthesiologists, Inc. Wolters Kluwer Health, Inc. Unauthorized reproduction of this article is prohibited.
Dow
nloaded from http://pubs.asahq.org/anesthesiology/article-pdf/130/5/728/390636/20190500_0-00018.pdf by guest on 20 July 2021
Anesthesiology 2019; 130:728–44 731
Crystalloid versus Colloid
Kabon et al.
The significance criterion for each secondary outcome was P < 0.017 (i.e., 0.05/3, Bonferroni correction for two secondary outcomes and one tertiary outcome). For sim-plicity of presentation, we refer to these adjusted intervals as 95% CI throughout. SAS software version 9.4 for Windows (SAS Institute, USA) was used for analyses.
Power Analysis Our maximum sample size of 1,112 (including interim and final analyses) was based on being able to detect a risk reduc-tion of 30 to 40% across the outcomes in our multivariate gen-eralized estimating equation model with 80% power at the 0.05 significance level. Based on our own pilot data of 259 patients (enrolled under the initial study registration) and eval-uated in blinded fashion, we assumed individual incidences for the outcomes of interest of the combined treatment groups ranging from 2 to 10% and within-subject correlations rang-ing from about 0.05 to 0.30 across the outcomes. Detectable risk reduction for the planned sample size is expressed as a range because it depends on the degree of correlation among
components of the composite, which was unknown in the trial design phase.
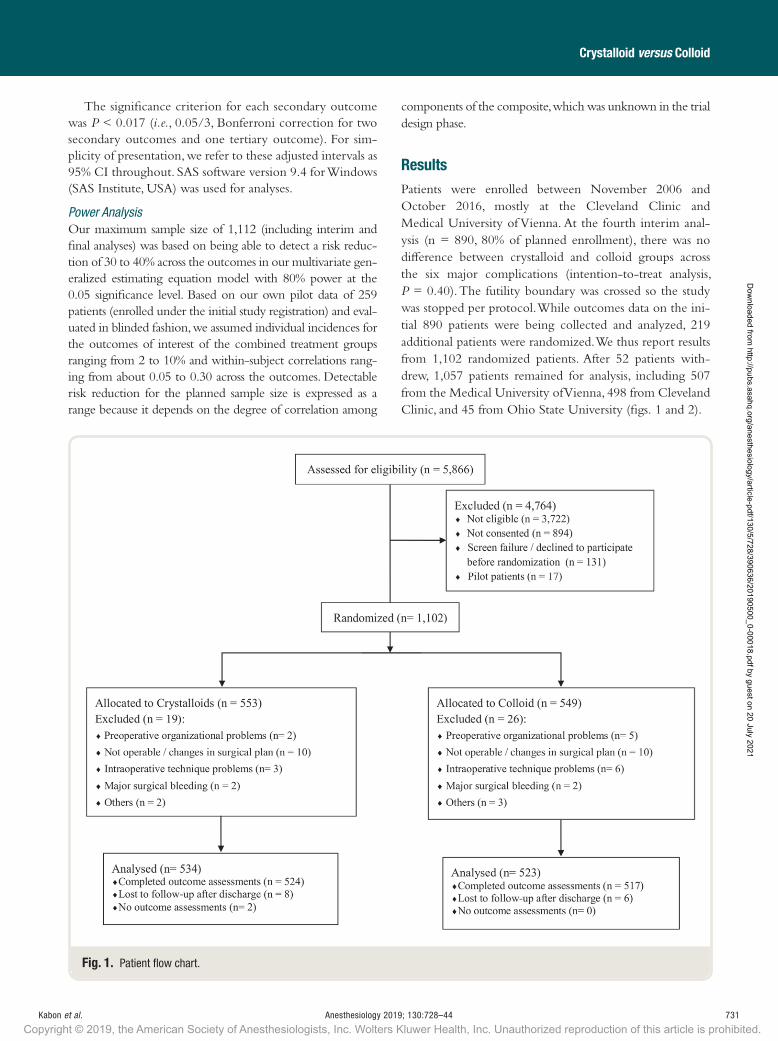
resultsPatients were enrolled between November 2006 and October 2016, mostly at the Cleveland Clinic and Medical University of Vienna. At the fourth interim anal-ysis (n = 890, 80% of planned enrollment), there was no difference between crystalloid and colloid groups across the six major complications (intention-to-treat analysis, P = 0.40). The futility boundary was crossed so the study was stopped per protocol. While outcomes data on the ini-tial 890 patients were being collected and analyzed, 219 additional patients were randomized. We thus report results from 1,102 randomized patients. After 52 patients with-drew, 1,057 patients remained for analysis, including 507 from the Medical University of Vienna, 498 from Cleveland Clinic, and 45 from Ohio State University (figs. 1 and 2).
Fig. 1. Patient flow chart.
Copyright © 2019, the American Society of Anesthesiologists, Inc. Wolters Kluwer Health, Inc. Unauthorized reproduction of this article is prohibited.
Dow
nloaded from http://pubs.asahq.org/anesthesiology/article-pdf/130/5/728/390636/20190500_0-00018.pdf by guest on 20 July 2021

732 Anesthesiology 2019; 130:728–44 Kabon et al.
PerioPerative Medicine
Of 1,102 patients in total, 259 patients were enrolled under the initial protocol. Sixteen patients were lost to fol-low-up after discharge, including 14 patients who had out-comes evaluated at discharge: we carried forward their last observations for the primary analysis. Two others without discharge values (both in the crystalloid group) were assigned 30-day outcomes under a conservative scenario. Only 10 patients had laparoscopically assisted surgery, whereas the remainder of the patients had open abdominal surgery.
Patients given colloid and crystalloid were well balanced on baseline characteristics, so no covariable adjustment was needed in the analyses (table 1; appendices 3 and 9). The median [quartile 1, quartile 3] amount of crystalloid given to patients assigned to crystalloid was 3.2 l [2.3, 4.4]. Patients assigned to colloid were given 1.0 l [0.5, 1.5] of colloid and 1.8 l [1.2, 2.4] of crystalloid.
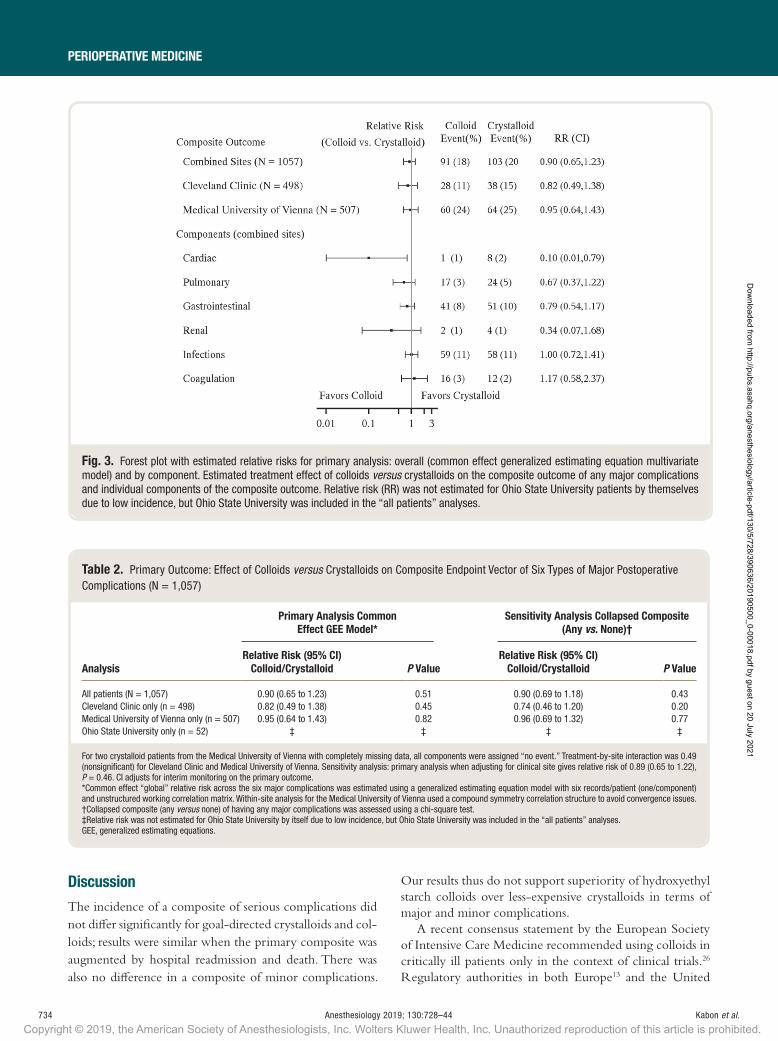
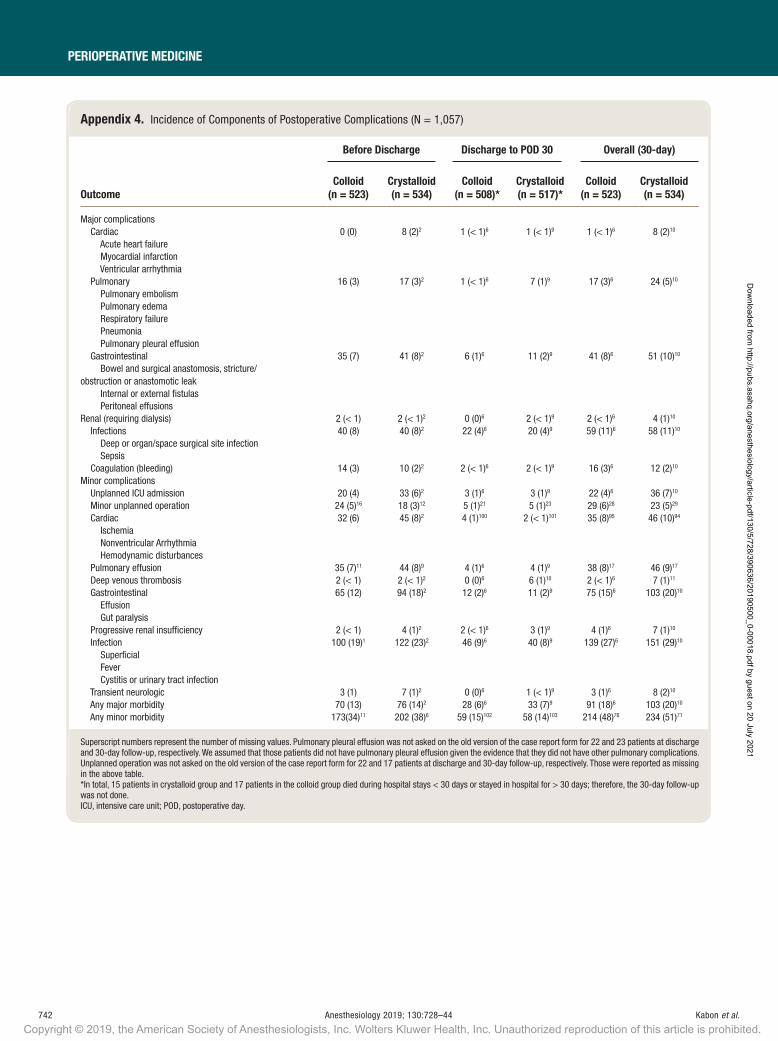
Appendix 4 lists the components of the primary and sec-ondary composites, the incidence of each component, and the incidence of each composite. Figure 3 is a forest plot showing the primary outcome relative risks and individual
group risks overall, by study site, and by component. In total, 18% (91 of 523) of colloid patients and 20% (103 of 534) of crystalloid patients incurred at least one component of the primary outcome composite.
No difference was found between colloid and crystal-loids on the primary outcome composite, with an estimated common effect relative risk across the six major complica-tions for colloid versus crystalloid patients of 0.90 (95% CI, 0.65 to 1.23), P = 0.51 (table 2; fig. 3). We also assessed the treatment effect on the collapsed composite of the major complications (any vs. none), with estimated relative risk of having any major complication of 0.90 (95% CI, 0.69 to 1.18), P = 0.43 (table 2). No interactions were detected across the complication components or among sites, so that the treatment effect was not found to differ across compo-nents of the composite of major complications or to vary by clinical site. Further, the treatment effect on the primary outcome composite did not vary by ASA group (III vs. II or lower), P = 0.99.
There was no interaction between before and after the protocol change on primary outcome (P = 0.37). For patients who were enrolled before the protocol change, the relative risk of the primary outcome for the colloid group compared with crystalloid was 1.13 (95% CI, 0.11 to 2.09), P ≥ 0.9; after the protocol change the estimated relative risk was 1.08 (95% CI, 0.86 to 1.36), P ≥ 0.9.
No treatment effect was found on the secondary out-come of any minor complication, with relative risk (98.3% CI) of 0.95 (0.81 to 1.23; table 3), P = 0.42, in colloid versus crystalloid: incidence of any minor complication was 48% for the colloid patients and 51% (appendix 5) for the crystalloid patients. Neither was there an effect of colloid versus crystalloid on the secondary composite outcome of any major complications (primary composite) plus 30-day mortality or 30-day readmission, with relative risk (98.3% CI) of 0.89 (0.69 to 1.14), P = 0.26.
Thirty-day mortality was 1.0% for colloid patients and 0.8% for crystalloid patients, with estimated relative risk of 1.28 (98.3% CI, 0.26 to 6.29) for colloid versus crystalloid, P = 0.71. The 30-day readmission rate was 11.9% in the colloid group and 12% in the crystalloid group. Finally, no difference was found between the randomized groups on length of hospital stay, with median [quartiles] length of hospital stay of 7 [5, 11] days for both groups (hazard ratio [98.3% CI] of 1.05 [0.90 to 1.21]), P = 0.45.
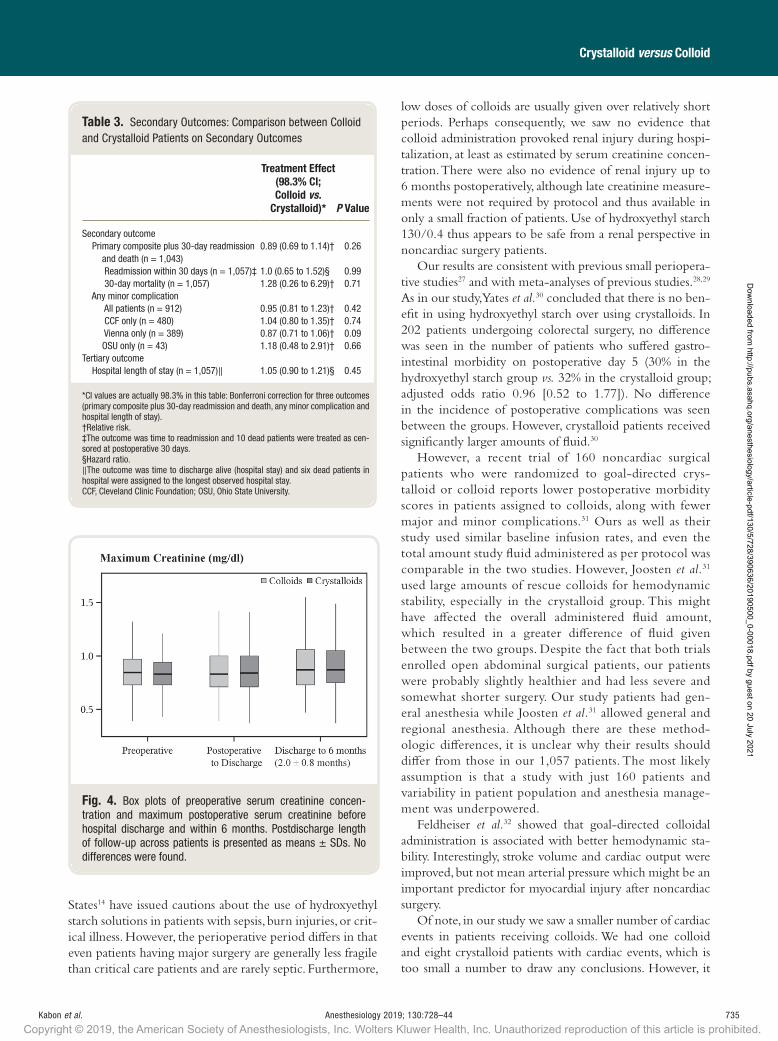
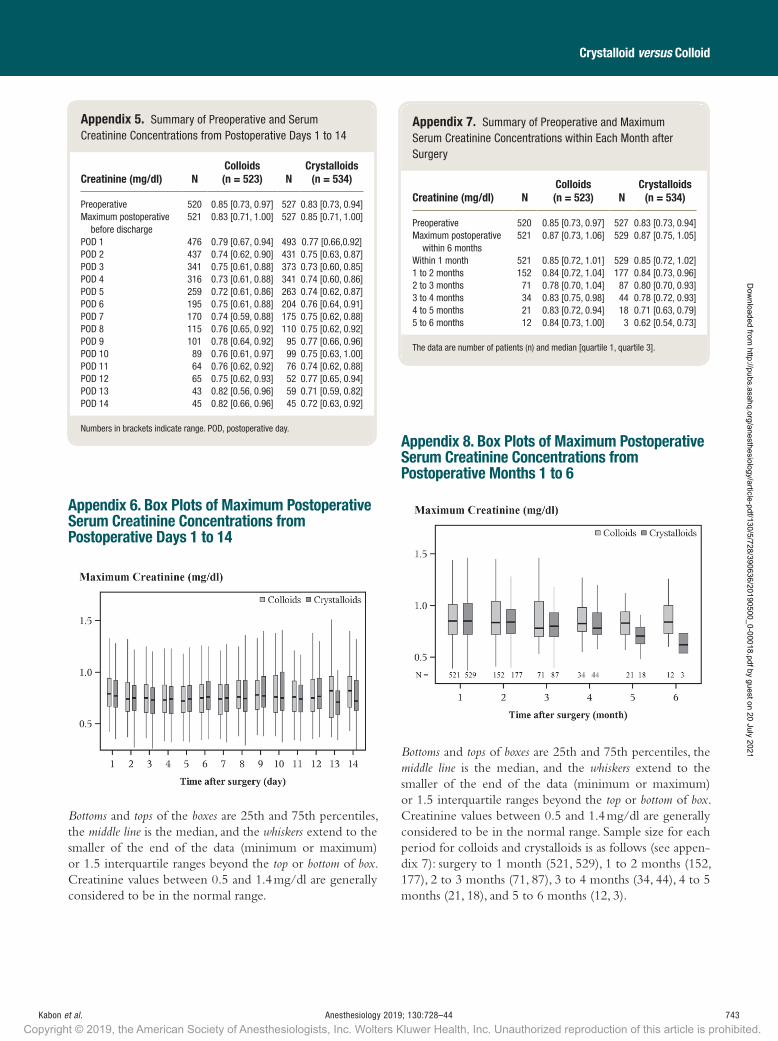
After adjusting for baseline serum creatinine, the ratio of geometric means for maximum creatinine during the hospital stay was 0.97 (95% CI, 0.93 to 1.01) for colloid versus crystalloid, P = 0.19. There was also no difference up to 6 months after discharge, with an estimated ratio of geometric means of 0.97 (95% CI, 0.93 to 1.02; fig. 4), P = 0.23. There were no creatinine differences between the groups over the initial 14 postoperative days (P = 0.84; appendices 5 and 6) or initial 6 months (P = 0.54, appen-dices 7 and 8).
Fig. 2. Interim monitoring results for the primary analysis: common effect generalized estimating equation relative risk of colloid versus crystalloid across six postoperative major com-plications. Group sequential futility boundary (pink region) was crossed at the fourth interim analysis (N = 890); the trial was therefore stopped for futility. While outcomes data on the initial 890 patients were being collected and analyzed, 219 additional patients were randomized. We thus report results from 1,102 randomized patients. After 52 patients withdrew, 1,057 patients remained for analysis. The vertical axis is the Z statistic corre-sponding to the standardized treatment effect estimated at each interim analysis; negative values indicate efficacy of colloid (sig-nificant if reaching lower blue region), whereas positive values indicate harm (significant if reaching upper blue region).
Copyright © 2019, the American Society of Anesthesiologists, Inc. Wolters Kluwer Health, Inc. Unauthorized reproduction of this article is prohibited.
Dow
nloaded from http://pubs.asahq.org/anesthesiology/article-pdf/130/5/728/390636/20190500_0-00018.pdf by guest on 20 July 2021

Anesthesiology 2019; 130:728–44 733
Crystalloid versus Colloid
Kabon et al.
Stage 1 acute kidney injury was observed in 20 (3.9%) colloid patients and 12 (2.3%) crystalloid patients; stage 2 injury was observed in 1 (0.2%) col-loid patient and 4 (0.8%) crystalloid patients; and there
was no stage 3 acute kidney injury. Acute kidney injury did not differ significantly, with an estimated odds ratio of 1.33 (95% CI, 0.69 to 2.58, colloids vs. crystalloids, P = 0.40).
table 1. Baseline and Intraoperative Characteristics (N = 1,057)
variables colloids (n = 523) crystalloids (n = 534) aSd*
Age, yr 52 ± 16 52 ± 16 0.03Body mass index, kg/m2 25.5 [22.3, 29.1] 25.5 [22.4, 28.6] 0.01Female, no. (%) 242 (46) 268 (50) 0.08ASA physical status, no. (%) 0.06 I 54 (11) 7 46 (9)1 II 300 (58) 316 (59) III 162 (32) 171 (32) Race (white), no. (%) 495 (95) 508 (95) 0.02Medical history, no. (%) Pulmonary disease 41 (8)9 38 (7)13 0.03 Cardiovascular disease 142 (27)3 161 (30)2 0.07 Neurologic disease 25 (5)20 23 (5)17 0.02 Diabetes 40 (8)21 38 (7)16 0.02 Insulin use 11 (2)21 7 (1)19 0.06 History of PONV 43 (8)1 48 (9)1 0.03 Alcohol (more than 25 drinks per week) 24 (5)49 29 (6)43 0.04Smoking status 0.12 No 271 (59)62 299 (63)58 Yes, currently 95 (21) 100 (21) Yes, quit 95 (21) 77 (16) Preoperative bowel preparation 0.03 Home 53 (10)4 56 (11)1 Hospital 115 (22) 112 (21) None 351 (68) 365 (68) Preoperative lab Creatinine, mg/dl 0.8 [0.7, 1.0]3 0.8 [0.7, 0.9]7 0.06 Albumin, g/dl 4.4 [4.0, 5.0]99 4.4 [4.0, 5.1]113 0.05 Hemoglobin, mg/dl 13.6 ± 5.43 13.2 ± 1.91 0.09 Hematocrit, % 39.4 ± 5.13 39.4 ± 5.11 0.01 Normotest/PT, s 103.0 [77.0, 121.0]230 100 [81, 121]246 0.03 APTT STA, s 34.0 [30.6, 36.9]229 33.1 [30.7, 36.1]239 0.10 Preoperative IV fluid per weight, ml/kg 6.0 [0, 7.7]26 6.2 [0, 7.8]28 0.02Intraoperative variables Duration of anesthesia, h 4.4 [3.4, 5.7] 4.5 [3.6, 5.7] 0.07 Duration of surgery, h 3.4 [2.4, 4.5] 3.4 [2.5, 4.7] 0.08 Crystalloid, l 1.8 [1.2, 2.4] 3.2 [2.3, 4.4] 0.70 Colloid, l 1.0 [0.5, 1.5]2 0 [0, 0]10 2.62 Number of boluses 4 [2, 6] 5 [3, 8] 0.44 Blood given, ml 0 [0, 0]8 0 [0, 0]10 0.13 Estimated blood lost, ml 250 [100, 500]1 250 [100, 500]1 0.05 Estimated urine output, ml 320 [195, 500]4 340 [200, 500]6 0.04 Other fluids, ml 100 [0, 400]36 100 [0, 450]40 0.05 Net fluids, l 2.67 [1.85, 3.45]3 3.07 [2.15, 4.21]6 0.34 TWA MAP, mmHg 80 ± 934 80 ± 934 0.01 End-tidal Pco2, mmHg 34.6 ± 2.435 34.3 ± 2.335 0.16 Final intraoperative core temperature, °C 36.8 ± 3.035 36.6 ± 2.836 0.04 TWA Fio2, % 68 ± 1534 69 ± 2035 0.03 MAC, % 2.2 ± 2.637 2.1 ± 1.936 0.03 Phenylephrine, mg† 0.10 [0, 0.40] 0.10 [0, 0.50] 0.15
Summary statistics are presented as percentages of patients, means ± SD, or median [quartile 1, quartile 3], respectively. Superscript numbers represent number of missing values. Net fluids: sum of colloids, crystalloids, and other fluids minus estimated urine output. *Absolute standardized difference (ASD): absolute difference in means or proportions divided by the pooled SD; ASD values of 0.2, 0.5, and 0.8 represent small, median, and large differences. †Only three patients at Cleveland Clinic and one patient at the Medical University of Vienna were given epinephrine; one patient at Cleveland Clinic was given vasopressin; no patients at Cleveland Clinic were given norepinephrine.APTT, partial thromboplastine time; ASA, American Society of Anesthesiologists; ASD, absolute standardized difference; Fio2, fraction inspired oxygen concentration; MAC, minimum alveolar concentration, a measure of anesthetic dose; MAP, mean arterial pressure; Pco2, end-tidal partial pressure of carbon dioxide; PONV, postoperative nausea and vomiting; PT, prothrommbin time; TWA, time weighted average.
Copyright © 2019, the American Society of Anesthesiologists, Inc. Wolters Kluwer Health, Inc. Unauthorized reproduction of this article is prohibited.
Dow
nloaded from http://pubs.asahq.org/anesthesiology/article-pdf/130/5/728/390636/20190500_0-00018.pdf by guest on 20 July 2021
734 Anesthesiology 2019; 130:728–44 Kabon et al.
PerioPerative Medicine
discussionThe incidence of a composite of serious complications did not differ significantly for goal-directed crystalloids and col-loids; results were similar when the primary composite was augmented by hospital readmission and death. There was also no difference in a composite of minor complications.
Our results thus do not support superiority of hydroxyethyl starch colloids over less-expensive crystalloids in terms of major and minor complications.
A recent consensus statement by the European Society of Intensive Care Medicine recommended using colloids in critically ill patients only in the context of clinical trials.26 Regulatory authorities in both Europe13 and the United
Fig. 3. Forest plot with estimated relative risks for primary analysis: overall (common effect generalized estimating equation multivariate model) and by component. Estimated treatment effect of colloids versus crystalloids on the composite outcome of any major complications and individual components of the composite outcome. Relative risk (RR) was not estimated for Ohio State University patients by themselves due to low incidence, but Ohio State University was included in the “all patients” analyses.
table 2. Primary Outcome: Effect of Colloids versus Crystalloids on Composite Endpoint Vector of Six Types of Major Postoperative Complications (N = 1,057)
analysis
Primary analysis common effect Gee Model*
Sensitivity analysis collapsed composite (any vs. none)†
relative risk (95% ci) colloid/crystalloid P value
relative risk (95% ci) colloid/crystalloid P value
All patients (N = 1,057) 0.90 (0.65 to 1.23) 0.51 0.90 (0.69 to 1.18) 0.43Cleveland Clinic only (n = 498) 0.82 (0.49 to 1.38) 0.45 0.74 (0.46 to 1.20) 0.20Medical University of Vienna only (n = 507) 0.95 (0.64 to 1.43) 0.82 0.96 (0.69 to 1.32) 0.77Ohio State University only (n = 52) ‡ ‡ ‡ ‡
For two crystalloid patients from the Medical University of Vienna with completely missing data, all components were assigned “no event.” Treatment-by-site interaction was 0.49 (nonsignificant) for Cleveland Clinic and Medical University of Vienna. Sensitivity analysis: primary analysis when adjusting for clinical site gives relative risk of 0.89 (0.65 to 1.22), P = 0.46. CI adjusts for interim monitoring on the primary outcome.*Common effect “global” relative risk across the six major complications was estimated using a generalized estimating equation model with six records/patient (one/component) and unstructured working correlation matrix. Within-site analysis for the Medical University of Vienna used a compound symmetry correlation structure to avoid convergence issues. †Collapsed composite (any versus none) of having any major complications was assessed using a chi-square test. ‡Relative risk was not estimated for Ohio State University by itself due to low incidence, but Ohio State University was included in the “all patients” analyses.GEE, generalized estimating equations.
Copyright © 2019, the American Society of Anesthesiologists, Inc. Wolters Kluwer Health, Inc. Unauthorized reproduction of this article is prohibited.
Dow
nloaded from http://pubs.asahq.org/anesthesiology/article-pdf/130/5/728/390636/20190500_0-00018.pdf by guest on 20 July 2021
Anesthesiology 2019; 130:728–44 735
Crystalloid versus Colloid
Kabon et al.
States14 have issued cautions about the use of hydroxyethyl starch solutions in patients with sepsis, burn injuries, or crit-ical illness. However, the perioperative period differs in that even patients having major surgery are generally less fragile than critical care patients and are rarely septic. Furthermore,
low doses of colloids are usually given over relatively short periods. Perhaps consequently, we saw no evidence that colloid administration provoked renal injury during hospi-talization, at least as estimated by serum creatinine concen-tration. There were also no evidence of renal injury up to 6 months postoperatively, although late creatinine measure-ments were not required by protocol and thus available in only a small fraction of patients. Use of hydroxyethyl starch 130/0.4 thus appears to be safe from a renal perspective in noncardiac surgery patients.
Our results are consistent with previous small periopera-tive studies27 and with meta-analyses of previous studies.28,29 As in our study, Yates et al.30 concluded that there is no ben-efit in using hydroxyethyl starch over using crystalloids. In 202 patients undergoing colorectal surgery, no difference was seen in the number of patients who suffered gastro-intestinal morbidity on postoperative day 5 (30% in the hydroxyethyl starch group vs. 32% in the crystalloid group; adjusted odds ratio 0.96 [0.52 to 1.77]). No difference in the incidence of postoperative complications was seen between the groups. However, crystalloid patients received significantly larger amounts of fluid.30
However, a recent trial of 160 noncardiac surgical patients who were randomized to goal-directed crys-talloid or colloid reports lower postoperative morbidity scores in patients assigned to colloids, along with fewer major and minor complications.31 Ours as well as their study used similar baseline infusion rates, and even the total amount study fluid administered as per protocol was comparable in the two studies. However, Joosten et al.31 used large amounts of rescue colloids for hemodynamic stability, especially in the crystalloid group. This might have affected the overall administered fluid amount, which resulted in a greater difference of fluid given between the two groups. Despite the fact that both trials enrolled open abdominal surgical patients, our patients were probably slightly healthier and had less severe and somewhat shorter surgery. Our study patients had gen-eral anesthesia while Joosten et al.31 allowed general and regional anesthesia. Although there are these method-ologic differences, it is unclear why their results should differ from those in our 1,057 patients. The most likely assumption is that a study with just 160 patients and variability in patient population and anesthesia manage-ment was underpowered.
Feldheiser et al.32 showed that goal-directed colloidal administration is associated with better hemodynamic sta-bility. Interestingly, stroke volume and cardiac output were improved, but not mean arterial pressure which might be an important predictor for myocardial injury after noncardiac surgery.
Of note, in our study we saw a smaller number of cardiac events in patients receiving colloids. We had one colloid and eight crystalloid patients with cardiac events, which is too small a number to draw any conclusions. However, it
table 3. Secondary Outcomes: Comparison between Colloid and Crystalloid Patients on Secondary Outcomes
treatment effect (98.3% ci; colloid vs.
crystalloid)* P value
Secondary outcome Primary composite plus 30-day readmission
and death (n = 1,043)0.89 (0.69 to 1.14)† 0.26
Readmission within 30 days (n = 1,057)‡ 1.0 (0.65 to 1.52)§ 0.99 30-day mortality (n = 1,057) 1.28 (0.26 to 6.29)† 0.71 Any minor complication All patients (n = 912) 0.95 (0.81 to 1.23)† 0.42 CCF only (n = 480) 1.04 (0.80 to 1.35)† 0.74 Vienna only (n = 389) 0.87 (0.71 to 1.06)† 0.09 OSU only (n = 43) 1.18 (0.48 to 2.91)† 0.66Tertiary outcome Hospital length of stay (n = 1,057)∥ 1.05 (0.90 to 1.21)§ 0.45
*CI values are actually 98.3% in this table: Bonferroni correction for three outcomes (primary composite plus 30-day readmission and death, any minor complication and hospital length of stay). †Relative risk. ‡The outcome was time to readmission and 10 dead patients were treated as cen-sored at postoperative 30 days. §Hazard ratio. ∥The outcome was time to discharge alive (hospital stay) and six dead patients in hospital were assigned to the longest observed hospital stay.CCF, Cleveland Clinic Foundation; OSU, Ohio State University.
Fig. 4. Box plots of preoperative serum creatinine concen-tration and maximum postoperative serum creatinine before hospital discharge and within 6 months. Postdischarge length of follow-up across patients is presented as means ± SDs. No differences were found.
Copyright © 2019, the American Society of Anesthesiologists, Inc. Wolters Kluwer Health, Inc. Unauthorized reproduction of this article is prohibited.
Dow
nloaded from http://pubs.asahq.org/anesthesiology/article-pdf/130/5/728/390636/20190500_0-00018.pdf by guest on 20 July 2021
736 Anesthesiology 2019; 130:728–44 Kabon et al.
PerioPerative Medicine
has been shown recently that perioperative hypotension is associated with myocardial injury after noncardiac surgery.33 Thus, better hemodynamic stability with colloids might result in improved cardiac outcome.
There remains considerable controversy over the ideal amount of fluid to be given during various types of sur-gery, and there is considerable variation from site to site. Nonetheless, there is some consensus that goal-directed management is most likely to target the best dose in individ-ual patients,34 although results are not entirely consistent.30,35 An important feature of our trial is thus that goal-directed fluid management was used in all patients. Titrating fluid replacement to stroke volume not only provided compara-ble physiologic amounts of each fluid throughout surgery, but also provided the right amounts of each presumably at the correct times.32,36–38
We used a baseline infusion rate of approximately 4 ml kg−1 h−1 lactated Ringer’s solution. Crystalloid patients received on average five fluid boluses, and colloid patients received four fluid boluses. Thus, the total amount of fluids was similar in our two study groups. The amount of vasopressors was slightly but not significantly higher in patients receiving crystalloids.
Independent of Doppler guidance, the modest amount of fluid given—about 3 l over 4.5 h—is consistent with the current approach to fluid restriction. We used lac-tated Ringer’s as our crystalloid as it is perhaps the most commonly used intraoperative balanced salt solution and, unlike normal saline, does not promote hyperchloremic acidosis.39,40
We selected hydroxyethyl starch 130/0.4, which is a third-generation colloid that is thought to cause less renal injury and coagulopathy than older starch preparations.41–43 We avoided albumin because it is expensive and some-times in short supply, although recent research suggests that human albumin protects the endothelial surface layer and might thus reduce interstitial edema.44
Colloid solutions are usually given to patients having large operations in which there is substantial volume loss. We thus restricted enrollment to patients having moder-ate to major open or laparoscopically assisted abdominal surgery, those most likely to require substantial volume replacement. In fact, only a minimal number of our patients (10 patients) had laparoscopically assisted sur-gery. Our results thus apply to general surgical patients likely to be given colloids. Our patient population was relatively healthy, with the majority of patients having an ASA physical status of II, a mean age of around 50 yr, and a body mass index near 25 kg/m2. It remains possible that starch solutions are more effective and/or more toxic in patients having significant cardiac or renal comorbidities, in older patients, or in obese patients. All of our patients had major surgery, but it remains possible that patients having the most invasive operations respond differently, including those having cardiac, major trauma, or transplant surgery with significant blood loss. The dose of colloid
was approximately 1 l over 3 h, which is moderate consid-ering that the maximum recommended dose is 33 ml/kg per 24 h. During the study, results of a major trial became available and showed that large volumes of colloid given over a period of days in critical care patients promoted renal toxicity.10 Consequent concerns slowed enrollment in Europe for several years. A resulting limitation of our trial is that enrollment lasted for an 11-yr period—a slow recruitment rate at a time of major changes in the under-standing and practices of fluid resuscitation along with improvements in surgical practice. Because the trial was randomized, background changes in practice do not con-stitute bias. However, to the extent that practice changes, results may be less relevant to current patients than the ones who enrolled in our trial earlier. For example, stroke volume is now more often used to guide fluid adminis-tration than correct flow time. However, it seems unlikely that practice changes account for our results or that a new trial would identify substantial benefit or toxicity in similar patients. Despite the long enrollment period, there were no substantive changes to the protocol or outcomes. Our study demonstrates the difficulties of large randomized trials and the fact that not only funding or lack thereof but also the regulatory environment can effect enrollment. The colloid we studied is but one of several; it remains approved by both the U.S. Food and Drug Administration and the European Medicines Agency. Naturally, results might differ with alternative colloids.
Another limitation is that clinicians knew which fluid the patients were getting, which could have led to ascer-tainment bias influencing additional fluid management by clinicians. However, fluids were given by research fellows and was based on strict criteria. Outcomes were evaluated by a separate team of investigators who were blinded to fluid allocation and intraoperative management.
In summary, Doppler-guided intraoperative hydroxyethyl starch administration did not reduce composites of serious complications. Nor did hydroxyethyl starch reduce the duration of hospitalization, but there was also no indication of renal or other toxicity. Because starch colloids are more expensive than crystalloids and apparently do not reduce perioperative complications, they should be used sparingly in surgical patients.
Research Support
Supported in part by Fresenius Kabi (Bad Homburg, Germany). Deltex Medical (Chichester, United Kingdom) provided the esophageal Doppler monitors and disposables. The sponsors were not involved in protocol development, data acquisition, or data analysis.
Competing Interests
The authors declare no competing interests.
Copyright © 2019, the American Society of Anesthesiologists, Inc. Wolters Kluwer Health, Inc. Unauthorized reproduction of this article is prohibited.
Dow
nloaded from http://pubs.asahq.org/anesthesiology/article-pdf/130/5/728/390636/20190500_0-00018.pdf by guest on 20 July 2021

Anesthesiology 2019; 130:728–44 737
Crystalloid versus Colloid
Kabon et al.
Reproducible Science
Full protocol available at: [email protected]. Raw data available at: [email protected].
Correspondence
Address correspondence to Dr. Sessler: Cleveland Clinic, 9500 Euclid Avenue/P77, Cleveland, Ohio 44195. [email protected]. This article may be accessed for personal use at no charge through the Journal Web site, www.anesthesiology.org.
references
1. Myburgh JA, Mythen MG: Resuscitation fluids. N Engl J Med 2013; 369:1243–51
2. Chappell D, Jacob M, Hofmann-Kiefer K, Conzen P, Rehm M: A rational approach to perioperative fluid management. Anesthesiology 2008; 109:723–40
3. Doherty M, Buggy DJ: Intraoperative fluids: How much is too much? Br J Anaesth 2012; 109:69–79
4. Brandstrup B, Tønnesen H, Beier-Holgersen R, Hjortsø E, Ørding H, Lindorff-Larsen K, Rasmussen MS, Lanng C, Wallin L, Iversen LH, Gramkow CS, Okholm M, Blemmer T, Svendsen PE, Rottensten HH, Thage B, Riis J, Jeppesen IS, Teilum D, Christensen AM, Graungaard B, Pott F; Danish Study Group on Perioperative Fluid Therapy: Effects of intravenous fluid restriction on post-operative complications: Comparison of two periop-erative fluid regimens: A randomized assessor-blinded multicenter trial. Ann Surg 2003; 238:641–8
5. Starling EH: On the absorption of fluids from the con-nective tissue spaces. J Physiol 1896; 19:312–26
6. Hahn RG: Volume kinetics for infusion fluids. Anesthesiology 2010; 113:470–81
7. Finfer S: Reappraising the role of albumin for resusci-tation. Curr Opin Crit Care 2013; 19:315–20
8. Weiskopf RB: Hydroxyethyl starches: A tale of two contexts: The problem of knowledge. Anesth Analg 2014; 119:509–13
9. Gattas DJ, Dan A, Myburgh J, Billot L, Lo S, Finfer S; CHEST Management Committee: Fluid resuscitation with 6% hydroxyethyl starch (130/0.4 and 130/0.42) in acutely ill patients: Systematic review of effects on mortality and treatment with renal replacement ther-apy. Intensive Care Med 2013; 39:558–68
10. Myburgh JA, Finfer S, Bellomo R, Billot L, Cass A, Gattas D, Glass P, Lipman J, Liu B, McArthur C, McGuinness S, Rajbhandari D, Taylor CB, Webb SA; CHEST Investigators; Australian and New Zealand Intensive Care Society Clinical Trials Group: Hydroxyethyl starch or saline for fluid resuscitation in intensive care. N Engl J Med 2012; 367:1901–11
11. Perner A, Haase N, Guttormsen AB, Tenhunen J, Klemenzson G, Åneman A, Madsen KR, Møller MH, Elkjær JM, Poulsen LM, Bendtsen A, Winding R, Steensen M, Berezowicz P, Søe-Jensen P, Bestle M, Strand K, Wiis J, White JO, Thornberg KJ, Quist L, Nielsen J, Andersen LH, Holst LB, Thormar K, Kjældgaard AL, Fabritius ML, Mondrup F, Pott FC, Møller TP, Winkel P, Wetterslev J; 6S Trial Group; Scandinavian Critical Care Trials Group: Hydroxyethyl starch 130/0.42 versus Ringer’s acetate in severe sepsis. N Engl J Med 2012; 367:124–34
12. Zarychanski R, Abou-Setta AM, Turgeon AF, Houston BL, McIntyre L, Marshall JC, Fergusson DA: Association of hydroxyethyl starch administration with mortality and acute kidney injury in critically ill patients requir-ing volume resuscitation: A systematic review and meta-analysis. JAMA 2013; 309:678–88
13. The European Medicines Agency: New review of hydroxyethyl starch-containing solutions for infusion started, 2013. Available at: https://www.ema.europa.eu/documents/referral/hydroxyethyl-starch-article- 107i-procedure-review-started_en.pdf
14. FDA Safety Communication: Boxed warning on increased mortality and severe injury, and additional warning on risk of bleeding, for use of hydroxyethyl starch solutions in some settings, 2013. Available at: https://www.fffenterprises.com/assets/downloads/Article-FDASafetyCommunicationBoxedWarning6-13.pdf
15. Zhang Y, Yu Y, Jia J, Yu W, Xu R, Geng L, Wei Y: Administration of HES in elderly patients undergoing hip arthroplasty under spinal anesthesia is not associ-ated with an increase in renal injury. BMC Anesthesiol 2017; 17: 29
16. Perel P, Roberts I: Colloids versus crystalloids for fluid resuscitation in critically ill patients. Cochrane Database Syst Rev 2011: CD000567
17. Hammond NE, Taylor C, Finfer S, Machado F, An Y, Billot L, Bloos F, Bozza F, Cavalcanti A, Correa M, Du B, Hjortrup P, Li Y: Patterns of intravenous fluid resus-citation use in adult intensive care patients between 2997 and 2014: An intenational cross-sectional study. PLoS One 2017; 12:e0176292
18. Jonsson AB, Perner A: Changes from 2012 to 2015 in intravenous fluid solutions issued to hospital depart-ments. Acta Anaesthesiol Scand 2017:61:532–8
19. Lamke LO, Liljedahl SO: Plasma volume changes after infusion of various plasma expanders. Resuscitation 1976; 5:93–102
20. Lobo DN, Stanga Z, Aloysius MM, Wicks C, Nunes QM, Ingram KL, Risch L, Allison SP: Effect of volume loading with 1 liter intravenous infusions of 0.9% saline, 4% succi-nylated gelatine (Gelofusine) and 6% hydroxyethyl starch (Voluven) on blood volume and endocrine responses: A
Copyright © 2019, the American Society of Anesthesiologists, Inc. Wolters Kluwer Health, Inc. Unauthorized reproduction of this article is prohibited.
Dow
nloaded from http://pubs.asahq.org/anesthesiology/article-pdf/130/5/728/390636/20190500_0-00018.pdf by guest on 20 July 2021
738 Anesthesiology 2019; 130:728–44 Kabon et al.
PerioPerative Medicine
randomized, three-way crossover study in healthy volun-teers. Crit Care Med 2010; 38:464–70
21. Pearse RM, Harrison DA, MacDonald N, Gillies MA, Blunt M, Ackland G, Grocott MP, Ahern A, Griggs K, Scott R, Hinds C, Rowan K; OPTIMISE Study Group: Effect of a perioperative, cardiac output-guided hemodynamic therapy algorithm on outcomes fol-lowing major gastrointestinal surgery: A randomized clinical trial and systematic review. JAMA 2014; 311: 2181–90
22. Ebm C, Cecconi M, Sutton L, Rhodes A: A cost-effec-tiveness analysis of postoperative goal-directed therapy for high-risk surgical patients. Crit Care Med 2014; 42:1194–203
23. Benes J, Chytra I, Altmann P, Hluchy M, Kasal E, Svitak R, Pradl R, Stepan M: Intraoperative fluid optimiza-tion using stroke volume variation in high risk surgical patients: Results of prospective randomized study. Crit Care 2010; 14:R118
24. Bennett-Guerrero E, Welsby I, Dunn TJ, Young LR, Wahl TA, Diers TL, Phillips-Bute BG, Newman MF, Mythen MG: The use of a postoperative morbidity survey to evaluate patients with prolonged hospital-ization after routine, moderate-risk, elective surgery. Anesth Analg 1999; 89:514–9
25. Grocott MP, Browne JP, Van der Meulen J, Matejowsky C, Mutch M, Hamilton MA, Levett DZ, Emberton M, Haddad FS, Mythen MG: The Postoperative Morbidity Survey was validated and used to describe morbid-ity after major surgery. J Clin Epidemiol 2007; 60: 919–28
26. Reinhart K, Perner A, Sprung CL, Jaeschke R, Schortgen F, Johan Groeneveld AB, Beale R, Hartog CS; European Society of Intensive Care Medicine: Consensus statement of the ESICM task force on col-loid volume therapy in critically ill patients. Intensive Care Med 2012; 38:368–83
27. Kancir AS, Pleckaitiene L, Hansen TB, Ekeløf NP, Pedersen EB: Lack of nephrotoxicity by 6% hydroxyethyl starch 130/0.4 during hip arthroplasty: A randomized controlled trial. Anesthesiology 2014; 121:948–58
28. Raiman M, Mitchell CG, Biccard BM, Rodseth RN: Comparison of hydroxyethyl starch colloids with crys-talloids for surgical patients: A systematic review and meta-analysis. Eur J Anaesthesiol 2016; 33:42–8
29. Gillies MA, Habicher M, Jhanji S, Sander M, Mythen M, Hamilton M, Pearse RM: Incidence of postoper-ative death and acute kidney injury associated with i.v. 6% hydroxyethyl starch use: Systematic review and meta-analysis. Br J Anaesth 2014; 112:25–34
30. Yates DR, Davies SJ, Milner HE, Wilson RJ: Crystalloid or colloid for goal-directed fluid therapy in colorectal surgery. Br J Anaesth 2014; 112:281–9
31. Joosten A, Delaporte A, Ickx B, Touihri K, Stany I, Barvais L, Van Obbergh L, Loi P, Rinehart J, Cannesson M, Van der Linden P: Crystalloid versus colloid for intra-operative goal-directed fluid therapy using a closed-loop system: A randomized, double-blinded, controlled trial in major abdominal surgery. Anesthesiology 2018; 128:55–66
32. Feldheiser A, Pavlova V, Bonomo T, Jones A, Fotopoulou C, Sehouli J, Wernecke KD, Spies C: Balanced crystal-loid compared with balanced colloid solution using a goal-directed haemodynamic algorithm. Br J Anaesth 2013; 110:231–40
33. Sessler DI, Meyhoff CS, Zimmerman NM, Mao G, Leslie K, Vásquez SM, Balaji P, Alvarez-Garcia J, Cavalcanti AB, Parlow JL, Rahate PV, Seeberger MD, Gossetti B, Walker SA, Premchand RK, Dahl RM, Duceppe E, Rodseth R, Botto F, Devereaux PJ: Period-dependent associations between hypotension during and for four days after noncardiac surgery and a composite of myocardial infarction and death: A sub-study of the POISE-2 trial. Anesthesiology 2018; 128:317–27
34. NICE: CardioQ-ODM oesophageal Doppler monitor. Medical Technologies Guidance [MTG3], 2011
35. Senagore AJ, Emery T, Luchtefeld M, Kim D, Dujovny N, Hoedema R: Fluid management for laparoscopic colectomy: A prospective, randomized assessment of goal-directed administration of bal-anced salt solution or hetastarch coupled with an enhanced recovery program. Dis Colon Rectum 2009; 52:1935–40
36. Gan TJ, Soppitt A, Maroof M, el-Moalem H, Robertson KM, Moretti E, Dwane P, Glass PS: Goal-directed intraoperative fluid administration reduces length of hospital stay after major surgery. Anesthesiology 2002; 97:820–6
37. Giglio MT, Marucci M, Testini M, Brienza N: Goal-directed haemodynamic therapy and gastrointesti-nal complications in major surgery: A meta-analysis of randomized controlled trials. Br J Anaesth 2009; 103:637–46
38. Rahbari NN, Zimmermann JB, Schmidt T, Koch M, Weigand MA, Weitz J: Meta-analysis of standard, restrictive and supplemental fluid administration in colorectal surgery. Br J Surg 2009; 96:331–41
39. Phillips CR, Vinecore K, Hagg DS, Sawai RS, Differding JA, Watters JM, Schreiber MA: Resuscitation of haem-orrhagic shock with normal saline vs. lactated Ringer’s: Effects on oxygenation, extravascular lung water and haemodynamics. Crit Care 2009; 13:R30
40. Scheingraber S, Rehm M, Sehmisch C, Finsterer U: Rapid saline infusion produces hyperchloremic aci-dosis in patients undergoing gynecologic surgery. Anesthesiology 1999; 90:1265–70
Copyright © 2019, the American Society of Anesthesiologists, Inc. Wolters Kluwer Health, Inc. Unauthorized reproduction of this article is prohibited.
Dow
nloaded from http://pubs.asahq.org/anesthesiology/article-pdf/130/5/728/390636/20190500_0-00018.pdf by guest on 20 July 2021
Anesthesiology 2019; 130:728–44 739
Crystalloid versus Colloid
Kabon et al.
41. Shaw AD, Kellum JA: The risk of AKI in patients treated with intravenous solutions containing hydroxyethyl starch. Clin J Am Soc Nephrol 2013; 8:497–503
42. Mitra S, Khandelwal P: Are all colloids same?: How to select the right colloid. Indian J Anaesth 2009; 53:592–607
43. Niemi TT, Miyashita R, Yamakage M: Colloid solutions: A clinical update. J Anesth 2010; 24:913–25
44. Alphonsus CS, Rodseth RN: The endothelial glycoca-lyx: A review of the vascular barrier. Anaesthesia 2014; 69:777–84
Copyright © 2019, the American Society of Anesthesiologists, Inc. Wolters Kluwer Health, Inc. Unauthorized reproduction of this article is prohibited.
Dow
nloaded from http://pubs.asahq.org/anesthesiology/article-pdf/130/5/728/390636/20190500_0-00018.pdf by guest on 20 July 2021
740 Anesthesiology 2019; 130:728–44 Kabon et al.
PerioPerative Medicine
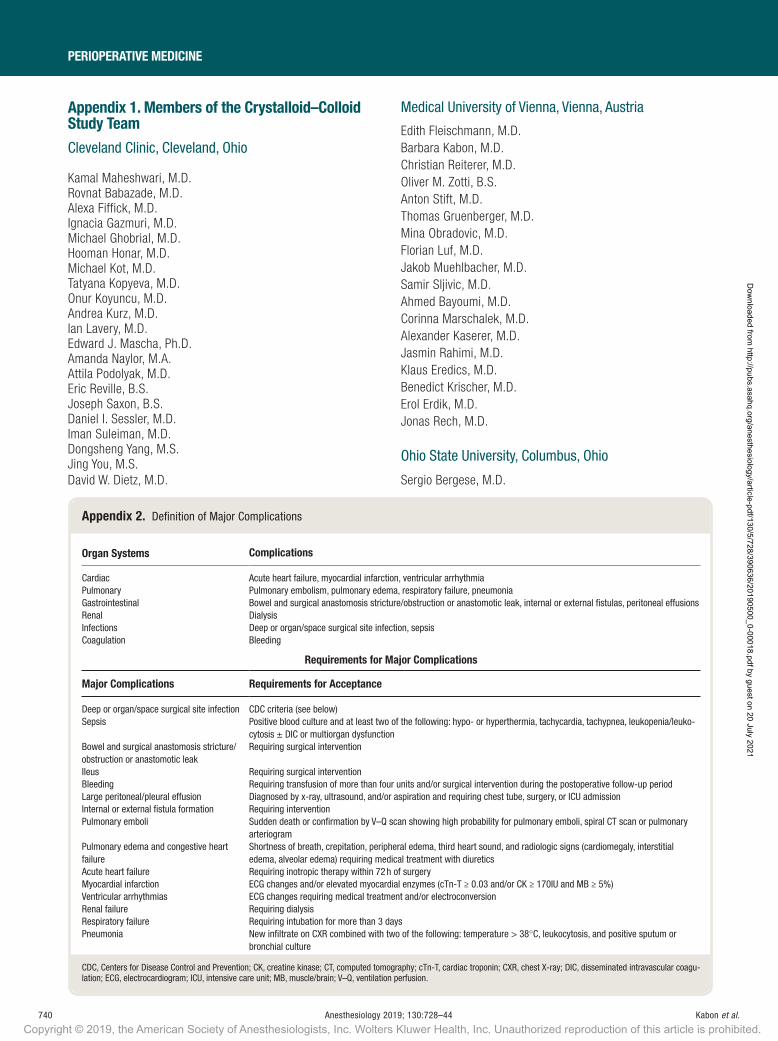
appendix 2. Definition of Major Complications
organ Systems complications
Cardiac Acute heart failure, myocardial infarction, ventricular arrhythmiaPulmonary Pulmonary embolism, pulmonary edema, respiratory failure, pneumoniaGastrointestinal Bowel and surgical anastomosis stricture/obstruction or anastomotic leak, internal or external fistulas, peritoneal effusionsRenal DialysisInfections Deep or organ/space surgical site infection, sepsisCoagulation Bleeding
requirements for Major complications
Major complications requirements for acceptance
Deep or organ/space surgical site infection CDC criteria (see below)Sepsis Positive blood culture and at least two of the following: hypo- or hyperthermia, tachycardia, tachypnea, leukopenia/leuko-
cytosis ± DIC or multiorgan dysfunctionBowel and surgical anastomosis stricture/obstruction or anastomotic leak
Requiring surgical intervention
Ileus Requiring surgical interventionBleeding Requiring transfusion of more than four units and/or surgical intervention during the postoperative follow-up periodLarge peritoneal/pleural effusion Diagnosed by x-ray, ultrasound, and/or aspiration and requiring chest tube, surgery, or ICU admissionInternal or external fistula formation Requiring interventionPulmonary emboli Sudden death or confirmation by V–Q scan showing high probability for pulmonary emboli, spiral CT scan or pulmonary
arteriogramPulmonary edema and congestive heart failure
Shortness of breath, crepitation, peripheral edema, third heart sound, and radiologic signs (cardiomegaly, interstitial edema, alveolar edema) requiring medical treatment with diuretics
Acute heart failure Requiring inotropic therapy within 72 h of surgeryMyocardial infarction ECG changes and/or elevated myocardial enzymes (cTn-T ≥ 0.03 and/or CK ≥ 170IU and MB ≥ 5%)Ventricular arrhythmias ECG changes requiring medical treatment and/or electroconversionRenal failure Requiring dialysisRespiratory failure Requiring intubation for more than 3 daysPneumonia New infiltrate on CXR combined with two of the following: temperature > 38°C, leukocytosis, and positive sputum or
bronchial culture
CDC, Centers for Disease Control and Prevention; CK, creatine kinase; CT, computed tomography; cTn-T, cardiac troponin; CXR, chest X-ray; DIC, disseminated intravascular coagu-lation; ECG, electrocardiogram; ICU, intensive care unit; MB, muscle/brain; V–Q, ventilation perfusion.
appendix 1. Members of the crystalloid–colloid Study team
Cleveland Clinic, Cleveland, Ohio
Kamal Maheshwari, M.D.Rovnat Babazade, M.D.Alexa Fiffick, M.D.Ignacia Gazmuri, M.D.Michael Ghobrial, M.D.Hooman Honar, M.D.Michael Kot, M.D.Tatyana Kopyeva, M.D.Onur Koyuncu, M.D.Andrea Kurz, M.D.Ian Lavery, M.D.Edward J. Mascha, Ph.D.Amanda Naylor, M.A.Attila Podolyak, M.D.Eric Reville, B.S.Joseph Saxon, B.S.Daniel I. Sessler, M.D.Iman Suleiman, M.D.Dongsheng Yang, M.S.Jing You, M.S.David W. Dietz, M.D.
Medical University of Vienna, Vienna, Austria
Edith Fleischmann, M.D.Barbara Kabon, M.D.Christian Reiterer, M.D.Oliver M. Zotti, B.S.Anton Stift, M.D.Thomas Gruenberger, M.D.Mina Obradovic, M.D.Florian Luf, M.D.Jakob Muehlbacher, M.D.Samir Sljivic, M.D.Ahmed Bayoumi, M.D.Corinna Marschalek, M.D.Alexander Kaserer, M.D.Jasmin Rahimi, M.D.Klaus Eredics, M.D.Benedict Krischer, M.D.Erol Erdik, M.D.Jonas Rech, M.D.
Ohio State University, Columbus, Ohio
Sergio Bergese, M.D.
Copyright © 2019, the American Society of Anesthesiologists, Inc. Wolters Kluwer Health, Inc. Unauthorized reproduction of this article is prohibited.
Dow
nloaded from http://pubs.asahq.org/anesthesiology/article-pdf/130/5/728/390636/20190500_0-00018.pdf by guest on 20 July 2021
Anesthesiology 2019; 130:728–44 741
Crystalloid versus Colloid
Kabon et al.
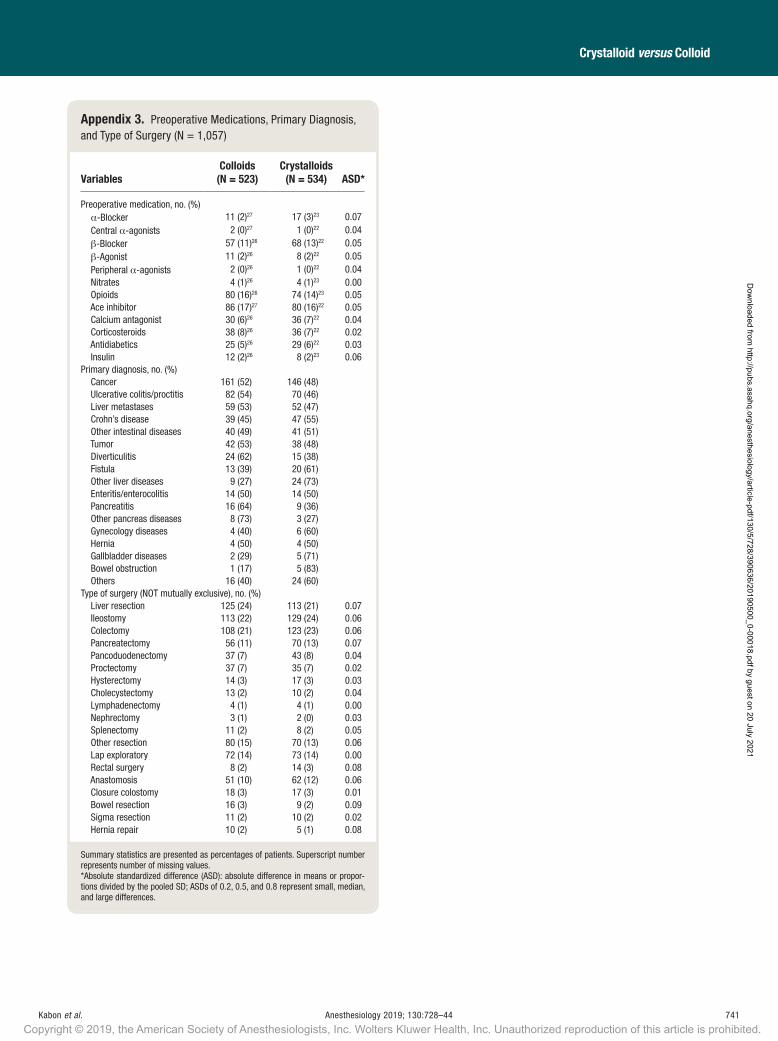
appendix 3. Preoperative Medications, Primary Diagnosis, and Type of Surgery (N = 1,057)
variablescolloids
(n = 523)crystalloids
(n = 534) aSd*
Preoperative medication, no. (%) α-Blocker 11 (2)27 17 (3)23 0.07 Central α-agonists 2 (0)27 1 (0)22 0.04 β-Blocker 57 (11)26 68 (13)22 0.05 β-Agonist 11 (2)26 8 (2)22 0.05 Peripheral α-agonists 2 (0)26 1 (0)22 0.04 Nitrates 4 (1)26 4 (1)23 0.00 Opioids 80 (16)26 74 (14)23 0.05 Ace inhibitor 86 (17)27 80 (16)22 0.05 Calcium antagonist 30 (6)26 36 (7)22 0.04 Corticosteroids 38 (8)26 36 (7)22 0.02 Antidiabetics 25 (5)26 29 (6)22 0.03 Insulin 12 (2)26 8 (2)23 0.06Primary diagnosis, no. (%) Cancer 161 (52) 146 (48) Ulcerative colitis/proctitis 82 (54) 70 (46) Liver metastases 59 (53) 52 (47) Crohn’s disease 39 (45) 47 (55) Other intestinal diseases 40 (49) 41 (51) Tumor 42 (53) 38 (48) Diverticulitis 24 (62) 15 (38) Fistula 13 (39) 20 (61) Other liver diseases 9 (27) 24 (73) Enteritis/enterocolitis 14 (50) 14 (50) Pancreatitis 16 (64) 9 (36) Other pancreas diseases 8 (73) 3 (27) Gynecology diseases 4 (40) 6 (60) Hernia 4 (50) 4 (50) Gallbladder diseases 2 (29) 5 (71) Bowel obstruction 1 (17) 5 (83) Others 16 (40) 24 (60) Type of surgery (NOT mutually exclusive), no. (%) Liver resection 125 (24) 113 (21) 0.07 Ileostomy 113 (22) 129 (24) 0.06 Colectomy 108 (21) 123 (23) 0.06 Pancreatectomy 56 (11) 70 (13) 0.07 Pancoduodenectomy 37 (7) 43 (8) 0.04 Proctectomy 37 (7) 35 (7) 0.02 Hysterectomy 14 (3) 17 (3) 0.03 Cholecystectomy 13 (2) 10 (2) 0.04 Lymphadenectomy 4 (1) 4 (1) 0.00 Nephrectomy 3 (1) 2 (0) 0.03 Splenectomy 11 (2) 8 (2) 0.05 Other resection 80 (15) 70 (13) 0.06 Lap exploratory 72 (14) 73 (14) 0.00 Rectal surgery 8 (2) 14 (3) 0.08 Anastomosis 51 (10) 62 (12) 0.06 Closure colostomy 18 (3) 17 (3) 0.01 Bowel resection 16 (3) 9 (2) 0.09 Sigma resection 11 (2) 10 (2) 0.02 Hernia repair 10 (2) 5 (1) 0.08
Summary statistics are presented as percentages of patients. Superscript number represents number of missing values.*Absolute standardized difference (ASD): absolute difference in means or propor-tions divided by the pooled SD; ASDs of 0.2, 0.5, and 0.8 represent small, median, and large differences.
Copyright © 2019, the American Society of Anesthesiologists, Inc. Wolters Kluwer Health, Inc. Unauthorized reproduction of this article is prohibited.
Dow
nloaded from http://pubs.asahq.org/anesthesiology/article-pdf/130/5/728/390636/20190500_0-00018.pdf by guest on 20 July 2021
742 Anesthesiology 2019; 130:728–44 Kabon et al.
PerioPerative Medicine
appendix 4. Incidence of Components of Postoperative Complications (N = 1,057)
Before discharge discharge to Pod 30 overall (30-day)
outcomecolloid
(n = 523)crystalloid (n = 534)
colloid (n = 508)*
crystalloid (n = 517)*
colloid (n = 523)
crystalloid (n = 534)
Major complications Cardiac 0 (0) 8 (2)2 1 (< 1)6 1 (< 1)9 1 (< 1)6 8 (2)10
Acute heart failure Myocardial infarction Ventricular arrhythmia Pulmonary 16 (3) 17 (3)2 1 (< 1)6 7 (1)9 17 (3)6 24 (5)10
Pulmonary embolism Pulmonary edema Respiratory failure Pneumonia Pulmonary pleural effusion Gastrointestinal 35 (7) 41 (8)2 6 (1)6 11 (2)9 41 (8)6 51 (10)10
Bowel and surgical anastomosis, stricture/obstruction or anastomotic leak
Internal or external fistulas Peritoneal effusions Renal (requiring dialysis) 2 (< 1) 2 (< 1)2 0 (0)6 2 (< 1)9 2 (< 1)6 4 (1)10
Infections 40 (8) 40 (8)2 22 (4)6 20 (4)9 59 (11)6 58 (11)10
Deep or organ/space surgical site infection Sepsis Coagulation (bleeding) 14 (3) 10 (2)2 2 (< 1)6 2 (< 1)9 16 (3)6 12 (2)10
Minor complications Unplanned ICU admission 20 (4) 33 (6)2 3 (1)6 3 (1)9 22 (4)6 36 (7)10
Minor unplanned operation 24 (5)16 18 (3)12 5 (1)21 5 (1)23 29 (6)28 23 (5)29
Cardiac 32 (6) 45 (8)2 4 (1)100 2 (< 1)101 35 (8)95 46 (10)94
Ischemia Nonventricular Arrhythmia Hemodynamic disturbances Pulmonary effusion 35 (7)11 44 (8)9 4 (1)6 4 (1)9 38 (8)17 46 (9)17
Deep venous thrombosis 2 (< 1) 2 (< 1)2 0 (0)6 6 (1)10 2 (< 1)6 7 (1)11
Gastrointestinal 65 (12) 94 (18)2 12 (2)6 11 (2)9 75 (15)6 103 (20)10
Effusion Gut paralysis Progressive renal insufficiency 2 (< 1) 4 (1)2 2 (< 1)6 3 (1)9 4 (1)6 7 (1)10
Infection 100 (19)1 122 (23)2 46 (9)6 40 (8)9 139 (27)6 151 (29)10
Superficial Fever Cystitis or urinary tract infection Transient neurologic 3 (1) 7 (1)2 0 (0)6 1 (< 1)9 3 (1)6 8 (2)10
Any major morbidity 70 (13) 76 (14)2 28 (6)6 33 (7)9 91 (18)6 103 (20)10
Any minor morbidity 173(34)11 202 (38)6 59 (15)102 58 (14)103 214 (48)76 234 (51)71
Superscript numbers represent the number of missing values. Pulmonary pleural effusion was not asked on the old version of the case report form for 22 and 23 patients at discharge and 30-day follow-up, respectively. We assumed that those patients did not have pulmonary pleural effusion given the evidence that they did not have other pulmonary complications. Unplanned operation was not asked on the old version of the case report form for 22 and 17 patients at discharge and 30-day follow-up, respectively. Those were reported as missing in the above table.*In total, 15 patients in crystalloid group and 17 patients in the colloid group died during hospital stays < 30 days or stayed in hospital for > 30 days; therefore, the 30-day follow-up was not done.ICU, intensive care unit; POD, postoperative day.
Copyright © 2019, the American Society of Anesthesiologists, Inc. Wolters Kluwer Health, Inc. Unauthorized reproduction of this article is prohibited.
Dow
nloaded from http://pubs.asahq.org/anesthesiology/article-pdf/130/5/728/390636/20190500_0-00018.pdf by guest on 20 July 2021
Anesthesiology 2019; 130:728–44 743
Crystalloid versus Colloid
Kabon et al.
appendix 6. Box Plots of Maximum Postoperative Serum creatinine concentrations from Postoperative days 1 to 14
Bottoms and tops of the boxes are 25th and 75th percentiles, the middle line is the median, and the whiskers extend to the smaller of the end of the data (minimum or maximum) or 1.5 interquartile ranges beyond the top or bottom of box. Creatinine values between 0.5 and 1.4 mg/dl are generally considered to be in the normal range.
appendix 5. Summary of Preoperative and Serum Creatinine Concentrations from Postoperative Days 1 to 14
creatinine (mg/dl) ncolloids (n = 523) n
crystalloids (n = 534)
Preoperative 520 0.85 [0.73, 0.97] 527 0.83 [0.73, 0.94]Maximum postoperative
before discharge521 0.83 [0.71, 1.00] 527 0.85 [0.71, 1.00]
POD 1 476 0.79 [0.67, 0.94] 493 0.77 [0.66,0.92]POD 2 437 0.74 [0.62, 0.90] 431 0.75 [0.63, 0.87]POD 3 341 0.75 [0.61, 0.88] 373 0.73 [0.60, 0.85]POD 4 316 0.73 [0.61, 0.88] 341 0.74 [0.60, 0.86]POD 5 259 0.72 [0.61, 0.86] 263 0.74 [0.62, 0.87]POD 6 195 0.75 [0.61, 0.88] 204 0.76 [0.64, 0.91]POD 7 170 0.74 [0.59, 0.88] 175 0.75 [0.62, 0.88]POD 8 115 0.76 [0.65, 0.92] 110 0.75 [0.62, 0.92]POD 9 101 0.78 [0.64, 0.92] 95 0.77 [0.66, 0.96]POD 10 89 0.76 [0.61, 0.97] 99 0.75 [0.63, 1.00]POD 11 64 0.76 [0.62, 0.92] 76 0.74 [0.62, 0.88]POD 12 65 0.75 [0.62, 0.93] 52 0.77 [0.65, 0.94]POD 13 43 0.82 [0.56, 0.96] 59 0.71 [0.59, 0.82]POD 14 45 0.82 [0.66, 0.96] 45 0.72 [0.63, 0.92]
Numbers in brackets indicate range. POD, postoperative day.
appendix 7. Summary of Preoperative and Maximum Serum Creatinine Concentrations within Each Month after Surgery
creatinine (mg/dl) ncolloids (n = 523) n
crystalloids (n = 534)
Preoperative 520 0.85 [0.73, 0.97] 527 0.83 [0.73, 0.94]Maximum postoperative
within 6 months521 0.87 [0.73, 1.06] 529 0.87 [0.75, 1.05]
Within 1 month 521 0.85 [0.72, 1.01] 529 0.85 [0.72, 1.02]1 to 2 months 152 0.84 [0.72, 1.04] 177 0.84 [0.73, 0.96]2 to 3 months 71 0.78 [0.70, 1.04] 87 0.80 [0.70, 0.93]3 to 4 months 34 0.83 [0.75, 0.98] 44 0.78 [0.72, 0.93]4 to 5 months 21 0.83 [0.72, 0.94] 18 0.71 [0.63, 0.79]5 to 6 months 12 0.84 [0.73, 1.00] 3 0.62 [0.54, 0.73]
The data are number of patients (n) and median [quartile 1, quartile 3].
appendix 8. Box Plots of Maximum Postoperative Serum creatinine concentrations from Postoperative Months 1 to 6
Bottoms and tops of boxes are 25th and 75th percentiles, the middle line is the median, and the whiskers extend to the smaller of the end of the data (minimum or maximum) or 1.5 interquartile ranges beyond the top or bottom of box. Creatinine values between 0.5 and 1.4 mg/dl are generally considered to be in the normal range. Sample size for each period for colloids and crystalloids is as follows (see appen-dix 7): surgery to 1 month (521, 529), 1 to 2 months (152, 177), 2 to 3 months (71, 87), 3 to 4 months (34, 44), 4 to 5 months (21, 18), and 5 to 6 months (12, 3).
Copyright © 2019, the American Society of Anesthesiologists, Inc. Wolters Kluwer Health, Inc. Unauthorized reproduction of this article is prohibited.
Dow
nloaded from http://pubs.asahq.org/anesthesiology/article-pdf/130/5/728/390636/20190500_0-00018.pdf by guest on 20 July 2021
744 Anesthesiology 2019; 130:728–44 Kabon et al.
PerioPerative Medicine
appendix 9-1. Baseline and Intraoperative Characteristics before the Protocol Was Changed on March 2, 2011 (N = 259)
variablescolloids (n = 128)
crystalloids (n = 131) aSd*
Age, yr 55.1 ± 14.1 56.2 ± 12.8 0.08Body mass index, kg/m2 25.7 ± 4.8 29.6 ± 45.6 0.12Female, no. (%) 57 (45) 70 (53) 0.18ASA physical status, no. (%) 0.21 I 30 (23) 25 (19) II 80 (63) 94 (72) III 18 (14) 12 (9) Race (white), no. (%) 126 (98) 130 (99) 0.08Medical history, no. (%) Pulmonary disease 7 (6)4 7 (6)6 0.002 Cardiovascular disease 44 (35)2 47 (36)2 0.03 Neurologic disease 7 (6)20 4 (4)17 0.14 Diabetes 11 (10)20 14 (12)16 Insulin use 2 (2)21 0 (0)19 0.20 History of PONV 14 (11) 13 (10) 0.03 Alcohol (more than 25
drinks per week)0 (0)48 2 (2)42 0.21
Smoking status 0.02 No 43 (64)61 47 (64)57 Yes, currently 18 (27) 20 (27) Yes, quit 6 (9) 7 (9) Preoperative bowel preparation 0.13 Home 1 (1) 0 (0) Hospital 37 (29) 36 (27) None 90 (70) 95 (73) Preoperative lab Creatinine, mg/dl 0.9 [0.8, 1.0] 0.9 [0.8, 0.9] 0.27 Albumin, g/dl 4.6 [4.0, 43.1]7 4.5 [3.9, 42.5]10 0.05 Hemoglobin, gm/dl 13.4 ± 2.8 13.3 ± 2.2 0.05 Hematocrit, % 39.1 ± 4.2 39.2 ± 4.0 0.03 Normotest/PT, s 114.5 [98, 130] 113 [97, 131]1 0.01 APTT STA, s 35.2 [32.7, 37.9] 35.0 [32.1, 37.6]2 0.12 Preoperative IV fluid per
weight, ml/kg6.7 [5.8, 7.9] 6.8 [6.1, 7.9] 0.11
Intraoperative variables Duration of anesthesia, h 4.6 [3.5, 5.7] 4.8 [4.0, 5.9] 0.17 Duration of surgery, h 3.7 [2.7, 4.7] 3.8 [3.0, 5.0] 0.16 Crystalloid, l 1.5 [1, 2] 3.1 [2.2, 4.4] 1.26 Colloid, l 1 [0.5, 1.5] 0.0 [0.0, 0.0] 4.78 Number of boluses 4.0 [2.0, 5.5] 6.0 [3.0, 10.0] 0.61 Blood given, ml 0.0 [0.0, 0.0] 0.0 [0.0, 0.0] 0.30 Estimated blood lost, ml 300 [200, 625] 300 [200, 500]1 0.11 Estimated urine output, ml 300 [200, 445] 300 [170, 500] 0.08 Other fluids, ml 350 [200, 450] 400 [300, 500] 0.26 Net fluids, l 2.46 [1.85, 3.3] 3.2 [2.1, 4.3] 0.51 TWA MAP, mmHg 76.4 ± 8.334 74.6 ± 9.034 0.21 End-tidal Pco2, % 34.2 ± 3.334 33.5 ± 3.234 0.20 Final intraoperative core
temperature, °C37.0 ± 4.335 36.6 ± 0.635 0.13
TWA Fio2, % 79.4 ± 1.834 79.4 ± 3.434 0.01 MAC Hours 0.7 ± 0.534 0.7 ± 0.434 0.07 Phenylephrine, mg 0.0 [0.0, 0.4] 0.1 [0.0, 0.6] 0.27
Summary statistics are presented as percentages of patients, means ± SD, or medians [quartile 1, quartile 3], respectively. Superscript numbers represent num-ber of missing values.*Absolute standardized difference: absolute difference in means or proportions divided by the pooled SD; ASD of 0.2, 0.5, and 0.8 represent small, median, and large differences.APTT, partial thromboplastine time; ASA, American Society of Anesthesiologists; ASD, absolute standardized difference; Fio2, fraction inspired oxygen concentration; MAC, min-imum alveolar concentration, a measure of anesthetic dose; MAP, mean arterial pressure; Pco2, end-tidal partial pressure of carbon dioxide; PONV, postoperative nausea and vomit-ing; PT, prothrommbin time; ST, ST-segment; TWA, time weighted average.
appendix 9-2. Baseline and Intraoperative Characteristics after the Protocol Was Changed on March 2, 2011 (N = 798)
variablescolloids (n = 395)
crystalloids (n = 403) aSd*
Age, yr 50.3 ± 15.8 50.5 ± 16.2 0.01Body mass index, kg/m2 25.8 [22.3, 29.4] 25.6 [22.4, 29.0] 0.01Female, no. (%) 185 (47) 198 (49) 0.04ASA physical status, no. (%) 0.06 I 24 (6)7 21 (5)1 II 220 (57) 222 (55) III 144 (37) 159 (40) Race (white), no. (%) 369 (93) 378 (94) 0.02Medical history, no. (%) Pulmonary disease 34 (9)5 31 (8)7 0.03 Cardiovascular disease 98 (25)1 114 (28) 0.08 Neurologic disease 18 (5) 19 (5) 0.01 Diabetes 29 (7)1 24 (6) 0.06 Insulin use 9 (2) 7 (2)1 0.04 History of PONV 29 (7)1 35 (9)1 0.05 Alcohol (more than 25 drinks
per week)24 (6)1 27 (7)1 0.03
Smoking status 0.13 No 228 (58)1 252 (63) Yes, currently 77 (20) 80 (20) Yes, quit 89 (23) 70 (17) Preoperative bowel preparation 0.03 Home 52 (13)4 56 (14)1 Hospital 78 (20) 76 (19) None 261 (67) 270 (67) Preoperative lab Creatinine, mg/dl 0.8 [0.7, 1.0]3 0.8 [0.7, 0.9]7 0.00 Albumin, g/dl 4.3 [4.0, 4.7]92 4.3 [4.0, 4.7]103 0.03 Hemoglobin, gm/dl 39.5 ± 5.43 39.4 ± 5.41 0.02 Hematocrit, % 40.1 [37.5, 42.7]3 39.7 [36.8, 42.9]1 0.05 Normotest/PT, s 89.1 [12.9, 110]230 88.5 [15.3, 105]245 0.04 APTT STA, s 32.6 [29.0, 35.7]230 32.3 [29.8, 34.7]237 0.09 Preoperative IV fluid per
weight, ml/kg5.7 [0.0, 7.5]26 5.6 [0.0, 7.8]28 0.01
Intraoperative variables Duration of anesthesia, h 4.4 [3.3, 5.7] 4.4 [3.4, 5.6] 0.04 Duration of surgery, h 3.2 [2.3, 4.4] 3.2 [2.3, 4.6] 0.06 Crystalloid, l 1.85 [1.25, 2.4] 3.3 [2.33, 4.39] 0.61 Colloid, l 1. 0 [0.5, 1.5]2 0.0 [0.0, 0.0]10 2.01 Number of boluses 4.0 [2.0, 6.0] 5.0 [2.0, 8.0] 0.38 Blood given, ml 0 [0, 0]8 0 [0, 0]10 0.00 Estimated blood lost, ml 237 [100, 500]1 200.0 [100, 450] 0.03 Estimated urine output, ml 340 [190, 550]4 350 [200, 500]6 0.03 Other fluids, ml 0 [0, 350]36 0 [0, 450]40 0.03 Net fluids, l 2.68 [1.87, 3.55] 3.2 [2.28, 4.38] 0.37 TWA MAP, mmHg 80.7 ± 8.5 81.3 ± 8.5 0.07 End-tidal Pco2, % 34.7 ± 2.11 34.4 ± 2.01 0.16 Final intraoperative core
temperature, °C36.7 ± 3.1 36.7 ± 3.111 0.03
TWA Fio2, % 65.4 ± 1 65.9 ± 21.71 0.02 MAC, h 2.6 ± 2.83 2.5 ± 2.02 0.03 Phenylephrine, mg 0.1 [0.0, 0.4] 0.1 [0.0, 0.6] 0.12
Summary statistics are presented as percentages of patients, means ± SD, or medians [quartile 1, quartile 3], respectively. Superscript numbers represents num-ber of missing values.*Absolute standardized difference: absolute difference in means or proportions divided by the pooled SD; ASD of 0.2, 0.5, and 0.8 represent small, median, and large differences.APTT, partial thromboplastine time; ASA, American Society of Anesthesiologists; ASD, absolute standardized difference; Fio2, fraction inspired oxygen concentration; MAC, minimum alveolar concentration, a measure of anesthetic dose; MAP, mean arterial pressure; Pco2, end-tidal partial pressure of carbon dioxide; PONV, postoperative nausea and vomiting; PT, prothrommbin time; ST, ST-segment; TWA, time weighted average.
Copyright © 2019, the American Society of Anesthesiologists, Inc. Wolters Kluwer Health, Inc. Unauthorized reproduction of this article is prohibited.
Dow
nloaded from http://pubs.asahq.org/anesthesiology/article-pdf/130/5/728/390636/20190500_0-00018.pdf by guest on 20 July 2021