Effect of Indoleacetic Acid- andFusicoccin-Stimulated ... · (cf. Ref. 31). Achangeof0.1 pHunit...
6
Plant Physiol. (1988) 87, 211-216 0032-0889/88/87/0211/06/$01 .00/0 Effect of Indoleacetic Acid- and Fusicoccin-Stimulated Proton Extrusion on Internal pH of Pea Internode Cells' Received for publication September 28, 1987 and in revised form February 5, 1988 LAWRENCE D. TALBOTT, PETER M. RAY*, AND JUSTIN K. M. ROBERTS Department of Biological Sciences, Stanford University, Stanford, California 94305 (L.D.T., P.M.R.); and Department of Biochemistry, University of California, Riverside, California 92521 (J.K.M.R.) ABSTRACT Using 31P nuclear magnetic resonance spectroscopy, we followed cy- toplasmic and vacuolar pH in pea (Pisum sativum cv Alaska) internode segments during treatment with indoleacetic acid (IAA) or fusicoccin (FC) in continuously perfused, oxygenated buffer. Although IAA and FC in- duced normal HI extrusion, elongation, and glucan synthase activity responses during the measurements, neither the cytoplasmic nor the vac- uolar pH showed significant change at any time between 5 minutes and 1 to 3 hours of treatment. Changes in cytoplasmic pH as small as about 0.04 pH unit were detected after treatment with 1-naphthyl acetate. There- fore, cytoplasmic pH changes do not appear to mediate IAA or FC stim- ulation of H+ extrusion or other metabolic responses to these effectors. For animal and microbial cells, considerable interest is cur- rently directed at changes in cytoplasmic pH as a mediator of regulatory signaling. In plants, decrease in pH,yt2 appears to mediate metabolic responses to hypoxia (29, 33). Conflicting proposals have been advanced about the role of pH,yt in re- sponses to the plant growth regulators, auxin and fusicoccin. One view is that FC- or auxin-induced H + extrusion causes an increase in pH,t which stimulates organic acid synthesis (21, 22, 34, 37) and allows FC to counteract responses to permeant acids (34, 42). It seems possible that such an increase in pHcyt also stim- ulates polysaccharide synthase activity and cell wall synthesis (3, 5, 25) and activates gene expression (39). A contrasting proposal is that the primary action of FC (1, 15) and auxin (4, 8, 10, 11) is to cause cytoplasmic acidification, which stimulates a pH-sen- sitive H+ efflux pump and thereby induces H+ extrusion. The direct evidence for the cytoplasmic acidification hypoth- esis is from measurements on absorbed dyes and with micro-pH electrodes, yielding data that are interpreted as indicating a small drop in pHcyt soon after exposure of cells to FC or IAA. These measurements are liable to errors in location and interpretation and are invasive. 31P NMR affords an alternative means of meas- 1 The Bruker HXS 360 at the Stanford Magnetic Resonance Labo- ratory was supported by National Science Foundation grant GP23633 and National Institutes of Health grant RROO711. The GN 500 at UCR was supported by NSF grants DMB 85-21564 and DMB 86-04091, De- partment of Energy grant FG03-86FR13535, and National Institutes of Health grant PMS BRSG 2507. This work was also supported in part by a National Science Foundation grant to P. M. R. 2Abbreviations: pH,Yt cytoplasmic pH; FC, fusicoccin; GS, Golgi- localized UDP-glucose:,8-1,4-glucan glucosyl transferase (glucan syn- thase I); MDP, methylene diphosphonic acid; NA, 1-naphthyl acetate; Pi, inorganic phosphate. uring pH,yt that is noninvasive and is unaffected by most of the sources of uncertainty in the previously mentioned methods. Improvements in technique now permit 31P NMR to be applied to highly vacuolate auxin-sensitive cells such as those in pea internodes, using signals from endogenously occurring phosphate compounds. We have used this technique to test the above men- tioned hypotheses for mediation of auxin or FC responses by pHcyt in pea internodes. MATERIALS AND METHODS Pisum sativum cv Alaska seedlings were grown in the dark for 7 to 8 d in moist vermiculite. A segment 8 mm long was cut from the third internode of each seedling as described previously (24). For high-resolution measurements of proton extrusion (Fig. 3), the third internode's cuticle was abraded by rubbing gently with an aqueous suspension of No. 305 emery powder (Edmund Sci- entific, Barrington, NJ) before cutting the segment. For NMR measurements, about 150 segments were loaded into a 12 mm diameter NMR tube, open at both ends, in 5 layers of about 30 segments each. During the measurement, the segments were perfused, in a recirculating arrangement, with a continu- ously oxygenated 1 mm MES buffer, initial pH 6.5, containing 1 mM KCI and 15 mM sucrose, at a flow rate of about 20 ml/ min. After recording initial NMR spectra, IAA, FC, or NA was added from a stock solution to give the indicated concentration. NMR spectra were initially measured with a modified Bruker HXS 360 spectrometer operating at 145 MHz in the Fourier transform mode. Chemical shifts were measured with respect to 0.5 M MDP located in a co-axial capillary tube. Segments were equilibrated in the spectrometer and an initial spectrum was accumulated for 15 min, after which growth substances were added to treated samples, and spectra were recorded for an additional 1 to 3 h. The pH of the buffer solution was checked before and after each experiment. This check showed that FC and IAA did induce H+ extrusion from pea segments in the NMR spectrometer. In later experiments, high-resolution spectra were obtained using a General Electric GN 500 NMR system operating at 202 MHz. The -y-phosphate group of tissue ATP (peak 4, Fig. 1), whose chemical shift (- 21.45 ppm relative to MDP) is insensitive to pH changes above pH 7.0, was used as an internal reference peak for these spectra. Six 5 min spectra were accumulated, after which either IAA or NA was added, and spectra were accu- mulated for an additional 30 min. NMR measurements were made in an air-conditioned room at 22 to 24°C, continuously perfusing the tissue sample from a reservoir containing 10 L or more of perfusion fluid which further buffered the sample against temperature changes. Typical spec- trometer parameters were pulse width 500, pulse interval 0.9 sec, spectral width + 3000 Hz, 8K data points, digital resolution about 0.008 ppm. A computerized data aquisition system generated the 211 www.plantphysiol.org on November 1, 2018 - Published by Downloaded from Copyright © 1988 American Society of Plant Biologists. All rights reserved.
Transcript of Effect of Indoleacetic Acid- andFusicoccin-Stimulated ... · (cf. Ref. 31). Achangeof0.1 pHunit...
Plant Physiol. (1988) 87, 211-2160032-0889/88/87/0211/06/$01 .00/0
Effect of Indoleacetic Acid- and Fusicoccin-Stimulated ProtonExtrusion on Internal pH of Pea Internode Cells'
Received for publication September 28, 1987 and in revised form February 5, 1988
LAWRENCE D. TALBOTT, PETER M. RAY*, AND JUSTIN K. M. ROBERTSDepartment of Biological Sciences, Stanford University, Stanford, California 94305 (L.D.T., P.M.R.);and Department of Biochemistry, University of California, Riverside, California 92521 (J.K.M.R.)
ABSTRACT
Using 31P nuclear magnetic resonance spectroscopy, we followed cy-toplasmic and vacuolar pH in pea (Pisum sativum cv Alaska) internodesegments during treatment with indoleacetic acid (IAA) or fusicoccin (FC)in continuously perfused, oxygenated buffer. Although IAA and FC in-duced normal HI extrusion, elongation, and glucan synthase activityresponses during the measurements, neither the cytoplasmic nor the vac-uolar pH showed significant change at any time between 5 minutes and1 to 3 hours of treatment. Changes in cytoplasmic pH as small as about0.04 pH unit were detected after treatment with 1-naphthyl acetate. There-fore, cytoplasmic pH changes do not appear to mediate IAA or FC stim-ulation of H+ extrusion or other metabolic responses to these effectors.
For animal and microbial cells, considerable interest is cur-rently directed at changes in cytoplasmic pH as a mediator ofregulatory signaling. In plants, decrease in pH,yt2 appears tomediate metabolic responses to hypoxia (29, 33). Conflictingproposals have been advanced about the role of pH,yt in re-sponses to the plant growth regulators, auxin and fusicoccin. Oneview is that FC- or auxin-inducedH + extrusion causes an increasein pH,t which stimulates organic acid synthesis (21, 22, 34, 37)and allows FC to counteract responses to permeant acids (34,42). It seems possible that such an increase in pHcyt also stim-ulates polysaccharide synthase activity and cell wall synthesis (3,5, 25) and activates gene expression (39). A contrasting proposalis that the primary action of FC (1, 15) and auxin (4, 8, 10, 11)is to cause cytoplasmic acidification, which stimulates a pH-sen-sitive H+ efflux pump and thereby induces H+ extrusion.The direct evidence for the cytoplasmic acidification hypoth-
esis is from measurements on absorbed dyes and with micro-pHelectrodes, yielding data that are interpreted as indicating a smalldrop in pHcyt soon after exposure of cells to FC or IAA. Thesemeasurements are liable to errors in location and interpretationand are invasive. 31P NMR affords an alternative means of meas-
1The Bruker HXS 360 at the Stanford Magnetic Resonance Labo-ratory was supported by National Science Foundation grant GP23633and National Institutes of Health grant RROO711. The GN 500 at UCRwas supported by NSF grants DMB 85-21564 and DMB 86-04091, De-partment of Energy grant FG03-86FR13535, and National Institutes ofHealth grant PMS BRSG 2507. This work was also supported in part bya National Science Foundation grant to P. M. R.
2Abbreviations: pH,Yt cytoplasmic pH; FC, fusicoccin; GS, Golgi-localized UDP-glucose:,8-1,4-glucan glucosyl transferase (glucan syn-thase I); MDP, methylene diphosphonic acid; NA, 1-naphthyl acetate;Pi, inorganic phosphate.
uring pH,yt that is noninvasive and is unaffected by most of thesources of uncertainty in the previously mentioned methods.Improvements in technique now permit 31P NMR to be appliedto highly vacuolate auxin-sensitive cells such as those in peainternodes, using signals from endogenously occurring phosphatecompounds. We have used this technique to test the above men-tioned hypotheses for mediation of auxin or FC responses bypHcyt in pea internodes.
MATERIALS AND METHODS
Pisum sativum cv Alaska seedlings were grown in the dark for7 to 8 d in moist vermiculite. A segment 8 mm long was cut fromthe third internode of each seedling as described previously (24).For high-resolution measurements of proton extrusion (Fig. 3),the third internode's cuticle was abraded by rubbing gently withan aqueous suspension of No. 305 emery powder (Edmund Sci-entific, Barrington, NJ) before cutting the segment.ForNMR measurements, about 150 segments were loaded into
a 12 mm diameter NMR tube, open at both ends, in 5 layers ofabout 30 segments each. During the measurement, the segmentswere perfused, in a recirculating arrangement, with a continu-ously oxygenated 1 mm MES buffer, initial pH 6.5, containing1 mM KCI and 15 mM sucrose, at a flow rate of about 20 ml/min. After recording initial NMR spectra, IAA, FC, or NA wasadded from a stock solution to give the indicated concentration.NMR spectra were initially measured with a modified Bruker
HXS 360 spectrometer operating at 145 MHz in the Fouriertransform mode. Chemical shifts were measured with respect to0.5 M MDP located in a co-axial capillary tube. Segments wereequilibrated in the spectrometer and an initial spectrum wasaccumulated for 15 min, after which growth substances wereadded to treated samples, and spectra were recorded for anadditional 1 to 3 h. The pH of the buffer solution was checkedbefore and after each experiment. This check showed that FCand IAA did induce H+ extrusion from pea segments in theNMR spectrometer.
In later experiments, high-resolution spectra were obtainedusing a General Electric GN 500 NMR system operating at 202MHz. The -y-phosphate group of tissue ATP (peak 4, Fig. 1),whose chemical shift (- 21.45 ppm relative to MDP) is insensitiveto pH changes above pH 7.0, was used as an internal referencepeak for these spectra. Six 5 min spectra were accumulated, afterwhich either IAA or NA was added, and spectra were accu-mulated for an additional 30 min.NMR measurements were made in an air-conditioned room
at 22 to 24°C, continuously perfusing the tissue sample from areservoir containing 10 L or more of perfusion fluid which furtherbuffered the sample against temperature changes. Typical spec-trometer parameters were pulse width 500, pulse interval 0.9 sec,spectral width + 3000 Hz, 8K data points, digital resolution about0.008 ppm. A computerized data aquisition system generated the
211 www.plantphysiol.orgon November 1, 2018 - Published by Downloaded from Copyright © 1988 American Society of Plant Biologists. All rights reserved.
Plant Physiol. Vol. 87, 1988
spectra and determined the chemical shift value for each peak.Chemical shifts are given to the 3 decimal places (0.001 ppm)displayed by this system. At the digital resolution employed, thethird place is only marginally significant, but is necessary in orderto fully reflect the resolution of the measurements which 2 dec-imal places would not do.
High-resolution measurements of proton extrusion were madewith a reduced-volume perfusion system (10 ml of perfusionmedium per 150 segments), using a semi-microcombination pHelectrode and pH meter (Beckman model 3500) inserted into a5 ml beaker, which received the buffer outflow from the NMRtube containing the segments. The contents of the beaker werecontinuously oxygenated and recirculated back through the NMRtube at about 20 ml/min with a peristaltic pump. The output ofthe pH meter was fed to a chart recorder.
l3-Glucan synthase (GS) assays were conducted on samples of30 segments according to the procedure of Ray (25), except thatonly 5 ml of homogenization medium was used. Walls from thelow-speed pellet (5 min, lOOOg) were rinsed but not reground,and the membrane pellet was obtained by centrifuging the com-bined low speed supernatants for 20 min at 40,000 rpm in a Spinco5OTi rotor at 0°C, and was resuspended in 400 AL of homoge-nization medium. The GS assay was performed as describedpreviously (25). Triplicate assays were run on each sample andthe results given are the averages of these replicates.
RESULTSIn an NMR spectrum, resonances from phosphorus-containing
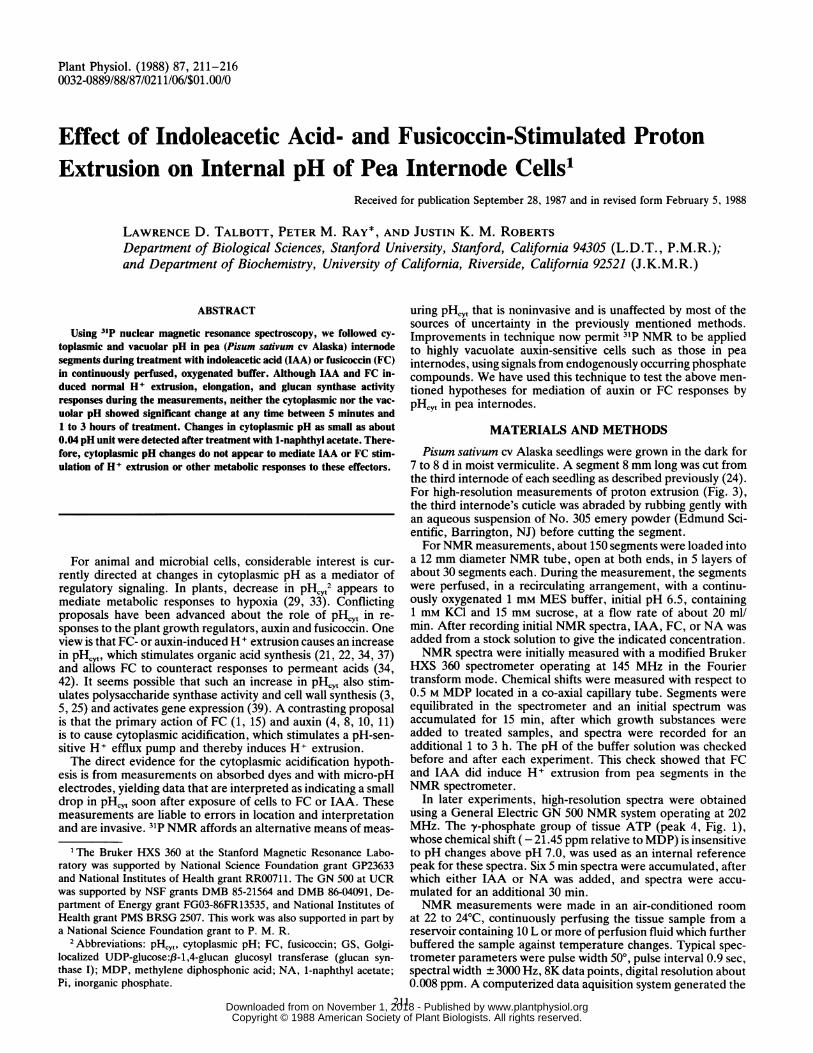
compounds appear as peaks with characteristic chemical shiftsrelative to a reference standard. In Figures 1 and 2, peak 1 isdue to cytoplasmic glucose-6-phosphate, peaks 2 and 3 are thesignal from Pi located in the cytoplasmic and vacuolar compart-ments, respectively, and peak 4 is due to the y-phosphate groupof ATP (see Refs. 27 and 28 for means of identifying peaks).The large ratio of vacuolar to cytoplasmic Pi signals in thesespectra, compared with previously published spectra from maizeroot tips (32, 33), reflects the highly vacuolate nature of peaintemode cells. Changes in pH of these compartments will changethe chemical shifts of peaks 1 to 3, more negative values indi-cating acidification (27).Table I gives data on the effect of FC treatment on pHc,,, in
pea internode cells. For these experiments, batches of internodesegments were placed in the NMR system for 15 min while aninitial spectrum was taken. FC (final concentration 3 or 30 uM)was then added to treated samples, and additional spectra wererecorded for 1 to 3 h. Controls were followed for similar timesbut received no additions. Each horizontal set of numbers in thistable gives the results of a different experiment. The initial col-umn gives cytoplasmic Pi chemical shift values for the initial 15min period. While sample geometry, reference placement, andmagnetic field differences cause the absolute chemical shift val-ues to vary between samples, it can be seen from the means andtheir standard deviations that the average peak position does notdiffer significantly among the experiments during this initial pe-riod. The second column in Table I gives chemical shift valuesfor the first 15 min after addition, and the third column the meanvalues over that entire hour. In control samples, the averagechemical shift for cytoplasmic Pi does not change significantlyduring the period of observation. The stability of pHcyt in thesecells, along with a strong y-ATP signal (at - 21.45 ppm) and thevirtual absence of a f3-ADP peak (at - 22.2 ppm) in these spectra(Fig. 1)- as well as in block-averaged spectra having much strongersignals (not shown)-demonstrates that the tissue was well oxy-genated and metabolically active throughout the experimentalperiod (28).
Addition of FC after the initial period caused no significantchange in cytoplasmic Pi chemical shift from either the control
9\f 60 min
v 30 min
5 min
-10 -15 -20 PPM
FIG. 1. Superposed 5 min 31P NMR spectra from 150 pea third in-ternode segments over the course of 1 h. Segments were perfused inoxygenated recirculating 1 mm MES buffer containing 1 mM KCI and 15mM sucrose. IAA (17 uM) was added after 30 min. Peaks 2 and 3 arethe signals from cytoplasmic and vacuolar Pi, respectively, peak 1 iscytoplasmic glucose-6-phosphate, and peak 4 is the y-phosphate groupof ATP.
or initial values during either the first 15 min or the entire firsthour of treatment. The initial control value of - 14.135 ppm forpeak 2 represents an approximate pH,Yt of 7.5, estimated usinga titration curve ofpH versus Pi chemical shift in pea homogenate(cf. Ref. 31). A change of 0.1 pH unit corresponds to a changein chemical shift of 0.12 ± 0.02 ppm. The standard deviationsof the measurements in Table I are about 0.06 ppm, indicatinga precision of pH determination of better than 0.1 pH unit.
In order to ascertain empirically whether a small change inpH,r could actually be detected by the system, in parallel ex-periments we treated samples with NA, an ester whose intra-cellular hydrolysis should cause cytoplasmic acidification (15).Treatment with 0.2 mm NA caused the cytoplasmic Pi chemicalshift to become about 0.1 ppm more negative (data not shown,but for similar results see Table II), indicating that pH,yt de-creased by about 0.08 pH unit. This is smaller than the cyto-plasmic acidifications inferred (4, 8, 10, 11) to be caused by FCor IAA.As in the case of FC treatment, with the above NMR system,
212 TALBOTT ET AL.
www.plantphysiol.orgon November 1, 2018 - Published by Downloaded from Copyright © 1988 American Society of Plant Biologists. All rights reserved.

H+ EXTRUSION AND INTRACELLULAR pH
3,
60 min
30 min
5 min
-10 -15 -20 PPM
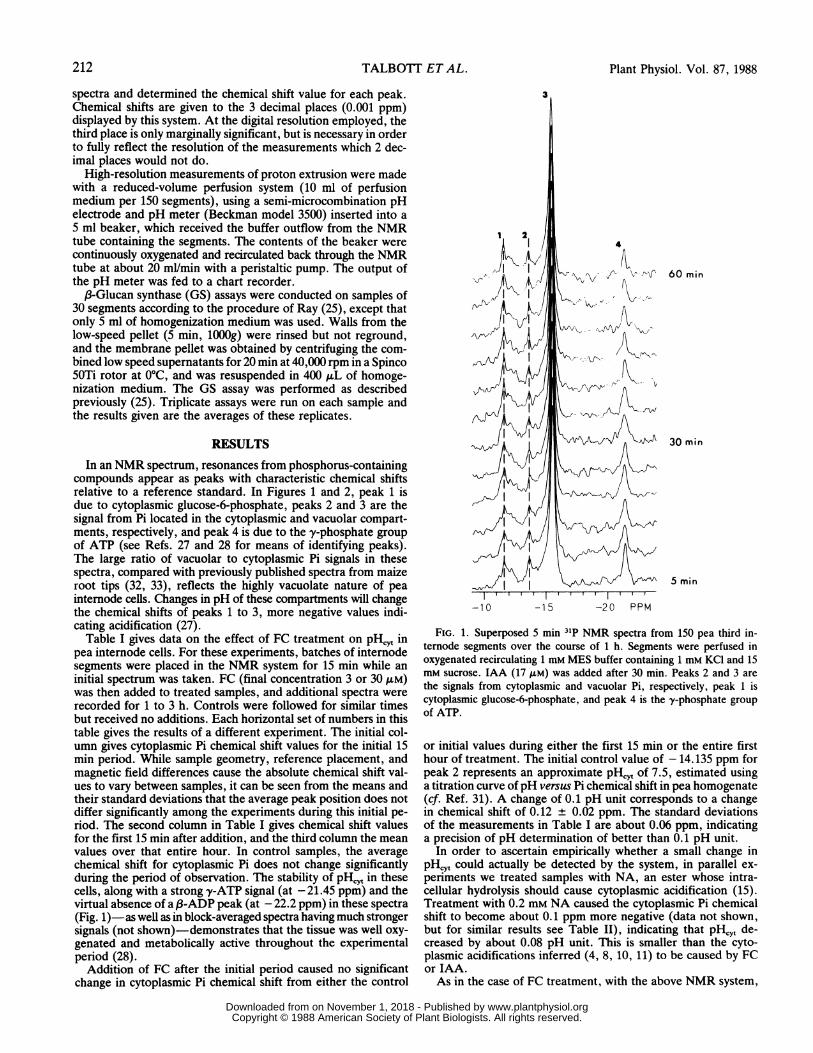
FIG. 2. Superposed 5 min 31P NMR spectra from 150 pea segmentsover the course of 1 h. Segments were perfused as in Figure 1, and 0.1mM NA was added after 30 min. The movement of peaks 1 and 2 towardmore negative chemical shift values in the spectra taken later than 30min indicates cytoplasmic acidification caused by NA.
we detected no significant change in pH,t between 15 and 60min after pea segments were treated with 17 gM IAA (data notshown). Because of the importance of this point, we investigatedit further using a more sensitive NMR system recently set up atthe University of California at Riverside. Table II gives the av-erage cytoplasmic Pi chemical shift values for six 5 min spectraprior to and after the addition of 17 p.M IAA in three separateexperiments. Table II also includes three control experiments inwhich no IAA was added. The average values for the two periodsindicate no pHcyt drift in controls, and no change in pH afteraddition of IAA to the thus treated samples. The standard de-viations for the chemical shifts in these experiments are about0.03 ppm, indicating a precision of better than 0.05 pH unit.Using this NMR system, treatment with 0.1 mm NA caused a
cytoplasmic acidification of about 0.04 pH unit, as shown by thecytoplasmic Pi chemical shift values in the lower part of TableII. Statistical analysis of the individual experiments (t test forthe difference of two means) indicates that the mean chemicalshifts before and after NA differ at the 90% confidence level.The same test applied to the control and IAA experiments showsno significant difference. Figures 1 and 2 show a series of 5 min
spectra for one of the IAA and one of the NA experiments fromTable II. The vertical line clearly shows that the cytoplasmic Pipeak shifts toward more negative values after addition of NAbut not after addition of IAA. The NA-induced change in pHcytis confirmed by the distinct right shift in peak 1 (cytoplasmicglucose-6-phosphate) after addition of NA (Fig. 2), but not afterIAA (Fig. 1).The mean chemical shift of vacuolar Pi (peak 3) showed no
significant difference from the initial values during either the first15 min or the first hour after addition of FC or IAA (Table III;Fig. 1). The mean control chemical shift of - 15.968 ppm isequivalent to a vacuolar pH of 5.8.
In an effort to see longer term pH changes, we routinely col-lected spectra for up to 2 h after addition or 3 h in one FCexperiment. In no case did we observe any significant changefrom the cytoplasmic or vacuolar Pi chemical shift values at 1 h(data not shown). In one case (third FC experiment in Table I),we added 30 /M FC, a concentration known to stimulate ex-traordinary proton extrusion. Even here, no significant changesin cytoplasmic or vacuolar pH were observed within 2 h.The ability of FC and IAA to stimulate H+ extrusion from
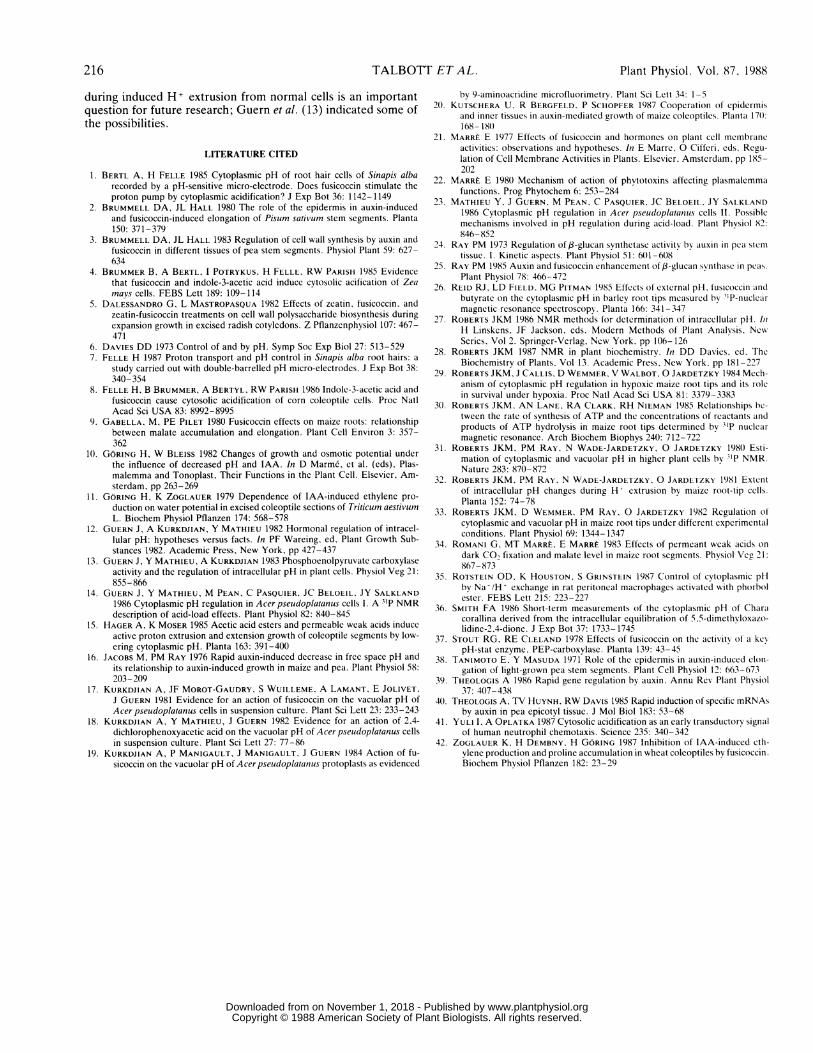
pea segments under the perfusion conditions of the NMR ex-periments was verified for all experiments as described in "Ma-terials and Methods," and was checked in more detail using ahigh-resolution perfusion system (Fig. 3). This record shows typ-ical acidification time tourses for controls and for IAA- and FC-treated samples. Control samples maintain a fairly constant ex-ternal pH, acidifying the medium only slightly in 1 h. Samplestreated with 17 AM IAA start to acidify the medium within 10min, causing its pH to decrease by 0.6 unit over the course of 1h. FC at 0.3 gM causes a similar but slightly faster acidification,while 3 JM FC produces stronger acidification with virtually noinitial lag.We also verified that segment elongation and internal bio-
chemical responses, as illustrated by stimulation of GS activity,occurred normally in our NMR experiments. Both IAA and FC,added to segments in the perfusion chamber inside the operatingNMR spectrometer, gave results (Table IV) similar to thoseobtained in other experimental situations (25): FC stimulatedelongation more than IAA did and enhanced GS activity but toa lesser extent than IAA did.
DISCUSSIONThe present results with pea internode segments agree with
our earlier NMR pH measurements on maize root tips (32) inindicating that no appreciable change in cytoplasmic or vacuolarpH generally occurs during up to 3 h of FC treatment that isshown to induce rapid H+ extrusion. According to the presentresults, the same is true for treatments of up to 2 h with IAA.The precision of measurement (at least 0.1 pH unit in the FCexperiments and at least 0.05 pH unit in the later IAA experi-ments) was sufficient to detect a drop of 0.1 unit in pHcyt likethat reported, from microelectrode measurements, to occur inmaize coleoptile cells within 10 to 20 min after IAA or FC treat-ment (8). With the NMR method we were, however, able todetect small decreases in pHc,Yt due to intracellular hydrolysis ofthe ester NA. Fluorimetric measurements on oat coleoptiles sug-gested that NA at the lowest concentration we used (0.1 mM)caused a decrease in pH,Yt similar to that thought to be causedby FC (15). According to microelectrode measurements on maizeroot cells (4), 0.2 mm NA causes less membrane hyperpolari-zation, hence presumably less cytoplasmic acidification and H+extrusion, than FC causes. Therefore, if FC or IAA caused evena slight cytoplasmic acidification in our pea internode segments,we feel we could and should have detected it. Our negative resultsfor cytoplasmic acidification by FC agree at least qualitativelywith NMR measurements on barley and maize root tips by Reid
213
www.plantphysiol.orgon November 1, 2018 - Published by Downloaded from Copyright © 1988 American Society of Plant Biologists. All rights reserved.

Plant Physiol. Vol. 87, 1988
Table I. Effect of FC on Cytoplasmic Pi Chemical ShiftAfter recording initial spectra, treated samples received 3 /M FC (30 AM, in the third FC experiment listed).
Numbers in parentheses are standard deviations.
TreatmenInitial 1-16 Min Mean, 1-61 MinTreatment Initial after Addition after Addition
ppmControl - 14.082 - 14.070 - 14.049 (0.023)
-14.177 -14.187 - 14.162 (0.020)- 14.179 -14.171 - 14.194 (0.018)-14.177 -14.088 - 14.068 (0.052)
Mean - 14.153 (0.047) - 14.129 (0.059) - 14.118 (0.070)
FC -14.121 -14.116 - 14.088 (0.042)-14.107 -14.126 - 14.040 (0.059)-14.246 -14.180 - 14.232 (0.037)- 14.202 - 14.201 - 14.237 (0.039)
Mean - 14.169 (0.068) -14.156 (0.041) - 14.149 (0.100)
Table II. Effect of IAA and NA on Cytoplasmic Pi Chemical ShiftEach number in parentheses after an individual experiment entry is
the standard deviation for the mean chemical shift from six 5-min ac-cumulations, respectively, before (left column) or after (right column)the time when 17 uM IAA or 0.1 mm NA was added to the treatedsamples. Numbers in parentheses after the mean values for each set ofexperiments are standard deviations for that set of means.
30-1 Min 1-30 MinTreatment before Addition after Addition
ppmControl - 13.757 (0.033) - 13.765 (0.033)
- 13.727 (0.048) - 13.710 (0.029)-13.724 (0.038) - 13.711 (0.034)
Mean - 13.735 (0.018) - 13.729 (0.032)IAA - 13.730 (0.017) -13.726 (0.033)
- 13.769 (0.030) - 13.779 (0.045)- 13.734 (0.036) - 13.728 (0.032)
Mean - 13.744 (0.021) - 13.744 (0.029)NA -13.750 (0.030) - 13.772 (0.036)
- 13.716 (0.030) - 13.755 (0.048)- 13.736 (0.025) - 13.762 (0.030)
Mean - 13.734 (0.017) - 13.763 (0.009)
et al. (26), and presumably with those on sycamore suspensioncells by Guern et al. (12, 13), who expected, but did not find,an increase in pHcyt due to FC and would surely have reporteda decrease had they seen one.One obvious objection is that a pH,yt change that serves as an
intermediary signal in a physiological response might be tran-sient, as reported for cytoplasmic acidification in certain animalcell responses (35, 41). NMR would fail to detect it because itdisappears before an NMR spectrum of adequate precision canbe accumulated. However, with the NMR system of increased
sensitivity used in the experiments of Table II we were able toaccumulate an adequate spectrum in 5 min, the time scale ofreported transient acidifications (41). Yet these early spectra,like those taken later after the addition of IAA or FC, give no
indication of cytoplasmic acidification (Fig. 1). Moreover, forauxin and FC responses this objection is actually not reasonable,because (a) the metabolic effects of IAA and FC are not justtriggered by these regulators but depend on their continued pres-
ence, so if these effects are mediated by a change in pHcy,, thatchange should not be transient; and (b) the FC- and IAA-inducedcytoplasmic acidifications claimed from microelectrode meas-
urements (1, 8) are not transient.Why do we fail with NMR to detect cytoplasmic acidification
by FC or IAA, when several papers using other methods havereported it? One possible reason is that none of the latter workhas looked at pea internode cells, and the conclusions about FCand IAA acting via cytoplasmic acidification are not general.Another reason might be that whereas the microelectrode meas-
urements were made on epidermal cells (8), the NMR methodlooks at the entire tissue. According to several papers (2, 20,38), the mechanical action responsible for stimulating elongationoccurs largely or entirely in the epidermis of stems and coleop-tiles. If IAA- and FC-induced cytoplasmic acidification occurredonly in the epidermis, measurements on the whole tissue mightnot detect it, since the epidermal cells comprise 10% or less ofthe tissue.For our pea internode segments, however, we have evidence
that metabolic effects of auxin and FC are not restricted to theepidermis, nor even to the outer half of the tissue cylinder. Aftertreatment of intact segments with IAA or FC, drilling out thecentral (pith) tissue with the tip of a Pasteur pipet reveals thatboth of these regulators enhance GS activity in the pith, as wellas in the cortex plus epidermis. Since enhancement of GS activityis tied to H+ extrusion (25), this implies that these regulatorsstimulate H+ extrusion from cells in the pith as well as in theouter part of the segments. In the case of FC this is directly
Table III. Effect of Different Treatments on Vacuolar Pi Chemical ShiftNumbers in parentheses are standard deviations for n experiments of the indicated type.
1-16 Min Mean 1-61 MinTreatment n Initial after Addition after Addition
ppmControl 6 - 15.968 (0.060) - 15.971 (0.068) - 15.984 (0.067)FC 4 -16.030 (0.087) - 16.024 (0.118) - 16.032 (0.103)IAA 3 - 16.034 (0.045) - 16.057 (0.061) - 16.072 (0.061)
214 TALBOTT ET AL.
www.plantphysiol.orgon November 1, 2018 - Published by Downloaded from Copyright © 1988 American Society of Plant Biologists. All rights reserved.

H+ EXTRUSION AND INTRACELLULAR pH
pH
600 b
c~~~~~~~~~~~~~~~~~~~d
5.515 30 45 60
Time (min)
FIG. 3. Time course of acidification of the external medium by 150pea segments perfused, in an NMR sample tube, with 10 ml of recir-culating 1 mM MES buffer containing 1 mm KCI and 15 mm sucrose. a,
Control; b, 17 gM IAA; c, 0.3 gM FC; d, 3.0 gM FC, each added at timeindicated by arrow.
Table IV. Effect of IAA and FC on the Glucan Synthase (GS) andElongation Responses of Pea Segments in the NMR System
Tissue (perfused as described in "Materials and Methods" was kept75 min in the operating NMR spectrometer after the time of addition of17 ,M IAA or 3 ,UM FC to treated samples, before making membranepreparations for GS assay. Numbers in parentheses are standard devia-tions for triplicate assays. Mean change in length per segment (AL) was
determined by measuring the aggregate length of 10 segments beforeand after treatment (initial length, 8.8 mm).
Treatment GS activity ALcpm mm
Control 1834 (57) 0.45IAA 2951 (72) 1.0FC 2406 (35) 1.9
confirmed by finding that FC stimulates H+ extrusion from iso-lated pith cylinders (IAA does not, but the injury involved inpreparing such cylinders probably eliminates the H+ extrusionresponse to IAA, as it does the GS response). These results, thedetails of which will be published elsewhere, suggest that if IAAor FC induces H+ extrusion as a result of causing cytoplasmicacidification, this acidification should be detectable by obser-vations made on whole pea internode segments.The microelectrode and dye absorption or fluorescence data
interpreted as indicating IAA- or FC-induced decreases in pHcYtin plant cells may have other interpretations. So far as can betold from the published papers, these methods have not beencalibrated in situ, and have not been shown to respond solely tochanges in pH nor to be localized to the cytoplasm. Also, it hasnot been demonstrated (and probably cannot be, at least forindividual cells impaled with microelectrodes) that these pHCYt-measuring methods do not perturb or eliminate normal IAA andFC responses in the affected cells, as we have shown for our peainternode cells subjected to intracellular pH measurement by theNMR technique.Only a very few microelectrode records, each on just a single
cell, have been published in support of the cytoplasmic acidifi-cation hypothesis (1, 4, 8). These data conflict seriously withphysiological information on maize coleoptile cells, in indicatingidentical pHcyt shifts to be caused by widely different IAA andFC concentrations that are known to cause greatly different ratesof H+ extrusion and cell elongation. No statistics were given onhow many cells were impaled, how many of these gave resultsconsistent with the hypothesis, or what the range of apparentpHr.. shifts was. Parallel untreated controls were not given show-
ing that the changes in electrode outputs recorded after a treat-ment differ from the spontaneous fluctuations that can occurduring electrophysiological measurements. The impalementsprobably all punctured and therefore injured the tonoplast ini-tially, so leakage of acids from vacuole into cytoplasm duringthe disturbance of adding FC or IAA might explain the results,There is also a danger that metabolic changes during treatment,combined with inadequate oxygenation, might cause hypoxia,which would rapidly lead to cytoplasmic acidification (29, 33).However, the most obvious artifactual explanation of the mi-croelectrode results is that since IAA- or FC-induced H + extru-sion (at least from unimpaled cells) rapidly acidifies the tissue'sextracellular space (16), and since the impaled cell's plasma-lemma is certainly punctured, leakage of acid from the acidifiedfree space into the cytoplasm around the impaling electrodescauses cytoplasmic acidification (and leads to the observed hy-perpolarization), just as an exogenous permeant acid load does(7, 14, 26).The present results do not conflict with Goring's (10, 11, 42)
cytoplasmic acidification hypothesis for IAA effects at the highconcentrations which induce ethylene production, because ourexperiments did not involve IAA concentrations in that range.Such concentrations are likely (by permeation of undissociatedIAA) to cause cytoplasmic acidification, as reported for Chara(36) and maize coleoptile (8) cells. That we did not observe anyincrease in vacuolar pH during our relatively short FC or auxintreatments also does not conflict with observations on sycamoresuspension culture cells indicating that such increases do occur,but over a longer time scale (17-19).Our results indicate that intracellular auxin responses such as
activation of gene expression (39) or enhancement of cell wallpolysaccharide synthase activities (25) are not due to changes inpH,yt that are caused by (or that lead to) H+ extrusion. Thisconclusion was previously advanced on other grounds (25, 40).The present results bolster our earlier conclusion (32, 33) that
maintenance of pH,yt during stimulated H+ extrusion is not dueto the widely believed 'pH-stat' mechanism (6), according towhich H + extrusion from the cytoplasm should raise pH,Yt whichactivates PEP carboxylase, which produces malic acid whosedissociation generates H+, preventing further rise in pHCYt Dur-ing FC, IAA, or unbalanced salt treatment of the tissues we havestudied, carboxylation is stimulated (9, 21, 34) and pH,yt is main-tained, without any significant rise in pHcyt above its initial valueprior to induction of H+ extrusion. Similar NMR results wereobtained during FC-stimulated H+ extrusion by sycamore sus-pension culture cells (12, 13). This pHcyt regulation seems todiffer notably from that during hypoxia-induced acid production(29) or exposure to exogenous acid or base loads (7, 14, 26, 33),in response to which the pHc,t shifts detectably before becomingstabilized. To achieve this stabilization, rates of acid productionor consumption (and H+ transport) seem to be modulated bypHcyt in these cases (7, 23). Acid production seems instead tobe coupled directly to H+ efflux during induced H+ extrusion.NMR measurements by Reid et al. (26) suggested, to the con-
trary, that a small (about 0.1 unit) increase in pHc,t occurs duringFC-induced H+ extrusion from barley and maize root tips. Intheir experiments, in contrast to those described here and pre-viously (32, 33), the pHcyt in controls was declining, which alongwith the low ATP/ADP ratio apparent from their NMR spectra(26), indicates hypoxia (28, 29, 30). Since our results were notobtained under acidotic conditions they do not conflict with Reidet al.'s (26) findings, which actually agree with other evidencesuggesting that FC-induced H+ extrusion can counteract cyto-plasmic acidosis to some degree (34, 42). All these results are,of course, contrary to the hypothesis that FC induces H + extru-sion by causing cytoplasmic acidification.What the coupling is between H+ efflux and acid production
215
www.plantphysiol.orgon November 1, 2018 - Published by Downloaded from Copyright © 1988 American Society of Plant Biologists. All rights reserved.
216 TALBOTF ET AL.
during induced H + extrusion from normal cells is an importantquestion for future research; Guern et al. (13) indicated some ofthe possibilities.
LITERATURE CITED
1. BERTL A, H FELLE 1985 Cytoplasmic pH of root hair cells of Sinapis albarecorded by a pH-sensitive micro-electrode. Does fusicoccin stimulate theproton pump by cytoplasmic acidification? J Exp Bot 36: 1142-1149
2. BRUMMELL DA, JL HALL 1980 The role of the epidermis in auxin-inducedand fusicoccin-induced elongation of Pisum sativum stem segments. Planta150: 371-379
3. BRUMMELL DA, JL HALL 1983 Regulation of cell wall synthesis by auxin andfusicoccin in different tissues of pea stem segments. Physiol Plant 59: 627-634
4. BRUMMER B, A BERTL, I POTRYKUS, H FELLE, RW PARISH 1985 Evidencethat fusicoccin and indole-3-acetic acid induce cytosolic acification of Zeamnays cells. FEBS Lett 189: 109- 114
5. DALESSANDRO G, L MASTROPASQUA 1982 Effects of zcatin, fusicoccin. andzeatin-fusicoccin treatments on cell wall polysaccharide biosynthesis duringexpansion growth in excised radish cotyledons. Z Pflanzenphysiol 107: 467-471
6. DAVIEs DD 1973 Control of and by pH. Symp Soc Exp Biol 27: 513-5297. FELLE H 1987 Proton transport and pH control in Sinapis alba root hairs: a
study carried out with double-barrelled pH micro-electrodes. J Exp Bot 38:340-354
8. FELLE H. B BRUMMER, A BERTYL, RW PARISH 1986 lndolc-3-acetic acid andfusicoccin cause cytosolic acidification of corn coleoptile cells. Proc NatlAcad Sci USA 83: 8992-8995
9. GABELLA, M, PE PILET 1980 Fusicoccin effects on maize roots: relationshipbetween malate accumulation and elongation. Plant Cell Environ 3: 357-362
10. GORING H, W BLEISS 1982 Changes of growth and osmotic potential underthe influence of decreased pH and IAA. In D Marmi, et al. (eds). Plas-malemma and Tonoplast, Their Functions in the Plant Cell. Elsevier, Am-sterdam, pp 263-269
11. GORING H, K ZOGLAUER 1979 Dependence of IAA-induced ethylene pro-duction on water potential in excised coleoptile sections of Triticum aestivumL. Biochem Physiol Pflanzen 174: 568-578
12. GUERN J, A KURKDJIAN, Y MATHIEU 1982 Hormonal regulation of intracel-lular pH: hypotheses versus facts. In PF Wareing, ed. Plant Growth Sub-stances 1982. Academic Press, New York, pp 427-437
13. GUERNJ, Y MATHIEU, A KURKDJIAN 1983 Phosphoenolpyruvatc carboxylaseactivity and the regulation of intracellular pH in plant cells. Physiol Veg 21:855-866
14. GUERN J, Y MATHIEU, M PEAN, C PASQUIER, JC BELOEIL. JY SALKLAND1986 Cytoplasmic pH regulation in Acer pseudoplatatnus cells1. A31P NMRdescription of acid-load effects. Plant Physiol 82: 840-845
15. HAGER A, K MOSER 1985 Acetic acid esters and permeablc weak acids induccactive proton extrusion and extension growth of coleoptile segments by low-ering cytoplasmic pH. Planta 163: 391-400
16. JACOBS M, PM RAY 1976 Rapid auxin-induced decreasc infree space pH andits relationship to auxin-induced growth in maize and pea. Plant Physiol 58:203-209
17. KURKDJIAN A, JF MOROT-GAUDRY, S WUILLEME. A LAMANT, E JOLIVET,J GUERN 1981 Evidence for an action of fusicoccin on the vacuolar pH ofAcer pseudoplatanus cells in suspension culture. Plant Sci Lett 23: 233-243
18. KURKDJIAN A, Y MATHIEU, J GUERN 1982 Evidence for an action of 2,4-dichlorophenoxyacetic acid on the vacuolar pH of Acer pseudoplatanus cellsin suspension culture. Plant Sci Lett 27: 77-86
19. KURKDJIAN A, P MANIGAULT, J MANIGAULT, J GUERN 1984 Action of fu-sicoccin on the vacuolar pH of Acer pseudoplatantus protoplasts as evidenced
Plant Physiol. Vol. 87, 1988
bv 9-aminoacridine microfluorimetrv. Plant Sci Lett 34: 1-520. KUTSCHERA U. R BERGFELD. P SCHOPFER 1987 Cooperation of epidermis
and inner tissues in auxin-mediated growth of maize colcoptiles. Planta 170:168- 180
21. MARRE E 1977 Effects of fusicoccin and hormones on plant ccll membraneactivitics: observations and hypotheses. In E Marre, 0 Cifferi, eds, Regu-lation of Cell Membrane Activities in Plants. Elsevier, Amstcrdam. pp 185-202
22. MARRE E 1980 Mechanism of action of phvtotoxins affecting plasmalemmafunctions. Prog Phytochem 6: 253-284
23. MATHIEU Y, J GUERN, M PEAN, C PASQUIER, JC BELOEIL, JY SALKLAND1986 Cytoplasmic pH regulation in Acer pseudoplatanius cells II. Possiblcmechanisms involved in pH regulation during acid-load. Plant Physiol 82:846- 852
24. RAY PM 1973 Regulation of,B-glucan synthetase activity by iuxin in pca stemtissue. 1. Kinetic aspects. Plant Phvsiol 51: 6(1-60)8
25. RAY PM 1985 Auxin and fusicoccin enhancement of,B-glucan sxnthasc in peas.Plant Physiol 78: 466-472
26. REID RJ. LD FIELD. MG PITMAN 1985 Effects ot extcrnal pH. fusicoccin andbutyrate on the cytoplasmic pH in barley root tips mcasurcd by 3P-nuclearmagnctic resonance spectroscopy. Planta 166: 341- 347
27. ROBERTS JKM 1986 NMR methods for dctermination of intraccllular pH. JoH Linskcns. JF Jackson, eds. Modern Methods of Plant Anatlysis. NesSeries. Vol 2. Springer-Verlag, New York. pp 1(16-126
28. ROBERTS JKM 1987 NMR in plant biochemistry. In DD Davics, ed. TheBiochemistry of Plants. Vol 13. Academic Press, New York. pp 181-227
29. ROBERTS JKM, J CALLIS, D WEMMER, V WALBOT. 0 JARDETZKY 1984 Mech-anism of cytoplasmic pH regulation in hypoxic maize root tips and its 1-olcin survival under hypoxia. Proc Natl Acad Sci USA 81: 3379-3383
30. ROBERTS JKM. AN LANE. RA CLARK. RH NIEMAN 1985 Relationships bc-tween the rate of synthesis of ATP and the concentrations of reactants andproducts of ATP hydrolysis in maize root tips determined bv 8'P nuclearmagnetic resonance. Arch Biochem Biophys 240: 712-722
31. ROBERTS JKM, PM RAY. N WADE-JARDETZKY. 0 JARDETZKY 1980 Esti-mation of cytoplasmic and vacuolar pH in higher plant cells bv ''P NMR.Nature 283: 870-872
32. ROBERTS JKM. PM RAY. N WADE-JARDETZKY. 0 JARDETZKE 1981 Extentof intracellular pH changes during H+- extrusion bv maize root-tip cclls.Planta 152: 74-78
33. ROBERTS JKM. D WEMMER. PM RAY, 0 JARDETZKY 1982 Regulation ofcytoplasmic and vacuolar pH in maize root tips under different experimentalconditions. Plant Physiol 69: 1344- 1347
34. ROMANI G. MT MARRL, E MARRE 1983 Effects of permeant weak acids ondark CO, fixation and malate level in maize root segments. Physiol Veg 21:867- 873
35. ROTSTEIN OD. K HOUSTON, S GRINSIWEIN 1987 Control of cytoplasmic pHby Na/H- exchange in rat peritoneal macrophages actisated with phorbolester. FEBS Lett 215: 223-227
36. SMIJ H FA 1986 Short-term measurements of the cvtoplasmic p1I of Characorallina derived from the intracellular equilibration of 5.5-dimethyloxazo-lidine-2.4-dione. J Exp Bot 37: 1733-1745
37. STOUT RG. RE CLELAND 1978 Effects of fusicoccin on the activitv of ai kcspH-stat enzyme. PEP-carboxylasc. Planta 139: 43-45
38. TANIMOTO E, Y MASUDA 1971 Role of thecpidcrmis in auxin-induced elon-gation of light-grown pea stem segments. Plant Cell Physiol 12: 663-673
39. THEOLOGIS A 1986 Rapid gene regulation by auxin. Annu Res Plant Physiol37: 407-438
40. THEOLOGIS A, TV HUYNH. RW DAVIS 1985 Rapid induction of specific mRNAsby auxin in pea epicotyl tissuc. J Mol Biol 183: 53-68
41. YULI1. A OPLATKA 1987 Cytosolic acidification as an early transductory signalof human neutrophil chemotaxis. Science 235: 340-342
42. ZOGLAUER K. H DEMBNY. H GORINC, 1987 Inhibition of IAA-induced cth-vlene production and proline accumulation in wheat coleoptiles bv fusicoccin.Biochem Physiol Pflanzen 182: 23-29
www.plantphysiol.orgon November 1, 2018 - Published by Downloaded from Copyright © 1988 American Society of Plant Biologists. All rights reserved.