Effect Of India’s Current Account Deficit On External … · selected Foreign Exchange Rates that...
12
IOSR Journal of Economics and Finance (IOSR-JEF) e-ISSN: 2321-5933, p-ISSN: 2321-5925 PP 54-65 www.iosrjournals.org 7 th International Business Research Conference 54 | Page Indian Education Society's Management College and Research Centre Effect Of India’s Current Account Deficit On External Debts And Foreign Exchange Rates Dr. Mehernosh B. Mehta, Director, IMSCD&R, IMS Campus, Station Road, Ahmednagar, 414001, Maharashtra Email id: [email protected], Mobile: 09822079675 Prof. Hatim F. Kayumi, Asst. Prof, Management Department, IMSCD&R, IMS Campus, Station Road, Ahmednagar, 414001, Maharashtra Email id: [email protected], Mobile: 09860076110 Abstract: Current Account is an important component of Balance of Payment which represents country’s foreign transactions. A Current Account Deficit indicates negative sales abroad. A country undergoing Current Account Deficit results into foreign liabilities and debts with rest of world. This further leads to payback of valuable foreign exchange reserves. Substantial amount of foreign exchange are spent on paying out these debts. One important drawback of increasing external debt is decline in value of nation’s domestic currency. Payment of foreign debts results in increase in demand of foreign currencies. This leads to devaluation of domestic currency and thus, enhances problems of foreign exchange crises. There are various factors which influence country’s External Borrowings as well as Foreign Exchange Rates. One such important factor is Current Account (Trade Balance) Deficit. There is a need to study the impact of Current Account Deficit of India on its External Borrowings as well as on Foreign Exchange Rates. The present study tries to study trend of India’s Current Account Balance and External Debt of India over a period of two decades i.e. from 1990 – 91 to 2012 –13. Study also covers analysis of components of India’s Total External Debt that includes long term debt and short term debt. Finally, study determines correlation between India’s Current Account Balance with External Debt, its components, and selected Foreign Exchange Rates that includes US Dollar, Pound Sterling, Japanese Yen & Euro Dollar. Key Words: Current Account Deficit, External Borrowings, Foreign Exchange Rates EFFECT OF INDIA’S CURRENT ACCOUNT DEFICIT ON EXTERNAL DEBTS AND FOREIGN EXCHANGE RATES I) INTRODUCTION Current Account as a part of Balance of Payment includes all the transactions (other than those in financial items) involving exchange of economic value which takes place between resident and non-resident entities. Current account records all flows of goods, services and transfers. Current account is broadly divided into two parts. First is Balance of Trade (BOT) which deals only with exports and imports of merchandise or visible items. Second is Balance of Invisibles (BOI) that records net receipts on invisible items like dividends, interests, royalties, travels, insurance, banking, transportations and unilateral transfers. Current Account as an important component of Balance of Payment highlights a country’s foreign transactions of a period of time. It is the sum total of Balance of Trade (i.e. net revenue from exports minus payments for imports), factor income (earnings on foreign investments minus payments made to foreign investors) and cash transfers. As a measure of nature of country’s foreign trade, Current Account equals to the change in net foreign assets. Positive sales abroad (exports greater than imports) contribute towards current account surplus. This surplus is possible only when an economy is consuming and spending less than what it is producing. The resulting savings are then invested abroad and thus, foreign assets are being created. If an economy is running into current account deficit, it means that domestic consumption, spending and investments are more than what it is actually producing. This will lead to rising foreign liabilities and decline in foreign asset. The term Debt refers to sum total of a government’s financial obligations, measures the state borrowings from its population, from foreign organizations, from foreign governments and also from international institutions. Higher debt liability results in higher uncertainties in economic policies. External debt refers to the amount owed by one country to outside agencies, institutes and foreign governments. External debt results when a government borrows money from foreign lenders. All countries including India have
Transcript of Effect Of India’s Current Account Deficit On External … · selected Foreign Exchange Rates that...
IOSR Journal of Economics and Finance (IOSR-JEF)
e-ISSN: 2321-5933, p-ISSN: 2321-5925
PP 54-65
www.iosrjournals.org
7th International Business Research Conference 54 | Page
Indian Education Society's Management College and Research Centre
Effect Of India’s Current Account Deficit On External Debts And
Foreign Exchange Rates
Dr. Mehernosh B. Mehta,
Director, IMSCD&R, IMS Campus, Station Road, Ahmednagar, 414001, Maharashtra Email id:
[email protected], Mobile: 09822079675
Prof. Hatim F. Kayumi, Asst. Prof, Management Department, IMSCD&R, IMS Campus, Station Road, Ahmednagar, 414001,
Maharashtra Email id: [email protected], Mobile: 09860076110
Abstract: Current Account is an important component of Balance of Payment which represents country’s
foreign transactions. A Current Account Deficit indicates negative sales abroad. A country undergoing Current
Account Deficit results into foreign liabilities and debts with rest of world. This further leads to payback of
valuable foreign exchange reserves. Substantial amount of foreign exchange are spent on paying out these
debts. One important drawback of increasing external debt is decline in value of nation’s domestic currency.
Payment of foreign debts results in increase in demand of foreign currencies. This leads to devaluation of
domestic currency and thus, enhances problems of foreign exchange crises. There are various factors which
influence country’s External Borrowings as well as Foreign Exchange Rates. One such important factor is
Current Account (Trade Balance) Deficit.
There is a need to study the impact of Current Account Deficit of India on its External Borrowings as
well as on Foreign Exchange Rates. The present study tries to study trend of India’s Current Account Balance
and External Debt of India over a period of two decades i.e. from 1990 – 91 to 2012 –13. Study also covers
analysis of components of India’s Total External Debt that includes long term debt and short term debt. Finally,
study determines correlation between India’s Current Account Balance with External Debt, its components, and
selected Foreign Exchange Rates that includes US Dollar, Pound Sterling, Japanese Yen & Euro Dollar.
Key Words: Current Account Deficit, External Borrowings, Foreign Exchange Rates
EFFECT OF INDIA’S CURRENT ACCOUNT DEFICIT ON EXTERNAL DEBTS AND FOREIGN
EXCHANGE RATES
I) INTRODUCTION Current Account as a part of Balance of Payment includes all the transactions (other than those in
financial items) involving exchange of economic value which takes place between resident and non-resident
entities. Current account records all flows of goods, services and transfers. Current account is broadly divided
into two parts. First is Balance of Trade (BOT) which deals only with exports and imports of merchandise or
visible items. Second is Balance of Invisibles (BOI) that records net receipts on invisible items like dividends,
interests, royalties, travels, insurance, banking, transportations and unilateral transfers. Current Account as an
important component of Balance of Payment highlights a country’s foreign transactions of a period of time. It is
the sum total of Balance of Trade (i.e. net revenue from exports minus payments for imports), factor income
(earnings on foreign investments minus payments made to foreign investors) and cash transfers. As a measure of
nature of country’s foreign trade, Current Account equals to the change in net foreign assets. Positive sales
abroad (exports greater than imports) contribute towards current account surplus. This surplus is possible only
when an economy is consuming and spending less than what it is producing. The resulting savings are then
invested abroad and thus, foreign assets are being created. If an economy is running into current account deficit,
it means that domestic consumption, spending and investments are more than what it is actually producing. This
will lead to rising foreign liabilities and decline in foreign asset.
The term Debt refers to sum total of a government’s financial obligations, measures the state
borrowings from its population, from foreign organizations, from foreign governments and also from
international institutions. Higher debt liability results in higher uncertainties in economic policies. External debt
refers to the amount owed by one country to outside agencies, institutes and foreign governments. External debt
results when a government borrows money from foreign lenders. All countries including India have
IOSR Journal of Economics and Finance (IOSR-JEF)
e-ISSN: 2321-5933, p-ISSN: 2321-5925
PP 54-65
www.iosrjournals.org
7th International Business Research Conference 55 | Page
Indian Education Society's Management College and Research Centre
considerable external debt. External Debt is one of the common elements which is observed in many countries,
especially developing countries in order to finance their deficits / shortfalls. External borrowing is done not only
to finance country’s deficits, but also to put the economy on wheels of growth cycle. An economy can come out
of crises if this debt is utilized efficiently and in a well-directed manner. It may also help in accelerating the rate
of economic growth. In developing nations where there is lack of basic infrastructure and capital, these
resources can be purchased by credit taken from developed and other nations. However, external borrowings
also have some bad effects as it may hamper economic growth and may discourage investments and production.
A great amount of foreign exchange reserves are spent on servicing these debts which leads to devaluation of
domestic currency and further increases deficit in Balance of Payment. It is necessary to know the magnitude
and different components of external debts as it has varying impact on aggregate investment. External debt
financing must be consistent with a country’s policy framework i.e. trade policies, exchange rate policy, interest
rate policy, pricing policy, etc. that is required for its overall growth and sustainability.
Each currency has geographical jurisdiction to function as legal tender in settlement of debt. Foreign
exchange includes foreign currency, balances kept abroad, instruments payable in foreign currencies and
instruments drawn abroad but payable in Indian currency. Foreign exchange is earned by exports and is spent on
imports. The rate at which one currency is converted into another currency is the rate of exchange between
concerned currencies. Exchange Rate is the price of one country’s currency expressed in another currency. In
simple words, exchange rate is the rate at which one currency can be exchanged for another. This exchange rate
for a currency is known from the quotation in foreign exchange market. Similar to any commodity or stock
market, rates in foreign exchange market are determined by interaction of forces of demand for and supply of
foreign exchange. As this demand and supply are affected by number of factors, the exchange rates keep on
changing frequently. One of the important factors affecting exchange rate is the amount of external debt and its
composition.
II) SIGNIFICANCE OF STUDY
There are various factors which influences foreign exchange rates of an economy. One such important
factor is the Current Account Deficit and thereby resulting increasing external liabilities and debts. Rising trade
deficits creates additional burden on domestic currency for any nation. At the same, payment of external
borrowings including both principal loan as well as interest burden is usually paid in foreign currencies. This
involves transfer of scare financial resources from domestic country to foreign countries. One important
drawback of continuous increasing trade deficit is decline in value of nation’s domestic currency as it results in
increase in demand of foreign currencies. This leads to depreciation / devaluation of domestic currency, making
it poorer in foreign exchange markets and enhancing the problems of foreign exchange crises.
India as a developing economy faces the obstacle of continuous and huge deficits in its Current
Account Balances over a period of time. This prolong deficits leads to various problems like overvalued real
exchange rates, inadequate foreign exchange reserves, unfavourable terms of trade, higher interest rates, lower
growth rate, etc. Hence, there is a need to study trend and relationship between India’s Current Account Deficit
and External Debt of India. Also relationship between India’s Current Account Deficit and major foreign
exchange rates needs to be determined.
III) RESEARCH METHODOLOGY A) OBJECTIVES OF STUDY
To study the trend and movement in India’s Current Account Balance
To study the trend and components of External Debt of India
To determine relationship between Current Account Deficit with External Debt of India and selected
Foreign Exchange Rates
B) SCOPE OF STUDY
The present paper tries to study trend and movement of India’s Current Account (Trade) Balance as
well as External Debt of India over a period of two decades i.e. from 1990 – 91 to 2012 – 13. Study covers
analysis of components of India’s Total External Debt that includes long term debt and short term debt. The
study points out percentage-wise currency composition of India External Debt. Finally, the study determines
correlation between India’s Current Account (Trade) Balance with India’s External Debt, its components and
selected Foreign Exchange Rates. Foreign exchange rates covered under study includes US Dollar, Pound
IOSR Journal of Economics and Finance (IOSR-JEF)
e-ISSN: 2321-5933, p-ISSN: 2321-5925
PP 54-65
www.iosrjournals.org
7th International Business Research Conference 56 | Page
Indian Education Society's Management College and Research Centre
Sterling, Japanese Yen and Euro Dollar. This correlation is determined for a period of two decades i.e. from
1990 – 91 to 2012 – 13. Euro Dollar currency is considered from the year 1999 when it was first introduced.
C) METHODOLOGY
a) Type of Data: Secondary data has been collected and used for the present study.
b) Sources of Data: Secondary data was collected from internet, reference books, articles,
publications, etc related to India’s Current Account (Trade) Balance, External Debt of India and Foreign
Exchange Rates.
c) Tools for Data Analysis: Graphs, Percentage, CAGR and Correlation
d) Duration: Study covers trend and analysis of India’s External Debt and Foreign Exchange
Rates over a period of two decades i.e. from 1990 – 91 to 2012 – 13
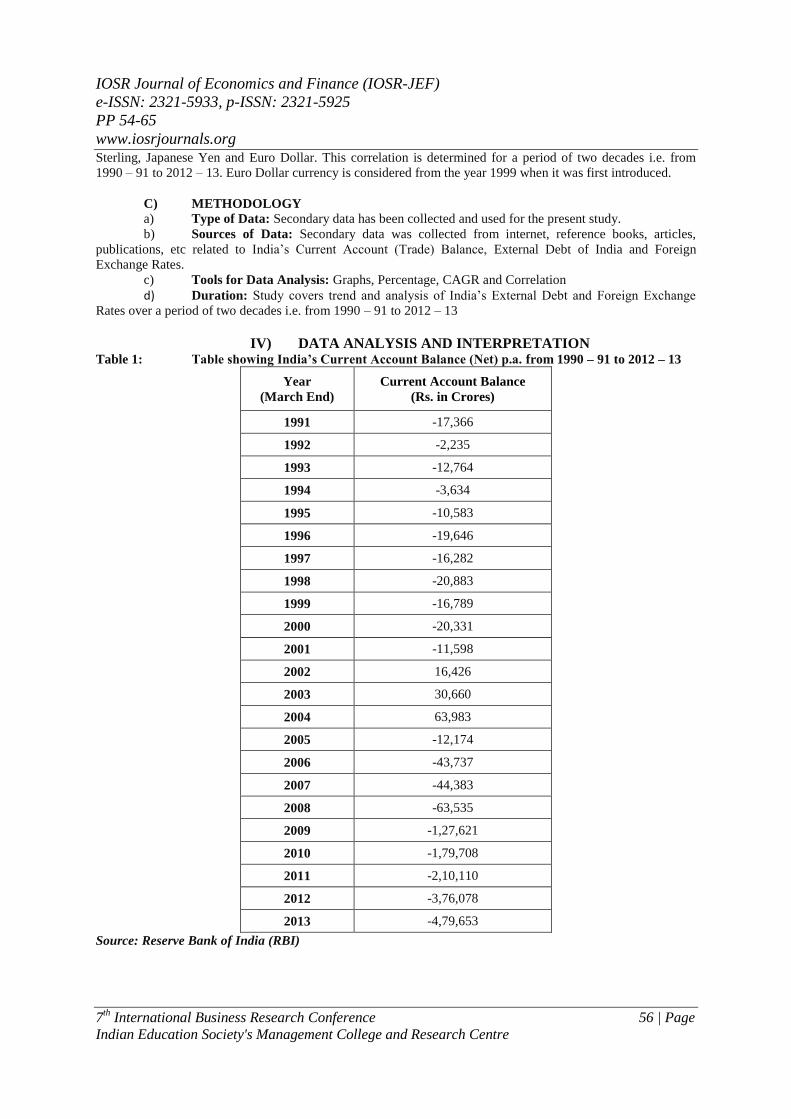
IV) DATA ANALYSIS AND INTERPRETATION Table 1: Table showing India’s Current Account Balance (Net) p.a. from 1990 – 91 to 2012 – 13
Year
(March End)
Current Account Balance
(Rs. in Crores)
1991 -17,366
1992 -2,235
1993 -12,764
1994 -3,634
1995 -10,583
1996 -19,646
1997 -16,282
1998 -20,883
1999 -16,789
2000 -20,331
2001 -11,598
2002 16,426
2003 30,660
2004 63,983
2005 -12,174
2006 -43,737
2007 -44,383
2008 -63,535
2009 -1,27,621
2010 -1,79,708
2011 -2,10,110
2012 -3,76,078
2013 -4,79,653
Source: Reserve Bank of India (RBI)
IOSR Journal of Economics and Finance (IOSR-JEF)
e-ISSN: 2321-5933, p-ISSN: 2321-5925
PP 54-65
www.iosrjournals.org
7th International Business Research Conference 57 | Page
Indian Education Society's Management College and Research Centre
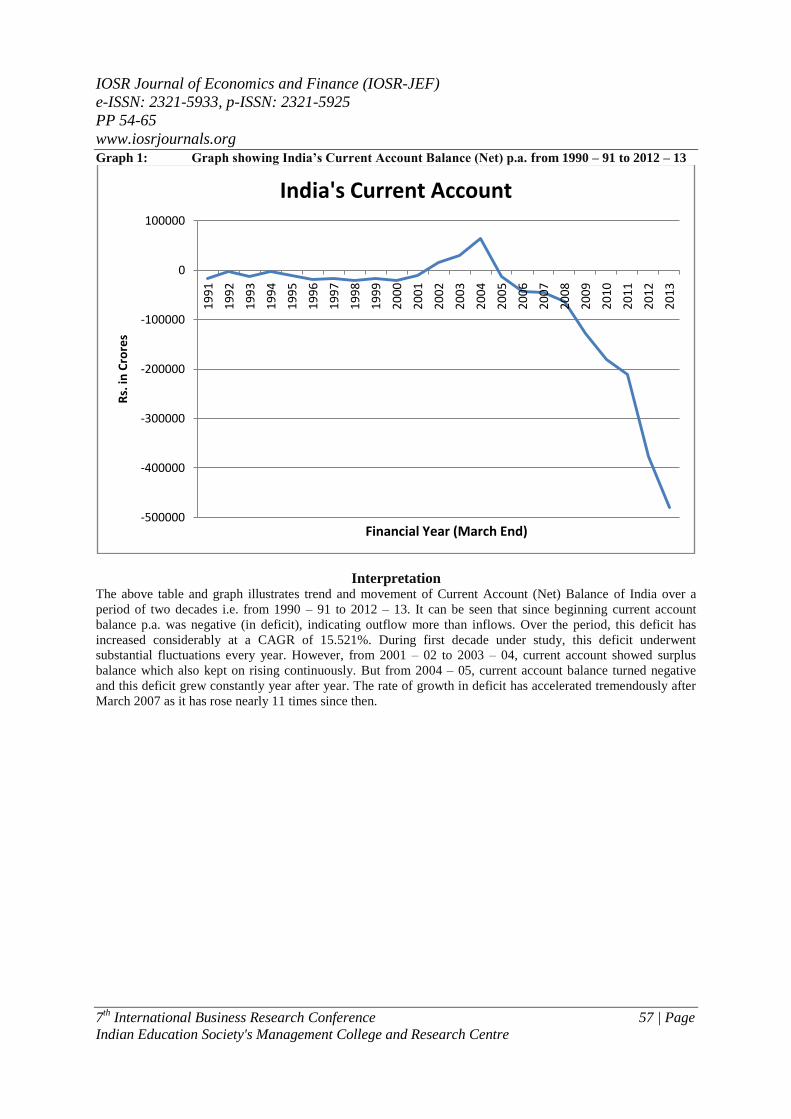
Graph 1: Graph showing India’s Current Account Balance (Net) p.a. from 1990 – 91 to 2012 – 13
Interpretation The above table and graph illustrates trend and movement of Current Account (Net) Balance of India over a
period of two decades i.e. from 1990 – 91 to 2012 – 13. It can be seen that since beginning current account
balance p.a. was negative (in deficit), indicating outflow more than inflows. Over the period, this deficit has
increased considerably at a CAGR of 15.521%. During first decade under study, this deficit underwent
substantial fluctuations every year. However, from 2001 – 02 to 2003 – 04, current account showed surplus
balance which also kept on rising continuously. But from 2004 – 05, current account balance turned negative
and this deficit grew constantly year after year. The rate of growth in deficit has accelerated tremendously after
March 2007 as it has rose nearly 11 times since then.
-500000
-400000
-300000
-200000
-100000
0
1000001
99
1
19
92
19
93
19
94
19
95
19
96
19
97
19
98
19
99
20
00
20
01
20
02
20
03
20
04
20
05
20
06
20
07
20
08
20
09
20
10
20
11
20
12
20
13
Rs.
in C
rore
s
Financial Year (March End)
India's Current Account
IOSR Journal of Economics and Finance (IOSR-JEF)
e-ISSN: 2321-5933, p-ISSN: 2321-5925
PP 54-65
www.iosrjournals.org
7th International Business Research Conference 58 | Page
Indian Education Society's Management College and Research Centre
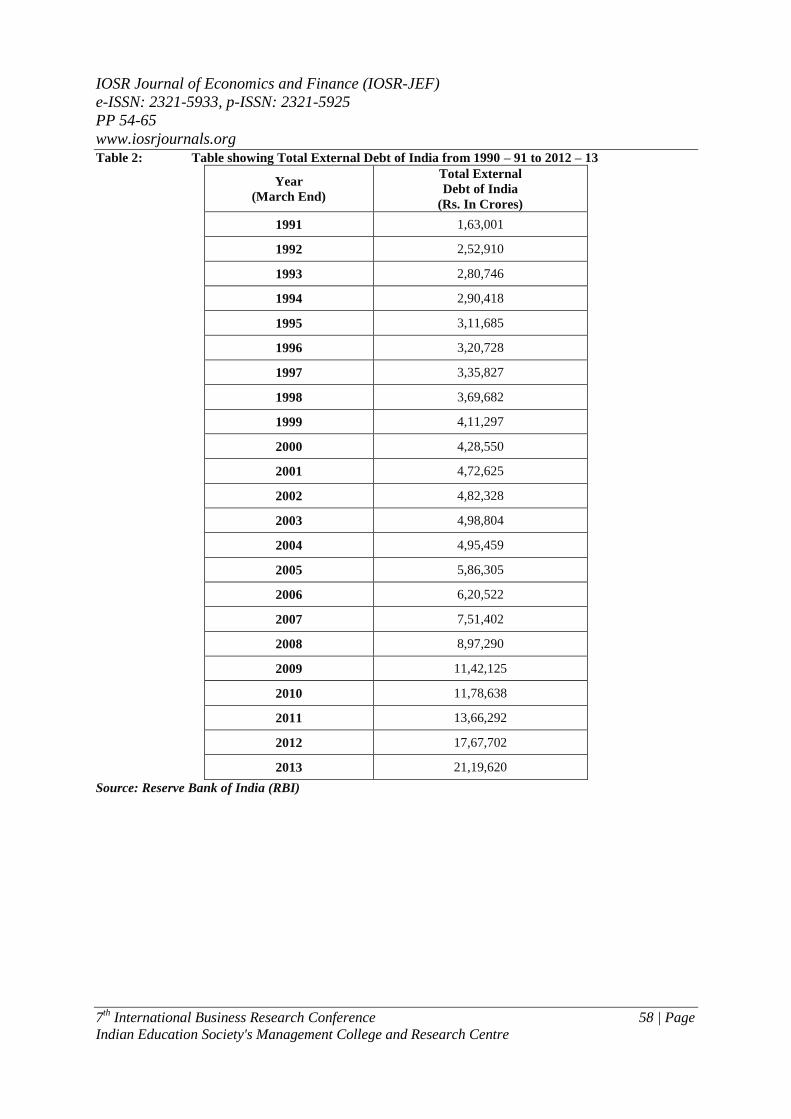
Table 2: Table showing Total External Debt of India from 1990 – 91 to 2012 – 13
Year
(March End)
Total External
Debt of India
(Rs. In Crores)
1991 1,63,001
1992 2,52,910
1993 2,80,746
1994 2,90,418
1995 3,11,685
1996 3,20,728
1997 3,35,827
1998 3,69,682
1999 4,11,297
2000 4,28,550
2001 4,72,625
2002 4,82,328
2003 4,98,804
2004 4,95,459
2005 5,86,305
2006 6,20,522
2007 7,51,402
2008 8,97,290
2009 11,42,125
2010 11,78,638
2011 13,66,292
2012 17,67,702
2013 21,19,620
Source: Reserve Bank of India (RBI)
IOSR Journal of Economics and Finance (IOSR-JEF)
e-ISSN: 2321-5933, p-ISSN: 2321-5925
PP 54-65
www.iosrjournals.org
7th International Business Research Conference 59 | Page
Indian Education Society's Management College and Research Centre
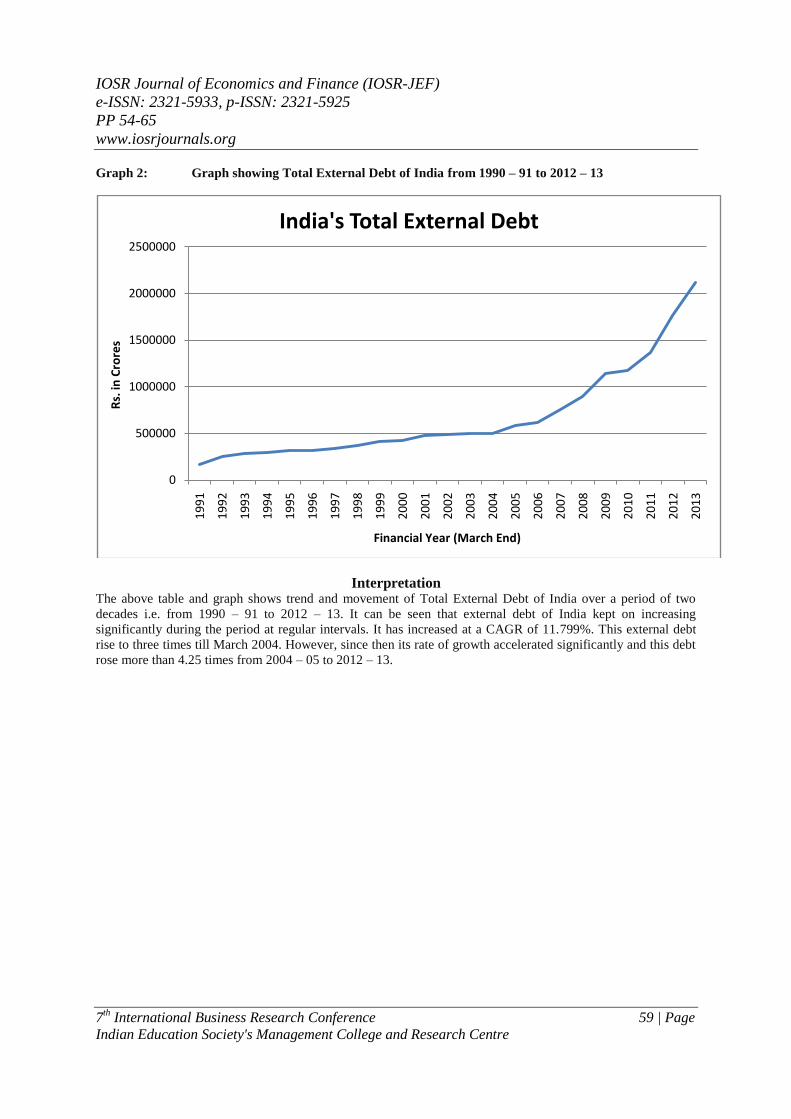
Graph 2: Graph showing Total External Debt of India from 1990 – 91 to 2012 – 13
Interpretation The above table and graph shows trend and movement of Total External Debt of India over a period of two
decades i.e. from 1990 – 91 to 2012 – 13. It can be seen that external debt of India kept on increasing
significantly during the period at regular intervals. It has increased at a CAGR of 11.799%. This external debt
rise to three times till March 2004. However, since then its rate of growth accelerated significantly and this debt
rose more than 4.25 times from 2004 – 05 to 2012 – 13.
0
500000
1000000
1500000
2000000
2500000
19
91
19
92
19
93
19
94
19
95
19
96
19
97
19
98
19
99
20
00
20
01
20
02
20
03
20
04
20
05
20
06
20
07
20
08
20
09
20
10
20
11
20
12
20
13
Rs.
in C
rore
s
Financial Year (March End)
India's Total External Debt
IOSR Journal of Economics and Finance (IOSR-JEF)
e-ISSN: 2321-5933, p-ISSN: 2321-5925
PP 54-65
www.iosrjournals.org
7th International Business Research Conference 60 | Page
Indian Education Society's Management College and Research Centre
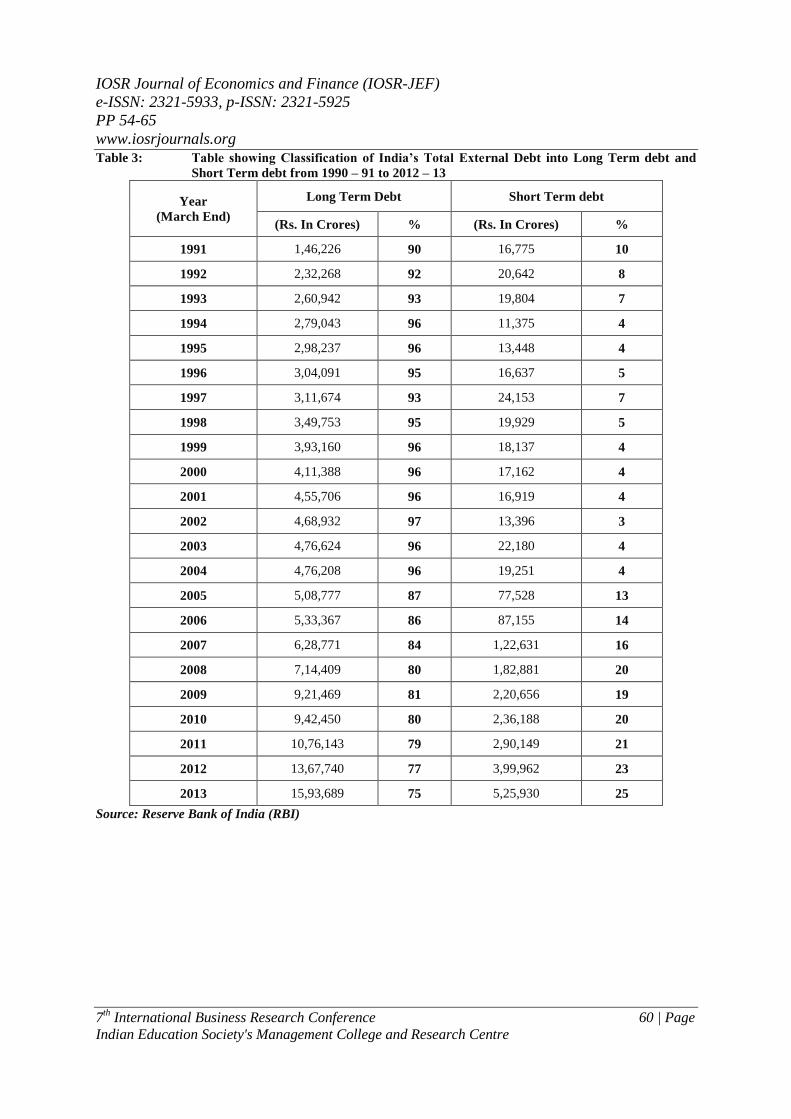
Table 3: Table showing Classification of India’s Total External Debt into Long Term debt and
Short Term debt from 1990 – 91 to 2012 – 13
Year
(March End)
Long Term Debt Short Term debt
(Rs. In Crores) % (Rs. In Crores) %
1991 1,46,226 90 16,775 10
1992 2,32,268 92 20,642 8
1993 2,60,942 93 19,804 7
1994 2,79,043 96 11,375 4
1995 2,98,237 96 13,448 4
1996 3,04,091 95 16,637 5
1997 3,11,674 93 24,153 7
1998 3,49,753 95 19,929 5
1999 3,93,160 96 18,137 4
2000 4,11,388 96 17,162 4
2001 4,55,706 96 16,919 4
2002 4,68,932 97 13,396 3
2003 4,76,624 96 22,180 4
2004 4,76,208 96 19,251 4
2005 5,08,777 87 77,528 13
2006 5,33,367 86 87,155 14
2007 6,28,771 84 1,22,631 16
2008 7,14,409 80 1,82,881 20
2009 9,21,469 81 2,20,656 19
2010 9,42,450 80 2,36,188 20
2011 10,76,143 79 2,90,149 21
2012 13,67,740 77 3,99,962 23
2013 15,93,689 75 5,25,930 25
Source: Reserve Bank of India (RBI)
IOSR Journal of Economics and Finance (IOSR-JEF)
e-ISSN: 2321-5933, p-ISSN: 2321-5925
PP 54-65
www.iosrjournals.org
7th International Business Research Conference 61 | Page
Indian Education Society's Management College and Research Centre
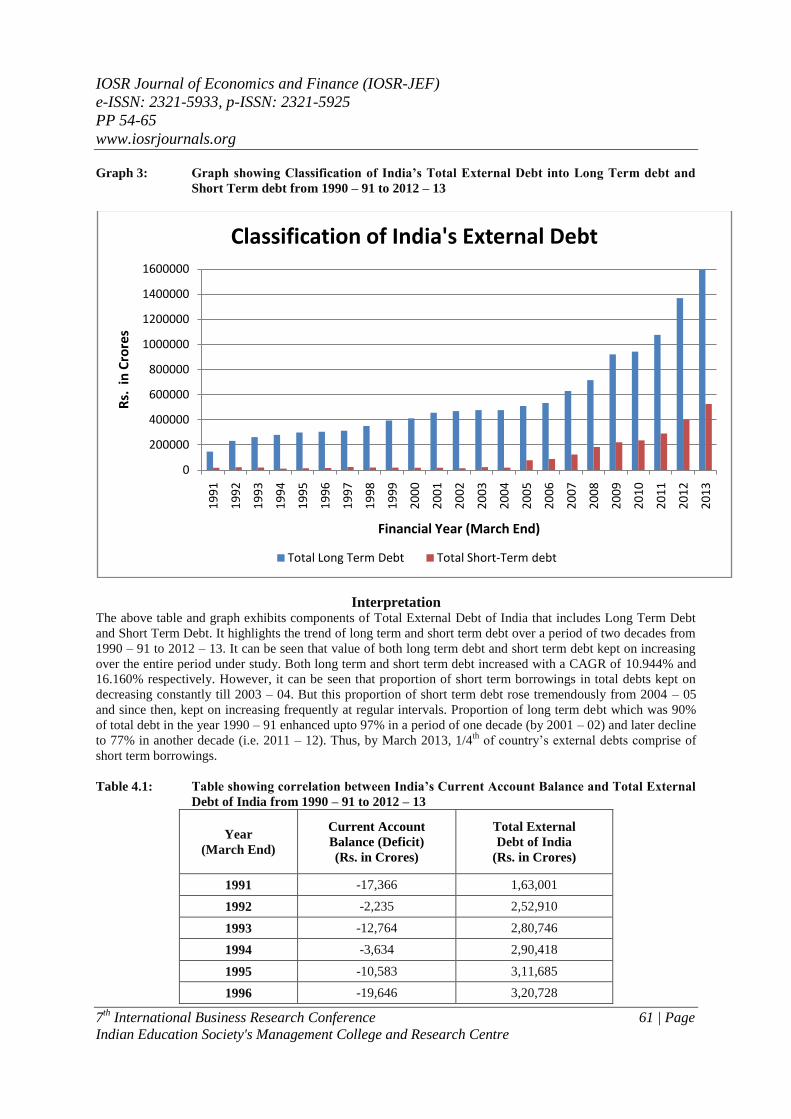
Graph 3: Graph showing Classification of India’s Total External Debt into Long Term debt and
Short Term debt from 1990 – 91 to 2012 – 13
Interpretation The above table and graph exhibits components of Total External Debt of India that includes Long Term Debt
and Short Term Debt. It highlights the trend of long term and short term debt over a period of two decades from
1990 – 91 to 2012 – 13. It can be seen that value of both long term debt and short term debt kept on increasing
over the entire period under study. Both long term and short term debt increased with a CAGR of 10.944% and
16.160% respectively. However, it can be seen that proportion of short term borrowings in total debts kept on
decreasing constantly till 2003 – 04. But this proportion of short term debt rose tremendously from 2004 – 05
and since then, kept on increasing frequently at regular intervals. Proportion of long term debt which was 90%
of total debt in the year 1990 – 91 enhanced upto 97% in a period of one decade (by 2001 – 02) and later decline
to 77% in another decade (i.e. 2011 – 12). Thus, by March 2013, 1/4th of country’s external debts comprise of
short term borrowings.
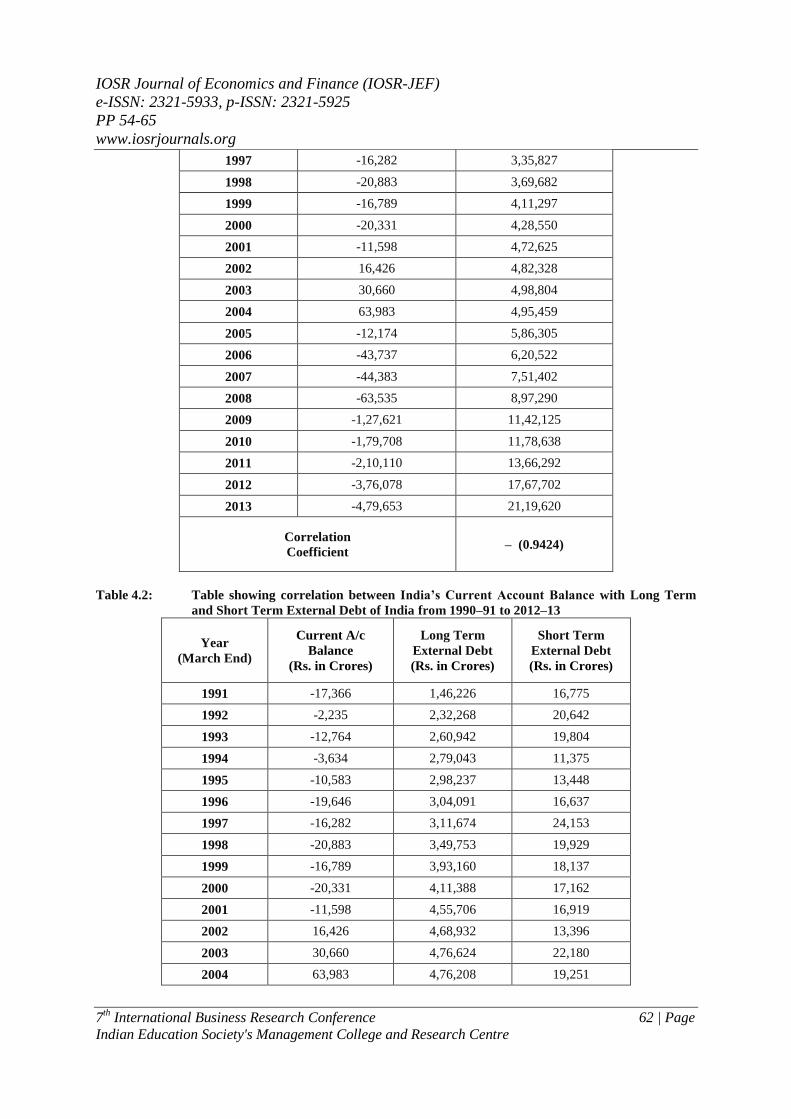
Table 4.1: Table showing correlation between India’s Current Account Balance and Total External
Debt of India from 1990 – 91 to 2012 – 13
Year
(March End)
Current Account
Balance (Deficit)
(Rs. in Crores)
Total External
Debt of India
(Rs. in Crores)
1991 -17,366 1,63,001
1992 -2,235 2,52,910
1993 -12,764 2,80,746
1994 -3,634 2,90,418
1995 -10,583 3,11,685
1996 -19,646 3,20,728
0
200000
400000
600000
800000
1000000
1200000
1400000
1600000
19
91
19
92
19
93
19
94
19
95
19
96
19
97
19
98
19
99
20
00
20
01
20
02
20
03
20
04
20
05
20
06
20
07
20
08
20
09
20
10
20
11
20
12
20
13
Rs.
in
Cro
res
Financial Year (March End)
Classification of India's External Debt
Total Long Term Debt Total Short-Term debt
IOSR Journal of Economics and Finance (IOSR-JEF)
e-ISSN: 2321-5933, p-ISSN: 2321-5925
PP 54-65
www.iosrjournals.org
7th International Business Research Conference 62 | Page
Indian Education Society's Management College and Research Centre
1997 -16,282 3,35,827
1998 -20,883 3,69,682
1999 -16,789 4,11,297
2000 -20,331 4,28,550
2001 -11,598 4,72,625
2002 16,426 4,82,328
2003 30,660 4,98,804
2004 63,983 4,95,459
2005 -12,174 5,86,305
2006 -43,737 6,20,522
2007 -44,383 7,51,402
2008 -63,535 8,97,290
2009 -1,27,621 11,42,125
2010 -1,79,708 11,78,638
2011 -2,10,110 13,66,292
2012 -3,76,078 17,67,702
2013 -4,79,653 21,19,620
Correlation
Coefficient – (0.9424)
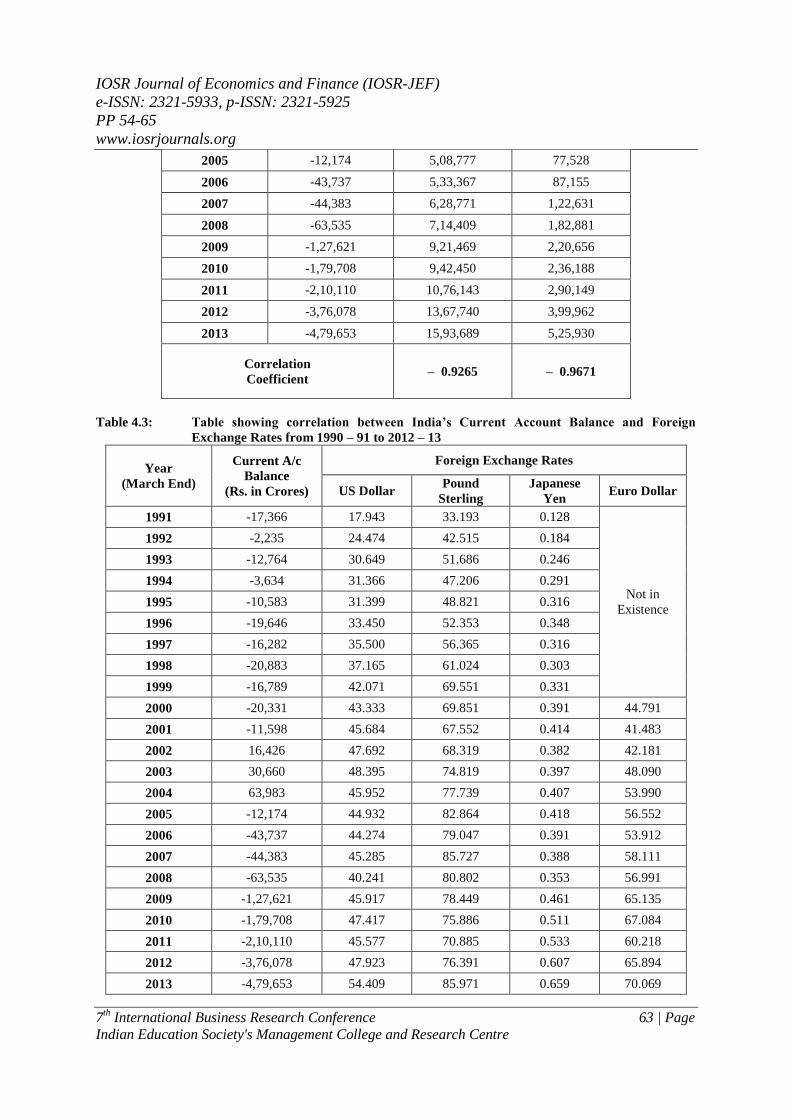
Table 4.2: Table showing correlation between India’s Current Account Balance with Long Term
and Short Term External Debt of India from 1990–91 to 2012–13
Year
(March End)
Current A/c
Balance
(Rs. in Crores)
Long Term
External Debt
(Rs. in Crores)
Short Term
External Debt
(Rs. in Crores)
1991 -17,366 1,46,226 16,775
1992 -2,235 2,32,268 20,642
1993 -12,764 2,60,942 19,804
1994 -3,634 2,79,043 11,375
1995 -10,583 2,98,237 13,448
1996 -19,646 3,04,091 16,637
1997 -16,282 3,11,674 24,153
1998 -20,883 3,49,753 19,929
1999 -16,789 3,93,160 18,137
2000 -20,331 4,11,388 17,162
2001 -11,598 4,55,706 16,919
2002 16,426 4,68,932 13,396
2003 30,660 4,76,624 22,180
2004 63,983 4,76,208 19,251
IOSR Journal of Economics and Finance (IOSR-JEF)
e-ISSN: 2321-5933, p-ISSN: 2321-5925
PP 54-65
www.iosrjournals.org
7th International Business Research Conference 63 | Page
Indian Education Society's Management College and Research Centre
2005 -12,174 5,08,777 77,528
2006 -43,737 5,33,367 87,155
2007 -44,383 6,28,771 1,22,631
2008 -63,535 7,14,409 1,82,881
2009 -1,27,621 9,21,469 2,20,656
2010 -1,79,708 9,42,450 2,36,188
2011 -2,10,110 10,76,143 2,90,149
2012 -3,76,078 13,67,740 3,99,962
2013 -4,79,653 15,93,689 5,25,930
Correlation
Coefficient – 0.9265 – 0.9671
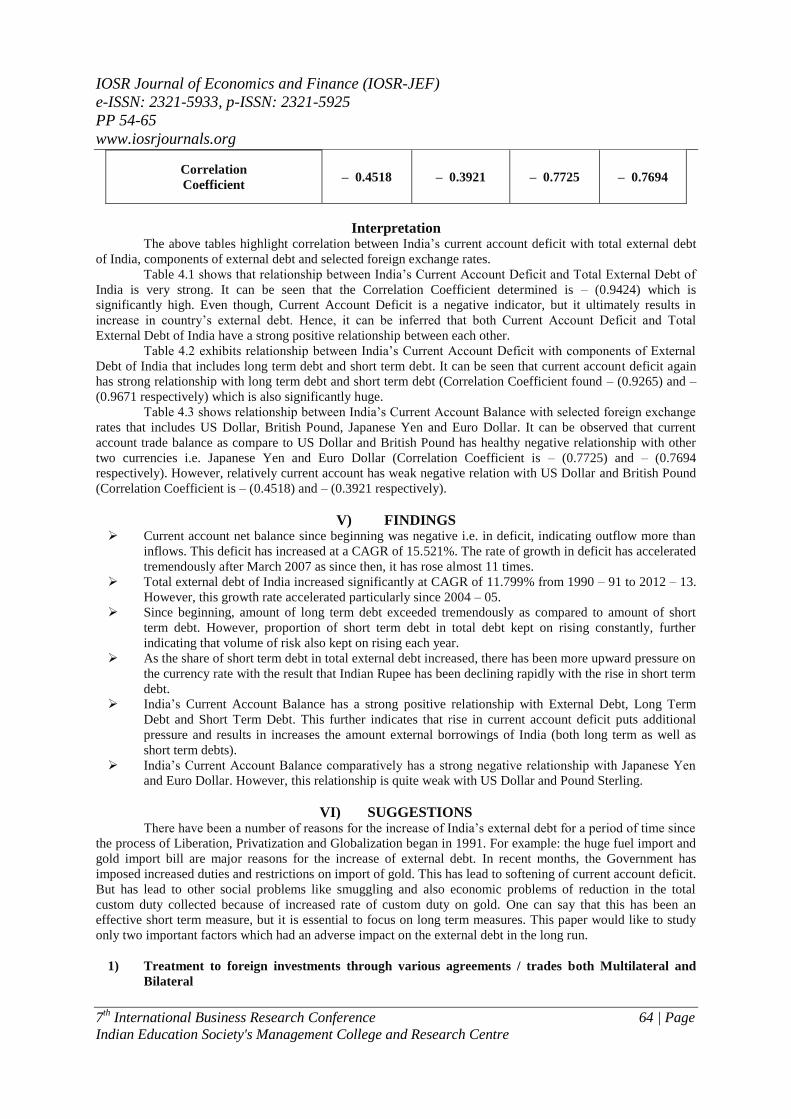
Table 4.3: Table showing correlation between India’s Current Account Balance and Foreign
Exchange Rates from 1990 – 91 to 2012 – 13
Year
(March End)
Current A/c
Balance
(Rs. in Crores)
Foreign Exchange Rates
US Dollar Pound
Sterling
Japanese
Yen Euro Dollar
1991 -17,366 17.943 33.193 0.128
Not in
Existence
1992 -2,235 24.474 42.515 0.184
1993 -12,764 30.649 51.686 0.246
1994 -3,634 31.366 47.206 0.291
1995 -10,583 31.399 48.821 0.316
1996 -19,646 33.450 52.353 0.348
1997 -16,282 35.500 56.365 0.316
1998 -20,883 37.165 61.024 0.303
1999 -16,789 42.071 69.551 0.331
2000 -20,331 43.333 69.851 0.391 44.791
2001 -11,598 45.684 67.552 0.414 41.483
2002 16,426 47.692 68.319 0.382 42.181
2003 30,660 48.395 74.819 0.397 48.090
2004 63,983 45.952 77.739 0.407 53.990
2005 -12,174 44.932 82.864 0.418 56.552
2006 -43,737 44.274 79.047 0.391 53.912
2007 -44,383 45.285 85.727 0.388 58.111
2008 -63,535 40.241 80.802 0.353 56.991
2009 -1,27,621 45.917 78.449 0.461 65.135
2010 -1,79,708 47.417 75.886 0.511 67.084
2011 -2,10,110 45.577 70.885 0.533 60.218
2012 -3,76,078 47.923 76.391 0.607 65.894
2013 -4,79,653 54.409 85.971 0.659 70.069
IOSR Journal of Economics and Finance (IOSR-JEF)
e-ISSN: 2321-5933, p-ISSN: 2321-5925
PP 54-65
www.iosrjournals.org
7th International Business Research Conference 64 | Page
Indian Education Society's Management College and Research Centre
Correlation
Coefficient – 0.4518 – 0.3921 – 0.7725 – 0.7694
Interpretation The above tables highlight correlation between India’s current account deficit with total external debt
of India, components of external debt and selected foreign exchange rates.
Table 4.1 shows that relationship between India’s Current Account Deficit and Total External Debt of
India is very strong. It can be seen that the Correlation Coefficient determined is – (0.9424) which is
significantly high. Even though, Current Account Deficit is a negative indicator, but it ultimately results in
increase in country’s external debt. Hence, it can be inferred that both Current Account Deficit and Total
External Debt of India have a strong positive relationship between each other.
Table 4.2 exhibits relationship between India’s Current Account Deficit with components of External
Debt of India that includes long term debt and short term debt. It can be seen that current account deficit again
has strong relationship with long term debt and short term debt (Correlation Coefficient found – (0.9265) and –
(0.9671 respectively) which is also significantly huge.
Table 4.3 shows relationship between India’s Current Account Balance with selected foreign exchange
rates that includes US Dollar, British Pound, Japanese Yen and Euro Dollar. It can be observed that current
account trade balance as compare to US Dollar and British Pound has healthy negative relationship with other
two currencies i.e. Japanese Yen and Euro Dollar (Correlation Coefficient is – (0.7725) and – (0.7694
respectively). However, relatively current account has weak negative relation with US Dollar and British Pound
(Correlation Coefficient is – (0.4518) and – (0.3921 respectively).
V) FINDINGS Current account net balance since beginning was negative i.e. in deficit, indicating outflow more than
inflows. This deficit has increased at a CAGR of 15.521%. The rate of growth in deficit has accelerated
tremendously after March 2007 as since then, it has rose almost 11 times.
Total external debt of India increased significantly at CAGR of 11.799% from 1990 – 91 to 2012 – 13.
However, this growth rate accelerated particularly since 2004 – 05.
Since beginning, amount of long term debt exceeded tremendously as compared to amount of short
term debt. However, proportion of short term debt in total debt kept on rising constantly, further
indicating that volume of risk also kept on rising each year.
As the share of short term debt in total external debt increased, there has been more upward pressure on
the currency rate with the result that Indian Rupee has been declining rapidly with the rise in short term
debt.
India’s Current Account Balance has a strong positive relationship with External Debt, Long Term
Debt and Short Term Debt. This further indicates that rise in current account deficit puts additional
pressure and results in increases the amount external borrowings of India (both long term as well as
short term debts).
India’s Current Account Balance comparatively has a strong negative relationship with Japanese Yen
and Euro Dollar. However, this relationship is quite weak with US Dollar and Pound Sterling.
VI) SUGGESTIONS There have been a number of reasons for the increase of India’s external debt for a period of time since
the process of Liberation, Privatization and Globalization began in 1991. For example: the huge fuel import and
gold import bill are major reasons for the increase of external debt. In recent months, the Government has
imposed increased duties and restrictions on import of gold. This has lead to softening of current account deficit.
But has lead to other social problems like smuggling and also economic problems of reduction in the total
custom duty collected because of increased rate of custom duty on gold. One can say that this has been an
effective short term measure, but it is essential to focus on long term measures. This paper would like to study
only two important factors which had an adverse impact on the external debt in the long run.
1) Treatment to foreign investments through various agreements / trades both Multilateral and
Bilateral
IOSR Journal of Economics and Finance (IOSR-JEF)
e-ISSN: 2321-5933, p-ISSN: 2321-5925
PP 54-65
www.iosrjournals.org
7th International Business Research Conference 65 | Page
Indian Education Society's Management College and Research Centre
In its eagerness to attract foreign capital, India like many other developing countries has entered into
various agreements. India has signed Bilateral Investment Promotion and Protection Agreements
(BIPAS) with almost 82 countries. It is only recently, that it has woken up to the disproportionate
protection extended to foreign investments which helps to keep out Government intervention. Foreign
capital has exploited these agreements for its own benefits. Thus, there is a need to properly review this
agreements so that foreign and local capital are treated at par and the Indian public interest is kept as
the objective of entering into various agreements rather than just protecting foreign investments.
2) Illegal capital flight or illegal financial flows
Illegal capital flight is no more a mere social problem related to corruption. It is first and foremost an
economic problem responsible to a great extent for the bulging external debt faced by India and other
developing countries. It has been observed that the illicit outflows have increased faster in the post reform
period leading to the increase in the external debt of the country. These illicit outflows are carried out in
different ways especially through export under invoicing and import over invoicing by Indians in trade and
industry. Also abusive transfer pricing has been responsible to a large external for the illicit flows.
The external debt increase has become a core economic imbalance and it is true that there are no short
term answers to fix this problem. The problem of external debt is further compounded by the problem of
inflation. Inflation leads to further increase in the national debt of the government. This paper does not claim to
give detailed solution to the problem of external debt; but has highlighted two major problems responsible for
the ever increasing foreign debt and the urgent need to tackle them.
REFERENCES [1] Aswathappa K., International Business, Tata McGraw Hill Education Private Ltd, New Delhi, 4th Edition 2010.
[2] Rajwade A. V., Foreign Exchange International Finance Risk Management, Academy of Business Studies, New
Delhi, 4th Edition 2004.
[3] www.indiastat.com
[4] www.rbi.org
[5] www.x-rates.com