Effect of increased pCO2 level on early shell development in great ...
24
Biogeosciences, 10, 6161–6184, 2013 www.biogeosciences.net/10/6161/2013/ doi:10.5194/bg-10-6161-2013 © Author(s) 2013. CC Attribution 3.0 License. Biogeosciences Open Access Effect of increased pCO 2 level on early shell development in great scallop (Pecten maximus Lamarck) larvae S. Andersen 1 , E. S. Grefsrud 2 , and T. Harboe 1 1 Institute of Marine Research, Austevoll Research Station, 5392 Storebø, Norway 2 Institute of Marine Research, Postbox 1870 Nordnes, 5817 Bergen, Norway Correspondence to: S. Andersen ([email protected]) Received: 25 January 2013 – Published in Biogeosciences Discuss.: 22 February 2013 Revised: 16 August 2013 – Accepted: 22 August 2013 – Published: 1 October 2013 Abstract. As a result of high anthropogenic CO 2 emissions, the concentration of CO 2 in the oceans has increased, caus- ing a decrease in pH, known as ocean acidification (OA). Nu- merous studies have shown negative effects on marine inver- tebrates, and also that the early life stages are the most sen- sitive to OA. We studied the effects of OA on embryos and unfed larvae of the great scallop (Pecten maximus Lamarck), at pCO 2 levels of 469 (ambient), 807, 1164, and 1599 μatm until seven days after fertilization. To our knowledge, this is the first study on OA effects on larvae of this species. A drop in pCO 2 level the first 12 h was observed in the ele- vated pCO 2 groups due to a discontinuation in water flow to avoid escape of embryos. When the flow was restarted, pCO 2 level stabilized and was significantly different between all groups. OA affected both survival and shell growth nega- tively after seven days. Survival was reduced from 45% in the ambient group to 12 % in the highest pCO 2 group. Shell length and height were reduced by 8 and 15%, respectively, when pCO 2 increased from ambient to 1599 μatm. Develop- ment of normal hinges was negatively affected by elevated pCO 2 levels in both trochophore larvae after two days and veliger larvae after seven days. After seven days, deformities in the shell hinge were more connected to elevated pCO 2 lev- els than deformities in the shell edge. Embryos stained with calcein showed fluorescence in the newly formed shell area, indicating calcification of the shell at the early trochophore stage between one and two days after fertilization. Our re- sults show that P. maximus embryos and early larvae may be negatively affected by elevated pCO 2 levels within the range of what is projected towards year 2250, although the initial drop in pCO 2 level may have overestimated the effect of the highest pCO 2 levels. Future work should focus on long-term effects on this species from hatching, throughout the larval stages, and further into the juvenile and adult stages. 1 Introduction The increase of anthropogenic CO 2 emissions since the in- dustrial revolution has lead to an increase of carbon diox- ide (CO 2 ) concentration and a decrease in pH in the oceans termed as ocean acidification (OA). Over the next 50–100 yr the CO 2 values are projected to reach 700 ppm (Zondervan et al., 2001; IPCC, 2001). Caldeira and Wickett (2003) showed through their geochemical model that with no reduction in fossil fuel emission of CO 2 into the atmosphere, there may be a rapid decline in pH in surface ocean waters over the next 100 yr of as much as 0.4 units (a doubling of H + -ion concen- tration). And within less than 250 yr the ocean surface pH may drop as much as 0.7 units, which may be the lowest pH value experienced during the last 300 million years (Caldeira and Wickett, 2003). Depending on their distribution and habitats, marine or- ganisms are exposed to various levels of pH fluctuations. In general, deep-sea species live in a more stable environment compared to shallow-living species that experience both sea- sonal and daily fluctuations in physio-chemical water param- eters. In areas with natural high CO 2 supply (upwelling of deep-sea CO 2 -rich water and volcanic CO 2 vents) marine organisms are exposed to seawater CO 2 values as high as 2000 ppm, corresponding to a pH of 7.4–7.5 (Hall-Spencer et al., 2008; Thomsen et al., 2010). Some organisms can experi- ence even lower pH values in nature, as shown for the oyster Ostrea chilensis (Chaparro et al., 2009). During valve closure Published by Copernicus Publications on behalf of the European Geosciences Union.
Transcript of Effect of increased pCO2 level on early shell development in great ...
Biogeosciences, 10, 6161–6184, 2013www.biogeosciences.net/10/6161/2013/doi:10.5194/bg-10-6161-2013© Author(s) 2013. CC Attribution 3.0 License.
Biogeosciences
Open A
ccess
Effect of increasedpCO2 level on early shell development in greatscallop (Pecten maximusLamarck) larvae
S. Andersen1, E. S. Grefsrud2, and T. Harboe1
1Institute of Marine Research, Austevoll Research Station, 5392 Storebø, Norway2Institute of Marine Research, Postbox 1870 Nordnes, 5817 Bergen, Norway
Correspondence to:S. Andersen ([email protected])
Received: 25 January 2013 – Published in Biogeosciences Discuss.: 22 February 2013Revised: 16 August 2013 – Accepted: 22 August 2013 – Published: 1 October 2013
Abstract. As a result of high anthropogenic CO2 emissions,the concentration of CO2 in the oceans has increased, caus-ing a decrease in pH, known as ocean acidification (OA). Nu-merous studies have shown negative effects on marine inver-tebrates, and also that the early life stages are the most sen-sitive to OA. We studied the effects of OA on embryos andunfed larvae of the great scallop (Pecten maximusLamarck),at pCO2 levels of 469 (ambient), 807, 1164, and 1599 µatmuntil seven days after fertilization. To our knowledge, thisis the first study on OA effects on larvae of this species. Adrop in pCO2 level the first 12 h was observed in the ele-vatedpCO2 groups due to a discontinuation in water flow toavoid escape of embryos. When the flow was restarted,pCO2level stabilized and was significantly different between allgroups. OA affected both survival and shell growth nega-tively after seven days. Survival was reduced from 45 % inthe ambient group to 12 % in the highestpCO2 group. Shelllength and height were reduced by 8 and 15 %, respectively,whenpCO2 increased from ambient to 1599 µatm. Develop-ment of normal hinges was negatively affected by elevatedpCO2 levels in both trochophore larvae after two days andveliger larvae after seven days. After seven days, deformitiesin the shell hinge were more connected to elevatedpCO2 lev-els than deformities in the shell edge. Embryos stained withcalcein showed fluorescence in the newly formed shell area,indicating calcification of the shell at the early trochophorestage between one and two days after fertilization. Our re-sults show thatP. maximusembryos and early larvae may benegatively affected by elevatedpCO2 levels within the rangeof what is projected towards year 2250, although the initialdrop inpCO2 level may have overestimated the effect of thehighestpCO2 levels. Future work should focus on long-term
effects on this species from hatching, throughout the larvalstages, and further into the juvenile and adult stages.
1 Introduction
The increase of anthropogenic CO2 emissions since the in-dustrial revolution has lead to an increase of carbon diox-ide (CO2) concentration and a decrease in pH in the oceanstermed as ocean acidification (OA). Over the next 50–100 yrthe CO2 values are projected to reach 700 ppm (Zondervan etal., 2001; IPCC, 2001). Caldeira and Wickett (2003) showedthrough their geochemical model that with no reduction infossil fuel emission of CO2 into the atmosphere, there maybe a rapid decline in pH in surface ocean waters over the next100 yr of as much as 0.4 units (a doubling of H+-ion concen-tration). And within less than 250 yr the ocean surface pHmay drop as much as 0.7 units, which may be the lowest pHvalue experienced during the last 300 million years (Caldeiraand Wickett, 2003).
Depending on their distribution and habitats, marine or-ganisms are exposed to various levels of pH fluctuations. Ingeneral, deep-sea species live in a more stable environmentcompared to shallow-living species that experience both sea-sonal and daily fluctuations in physio-chemical water param-eters. In areas with natural high CO2 supply (upwelling ofdeep-sea CO2-rich water and volcanic CO2 vents) marineorganisms are exposed to seawater CO2 values as high as2000 ppm, corresponding to a pH of 7.4–7.5 (Hall-Spencer etal., 2008; Thomsen et al., 2010). Some organisms can experi-ence even lower pH values in nature, as shown for the oysterOstrea chilensis(Chaparro et al., 2009). During valve closure
Published by Copernicus Publications on behalf of the European Geosciences Union.
6162 S. Andersen et al.: Effect of increasedpCO2 level on early shell development in great scallop
and isolation of the brood chamber, the brooded veligerswere exposed to pH values as low as 7.0.
Although many marine organisms show a high toleranceto variations in pH, several experimental studies conductedover the last decade have shown negative effects of OA, es-pecially on calcifying organisms (Kroeker et al., 2010). Theeffects of elevated CO2 levels are shown on a range of ma-rine invertebrates (embryonic and larval development in ma-rine molluscs – Byrne, 2012; Ericson et al., 2010; Gaylordet al., 2011; Gazeau et al., 2011, Kurihara, 2008; Kurihara etal., 2007, 2008; Waldbusser et al., 2010; and effect on otherinvertebrates – Bechmann et al., 2011; Dupont et al., 2010;Jury et al., 2010; Comeau et al., 2009, 2010; Ries et al., 2009;Hoegh-Guldberg et al., 2007; Pane and Barry, 2007). Espe-cially larval stages of bivalves seem to be extremely sensitiveto enhanced levels of CO2 (Fabry et al., 2008; Talmage andGobler, 2009, 2010, 2011), and most studies have shown adecrease in survival, shell growth, and normal larval devel-opment. Some studies have also shown a negative effect onshell thickness and strength (Chaparro et al., 2009; Gaylordet al., 2011; Welladsen et al., 2010), calcification (Ries et al.,2009; Waldbusser et al., 2010; Range et al., 2011), lipid syn-thesis (Talmage and Gobler, 2011), and energy stores (Dick-inson et al., 2012). The high sensitivity of bivalve larvae maybe connected to the carbonate composition of the larval shell.A mollusc’s larval shell contains mainly aragonite, the mostsoluble form of crystalline calcium carbonate (Weiss et al.,2002; Kudo et al., 2010; Barros et al., 2013). The predictedundersaturation of aragonite in the world’s oceans may havea great negative impact on these calcifying organisms (Orr etal., 2005; Raven et al., 2005).
The numerous reports on effects of OA are slowly build-ing up a picture of how marine coastal ecosystems may beaffected (biodiversity, functioning, and service) in the fu-ture (Raven et al., 2005). It is crucial to gain more knowl-edge about the effects on different marine organisms in orderto get realistic projections of future changes of the marinefood web. A negative effect on early life stages may not onlybe detrimental to recruitment and endanger the species sur-vival but also result in economic loss due to a collapse inglobal shellfish aquaculture production (Gazeau et al., 2010).Together with mussels and oysters, several scallop speciesare economically important in global aquaculture production(Bourne, 2000; FAO, 2010) in addition to being importantcalcifiers in the marine ecosystem.
The great scallopPecten maximusLamarck is distributedfrom the Iberian Peninsula in the south up to Lofoten in Nor-way in the north, and is found in highest abundances at 5–50 m depth in shell sand areas (Strand and Parsons, 2006).The larvae are pelagic for about 15–32 days at temperaturesof 15–18◦C (Comely, 1972; Le Pennec et al., 2003). Thegreat scallop is a highly valued sea food product, and hasbeen cultured for more than 25 yr in Norway. The extendedresearch efforts during the same period make it an excel-lent candidate for OA studies (Andersen et al., 2011). To our
knowledge, only the study of Schalkhausser et al. (2012) hasshown the effect of OA onP. maximus. They found a negativeeffect of OA on adultP. maximusshell-clapping performanceand aerobic scope. However, no studies have focused on theeffect of OA onP. maximuslarvae. Studies on other scallopspecies asArgopecten irradians, Placopecten magellanicusandChlamys nobilisshow a negative effect of increased pHin most life stages, including fertilization, embryos, larvae,and juveniles (Desrosiers et al., 1996; Talmage and Gobler,2009, 2010, 2011; Liu and He, 2012).
Most OA studies on mollusc larvae focus on effects onshell formation (Kurihara et al., 2007, 2008; Kurihara, 2008;Ericson et al., 2010; Waldbusser et al., 2010; Byrne, 2012;Gaylord et al., 2011; Gazeau et al., 2011). The shell that startsto evolve at the trochophore stage consists of proteins (Bel-lioli et al., 1993; Casse et al., 1998). Onset of calcificationin the initial organic larval shell was detected during the tro-chophore larval stage inMercenaria mercenariaandCras-sostrea gigaslarvae (Weiss et al., 2002). Casse et al. (1998)did not detect calcification inP. maximustrochophores, andaccording to Cragg (2006) it is likely that there is initiallylittle or no calcification in pectinid larvae, but that the calci-fication starts within less than a day after the initial shell for-mation. If calcification is the actual process being affected,effects on the shell formation should be detected only afterthe stage when the calcification starts. The onset of calcifica-tion can be determined by the use of an epifluorescent dye,calcein, which binds to calcium in metabolically active indi-viduals (Körbl and Vydra, 1958; Day et al., 1995; Lucas etal., 2008; Chaparro et al., 2009).
The aim of the present study was to report the effect of el-evated CO2 levels on scallopP. maximusLamarck larvae sur-vival, shell size, and shell development from fertilized eggsto 7-day-old veligers. The exact initiation of calcification inP. maximuslarvae is still unknown, and thus a pilot studyusing calcein staining as a method to elucidate this questionwas also conducted.
2 Material and methods
Local broodstock were collected in January 2012 from theouter Hardangerfjorden, located on the south-western coastof Norway. Ten scallops were conditioned for eight weeksat 12.0–12.5◦C and fed 13–15 cells µL−1 of a standard dietcontaining Isochrysis galbana(Tahitian), Pavlova lutheriandChaetoceros mulleri(Andersen et al., 2011). Spawningwas induced on 21 March by increasing the temperature to16–17◦C. Pecten maximusis a simultaneous hermaphrodite,and some sperm will remain in the genital tract, result-ing in self-fertilization (Mackie, 1984). Self-fertilization ratewas checked before cross-fertilization, and egg batches withless than 10 % self-fertilization were used in the experi-ment. Eggs from one individual were cross-fertilized withsperm from three other individuals. Egg : sperm ratio was
Biogeosciences, 10, 6161–6184, 2013 www.biogeosciences.net/10/6161/2013/
S. Andersen et al.: Effect of increasedpCO2 level on early shell development in great scallop 6163
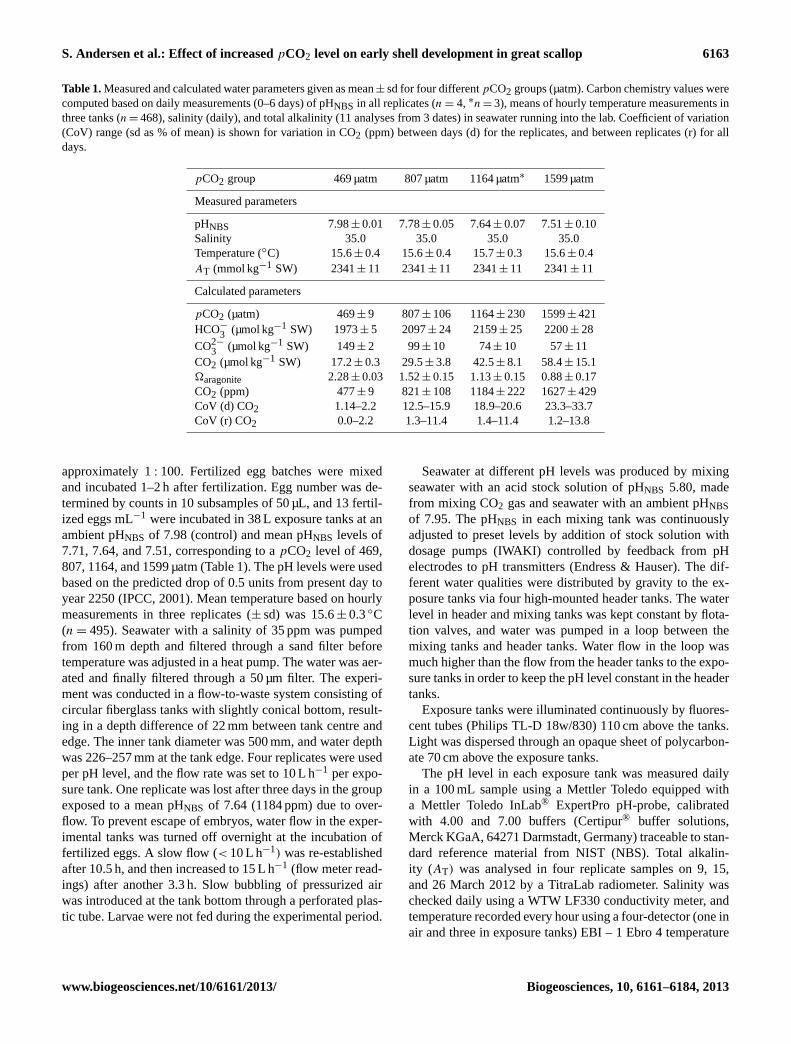
Table 1.Measured and calculated water parameters given as mean± sd for four differentpCO2 groups (µatm). Carbon chemistry values werecomputed based on daily measurements (0–6 days) of pHNBS in all replicates (n = 4, ∗n = 3), means of hourly temperature measurements inthree tanks (n = 468), salinity (daily), and total alkalinity (11 analyses from 3 dates) in seawater running into the lab. Coefficient of variation(CoV) range (sd as % of mean) is shown for variation in CO2 (ppm) between days (d) for the replicates, and between replicates (r) for alldays.
pCO2 group 469 µatm 807 µatm 1164 µatm∗ 1599 µatm
Measured parameters
pHNBS 7.98± 0.01 7.78± 0.05 7.64± 0.07 7.51± 0.10Salinity 35.0 35.0 35.0 35.0Temperature (◦C) 15.6± 0.4 15.6± 0.4 15.7± 0.3 15.6± 0.4AT (mmol kg−1 SW) 2341± 11 2341± 11 2341± 11 2341± 11
Calculated parameters
pCO2 (µatm) 469± 9 807± 106 1164± 230 1599± 421HCO−
3 (µmol kg−1 SW) 1973± 5 2097± 24 2159± 25 2200± 28
CO2−
3 (µmol kg−1 SW) 149± 2 99± 10 74± 10 57± 11CO2 (µmol kg−1 SW) 17.2± 0.3 29.5± 3.8 42.5± 8.1 58.4± 15.1�aragonite 2.28± 0.03 1.52± 0.15 1.13± 0.15 0.88± 0.17CO2 (ppm) 477± 9 821± 108 1184± 222 1627± 429CoV (d) CO2 1.14–2.2 12.5–15.9 18.9–20.6 23.3–33.7CoV (r) CO2 0.0–2.2 1.3–11.4 1.4–11.4 1.2–13.8
approximately 1: 100. Fertilized egg batches were mixedand incubated 1–2 h after fertilization. Egg number was de-termined by counts in 10 subsamples of 50 µL, and 13 fertil-ized eggs mL−1 were incubated in 38 L exposure tanks at anambient pHNBS of 7.98 (control) and mean pHNBS levels of7.71, 7.64, and 7.51, corresponding to apCO2 level of 469,807, 1164, and 1599 µatm (Table 1). The pH levels were usedbased on the predicted drop of 0.5 units from present day toyear 2250 (IPCC, 2001). Mean temperature based on hourlymeasurements in three replicates (± sd) was 15.6± 0.3◦C(n = 495). Seawater with a salinity of 35 ppm was pumpedfrom 160 m depth and filtered through a sand filter beforetemperature was adjusted in a heat pump. The water was aer-ated and finally filtered through a 50 µm filter. The experi-ment was conducted in a flow-to-waste system consisting ofcircular fiberglass tanks with slightly conical bottom, result-ing in a depth difference of 22 mm between tank centre andedge. The inner tank diameter was 500 mm, and water depthwas 226–257 mm at the tank edge. Four replicates were usedper pH level, and the flow rate was set to 10 L h−1 per expo-sure tank. One replicate was lost after three days in the groupexposed to a mean pHNBS of 7.64 (1184 ppm) due to over-flow. To prevent escape of embryos, water flow in the exper-imental tanks was turned off overnight at the incubation offertilized eggs. A slow flow (< 10 L h−1) was re-establishedafter 10.5 h, and then increased to 15 L h−1 (flow meter read-ings) after another 3.3 h. Slow bubbling of pressurized airwas introduced at the tank bottom through a perforated plas-tic tube. Larvae were not fed during the experimental period.
Seawater at different pH levels was produced by mixingseawater with an acid stock solution of pHNBS 5.80, madefrom mixing CO2 gas and seawater with an ambient pHNBSof 7.95. The pHNBS in each mixing tank was continuouslyadjusted to preset levels by addition of stock solution withdosage pumps (IWAKI) controlled by feedback from pHelectrodes to pH transmitters (Endress & Hauser). The dif-ferent water qualities were distributed by gravity to the ex-posure tanks via four high-mounted header tanks. The waterlevel in header and mixing tanks was kept constant by flota-tion valves, and water was pumped in a loop between themixing tanks and header tanks. Water flow in the loop wasmuch higher than the flow from the header tanks to the expo-sure tanks in order to keep the pH level constant in the headertanks.
Exposure tanks were illuminated continuously by fluores-cent tubes (Philips TL-D 18w/830) 110 cm above the tanks.Light was dispersed through an opaque sheet of polycarbon-ate 70 cm above the exposure tanks.
The pH level in each exposure tank was measured dailyin a 100 mL sample using a Mettler Toledo equipped witha Mettler Toledo InLab® ExpertPro pH-probe, calibratedwith 4.00 and 7.00 buffers (Certipur® buffer solutions,Merck KGaA, 64271 Darmstadt, Germany) traceable to stan-dard reference material from NIST (NBS). Total alkalin-ity (AT) was analysed in four replicate samples on 9, 15,and 26 March 2012 by a TitraLab radiometer. Salinity waschecked daily using a WTW LF330 conductivity meter, andtemperature recorded every hour using a four-detector (one inair and three in exposure tanks) EBI – 1 Ebro 4 temperature
www.biogeosciences.net/10/6161/2013/ Biogeosciences, 10, 6161–6184, 2013
6164 S. Andersen et al.: Effect of increasedpCO2 level on early shell development in great scallop
logger. ThepCO2 values (µatm) corresponding to the pHNBSvalues were calculated from the daily average temperature(◦C) based on hourly recordings, salinity,AT and pH usingthe macros in Ernie Lewis’ “CO2SYS.BAS” basic program(Pierrot et al., 2006).
Larvae samples were taken after carefully stirring frombottom to top using a plunger. A 50 mm diameter pipe waslowered to the bottom, and both ends were plugged beforethe pipe was pulled out of the water, collecting a volume of400 mL. On day 2 a volume of 800 mL from each replicatewas withdrawn to measure shell size and classify larval de-formities. When terminating the experiment after seven days,all tanks were drained and a total sample from each replicatewas collected and preserved to determine final shell size, sur-vival, and classify deformities. To determine timing of shellcalcification, larvae from ambient pH in an additional tankwere stained for 18–20 h from day 1 to day 2.
When collected for preservation, embryos and larvae wereretained on a 35 µm mesh screen and preserved in 4 % for-malin (diluted from 36.5 % formaldehyde solution, Sigma-Aldrich, cat. no. 33220) in PSB for two hours, rinsed twicein 70 % ethanol, and then kept in 70 % ethanol until the ra-tio of developmental stages was investigated. The formalinwas made from mixing 8.14 g of disodium hydrogen phos-phate dihydrate (Na2HPO4 · 2H2O, Merck 1.06580.1000)and 4.00 g of sodium dihydrogen phosphate monohydrate(NaH2PO4 · H2O, Merck 1.06346.1000) with 100 mL of37 % formalin in 900 mL of distilled water.
A calcein stock solution was made from mixing 1 g ofcalcein (Sigma C0875-5G) in 1 L of distilled water adjustedto pHNBS 7.0 using a sodium bicarbonate (NaHCO3, Merck1.06329.1000) solution of 2.4 g in 400 mL of distilled water(Moran, 2000; Moran and Marko, 2005; Fitzpatrick et al.,2010). For staining of calcium, 20 mL of calcein stock so-lution was added to 400 mL of seawater with larvae, givinga final calcein concentration of 22 mg L−1. Only larvae atambient pHNBS were stained, as the aim of this pilot studywas to elucidate when the calcification of the larvae shellis normally initiated. We assumed that the pH was not af-fected during staining since the calcein stock solution wasless than 5 % of the total water volume; however the pH wasnot measured. Calcein has little or no effect on mollusc larvaesurvival or growth (Moran, 2000; Moran and Marko, 2005;Chick, 2010; Fitzpatrick et al., 2010).
Live (calcein stained) and preserved larvae were pho-tographed using a Canon EOS 5D Mark II camera attachedto an Olympus BX60 microscope. Final shell length (paral-lel to the hinge) and height (perpendicular to the hinge) weremeasured in 21–60 individuals to the nearest 4.8 µm fromprinted photographs. Survival was based on the initial num-ber of fertilized eggs, and was estimated by concentrating allday-7 larvae in 25–110 mL and counting the number in 10subsamples of 50 µL. Preserved larvae photographed at 100magnifications using bright field were classified according toshell shape and counted. The number of trochophores classi-
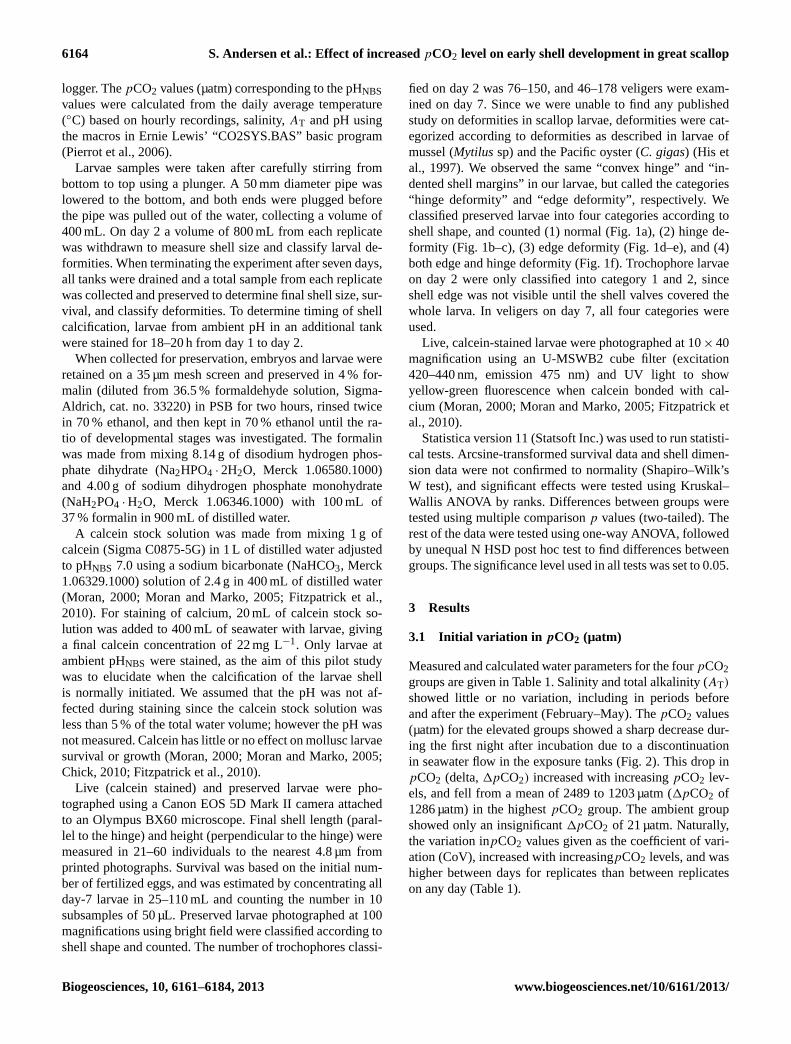
fied on day 2 was 76–150, and 46–178 veligers were exam-ined on day 7. Since we were unable to find any publishedstudy on deformities in scallop larvae, deformities were cat-egorized according to deformities as described in larvae ofmussel (Mytilus sp) and the Pacific oyster (C. gigas) (His etal., 1997). We observed the same “convex hinge” and “in-dented shell margins” in our larvae, but called the categories“hinge deformity” and “edge deformity”, respectively. Weclassified preserved larvae into four categories according toshell shape, and counted (1) normal (Fig. 1a), (2) hinge de-formity (Fig. 1b–c), (3) edge deformity (Fig. 1d–e), and (4)both edge and hinge deformity (Fig. 1f). Trochophore larvaeon day 2 were only classified into category 1 and 2, sinceshell edge was not visible until the shell valves covered thewhole larva. In veligers on day 7, all four categories wereused.
Live, calcein-stained larvae were photographed at 10× 40magnification using an U-MSWB2 cube filter (excitation420–440 nm, emission 475 nm) and UV light to showyellow-green fluorescence when calcein bonded with cal-cium (Moran, 2000; Moran and Marko, 2005; Fitzpatrick etal., 2010).
Statistica version 11 (Statsoft Inc.) was used to run statisti-cal tests. Arcsine-transformed survival data and shell dimen-sion data were not confirmed to normality (Shapiro–Wilk’sW test), and significant effects were tested using Kruskal–Wallis ANOVA by ranks. Differences between groups weretested using multiple comparisonp values (two-tailed). Therest of the data were tested using one-way ANOVA, followedby unequal N HSD post hoc test to find differences betweengroups. The significance level used in all tests was set to 0.05.
3 Results
3.1 Initial variation in pCO2 (µatm)
Measured and calculated water parameters for the fourpCO2groups are given in Table 1. Salinity and total alkalinity (AT)
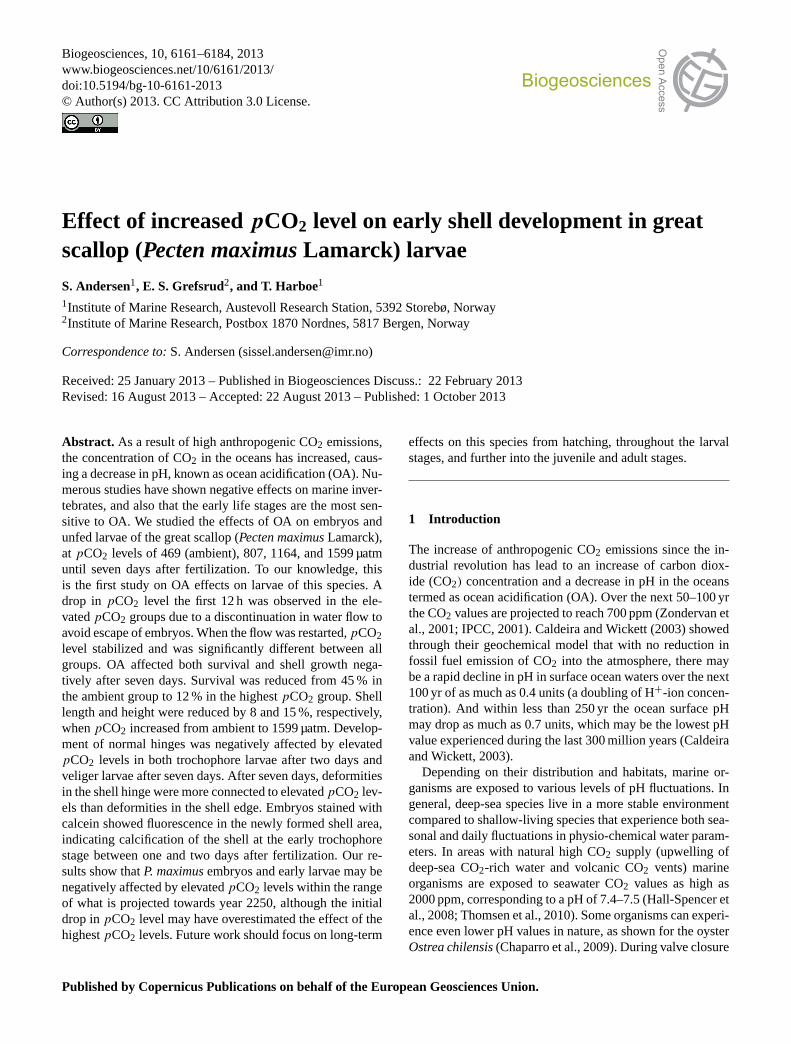
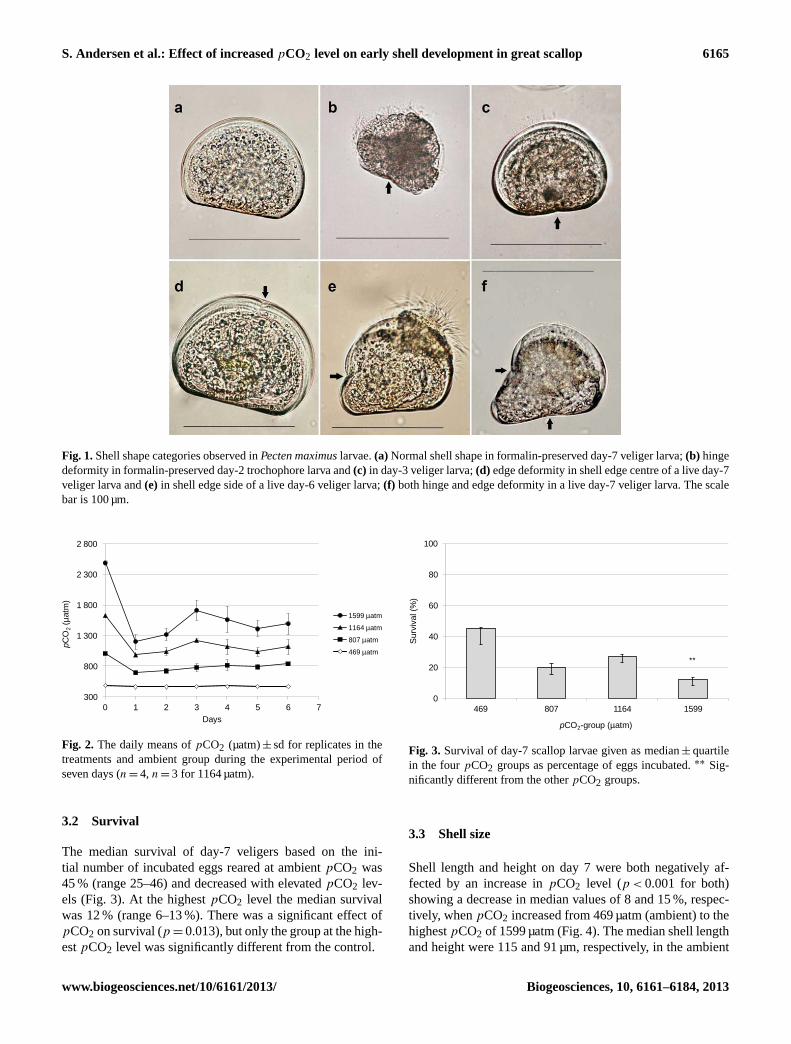
showed little or no variation, including in periods beforeand after the experiment (February–May). ThepCO2 values(µatm) for the elevated groups showed a sharp decrease dur-ing the first night after incubation due to a discontinuationin seawater flow in the exposure tanks (Fig. 2). This drop inpCO2 (delta,1pCO2) increased with increasingpCO2 lev-els, and fell from a mean of 2489 to 1203 µatm (1pCO2 of1286 µatm) in the highestpCO2 group. The ambient groupshowed only an insignificant1pCO2 of 21 µatm. Naturally,the variation inpCO2 values given as the coefficient of vari-ation (CoV), increased with increasingpCO2 levels, and washigher between days for replicates than between replicateson any day (Table 1).
Biogeosciences, 10, 6161–6184, 2013 www.biogeosciences.net/10/6161/2013/
S. Andersen et al.: Effect of increasedpCO2 level on early shell development in great scallop 6165
Figure 1.
Fig. 1.Shell shape categories observed inPecten maximuslarvae.(a) Normal shell shape in formalin-preserved day-7 veliger larva;(b) hingedeformity in formalin-preserved day-2 trochophore larva and(c) in day-3 veliger larva;(d) edge deformity in shell edge centre of a live day-7veliger larva and(e) in shell edge side of a live day-6 veliger larva;(f) both hinge and edge deformity in a live day-7 veliger larva. The scalebar is 100 µm.
3284
Figure 2 1
300
800
1 300
1 800
2 300
2 800
0 1 2 3 4 5 6 7
pC
O2
(µatm
)
Days
1599 µatm
1164 µatm
807 µatm
469 µatm
2
3 Fig. 2. The daily means ofpCO2 (µatm)± sd for replicates in thetreatments and ambient group during the experimental period ofseven days (n = 4, n = 3 for 1164 µatm).
3.2 Survival
The median survival of day-7 veligers based on the ini-tial number of incubated eggs reared at ambientpCO2 was45 % (range 25–46) and decreased with elevatedpCO2 lev-els (Fig. 3). At the highestpCO2 level the median survivalwas 12 % (range 6–13 %). There was a significant effect ofpCO2 on survival (p = 0.013), but only the group at the high-estpCO2 level was significantly different from the control.
3285
Figure 3. 1
2
3
0
20
40
60
80
100
469 807 1164 1599
Surv
ival (%
)
pCO2-group (µatm)
**
4
5 Fig. 3. Survival of day-7 scallop larvae given as median± quartilein the fourpCO2 groups as percentage of eggs incubated.∗∗ Sig-nificantly different from the otherpCO2 groups.
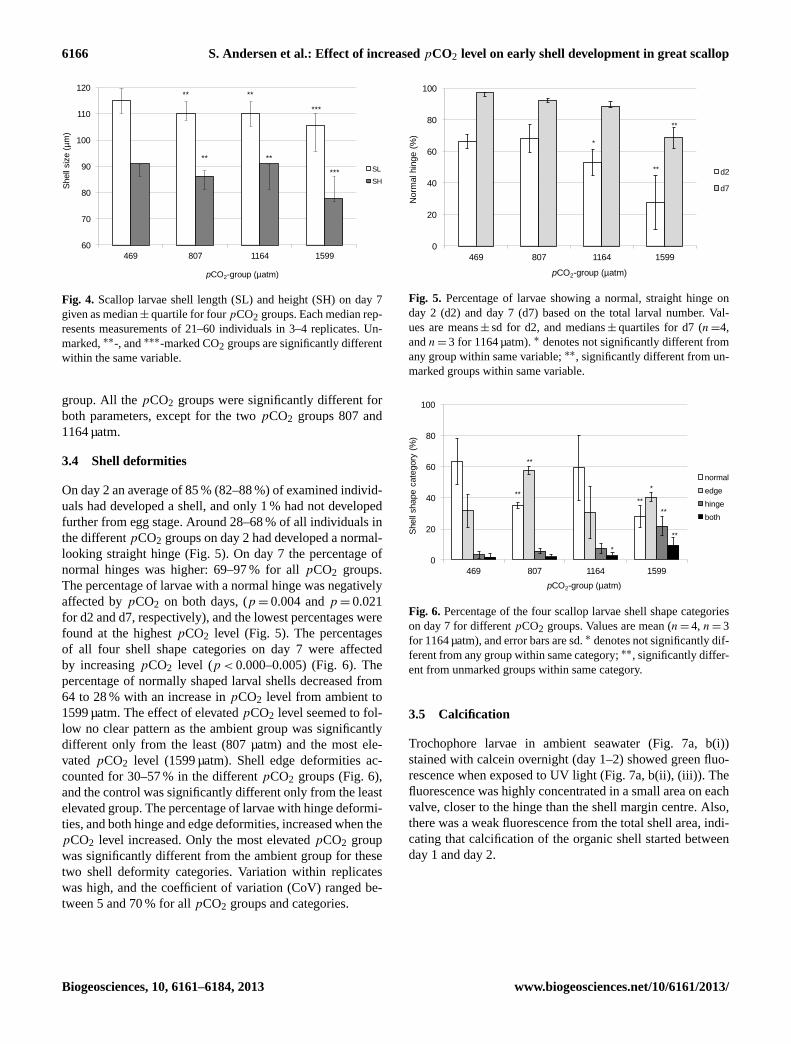
3.3 Shell size
Shell length and height on day 7 were both negatively af-fected by an increase inpCO2 level (p < 0.001 for both)showing a decrease in median values of 8 and 15 %, respec-tively, whenpCO2 increased from 469 µatm (ambient) to thehighestpCO2 of 1599 µatm (Fig. 4). The median shell lengthand height were 115 and 91 µm, respectively, in the ambient
www.biogeosciences.net/10/6161/2013/ Biogeosciences, 10, 6161–6184, 2013
6166 S. Andersen et al.: Effect of increasedpCO2 level on early shell development in great scallop
3286
Figure 4. 1
2
3
60
70
80
90
100
110
120
469 807 1164 1599
Shell
siz
e (
µm
)
pCO2-group (µatm)
SL
SH
** **
** **
***
***
4 5
Fig. 4. Scallop larvae shell length (SL) and height (SH) on day 7given as median± quartile for fourpCO2 groups. Each median rep-resents measurements of 21–60 individuals in 3–4 replicates. Un-marked,∗∗-, and∗∗∗-marked CO2 groups are significantly differentwithin the same variable.
group. All thepCO2 groups were significantly different forboth parameters, except for the twopCO2 groups 807 and1164 µatm.
3.4 Shell deformities
On day 2 an average of 85 % (82–88 %) of examined individ-uals had developed a shell, and only 1 % had not developedfurther from egg stage. Around 28–68 % of all individuals inthe differentpCO2 groups on day 2 had developed a normal-looking straight hinge (Fig. 5). On day 7 the percentage ofnormal hinges was higher: 69–97 % for allpCO2 groups.The percentage of larvae with a normal hinge was negativelyaffected bypCO2 on both days, (p = 0.004 andp = 0.021for d2 and d7, respectively), and the lowest percentages werefound at the highestpCO2 level (Fig. 5). The percentagesof all four shell shape categories on day 7 were affectedby increasingpCO2 level (p < 0.000–0.005) (Fig. 6). Thepercentage of normally shaped larval shells decreased from64 to 28 % with an increase inpCO2 level from ambient to1599 µatm. The effect of elevatedpCO2 level seemed to fol-low no clear pattern as the ambient group was significantlydifferent only from the least (807 µatm) and the most ele-vatedpCO2 level (1599 µatm). Shell edge deformities ac-counted for 30–57 % in the differentpCO2 groups (Fig. 6),and the control was significantly different only from the leastelevated group. The percentage of larvae with hinge deformi-ties, and both hinge and edge deformities, increased when thepCO2 level increased. Only the most elevatedpCO2 groupwas significantly different from the ambient group for thesetwo shell deformity categories. Variation within replicateswas high, and the coefficient of variation (CoV) ranged be-tween 5 and 70 % for allpCO2 groups and categories.
3287
Figure 5. 1
2
3
0
20
40
60
80
100
469 807 1164 1599
Norm
al hin
ge (
%)
pCO2-group (µatm)
d2
d7
*
**
**
4 5
Fig. 5. Percentage of larvae showing a normal, straight hinge onday 2 (d2) and day 7 (d7) based on the total larval number. Val-ues are means± sd for d2, and medians± quartiles for d7 (n =4,andn = 3 for 1164 µatm).∗ denotes not significantly different fromany group within same variable;∗∗, significantly different from un-marked groups within same variable.
3288
Figure 6. 1
2
0
20
40
60
80
100
469 807 1164 1599
Shell
shape c
ate
gory
(%
)
pCO2-group (µatm)
normal
edge
hinge
both
**
**
**
**
**
*
*
3 4
Fig. 6. Percentage of the four scallop larvae shell shape categorieson day 7 for differentpCO2 groups. Values are mean (n = 4, n = 3for 1164 µatm), and error bars are sd.∗ denotes not significantly dif-ferent from any group within same category;∗∗, significantly differ-ent from unmarked groups within same category.
3.5 Calcification
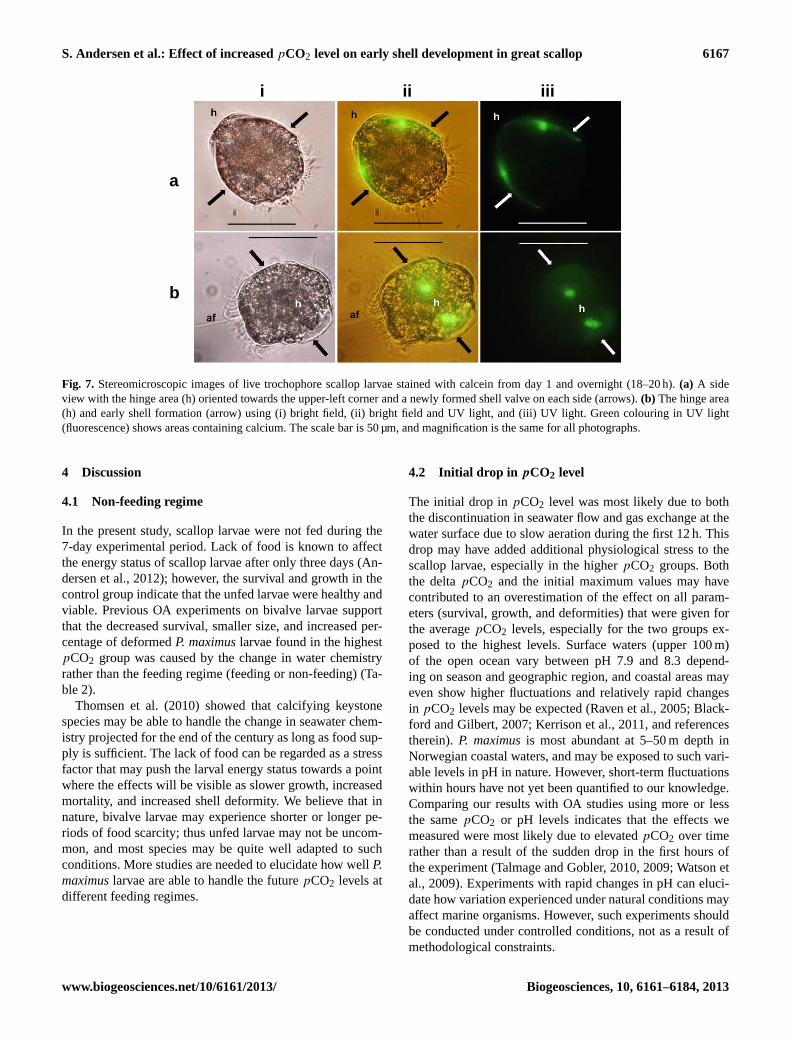
Trochophore larvae in ambient seawater (Fig. 7a, b(i))stained with calcein overnight (day 1–2) showed green fluo-rescence when exposed to UV light (Fig. 7a, b(ii), (iii)). Thefluorescence was highly concentrated in a small area on eachvalve, closer to the hinge than the shell margin centre. Also,there was a weak fluorescence from the total shell area, indi-cating that calcification of the organic shell started betweenday 1 and day 2.
Biogeosciences, 10, 6161–6184, 2013 www.biogeosciences.net/10/6161/2013/
S. Andersen et al.: Effect of increasedpCO2 level on early shell development in great scallop 6167
Figure 7.
i ii iii a b
Fig. 7. Stereomicroscopic images of live trochophore scallop larvae stained with calcein from day 1 and overnight (18–20 h).(a) A sideview with the hinge area (h) oriented towards the upper-left corner and a newly formed shell valve on each side (arrows).(b) The hinge area(h) and early shell formation (arrow) using (i) bright field, (ii) bright field and UV light, and (iii) UV light. Green colouring in UV light(fluorescence) shows areas containing calcium. The scale bar is 50 µm, and magnification is the same for all photographs.
4 Discussion
4.1 Non-feeding regime
In the present study, scallop larvae were not fed during the7-day experimental period. Lack of food is known to affectthe energy status of scallop larvae after only three days (An-dersen et al., 2012); however, the survival and growth in thecontrol group indicate that the unfed larvae were healthy andviable. Previous OA experiments on bivalve larvae supportthat the decreased survival, smaller size, and increased per-centage of deformedP. maximuslarvae found in the highestpCO2 group was caused by the change in water chemistryrather than the feeding regime (feeding or non-feeding) (Ta-ble 2).
Thomsen et al. (2010) showed that calcifying keystonespecies may be able to handle the change in seawater chem-istry projected for the end of the century as long as food sup-ply is sufficient. The lack of food can be regarded as a stressfactor that may push the larval energy status towards a pointwhere the effects will be visible as slower growth, increasedmortality, and increased shell deformity. We believe that innature, bivalve larvae may experience shorter or longer pe-riods of food scarcity; thus unfed larvae may not be uncom-mon, and most species may be quite well adapted to suchconditions. More studies are needed to elucidate how wellP.maximuslarvae are able to handle the futurepCO2 levels atdifferent feeding regimes.
4.2 Initial drop in pCO2 level
The initial drop inpCO2 level was most likely due to boththe discontinuation in seawater flow and gas exchange at thewater surface due to slow aeration during the first 12 h. Thisdrop may have added additional physiological stress to thescallop larvae, especially in the higherpCO2 groups. Boththe deltapCO2 and the initial maximum values may havecontributed to an overestimation of the effect on all param-eters (survival, growth, and deformities) that were given forthe averagepCO2 levels, especially for the two groups ex-posed to the highest levels. Surface waters (upper 100 m)of the open ocean vary between pH 7.9 and 8.3 depend-ing on season and geographic region, and coastal areas mayeven show higher fluctuations and relatively rapid changesin pCO2 levels may be expected (Raven et al., 2005; Black-ford and Gilbert, 2007; Kerrison et al., 2011, and referencestherein).P. maximusis most abundant at 5–50 m depth inNorwegian coastal waters, and may be exposed to such vari-able levels in pH in nature. However, short-term fluctuationswithin hours have not yet been quantified to our knowledge.Comparing our results with OA studies using more or lessthe samepCO2 or pH levels indicates that the effects wemeasured were most likely due to elevatedpCO2 over timerather than a result of the sudden drop in the first hours ofthe experiment (Talmage and Gobler, 2010, 2009; Watson etal., 2009). Experiments with rapid changes in pH can eluci-date how variation experienced under natural conditions mayaffect marine organisms. However, such experiments shouldbe conducted under controlled conditions, not as a result ofmethodological constraints.
www.biogeosciences.net/10/6161/2013/ Biogeosciences, 10, 6161–6184, 2013
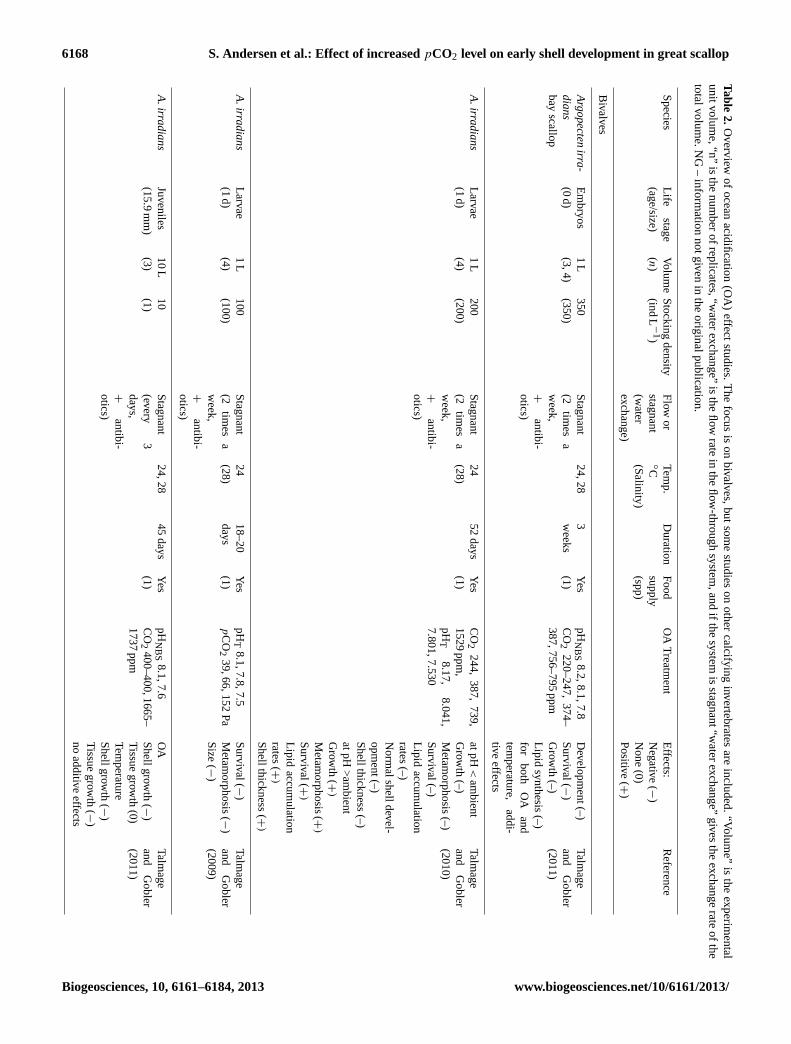
6168 S. Andersen et al.: Effect of increasedpCO2 level on early shell development in great scallopTable
2.Overview
ofocean
acidification(O
A)
effectstudies.
The
focusis
onbivalves,
butsom
estudies
onother
calcifyinginvertebrates
areincluded.
“Volume”
isthe
experimental
unitvolume,“n”
isthe
number
ofreplicates,“water
exchange”is
theflow
ratein
theflow
-throughsystem
,andifthe
systemis
stagnant“water
exchange”gives
theexchange
rateofthe
totalvolume.N
G–
information
notgivenin
theoriginalpublication.
Species
Lifestage
(age/size)Volum
e(n)
Stocking
density(ind
L−
1)F
lowor
stagnant(w
aterexchange)
Temp.
◦C(Salinity)
Duration
Food
supply(spp)
OA
Treatm
entE
ffects:N
egative(−
)N
one(0)
Positive
(+)
Reference
Bivalves
Arg
op
ecte
nirra
-d
ian
sbay
scallop
Em
bryos(0
d)1
L(3,4)
350(350)
Stagnant
(2tim
esa
week,
+antibi-
otics)
24,283weeks
Yes
(1)pH
NB
S8.2,8.1,7.8
CO
2220–247,
374–387,756–795
ppm
Developm
ent(–)S
urvival(−)
Grow
th(–)
Lipidsynthesis
(–)for
bothO
Aand
temperature,
addi-tive
effects
Talmage
andG
obler(2011)
A.irra
dia
ns
Larvae(1
d)1
L(4)
200(200)
Stagnant
(2tim
esa
week,
+antibi-
otics)
24(28)52
daysY
es(1)
CO
2244,
387,739,
1529ppm
,pH
T8.17,
8.041,7.801,7.530
atpH<
ambient
Grow
th(–)
Metam
orphosis(–)
Survival(–)
Lipidaccum
ulationrates
(–)N
ormalshelldevel-
opment(–)
Shellthickness
(–)atpH
>am
bientG
rowth
(+)
Metam
orphosis(+)
Survival(+
)
Lipidaccum
ulationrates
(+)
Shellthickness
(+)
Talmage
andG
obler(2010)
A.irra
dia
ns
Larvae(1
d)1
L(4)
100(100)
Stagnant
(2tim
esa
week,
+antibi-
otics)
24(28)18–20days
Yes
(1)pH
T8.1,7.8,7.5
pC
O2
39,66,152P
aS
urvival(−)
Metam
orphosis(−)
Size
(−)
Talmage
andG
obler(2009)
A.irra
dia
ns
Juveniles(15.9
mm
)10
L(3)
10(1)S
tagnant(every
3days,+
antibi-otics)
24,2845
daysY
es(1)
pHN
BS
8.1,7.6C
O2
400–400,1665–1737
ppm
OA
Shellgrow
th(−
)T
issuegrow
th(0)
Temperature
Shellgrow
th(−
)T
issuegrow
th(−
)no
additiveeffects
Talmage
andG
obler(2011)
Biogeosciences, 10, 6161–6184, 2013 www.biogeosciences.net/10/6161/2013/
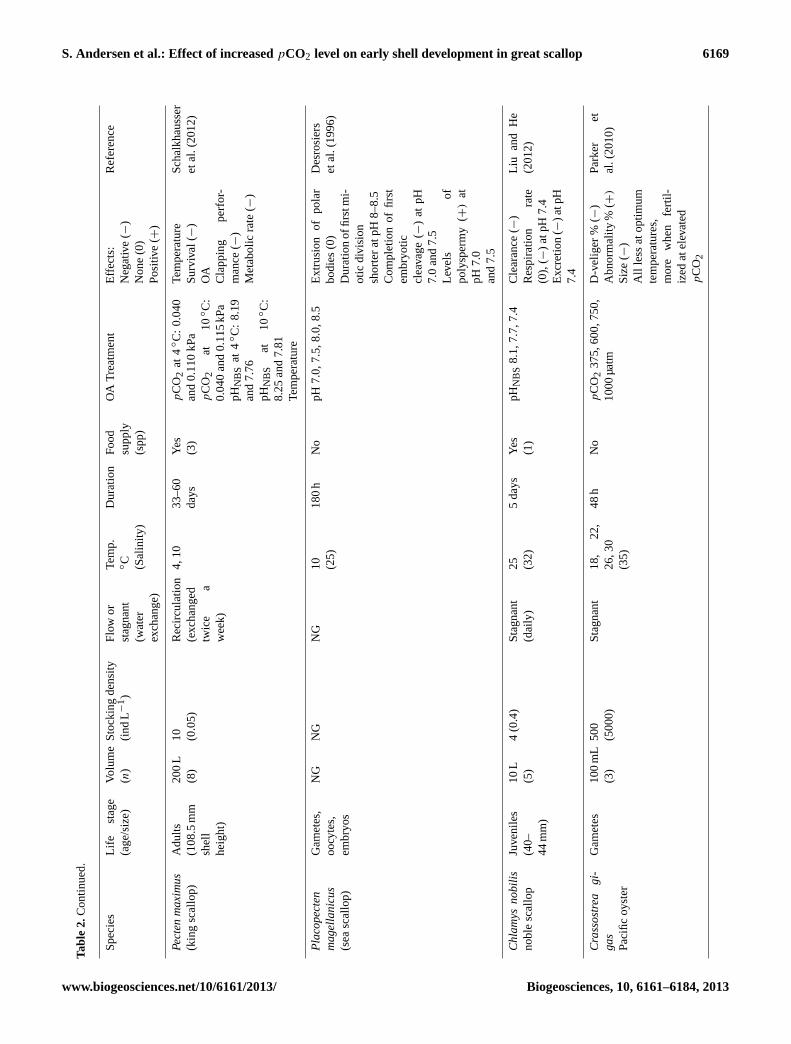
S. Andersen et al.: Effect of increasedpCO2 level on early shell development in great scallop 6169
Tabl
e2.
Con
tinue
d.
Spe
cies
Life
stag
e(a
ge/s
ize)
Volu
me
(n)
Sto
ckin
gde
nsity
(ind
L−1)
Flo
wor
stag
nant
(wat
erex
chan
ge)
Tem
p.◦C (Sal
inity
)
Dur
atio
nF
ood
supp
ly(s
pp)
OA
Tre
atm
ent
Effe
cts:
Neg
ativ
e(−
)N
one
(0)
Pos
itive
(+)
Ref
eren
ce
Pe
cte
nm
axi
mu
s(k
ing
scal
lop)
Adu
lts(1
08.5
mm
shel
lhe
ight
)
200
L(8
)10 (0
.05)
Rec
ircul
atio
n(e
xcha
nged
twic
ea
wee
k)
4,10
33–6
0da
ysY
es(3
)p
CO
2at
4◦C
:0.
040
and
0.11
0kP
ap
CO
2at
10◦C
:0.
040
and
0.11
5kP
apH
NB
Sat
4◦C
:8.
19an
d7.
76pH
NB
Sat
10◦C
:8.
25an
d7.
81Te
mpe
ratu
re
Tem
pera
ture
Sur
viva
l(−
)O
AC
lapp
ing
perf
or-
man
ce(−
)M
etab
olic
rate
(−)
Sch
alkh
auss
eret
al.(
2012
)
Pla
cop
ect
en
mag
ella
nic
us
(sea
scal
lop)
Gam
etes
,oo
cyte
s,em
bryo
s
NG
NG
NG
10 (25)
180
hN
opH
7.0,
7.5,
8.0,
8.5
Ext
rusi
onof
pola
rbo
dies
(0)
Dur
atio
nof
first
mi-
otic
divi
sion
shor
ter
atpH
8–8.
5C
ompl
etio
nof
first
embr
yotic
clea
vage
(−)
atpH
7.0
and
7.5
Leve
lsof
poly
sper
my
(+)
atpH
7.0
and
7.5
Des
rosi
ers
etal
.(19
96)
Ch
lam
ysn
ob
ilis
nobl
esc
allo
pJu
veni
les
(40–
44m
m)
10L
(5)
4(0
.4)
Sta
gnan
t(d
aily
)25 (3
2)5
days
Yes
(1)
pHN
BS
8.1,
7.7,
7.4
Cle
aran
ce(
−)
Res
pira
tion
rate
(0),
(−)
atpH
7.4
Exc
retio
n(−
)atp
H7.
4
Liu
and
He
(201
2)
Cra
sso
stre
ag
i-g
as
Pac
ific
oyst
er
Gam
etes
100
mL
(3)
500
(500
0)S
tagn
ant
18,
22,
26,3
0(3
5)
48h
No
pC
O2
375,
600,
750,
1000
µat
mD
-vel
iger
%(−
)A
bnor
mal
ity%
(+)
Siz
e(−
)A
llle
ssat
optim
umte
mpe
ratu
res,
mor
ew
hen
fert
il-iz
edat
elev
ated
pC
O2
Par
ker
etal
.(20
10)
www.biogeosciences.net/10/6161/2013/ Biogeosciences, 10, 6161–6184, 2013
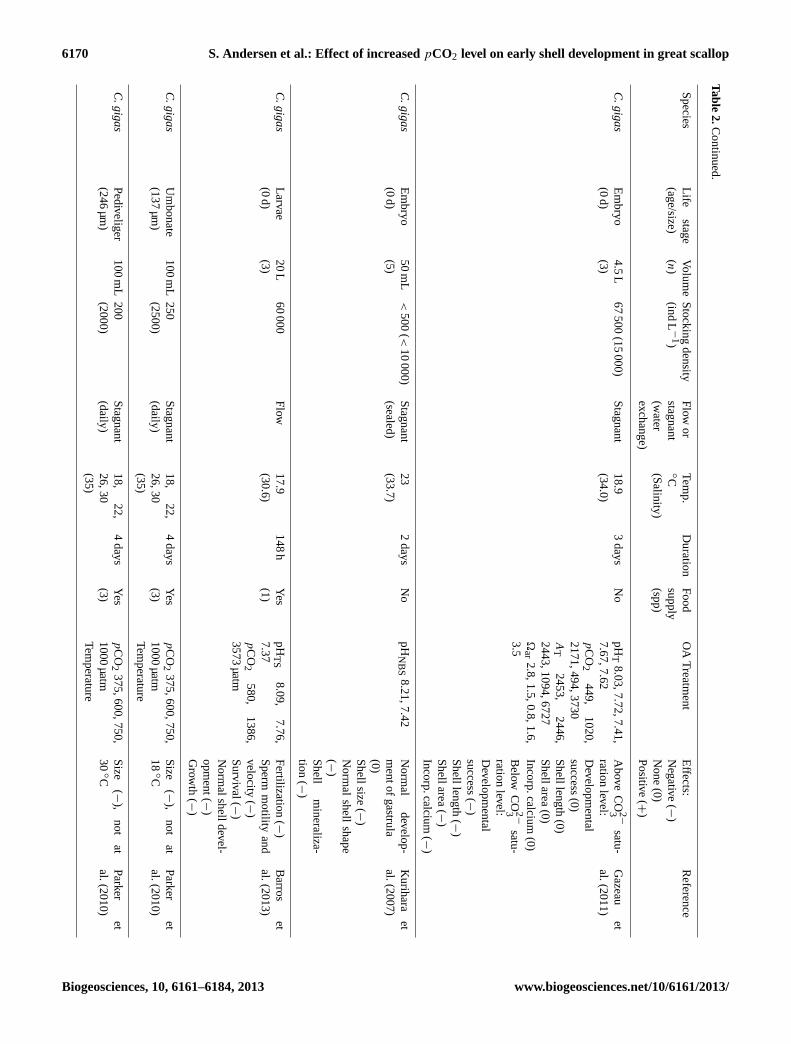
6170 S. Andersen et al.: Effect of increasedpCO2 level on early shell development in great scallop
Table2.C
ontinued.
Species
Lifestage
(age/size)Volum
e(n)
Stocking
density(ind
L−
1)F
lowor
stagnant(w
aterexchange)
Temp.
◦C(Salinity)
Duration
Food
supply(spp)
OA
Treatm
entE
ffects:N
egative(−
)N
one(0)
Positive
(+)
Reference
C.g
iga
sE
mbryo
(0d)
4.5L
(3)67
500(15
000)S
tagnant18.9
(34.0)3
daysN
opHT
8.03,7.72,7.41,7.67,7.62p
CO
2449,
1020,2171,494,3730A
T2453,
2446,2443,1094,6727�
ar 2.8,1.5,0.8,1.6,3.5
Above
CO
2−
3satu-
rationlevel:
Developm
entalsuccess
(0)S
helllength(0)
Shellarea
(0)Incorp.calcium
(0)B
elowC
O2−
3satu-
rationlevel:
Developm
entalsuccess
(−)S
helllength(−
)S
hellarea(−
)Incorp.calcium
(−)
Gazeau
etal.(2011)
C.g
iga
sE
mbryo
(0d)
50m
L(5)
<500
(<10
000)S
tagnant(sealed)
23(33.7)2
daysN
opHN
BS
8.21,7.42N
ormal
develop-m
entofgastrula(0)S
hellsize(−
)N
ormal
shellshape
(−)
Shell
mineraliza-
tion(−
)
Kurihara
etal.(2007)
C.g
iga
sLarvae(0
d)20
L(3)
60000
Flow
17.9(30.6)
148h
Yes
(1)pH
TS
8.09,7.76,
7.37p
CO
2580,
1386,3573
µatm
Fertilization
(−)
Sperm
motility
andvelocity
(−)
Survival(−
)N
ormalshelldevel-
opment(−
)G
rowth
(−)
Barros
etal.(2013)
C.g
iga
sU
mbonate
(137µ
m)
100m
L250(2500)
Stagnant
(daily)18,
22,26,30(35)
4days
Yes
(3)p
CO
2375,600,750,
1000µ
atmTem
perature
Size
(−),
notat
18◦C
Parker
etal.(2010)
C.g
iga
sP
ediveliger(246
µm
)100
mL
200(2000)
Stagnant
(daily)18,
22,26,30(35)
4days
Yes
(3)p
CO
2375,600,750,
1000µ
atmTem
perature
Size
(−),
notat
30◦C
Parker
etal.(2010)
Biogeosciences, 10, 6161–6184, 2013 www.biogeosciences.net/10/6161/2013/
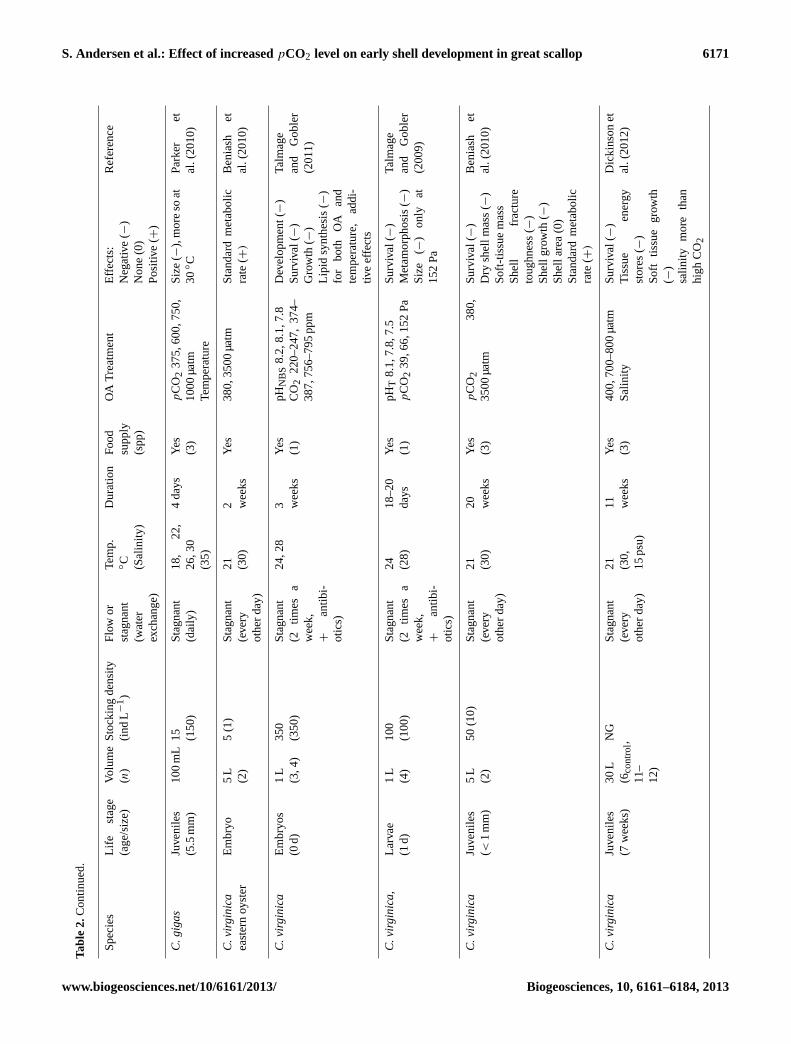
S. Andersen et al.: Effect of increasedpCO2 level on early shell development in great scallop 6171
Tabl
e2.
Con
tinue
d.
Spe
cies
Life
stag
e(a
ge/s
ize)
Volu
me
(n)
Sto
ckin
gde
nsity
(ind
L−1)
Flo
wor
stag
nant
(wat
erex
chan
ge)
Tem
p.◦C (Sal
inity
)
Dur
atio
nF
ood
supp
ly(s
pp)
OA
Tre
atm
ent
Effe
cts:
Neg
ativ
e(−
)N
one
(0)
Pos
itive
(+)
Ref
eren
ce
C.g
iga
sJu
veni
les
(5.5
mm
)10
0m
L15 (1
50)
Sta
gnan
t(d
aily
)18
,22
,26
,30
(35)
4da
ysY
es(3
)p
CO
237
5,60
0,75
0,10
00µ
atm
Tem
pera
ture
Siz
e(−
),m
ore
soat
30◦C
Par
ker
etal
.(20
10)
C.v
irgin
ica
east
ern
oyst
erE
mbr
yo5
L(2
)5
(1)
Sta
gnan
t(e
very
othe
rda
y)
21 (30)
2 wee
ksY
es38
0,35
00µ
atm
Sta
ndar
dm
etab
olic
rate
(+)
Ben
iash
etal
.(20
10)
C.v
irgin
ica
Em
bryo
s(0
d)1
L(3
,4)
350
(350
)S
tagn
ant
(2tim
esa
wee
k,+
antib
i-ot
ics)
24,2
83 wee
ksY
es(1
)pH
NB
S8.
2,8.
1,7.
8C
O2
220–
247,
374–
387,
756–
795
ppm
Dev
elop
men
t(−)
Sur
viva
l(−
)G
row
th(−
)Li
pid
synt
hesi
s(−
)fo
rbo
thO
Aan
dte
mpe
ratu
re,
addi
-tiv
eef
fect
s
Talm
age
and
Gob
ler
(201
1)
C.v
irgin
ica
,La
rvae
(1d)
1L
(4)
100
(100
)S
tagn
ant
(2tim
esa
wee
k,+
antib
i-ot
ics)
24 (28)
18–2
0da
ysY
es(1
)pH
T8.
1,7.
8,7.
5p
CO
239
,66,
152
Pa
Sur
viva
l(−
)M
etam
orph
osis
(−)
Siz
e(−
)on
lyat
152
Pa
Talm
age
and
Gob
ler
(200
9)
C.v
irgin
ica
Juve
nile
s(<
1m
m)
5L
(2)
50(1
0)S
tagn
ant
(eve
ryot
her
day)
21 (30)
20 wee
ksY
es(3
)p
CO
238
0,35
00µ
atm
Sur
viva
l(−
)D
rysh
ellm
ass
(−)
Sof
t-tis
sue
mas
sS
hell
frac
ture
toug
hnes
s(−)
She
llgr
owth
(−)
She
llar
ea(0
)S
tand
ard
met
abol
icra
te(+
)
Ben
iash
etal
.(20
10)
C.v
irgin
ica
Juve
nile
s(7
wee
ks)
30L
(6co
ntro
l,11
–12
)
NG
Sta
gnan
t(e
very
othe
rda
y)
21 (30,
15ps
u)
11 wee
ksY
es(3
)40
0,70
0–80
0µ
atm
Sal
inity
Sur
viva
l(−
)T
issu
een
ergy
stor
es(−
)S
oft
tissu
egr
owth
(−)
salin
itym
ore
than
high
CO 2
Dic
kins
onet
al.(
2012
)
www.biogeosciences.net/10/6161/2013/ Biogeosciences, 10, 6161–6184, 2013
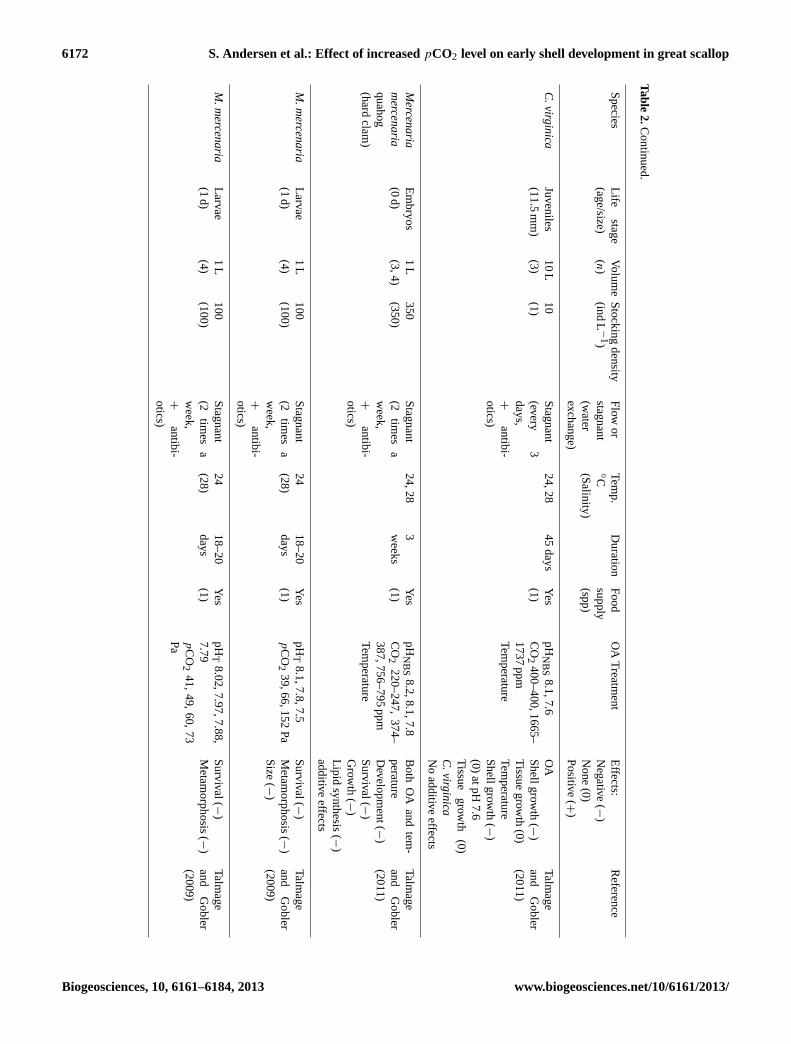
6172 S. Andersen et al.: Effect of increasedpCO2 level on early shell development in great scallop
Table2.C
ontinued.
Species
Lifestage
(age/size)Volum
e(n)
Stocking
density(ind
L−
1)F
lowor
stagnant(w
aterexchange)
Temp.
◦C(Salinity)
Duration
Food
supply(spp)
OA
Treatm
entE
ffects:N
egative(−
)N
one(0)
Positive
(+)
Reference
C.virg
inica
Juveniles(11.5
mm
)10
L(3)
10(1)S
tagnant(every
3days,+
antibi-otics)
24,2845
daysY
es(1)
pHN
BS
8.1,7.6C
O2
400–400,1665–1737
ppmTem
perature
OA
Shellgrow
th(−
)T
issuegrow
th(0)
Temperature
Shellgrow
th(−
)(0)
atpH7.6
Tissue
growth
(0)C
.virgin
icaN
oadditive
effects
Talmage
andG
obler(2011)
Me
rcen
aria
me
rcen
aria
quahog(hard
clam)
Em
bryos(0
d)1
L(3,4)
350(350)
Stagnant
(2tim
esa
week,
+antibi-
otics)
24,283weeks
Yes
(1)pH
NB
S8.2,8.1,7.8
CO
2220–247,
374–387,756–795
ppmTem
perature
Both
OA
andtem
-peratureD
evelopment(−
)S
urvival(−)
Grow
th(−
)Lipid
synthesis(−
)additive
effects
Talmage
andG
obler(2011)
M.m
erce
na
riaLarvae(1
d)1
L(4)
100(100)
Stagnant
(2tim
esa
week,
+antibi-
otics)
24(28)18–20days
Yes
(1)pH
T8.1,7.8,7.5
pC
O2
39,66,152P
aS
urvival(−)
Metam
orphosis(−)
Size
(−)
Talmage
andG
obler(2009)
M.m
erce
na
riaLarvae(1
d)1
L(4)
100(100)
Stagnant
(2tim
esa
week,
+antibi-
otics)
24(28)18–20days
Yes
(1)pH
T8.02,7.97,7.88,
7.79p
CO
241,
49,60,
73P
a
Survival(−
)M
etamorphosis
(−)Talm
ageand
Gobler
(2009)
Biogeosciences, 10, 6161–6184, 2013 www.biogeosciences.net/10/6161/2013/
S. Andersen et al.: Effect of increasedpCO2 level on early shell development in great scallop 6173Ta
ble
2.C
ontin
ued.
Spe
cies
Life
stag
e(a
ge/s
ize)
Volu
me
(n)
Sto
ckin
gde
nsity
(ind
L−1)
Flo
wor
stag
nant
(wat
erex
chan
ge)
Tem
p.◦C (Sal
inity
)
Dur
atio
nF
ood
supp
ly(s
pp)
OA
Tre
atm
ent
Effe
cts:
Neg
ativ
e(−
)N
one
(0)
Pos
itive
(+)
Ref
eren
ce
M.m
erc
en
aria
Larv
ae(1
d)1
L(4
)20
0(2
00)
Sta
gnan
t(2
times
aw
eek,
+an
tibi-
otic
s)
24 (28)
36da
ysY
es(1
)C
O2
247,
380,
742,
1529
ppm
,pH
T8.
171,
8.05
2,7.
801,
7.53
2
pH<
ambi
ent
Gro
wth
(−)
Met
amor
phos
is(−)
Sur
viva
l(−
)Li
pid
accu
mul
atio
nra
tes
(−)
Nor
mal
shel
ldev
el-
opm
ent(−
)S
hell
thic
knes
s(−)
pH>
ambi
ent
Gro
wth
(+)
Met
amor
phos
is(+)
Sur
viva
l(+
)
Lipi
dac
cum
ulat
ion
rate
s(+
)
She
llth
ickn
ess
(+)
Talm
age
and
Gob
ler
(201
0)
M.m
erc
en
aria
Juve
nile
s(6
.1m
m)
10L
(3)
10 (1)
Sta
gnan
t(e
very
3da
ys,
+an
tibi-
otic
s)
24,2
845
days
Yes
(1)
pHN
BS
8.1,
7.6
CO
240
0–40
0,16
65–
1737
ppm
OA
She
llgr
owth
(0)
Tis
sue
grow
th(0
)Te
mpe
ratu
reS
hell
grow
th(−
)T
issu
egr
owth
(0)
No
addi
tive
effe
cts
Talm
age
and
Gob
ler
(201
1)
Me
rce
na
rias
pp.
Pos
t-la
rvae
–ju
veni
les
(0.3
9–2.
9m
m)
50m
L(1
,3,
4)
1–2
g(2
0–40
g)S
tagn
ant
(dai
ly)
208
hY
es(1
+
She
ll-fis
hdi
et)
pHN
BS
8.02
,7.
64,
7.41
pC
O2
424,
1120
,19
50µ
atm
Cal
cific
atio
nra
te(−
),al
lsiz
es,
smal
ler
size
sm
ore
affe
cted
,an
dat
high
erpH
Dep
ende
nton
hatc
hery
popu
la-
tions
(hyb
ridiz
edan
dpu
reM
erc
e-
na
ria)
Wal
dbus
ser
etal
.(20
10)
Myt
ilus
calif
or-
nia
nu
sC
alifo
rnia
mus
-se
l
Larv
ae2
L(6
)10
00(5
00)
Sta
gnan
t(e
very
2da
ys)
159
days
Yes
(1)
380,
540,
970
ppm
She
llle
ngth
(−
)S
hell
thic
knes
s(−)
She
llsi
ze(−
)T
issu
em
ass
(−
)
Gay
lord
etal
.(20
11)
www.biogeosciences.net/10/6161/2013/ Biogeosciences, 10, 6161–6184, 2013
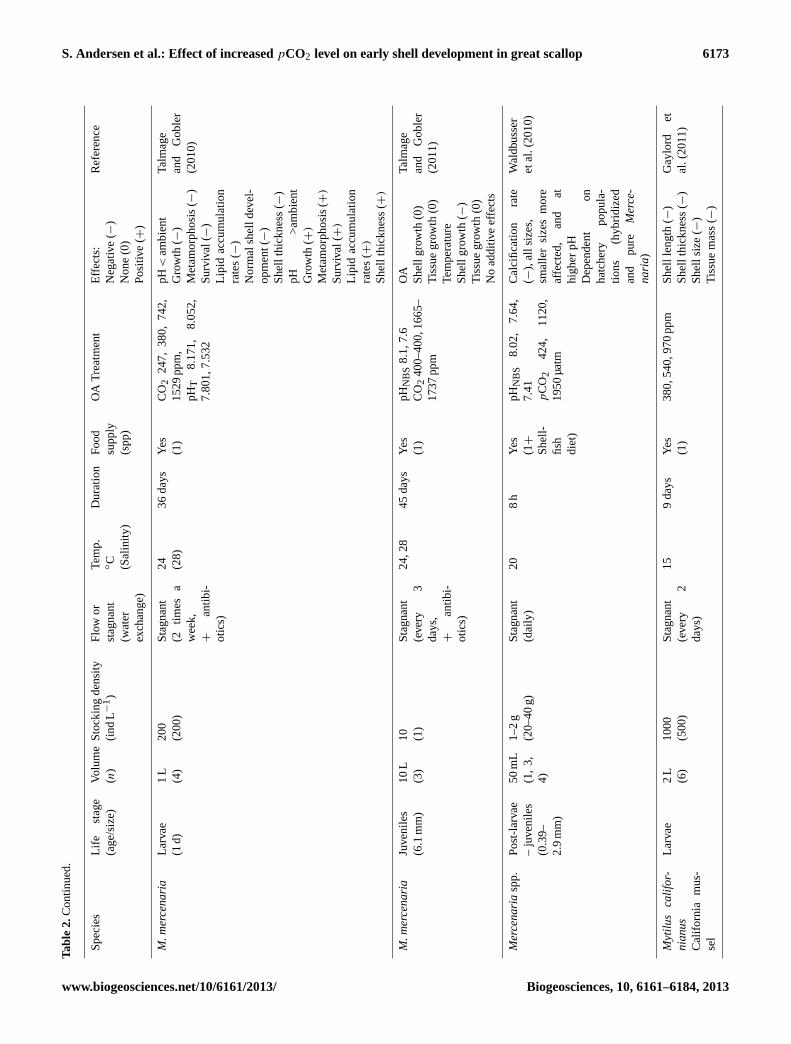
6174 S. Andersen et al.: Effect of increasedpCO2 level on early shell development in great scallop
Table2.C
ontinued.
Species
Lifestage
(age/size)Volum
e(n)
Stocking
density(ind
L−
1)F
lowor
stagnant(w
aterex-
change)
Temp.
◦C(Salinity)
Duration
Food
supply(spp)
OA
Treatm
entE
ffects:N
egative(−
)N
one(0)
Positive
(+)
Reference
Mytilu
se
du
lisblue
mussel
Em
bryo(0
d)130
L(3)
(10000)
Stagnant
16.2–16.7(31.9–32.1)
2days
No
pHNB
S8.1
(460–640
µatm
),pH
7.8(1100–1200
µatm
),pH
7.6(460–640
µatm
)
Shelllength
(−)
Shellthickness
(−)H
atchingrate
(0)
Gazeau
etal.(2010)
M.e
du
lisLarvae(2
d)130
L(3)
(10000)
Flow
19.2,19.5(31.4,31.5)
13days
Yes
(2–3)pH
NB
S8.1,7.8
Shell
lengthand
thickness(−
)S
urvival(0)
Gazeau
etal.(2010)
M.e
du
lis(20
%hybrid
with
Mytilu
stro
ssulu
s)
Post-larvae
500m
L(7)
100(200)
Stagnant
(400m
Ldaily)
177w
eeksY
es(1)
pC
O2
470,1020,
2110,3350µ
atm3
foodlevels
OA
Shellsize
(−)
Survival(0)
Calcification
(−)
Organic
growth
(0)F
oodS
hellsize(+
)
Survival(0)
Calcification
(+)
Organic
growth
(+)
Explained
most
ofthe
variation
Thom
senet
al.(2013)
M.e
du
lisJuveniles
–A
dults(5.5,
13.3m
m)
16L
(4)F
low(100
mL
min−
1)13.8(15)
8weeks
Yes
(1)pH
NB
S8.13,
7.72,7.26p
CO
2493,
1332,3898
µatm
Shell
length(−
)at
3898µ
atmIndividual
arago-nite
plateletthickness
(−)
at3898
µatm
Aragonite
layerthickness
(0)C
alcitelayer
thick-ness
(0)S
helldissolution
Index(+
)
Shell
dissolutionarea
(+)
Thom
senet
al.(2010)
Biogeosciences, 10, 6161–6184, 2013 www.biogeosciences.net/10/6161/2013/
S. Andersen et al.: Effect of increasedpCO2 level on early shell development in great scallop 6175Ta
ble
2.C
ontin
ued.
Spe
cies
Life
stag
e(a
ge/s
ize)
Volu
me
(n)
Sto
ckin
gde
nsity
(ind
L−1)
Flo
wor
stag
nant
(wat
erex
chan
ge)
Tem
p.◦C (Sal
inity
)
Dur
atio
nF
ood
supp
ly(s
pp)
OA
Tre
atm
ent
Effe
cts:
Neg
ativ
e(−
)N
one
(0)
Pos
itive
(+)
Ref
eren
ce
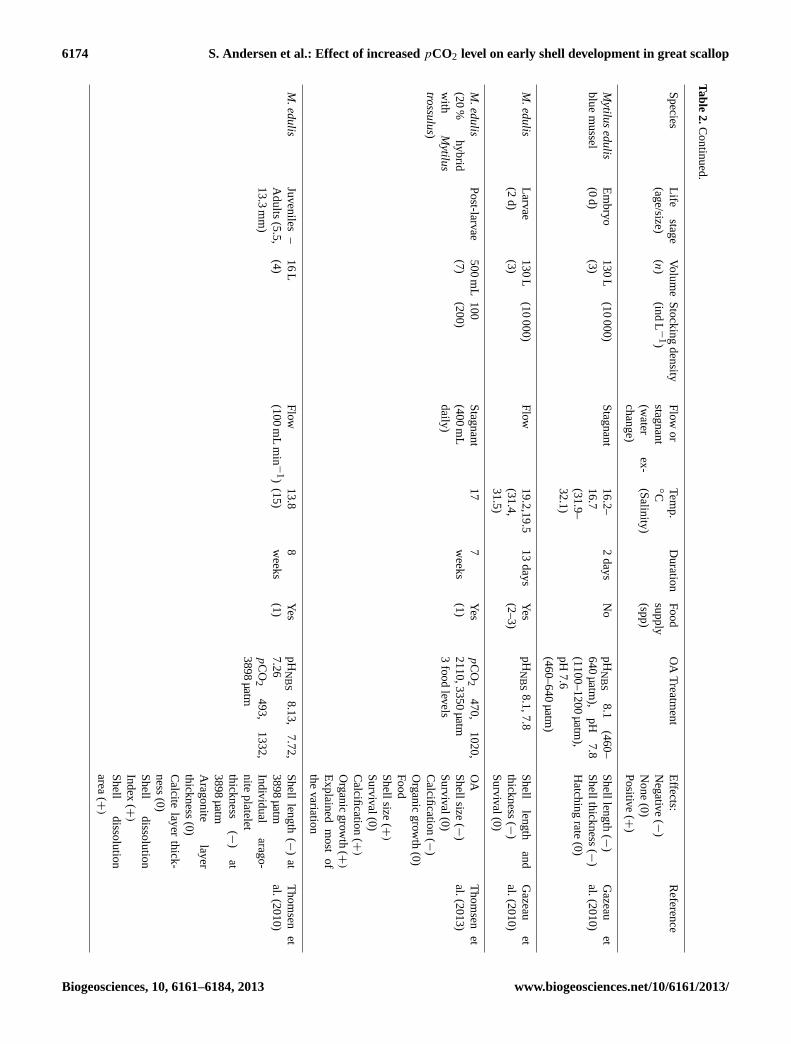
M.e
du
lisJu
veni
les
(16.
6–17
.6m
m)
18L
(4)
4 (0.2
2)F
low
(50
mL
min
−1)4.
7–5.
4(1
6)7 w
eeks
Yes
(1)
pC
O2
mea
n54
,11
7,24
8,38
5P
apH
NB
Sm
ean
8.05
,7.
73,7
.43,
7.19
Foo
d0.
6an
d5.
7ce
llsµ
L−1
OA
She
llgr
owth
(−)
at38
5P
aIn
tern
alsh
elld
isso
-lu
tion
(−)
noin
tera
ctio
nsF
ood
She
llgr
owth
(+)
Iner
nal
shel
ldi
sso-
lutio
n(+
)
inte
ract
ions
?
Mel
zner
etal
.(20
11)
M.e
du
lisJu
veni
les
(45–
55m
m)
50L
(2)
32(0
.64)
Flo
w(6
0m
Lm
in−
1)16
.03–
16.1
1(3
5.13
–35
.37)
60da
ysY
es(1
)pH
NB
S8.
0,7.
8,7.
6,6.
5H
ealth
(NR
Ras
-sa
y)(−
)B
eesl
eyet
al.(
2008
)
M.e
du
lisA
dults
(76
mm
)16
L(2
?)6 (0
.4)
Flo
w12
.5(1
1.8)
14da
ysY
es(3
)pH
NB
S8.
05,
7.89
,7.
81,7
.70,
7.56
,7.0
8p
CO
246
4,66
1,78
9,10
46,
1480
,42
54µ
atm
pHe(
−)
Hae
mol
ymph
Mg2+
(0)
Hae
mol
ymph
Ca2+
(0)
Tho
mse
net
al.(
2010
)
M.
ga
llop
rovi
n-
cia
lisM
edite
rran
ean
mus
sel
Em
bryo
s50
mL
(6)
400
(<10
000)
Sta
gnan
t(5
5,96
and
121
h)
13.0
(35.
5)6
days
No
pHN
BS
8.13
,7.4
2D
evel
opm
ent
rate
from
troc
hoph
ores
(−)
She
llsi
ze(−
)N
orm
alsh
ell
shap
e(−
)
Kur
ihar
aet
al.(
2008
)
Myt
ilus
tro
ssu
-lu
sLa
rvae
22m
L(2
40)
72.6
(330
0)S
tagn
ant
12 (34.
3)60
hN
op
CO
225
3,57
1pH
NS
B8.
3,7.
9S
hell
size
(−)
Sun
day
etal
.(20
11)
Pe
rna
virid
isgr
een-
lippe
dm
usse
l
Juve
nile
s(4
0–44
mm
)
10L
(5)
4(0
.4)
Sta
gnan
t(d
aily
)25 (3
2)5
days
Yes
(1)
pHN
SB
8.1,
7.7,
7.4
Cle
aran
ce(
−)
Res
pira
tion
rate
(0)
Exc
retio
n(−
)atp
H7.
4
Liu
and
He
(201
2)
Pin
cta
da
fuca
tape
arlo
yste
rJu
veni
les
(40–
44m
m)
10L
(5)
4(0
.4)
Sta
gnan
t(d
aily
)25 (3
2)5
days
Yes
(1)
pHN
SB
8.1,
7.7,
7.4
Cle
aran
ce(
−)
atpH
7.4
Res
pira
tion
rate
(0)
Exc
retio
n(−
)
Liu
and
He
(201
2)
www.biogeosciences.net/10/6161/2013/ Biogeosciences, 10, 6161–6184, 2013
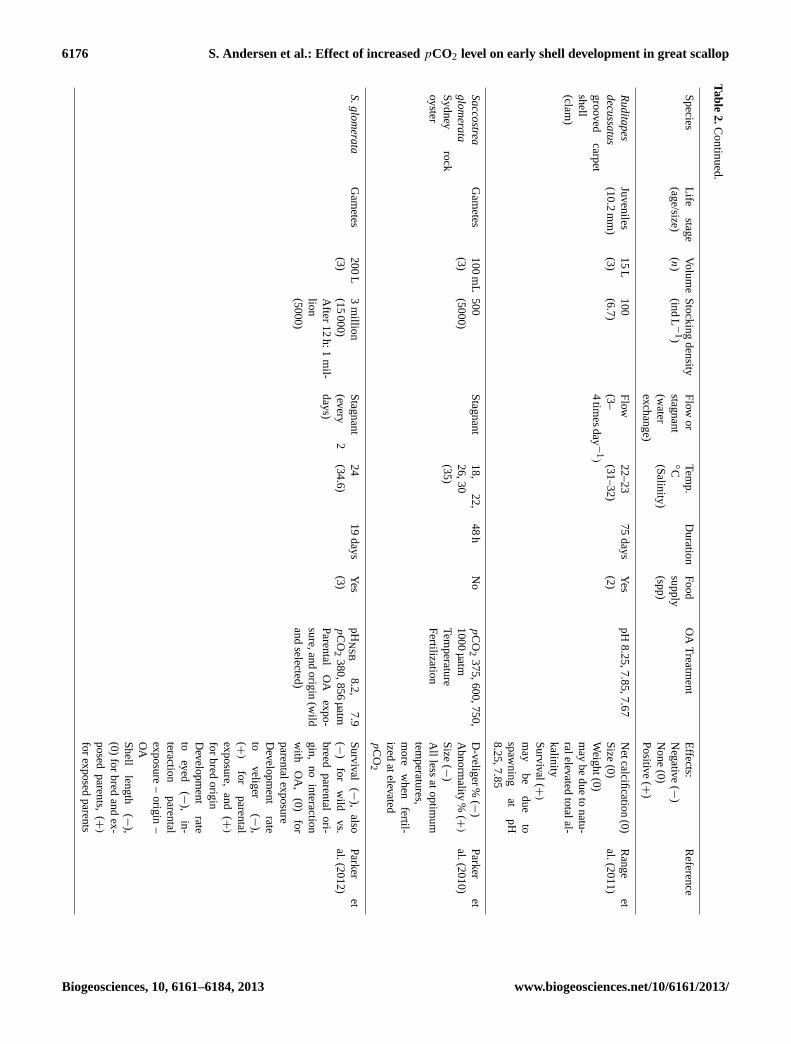
6176 S. Andersen et al.: Effect of increasedpCO2 level on early shell development in great scallop
Table2.C
ontinued.
Species
Lifestage
(age/size)Volum
e(n)
Stocking
density(ind
L−
1)F
lowor
stagnant(w
aterexchange)
Temp.
◦C(Salinity)
Duration
Food
supply(spp)
OA
Treatm
entE
ffects:N
egative(−
)N
one(0)
Positive
(+)
Reference
Ru
dita
pe
sd
ecu
ssatu
sgrooved
carpetshell(clam
)
Juveniles(10.2
mm
)15
L(3)
100(6.7)
Flow
(3–4
times
day −1) 22–23(31–32)
75days
Yes
(2)pH
8.25,7.85,7.67N
etcalcification(0)
Size
(0)W
eight(0)m
aybe
dueto
natu-ralelevated
totalal-kalinityS
urvival(+)
may
bedue
tospaw
ningat
pH8.25,7.85
Range
etal.(2011)
Sa
ccostre
ag
lom
era
taS
ydneyrock
oyster
Gam
etes100
mL
(3)500(5000)
Stagnant
18,22,
26,30(35)
48h
No
pC
O2
375,600,750,1000
µatm
Temperature
Fertilization
D-veliger%
(−)
Abnorm
ality%
(+)
Size
(−)
Allless
atoptimum
temperatures,
more
when
fertil-ized
atelevatedp
CO
2
Parker
etal.(2010)
S.g
lom
era
taG
ametes
200L
(3)3
million
(15000)
After
12h:1
mil-
lion(5000)
Stagnant
(every2
days)
24(34.6)19
daysY
es(3)
pHN
SB
8.2,7.9
pC
O2
380,856µ
atmP
arentalO
Aexpo-
sure,andorigin
(wild
andselected)
Survival
(−),
also(−
)for
wild
vs.breed
parentalori-
gin,no
interactionw
ithO
A,
(0)for
parentalexposureD
evelopment
rateto
veliger(−
),(+
)for
parentalexposure,
and(+)
forbred
originD
evelopment
rateto
eyed(−
),in-
teractionparental
exposure–
origin–
OA
Shell
length(−
),(0)
forbred
andex-
posedparents,
(+)for
exposedparents
Parker
etal.(2012)
Biogeosciences, 10, 6161–6184, 2013 www.biogeosciences.net/10/6161/2013/
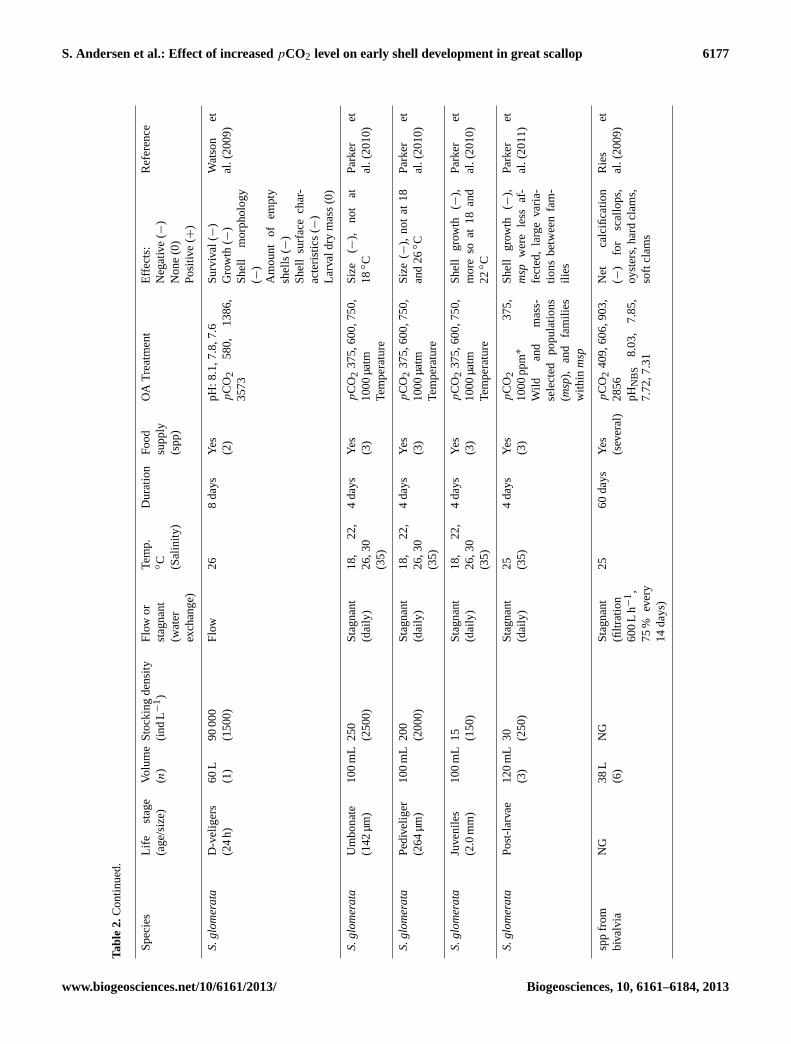
S. Andersen et al.: Effect of increasedpCO2 level on early shell development in great scallop 6177
Tabl
e2.
Con
tinue
d.
Spe
cies
Life
stag
e(a
ge/s
ize)
Volu
me
(n)
Sto
ckin
gde
nsity
(ind
L−1)
Flo
wor
stag
nant
(wat
erex
chan
ge)
Tem
p.◦C (Sal
inity
)
Dur
atio
nF
ood
supp
ly(s
pp)
OA
Tre
atm
ent
Effe
cts:
Neg
ativ
e(−
)N
one
(0)
Pos
itive
(+)
Ref
eren
ce
S.g
lom
era
taD
-vel
iger
s(2
4h)
60L
(1)
9000
0(1
500)
Flo
w26
8da
ysY
es(2
)pH
:8.1
,7.8
,7.6
pC
O2
580,
1386
,35
73
Sur
viva
l(−
)G
row
th(−
)S
hell
mor
phol
ogy
(−)
Am
ount
ofem
pty
shel
ls(−
)S
hell
surf
ace
char
-ac
teris
tics
(−)
Larv
aldr
ym
ass
(0)
Wat
son
etal
.(20
09)
S.g
lom
era
taU
mbo
nate
(142
µm
)10
0m
L25
0(2
500)
Sta
gnan
t(d
aily
)18
,22
,26
,30
(35)
4da
ysY
es(3
)p
CO
237
5,60
0,75
0,10
00µ
atm
Tem
pera
ture
Siz
e(−
),no
tat
18◦C
Par
ker
etal
.(20
10)
S.g
lom
era
taP
ediv
elig
er(2
64µ
m)
100
mL
200
(200
0)S
tagn
ant
(dai
ly)
18,
22,
26,3
0(3
5)
4da
ysY
es(3
)p
CO
237
5,60
0,75
0,10
00µ
atm
Tem
pera
ture
Siz
e(−
),no
tat
18an
d26
◦C
Par
ker
etal
.(20
10)
S.g
lom
era
taJu
veni
les
(2.0
mm
)10
0m
L15 (1
50)
Sta
gnan
t(d
aily
)18
,22
,26
,30
(35)
4da
ysY
es(3
)p
CO
237
5,60
0,75
0,10
00µ
atm
Tem
pera
ture
She
llgr
owth
(−),
mor
eso
at18
and
22◦C
Par
ker
etal
.(20
10)
S.g
lom
era
taP
ost-
larv
ae12
0m
L(3
)30 (2
50)
Sta
gnan
t(d
aily
)25 (3
5)4
days
Yes
(3)
pC
O2
375,
1000
ppm∗
Wild
and
mas
s-se
lect
edpo
pula
tions
(msp
),an
dfa
mili
esw
ithin
msp
She
llgr
owth
(−),
msp
wer
ele
ssaf
-fe
cted
,la
rge
varia
-tio
nsbe
twee
nfa
m-
ilies
Par
ker
etal
.(20
11)
spp
from
biva
lvia
NG
38L
(6)
NG
Sta
gnan
t(fi
ltrat
ion
600
Lh−
1,
75%
ever
y14
days
)
2560
days
Yes
(sev
eral
)p
CO
240
9,60
6,90
3,28
56pH
NB
S8.
03,
7.85
,7.
72,7
.31
Net
calc
ifica
tion
(−)
for
scal
lops
,oy
ster
s,ha
rdcl
ams,
soft
clam
s
Rie
set
al.(
2009
)
www.biogeosciences.net/10/6161/2013/ Biogeosciences, 10, 6161–6184, 2013
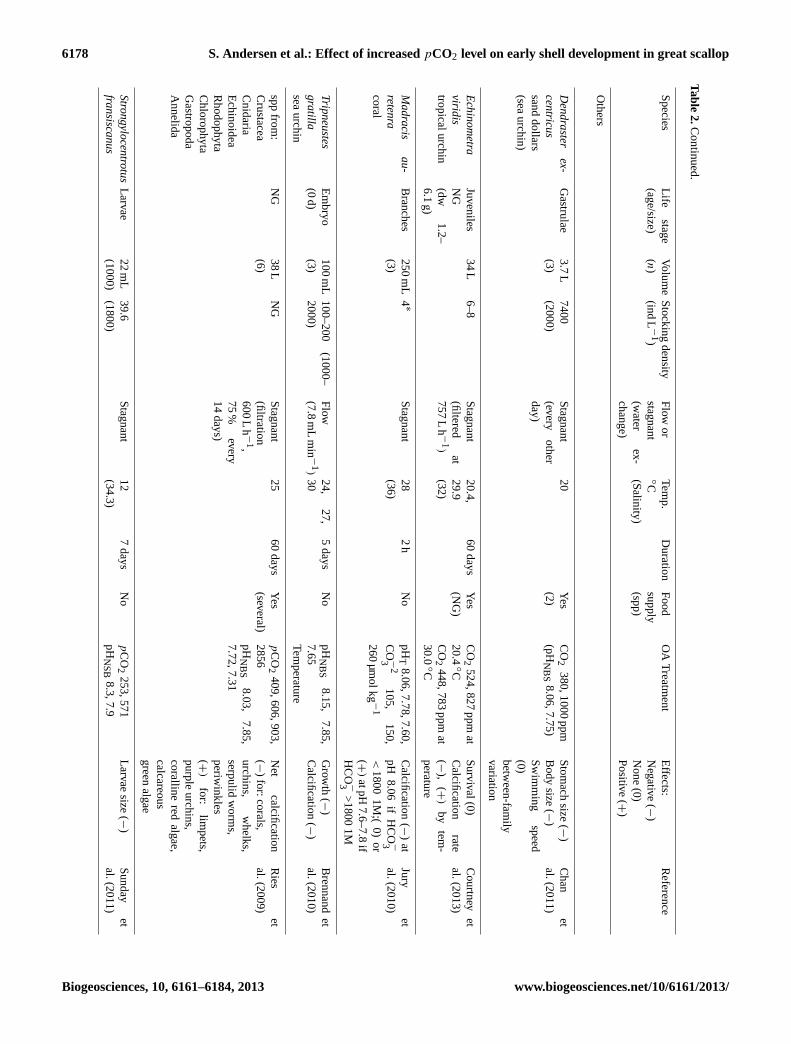
6178 S. Andersen et al.: Effect of increasedpCO2 level on early shell development in great scallop
Table2.C
ontinued.
Species
Lifestage
(age/size)Volum
e(n)
Stocking
density(ind
L−
1)F
lowor
stagnant(w
aterex-
change)
Temp.
◦C(Salinity)
Duration
Food
supply(spp)
OA
Treatm
entE
ffects:N
egative(−
)N
one(0)
Positive
(+)
Reference
Others
De
nd
raste
rex-
cen
tricus
sanddollars
(seaurchin)
Gastrulae
3.7L
(3)7400(2000)
Stagnant
(everyother
day)
20Y
es(2)
CO
2380,1000
ppm(pH
NB
S8.06,7.75)
Stom
achsize
(−)B
odysize
(−)
Sw
imm
ingspeed
(0)betw
een-family
variation
Chan
etal.(2011)
Ech
ino
me
travirid
istropicalurchin
JuvenilesN
G(dw
1.2–6.1
g)
34L
6–8S
tagnant(filtered
at757
Lh−
1)
20.4,29.9(32)
60days
Yes
(NG
)C
O2
524,827ppm
at20.4
◦CC
O2
448,783ppm
at30.0
◦C
Survival(0)
Calcification
rate(−
),(+
)by
tem-
perature
Courtney
etal.(2013)
Ma
dra
cisa
u-
rete
nra
coral
Branches
250m
L(3)
4∗
Stagnant
28(36)
2h
No
pHT
8.06,7.78,7.60,C
O−
23
105,150,
260µ
molkg −
1
Calcification
(−)
atpH
8.06if
HC
O−3
<1800
1M;(
0)or
(+)
atpH7.6–7.8
ifH
CO
−3>
18001M
Juryet
al.(2010)
Trip
ne
uste
sg
ratilla
seaurchin
Em
bryo(0
d)100
mL
(3)100–200
(1000–2000)
Flow
(7.8m
Lm
in−
1)
24,27,
305
daysN
opHN
BS
8.15,7.85,
7.65Tem
perature
Grow
th(−
)C
alcification(−
)B
rennandet
al.(2010)
sppfrom
:C
rustaceaC
nidariaE
chinoideaR
hodophytaC
hlorophytaG
astropodaA
nnelida
NG
38L
(6)N
GS
tagnant(filtration600
Lh−
1,75
%every
14days)
2560
daysY
es(several)
pC
O2
409,606,903,2856pH
NB
S8.03,
7.85,7.72,7.31
Net
calcification(−
)for:corals,
urchins,w
helks,serpulid
worm
s,periw
inkles(+
)for:
limpets,
purpleurchins,
corallinered
algae,calcareousgreen
algae
Ries
etal.(2009)
Stro
ng
yloce
ntro
tus
fran
siscan
us
Larvae22
mL
(1000)39.6(1800)
Stagnant
12(34.3)
7days
No
pC
O2
253,571pH
NS
B8.3,7.9
Larvaesize
(−)
Sunday
etal.(2011)
Biogeosciences, 10, 6161–6184, 2013 www.biogeosciences.net/10/6161/2013/
S. Andersen et al.: Effect of increasedpCO2 level on early shell development in great scallop 6179
4.3 Inter- and intra-species response and synergisticfactors
In the present study scallop larvae showed a reduction inshell size, survival, and percentage of normally developedlarvae from the ambient group to the highestpCO2 group(discussed in further detail in the sections below). These re-sponses to OA seem to vary little between bivalve species(Table 2). However, the magnitude of the response vary, al-though the pH window, temperature, and rearing volumeused during experiments vary, and one should be carefulin drawing conclusions about species-specific effects be-tween studies. Comparative studies of two (Sunday et al.,2011; Parker et al., 2010; Talmage and Gobler, 2010) or sev-eral species (Liu and He, 2012; Ries et al., 2009; Talmageand Gobler, 2009, 2011) mostly conclude that species havedifferent sensitivity to OA. Within-species and between-population variation was reported by Parker et al. (2011)when they investigated differences between a wild popula-tion and selectively bred populations in sensitivity to OA ex-posure. Their results indicated that sensitivity to rearing con-ditions may have been different between the populations, asgrowth rate in the ambient group was higher for the selectedgroup. This may have overestimated the differences in sensi-tivity to OA exposure alone.
Many factors may contribute to a synergistic response ofa species to OA exposure (Table 2). Some have been in-vestigated for early life stages of bivalves: food availability(Thomsen et al., 2010, 2013; Melzner et al., 2011), tempera-ture (Brennand et al., 2010; Courtney et al., 2013; Parker etal., 2010; Talmage and Gobler, 2011), salinity (Dickinson etal., 2012), parental exposure to OA (Parker et al., 2012), fer-tilization under OA conditions (Parker et al., 2010), and ge-netic selection (populations or families, Parker et al., 2011,2012). Additionally, there are other external factors that havenot yet been investigated that may impact OA effects throughreducing or improving the energy level: rearing volume, diet,day length, UV radiation, etc.
A large part of the work undertaken to investigate effectsof OA on marine mollusc larvae has been carried out involumes of 50 mL–200 L (Table 2). Wernberg et al. (2012)points out that it may be problematic that so many experi-mental studies of ocean acidification effects are undertakenin relatively small volumes. Although the larvae are small insize, small rearing volumes may not give a sufficiently sta-ble rearing environment, and result in negative environmen-tal stress. The volume of exposure tanks in the present studywas 38 L, and we cannot rule out that these tanks are toosmall to keep variations in the rearing environment at a lowlevel. However, the low variation in survival in the controlgroup indicates that the experimental conditions were withinacceptable limits.
None of the studies conducted on bivalve larvae are di-rectly comparable with the present study (Table 2). WhenpCO2 was relatively similar, the experiments were con-
ducted in stagnant systems with different rearing volumesand densities, or the larvae were fed. As discussed above, allthese factors may be synergistic. Larvae in our experimentwere reared from eggs of one individual and sperm fromthree different individuals (i.e. three half-sibling groups) af-ter being well mixed and distributed in equal densities in theexperimental tanks. We assume that the half-sibling groupswere distributed more or less equally in the tanks, and thevariation we found between tanks is most likely not a resultof family differences (intra-species differences).
4.4 Larvae survival
The survival of day-7 veligers for the ambient group repli-cates in this study was 25–46 %. In comparison, the aver-age survival of day-3 veligers (referred to as hatching) ina Norwegian hatchery was 36.7 % of 12 broodstock groups(Magnesen et al., 2006). This indicates that the larval groupused in the present study was viable and healthy. In thetreatment groups, median survival was reduced by 41–74 %,which was much higher compared to larvae of hard clam (M.mercenaria), bay scallop (A. irradians), and eastern oyster(C. virginica) (Talmage and Gobler, 2009). The highest re-duction in survival on day 6 for these larvae was 20 % forthe oyster larvae at 64 and 150 Pa CO2 (pH 7.83–7.85 andpH 7.48–7.50, respectively) when ambient conditions were36 Pa (pH 8.02–8.08). A study on abalone larvae (Haliotiskamtschatkana) showed that both survival and growth werereduced by 40 % on day 8, when CO2 was elevated from anambient 400 ppm up to 800 ppm (Crim et al., 2011). Thesevariations in survival may indicate inter-species differences,but we cannot rule out that the variation at least partly maybe a result of the differences in experimental design (culturevolume, water regime, feeding regime).
In an OA study on the Pacific oyster,C. gigas, Gazeau etal. (2011) manipulated theAT levels in one of their treatmentgroups and showed that the saturation level of CO2−
3 had amore severe effect on development and shell growth in oys-ter embryos than did the pH orpCO2 level. However, noneof the other OA experiments on bivalve larvae have manipu-lated theAT level, and thus elevatedpCO2 levels seem to bethe most plausible cause of reduced survival in these studies.Although survival of bivalve larvae in OA studies shows asignificant variation, a clear trend of a negative effect due toelevatedpCO2 levels or lower pH is found (Table 2). Of sixstudies calculating survival on larvae, all reported a negativeeffect on survival (Table 2).
4.5 Larvae shell size
On day 7 larvae size (shell length and shell height) wassmaller in the treatment groups compared to the group heldin ambient water, but no difference was found betweenthe two mid-treatment groups (807 and 1164 µatm). Re-duced shell growth is in accordance with previous stud-
www.biogeosciences.net/10/6161/2013/ Biogeosciences, 10, 6161–6184, 2013
6180 S. Andersen et al.: Effect of increasedpCO2 level on early shell development in great scallop
ies (Table 2). Gaylord et al. (2011) found that when CO2concentration increased from ambient 380 to 970 ppm, theshell area of mussel larvae (Mytilus californianus) on day5 and day 7 was reduced by 7 and 5 %, respectively. Kuri-hara et al. (2007) showed the shell length of oyster (C. gi-gas) larvae after 48 h to be ca. 20 % smaller at apCO2 of2268 µatm (pH 7.42) than at the ambient 348 µatm (pH 8.21).Kurihara et al. (2008) also found that the shell length ofMytilus galloprovincialislarvae was reduced by about 20 %after six days when pH was reduced from the ambient 8.05(14.3 µmol CO2 kg−1) to 7.43 (83.3 µmol CO2 kg−1). Parkeret al. (2010) found a synergistic effect of elevatedpCO2and suboptimal temperatures on larvae size of the two oysterspeciesSaccostrea glomerataandC. gigas, the first being themost sensitive to the exposure.
The reduction in shell growth found in the present studywas at the lower end of the scale compared to other stud-ies. This may reflect an inter-species difference, and indicatesthatP. maximusshell growth is not the most sensitive to OAcompared to other bivalves. However, the high reduction insurvival may indicate that other physiological processes arehighly affected by OA. The duration of the study was onlyseven days, and keeping the scallop larvae in the same con-ditions throughout the larval cycle will allow for elucidationof how OA affects growth, survival, and the critical metamor-phosis over a longer term.
4.6 Shell deformities
In the present study the percentage of normally developedlarvae on day 7 was 64 % in the control group. The commonratio of normal shell development inP. maximuslarvae hasbeen poorly described and is not known. In a control group ofoyster (C. gigas) larvae, Kurihara et al. (2007) described that68 % developed into normal D-shaped veligers, and 72 % ofthese larvae had fully mineralized shells after 48 h. This wasexplained as rather low values for the control group, and wassupposed to be a result of using gonadal stripping to producethe embryos. In a study onM. galloprovincialis, Kurihara etal. (2008) reported abnormal morphology in< 1 % of controllarvae, showing that the variation in percentage of normallydeveloped larvae may vary between species, although otherconditions may play a significant role.
The percentage of deformed larvae varied highly betweenthe treatments in our study, and the results showed a tendencyof more shell deformities with increasingpCO2 levels. Thenegative effects observed have been reported also in otherOA studies on bivalves (Table 2). Watson et al. (2009) foundthat in 8-day-oldS. glomeratalarvae, both shell morphologyand shell surface characteristics were negatively affected byreduced pH (7.8 and 7.6). Talmage and Gobler (2010) foundthat the level of CO2 strongly affected the development ofthe hinge structure in larvae ofM. mercenariaandA. irradi-ansusing CO2 levels of 250 (pre-industrial), 390 (ambient),750, and 1500 ppm. They found a decline in size, integrity,
and connectedness of the hinge with increasing CO2 levels.As the authors pointed out, the hinge facilitates opening andclosing of the shell, which again is crucial for both feedingand excretion. Losing the ability to perform these basic func-tions most certainly has a negative effect on larval survival.In the present study, the higher percentage of normally de-veloped hinges on day 7 compared to day 2 in all larvaegroups was most likely a result of increased mortality of ab-normal larvae from day 2 to 7. The final sample at the endof the experiment did not show a high amount of deformedempty shells to confirm this assumption. However, empty lar-vae shells are extremely fragile and dissolve fast (and evenfaster in low-pH water), which may explain why we did notfind high numbers of them in the final samples. In future ex-periments, more frequent sampling may reveal whether thedeformed larvae die off throughout the experimental period.
It is known that other factors like self-fertilization, highegg : sperm ratio, temperature, and pollutants may cause anincrease in larval deformities (Conroy et al., 1996; Spangen-berg and Cherr, 1996; His et al., 1997; Krassoi et al., 1997,Concha et al., 2011; Kobayashi and Kijima, 2010). It has alsobeen reported that factors in the rearing environment such assmall rearing volumes, stagnant systems, addition of antibi-otics, or pulse feeding may cause larvae deformities in con-trol groups (Kurihara et al., 2007, 2008; Talmage and Gob-ler, 2009, 2010, 2011; Waldbusser et al., 2010; Gaylord etal., 2011; Gazeau et al., 2011). Although we cannot rule outthe effect of small rearing volumes, other factors should playa minor role in the present study as we cross-fertilized theeggs to minimize the amount of self-fertilization, egg : spermratio was within the recommended numbers (Martinez et al.,2007; S. Andersen, personal communication, 2012), temper-ature was within the optimum range (Davenport et al., 1975),we used a flow-to-waste system, and no antibiotics or feedwere added.
The ambient water used for the control group in the presentstudy had a pH of 7.98, which was 0.19 units lower than thepH values Talmage and Gobler (2010) used when mimickingthe pre-industrial level to investigate past, present and futureocean CO2 concentrations. They found improved results atpre-industrial pH levels compared to ambient pH levels of8.05 and 8.04. The shell deformities we found in our controlgroup may therefore at least partly be a result of an alreadyelevated CO2 level; thus future studies onP. maximusshouldinclude experimental groups kept in pre-industrial CO2 con-ditions to elucidate whether the ongoing OA already mayhave an impact on scallop larvae.
For the seven OA studies looking at the normal develop-ment of bivalve embryos and larvae (a total of seven differ-ent species), all reported a negative effect of elevated CO2levels (Table 2). Although the results in our study showeda high variation in shell edge deformities between treatmentgroups, the percentage of hinge deformities increased withincreasingpCO2 levels. As the determination of shell edgedeformities can be a bit challenging due to damage caused
Biogeosciences, 10, 6161–6184, 2013 www.biogeosciences.net/10/6161/2013/
S. Andersen et al.: Effect of increasedpCO2 level on early shell development in great scallop 6181
by handling the samples, calculating the amount of hinge de-formity is probably a better estimate of abnormalities in ourstudy.
4.7 Calcification
In the present study we confirmed that calcein bonded to thecalcium in 1–2-day-old trochophore larvae, confirming sim-ilar timing for calcification inP. maximuslarvae as in larvaeof M. mercenariaandC. gigas(Weiss et al., 2002), but atan earlier stage than was suggested by Cass et al. (1998) andCragg (2006). We were unable to determine the exact timeof initiation of calcification in the larvae since the stainingperiod was 18–20 h. Staining embryos and larvae frequently(e.g. every 5 h) for a shorter period (e.g 3 h) from day 0 today 2 may reveal more details on the exact onset of the calci-fication process. Comeau et al. (2009) used calcein stainingof the pteropodLimacina helicinato compare shell extensionin animals held atpCO2 levels of 350 and 760 µatm over aperiod of five days. Although too few organisms were usedto get statistically robust quantitative estimations, the resultsshowed that shell extension in pteropods held at the highestpCO2 levels were lower compared to those held at 350 µatm.Future OA experiments onP. maximuslarvae should eluci-date whether calcein staining can be used to calculate calcifi-cation either as shell extension or size of shell area in larvaeheld at differentpCO2 levels.
4.8 Concluding remarks and future work
The rather severe effects of elevated futurepCO2 levels ona number of bivalve larvae seem undisputable (Table 2). Tal-mage and Gobler (2010) showed that the CO2 levels of to-day may already affect bivalve larvae negatively comparedto pre-industrial levels, and hence, negative effects of OA arehappening today rather than in the future. Also, OA shouldbe seen in combination with the increase in global ocean tem-perature (Blunden and Arndt, 2013). Effects of a temperatureincrease may amplify the OA effects or reduce them. Tal-mage and Gobler (2011) showed that the negative effects ofelevated CO2 and temperature on larvae were additive.
Long-term studies on larvae of the great scallopP. max-imusare needed to elucidate the effect of OA throughout thelarvae stages, metamorphosis, and settlement, and also thepotential of an evolutionary response in larval developmentrate. Such studies should involve assessment of the energybudget, take place in facilities that allow a normal develop-ment, and include studies on temperature effects. Effects onimportant processes for survival, such as immune defencefunctions, feeding rate, and shell mass and strength shouldalso be investigated. More studies using calcein at the earli-est larvae stages (day 0–2) are needed to increase knowledgeabout the onset of the larval shell calcification process, whichis crucial to the existence of calcifying organisms.
Supplementary material related to this article isavailable online athttp://www.biogeosciences.net/10/6161/2013/bg-10-6161-2013-supplement.pdf.
Acknowledgements.We thank Ørjan Karlsen for helpful assistancewith statistics, and the staff at the Institute of Marine Research –Austevoll Research Station for rearing broodstock, producing algalfeed, mixing chemical solutions, and assisting in photographicwork. This study was supported by the Institute of Marine Researchthrough project number 13192-04, Ocean Acidification – Scallops.
Edited by: D. Schmidt
References
Andersen, S., Christophersen, G., and Magnesen, T.: Spat produc-tion of the great scallop (Pecten maximus): a roller coaster, Can.J. Zool., 89, 585–604, doi:10.1139/z11-035, 2011.
Andersen, S., Christophersen, G., and Magnesen, T.: Implica-tions of larval diet concentration on post-larval yield in aproduction scale flow through system for scallops (Pectenmaximus Lamarck) in Norway, Aquacult. Int., 15, 1–18,doi:10.1007/s10499-012-9570-0, 2012.
Barros, P., Sobral, P., Range, P., Chícharo, L., and Matias, D.: Ef-fects of sea-water acidification on fertilization and larval devel-opment of the oyster Crassostrea gigas, J. Exp. Mar. Biol. Ecol.,440, 200–206, doi:10.1016/j.jembe.2012.12.014, 2013.
Bechmann, R. K., Taban, I. C., Westerlund, S., Godal B. F., Arn-berg, M., Vingen, S., Ingvarsdottir, A., and Baussant, T.: Effectsof ocean acidification on early life stages of shrimp (Pandalusborealis) and mussel (Mytilus edulis), J. Toxicol. Env. Heal. A,74424–74438, doi:101080/15287394.2011.550460, 2011.
Beesley, A., Lowe, D. M., Pascoe, C. K, and Widdicombe, S.:Effects of CO2-induced seawater acidification onthe health ofMytilus edulis, Clim. Res., 37, 215–225, doi:10.3354/cr00765,2008.
Bellioli, G., Lohrman, K., and Dupré, E.: Larval morphology of thescallop Argopecten purpuratus as revealed by scanning electronmicroscopy, The Veliger, 36, 332–342, 1993.
Beniash, E., Ivanina, A., Lieb, N. S., Kurochkin, I., and Sokolova, I.M.: Elevated level of carbon dioxide affects metabolism and shellformation in oysters Crassostrea virginica, Mar. Ecol.-Prog. Ser.,419, 95–108, doi:10.3354/meps08841, 2010.
Blackford, J. C. and Gilbert, F. J.: pH variability and CO2 inducedacidification in the North Sea, J. Marine Syst., 64, 229–241,doi:10.1016/j.jmarsys.2006.03.016, 2007.
Blunden, J. and Arndt, D. S.: State of the climate in 2012, B. Am.Meteorol. Soc., 94, S1–S258, 2013.
Bourne, N. F.: The potential for scallop culture – the next mille-nium, Aquacult. Int., 8, 113–122, 2000.
Brennand H. S., Soars, N., Dworjanyn, S. A., Davis, A.R., and Byrne, M.: Impact of Ocean Warming and OceanAcidification on Larval Development and Calcification inthe Sea Urchin Tripneustes gratilla, PLoS ONE 5, e11372,doi:10.1371/journal.pone.0011372, 2010.
www.biogeosciences.net/10/6161/2013/ Biogeosciences, 10, 6161–6184, 2013
6182 S. Andersen et al.: Effect of increasedpCO2 level on early shell development in great scallop
Byrne, M.: Global change ecotoxicology: Identification of earlylife history bottlenecks in marine invertebrates, variable speciesresponses and variable experimental approaches, Mar. Environ.Res, 76, 3–15, doi:10.1016/j.marenvres.2011.10.004, 2012.
Caldeira, K. and Wickett, M. E.: Anthropogenic carbon and oceanpH, Nature, 425, 365, 2003.
Casse, N., Devauchelle, N., and Le Pennec, M.: Embryonic shellformation in the scallop Pecten maximus (Linnaeus), Veliger, 41,133–141, 1998.
Chan, K. Y., Grünbaum, K. D., and O’Donnell, M.: Effectsof ocean-acidification-induced morphological changes on lar-val swimming and feeding, J. Exp. Biol., 214, 3857–3867,doi:10.1242/jeb.054809, 2011.
Chaparro, O. R., Montory, J. A., Segura, C. J., and Pechenik, J.A.: Effect of reduced pH on shells of brooded veligers in theestuarine bivalve Ostrea chilensis (Philippi, 1845), J. Exp. Mar.Biol. Ecol., 377, 107–112, doi:10.1016/j.jembe, 2009.
Chick, R. C.: Batch tagging blacklip abalone (Haliotis rubra) foridentification of harchery-reared individuals on natural coastalreefs in New South Wales, Australia, J. Shellfish Res., 29, 209–215, 2010.
Comeau, S., Gorsky, G., Jeffree, R., Teyssié, J.-L., and Gattuso,J.-P.: Impact of ocean acidification on a key Arctic pelagicmollusc (Limacina helicina), Biogeosciences, 6, 1877–1882,doi:10.5194/bg-6-1877-2009, 2009.
Comeau, S., Gorsky, G., and Gattuso, J.-P.: Larvae of the pteropodCavolinia inflexa exposed to aragonite undersaturation are viablebut shell-less, Mar. Biol., 157, 2341–2345, 2010.
Comely, C. A.: Larval culture of the scallop, Pecten maximus, J.Cons. Int. Explor. Mer., 34, 365–378, 1972.
Concha, C., Figueroa, E., and Winkle, F. M.: Association betweenself-fertilization rates and the frequency of malformed larvae infarmed populations of the northern scallop Argopecten purpu-ratus (Lamarck, 1819), Lat. Am. J. Aquat. Res., 39, 327–337,doi:10.3856/vol39-issue2-fulltext-14, 2011.
Conroy, P. T., Hunt, J. W., and Anderson, B. S.: Validationof a short-term toxicity test endpoint by comparison withlonger-term effects on larval red abalone Haliotis rufescens,Env. Toxicol. Chem., 15, 1245–1250, doi:10.1897/1551-5028(1996)015<1245:voastt>2.3.co;2, 1996.
Courtney, T., Westfield, I., and Ries, J. B.: CO2-induced oceanacidification impairs calcification in the tropical urchin Echi-nometra viridis, J. Exp. Mar. Biol. Ecol., 440, 169–175,doi:10.1016/j.jembe.2012.11.013, 2013.
Cragg, S. M.: Development, physiology, behavior, and ecology ofscallop larvae, 45–122. In Scallops: Biology, ecology, and aqua-culture, edited by: Shumway, S. E. and Parsons, G. J., Elsevier,2006.
Crim, R. N., Sunday, J. M., and Harley, C. D. G.: Elevated sea-water CO2 concentrations impair larval development and re-duce larval survival in endangered northern abalone (Haliotiskamtschatkana), J. Exp. Mar. Biol. Ecol., 400, 272–277, 2011.
Day, R. W., Williams, M. C., and Hawkes, G. P.: A comparison offluorochromes for marking abalone shells, Mar. Freshwater Res.,46, 599–605, 1995.
Davenport, J., Gruffydd, L. D., and Beaumont, A. R.: An apparatusto supply water of fluctuating salinity and its use in a study of thesalinity tolerances of larvae of the scallop Pecten maximus L., J.Mar. Biol. Assoc. UK, 55, 391–409, 1975.
Desrosiers, R. R., Désilets, J., and Dubé, F.: Early developmen-tal events following fertilization in the giant scallop Placopectenmagellanicus, Can. J. Fish. Aquat. Sci., 53, 1382–1392, 1996.
Dickinson, G. H., Ivanina, A. V., Matoo, O. B., Pörtner, H. O.,Lannig, G., Bock, C., Beniash, E., and Sokolova, I. M.: Inter-active effects of salinity and elevated CO2 levels on juvenileeastern oysters, Crassostrea virginica, J. Exp. Biol., 215, 29–43,doi:10.1242/jeb.061481, 2012.
Dupont, S., Ortega-Martínez, O., and Thorndyke, M.: Impact ofnear-future ocean acidification on echinoderms, Ecotoxicology,19, 449–462, doi:10.1007/s10646-010-0463-6, 2010.
Ericson, J. A., Lamare, M. D., Morley, S. A., and Barker, M. F.: Theresponse of two ecologically important Antarctic invertebrates(Sterechinus neumayeri and Parborlasia corrugates) to reducedseawater pH: effects on fertilization and embryonic development,Mar. Biol., 157, 2689–2702, 2010.
Fabry, V. J., Seibel, B. A., Feely, R. A., and Orr, J. C.: Impactsof ocean acidification on marine fauna and ecosystem processes,ICES J. Mar. Sci., 65, 414–432, 2008.
FAO: Food and Agriculture Organization of the United Nations,Fisheries and Aquaculture Information and Statistics Service,Rome, Italy, 2010.
Fitzpatrick, M. P., Jeffs, A. G., and Dunphy, B. J.: Identifica-tion of the optimal fluorochrome for marking larvae of the pul-monate limpet Siphonaria australis, J. Shellfish Res., 29, 941–944, doi:10.2983/035.029.0427, 2010.
Gaylord, B., Hill, T. M., Sanford, E., Lenz, E. A., Jacobs, L. A.,Sato, K. N., Russell, A. D., and Hettinger, A.: Functional im-pacts of ocean acidification in an ecologically critical foundationspecies, J. Exp. Biol., 214, 2586–2594, doi:10.1242/jeb.055939,2011.
Gazeau, F., Gattuso, J.-P., Dawber, C., Pronker, A. E., Peene, F.,Peene, J., Heip, C. H. R., and Middelburg, J. J.: Effect of oceanacidification on the early life stages of the blue mussel Mytilusedulis, Biogeosciences, 7, 2051–2060, doi:10.5194/bg-7-2051-2010, 2010.
Gazeau, F., Gattuso, J.-P., Greaves, M., Elderfield, H., and Peene,J.: Effect of Carbonate Chemistry Alteration on the Early Em-bryonic Development of the Pacific Oyster (Crassostrea gi-gas), PLoS ONE, 6, e23010, doi:10.1371/journal.pone.0023010,2011.
Hall-Spencer, J. M., Rodolfo-Metalpa, R., Martin S., Ran-some, E., Fine, M., Turner, S. M., Rowley, S. J., Tedesco,D., and Buia, M.-C.: Volcanic carbon dioxide vents showecosystem effects of ocean acidification, Nature, 454, 96–99,doi:10.1038/nature07051, 2008.
His, E., Seaman, M. N. L., and Beiras, R.: A simplification the bi-valve embryogenesis and larval development bioassay methodfor water quality assessment, Water Res., 31, 351–355, 1997.
Hoegh-Guldberg, O., Mumby, P. J., Hooten, A. J., Steneck, R. S.,Greenfield, P., Gomez, E., Harvell, C. D. , Sale, P. F., Edwards,A. J., Caldeira, K., Knowlton, N., Eakin, C. M., Iglesias-Prieto,R., Muthiga, N., Bradbury, R. H. , Dubi, A., and Hatziolos, M.E.: Coral Reefs Under Rapid Climate Change and Ocean Acidifi-cation, Science, 318, 1737, doi:10.1126/science.1152509, 2007.
IPCC: Climate Change 2001: The Scientific Basis, in: Contributionof Working Group I to the Third Assessment Report of the In-tergovermental Panel on Climate Change, edited by: Houghton,J. T., Ding, Y., Griggs, D. J., Noguer, M., van der Linden, P. J.,
Biogeosciences, 10, 6161–6184, 2013 www.biogeosciences.net/10/6161/2013/
S. Andersen et al.: Effect of increasedpCO2 level on early shell development in great scallop 6183
Dai, X., Maskell, K., and Johnson, C. A., Cambridge UniversityPress, Cambridge, UK and New York, NY, USA, 881 pp., 2001.
Jury, C. P., Whitehead, R. F., and Szmant, A. M.: Effects ofvariations in carbonate chemistry on the calcification ratesof Madracis auretenra (= Madracis mirabilis sensu Wells,1973): bicarbonate concentrations best predict calcificationrates, Glob. Change Biol. 16, 1632–1644, doi:10.1111/j.1365-2486.2009.02057.x, 2010.
Kerrison, P., Hall-Spencer, J. M., Suggett, D. J., Hepburn, L. J., andSteinke, M.: Assessment of pH variability at a coastal CO2 ventfor ocean acidification studies, Estaur. Coast. Shelf S., 94, 129–137, doi:10.1016/j.ecss.2011.05.025, 2011.
Kobayashi, T. and Kijima, A.: Effects of inbreeding depression inPacific abalone Haliotis discus hannai, J. Shellfish Res., 29, 643–649, 2010.
Kudo, M., Kameda, J., Saruwatari, K., Ozaki, N., Okano, K., Naga-sawa, H., and Kogure, T.: Microtexture of larval shell of oyster,Crassostrea nippona: A FIB-TEM study, J. Struct. Biol., 169, 1–5, doi:10.1016/j.jsb.2009.07.014, 2010.
Kurihara, H.: Effects of CO2-driven ocean acidification on the earlydevelopmental stages of invertebrates, Mar. Ecol.-Prog. Ser., 373,275–284, doi:10.3354/meps07802, 2008.
Kurihara, H., Kato, S., and Ishimatsu, A.: Effects of increased sea-waterpCO2 on early development of the oyster Crassostrea gi-gas, Aquat. Biol., 1, 91–98, doi:10.3354/ab00009, 2007.
Kurihara, H., Asai, T., Kato, S., and Ishimatsu, A.: Effects of el-evatedpCO2 on early development in the mussel Mytilus gal-loprovincialis, Aquat. Biol., 4, 225–233, doi:10.3354/ab00109,2008.
Körbl, J. and Vydra, F.: Metallochromic indicators. IV. A noteon the preparation and properties of “calcein”, Collect. CzechChem. C., 23, 622–627, 1958.
Krassoi, R., Anderson, I., and Everett, D.: Larval abnormalitiesin doughboy scallops Chlamys (mimachlamys) asperrima L. Inresponse to test conditions and six reference toxicants, Aus-tralasian Journal of Ecotoxicology, 3, 65–74, 1997.
Kroeker, K. J., Kordas, R. L., Crim, R. N. and Singht, G. G.: Meta-analysis reveals negative yet variable effects of ocean acidifica-tions on marine organisms, Ecol. Lett., 13, 1419–1434, 2010.
Le Pennec, M., Paugam, A., and Le Pennec, G.: The pelagic lifeof pectinid Pecten maximus – a review, ICES J. Mar. Sci., 60,211–223, 2003.
Liu, W. and He, M.: Effects of ocean acidification on the metabolicrates of three species of bivalve from southern coast of China,Chin. J. Oceanol. Limn., 30, 206–211, doi:10.1007/s00343-012-1067-1, 2012.
Lucas, T., Palmer, P. J., Wang, S., Scoones, R., and O’Brien, E.:marking the shell of the saucer scallop Amusium balloti for searanching using oxytetracycline, calcein and Alizarin red, J. Shell-fish Res., 27, 1183–1188, 2008.
Mackie, G. L.: Bivalves, in: The Mollusca, 7, Reproduction, editedby: Trompa, A. S., Verdonk, N. H., and Van Den Biggelaar, J. A.M., Academic Press, San Diego, 351–403, 1984.
Magnesen, T., Bergh, Ø., and Christophersen, G.: Yields of greatscallop, Pecten maximus, larvae in a commercial flow-throughsystem in Norway, Aquacult. Int., 14, 377–394, 2006.
Martinez, G., Mettifogo, L., Perez, M. A., and Callejas, C.:A method to eliminate self-fertilization in a simultane-ous hermaphrodite scallop. 1. Effects on growth and sur-
vival of larvae and juveniles, Aquaculture, 273, 459–469,doi:10.1016/j.aquaculture.2007.10.033, 2007.
Melzner, F., Stange, P., Trübenbach, K., Thomsen, J., Casties, I.,Panknin, U., Gorb, S. N., and Gutowska, M. A.: Food Supply andSeawater pCO2 Impact Calcification and Internal Shell Dissolu-tion in the Blue Mussel Mytilus edulis, PLoS ONE, 6, e24223,doi:10.1371/journal.pone.0024223, 2011.
Moran, A. L.: Calcein as a marker in experimental stud-ies newly-hatched gastropods, Mar. Biol., 137, 893–898,doi:10.1007/s002270000390, 2000.
Moran, A. L. and Marko, P. B.: A simple technique for physicalmarking of larvae of marine bivalves, J. Shellfish Res., 24, 567–571, 2005.
Orr, J. C., Fabry, V. J., Aumont, O., Bopp, L., Doney, S. C.,Feely, R. A., Gnanadesikan, A., Gruber, N., Ishida, A., Joos, F.,Key, R. M., Lindsay, K., Maier-Reimer, E., Matear, R., Mon-fray, P., Mouchet, A., Najjar, R. G., Plattner, G.-K., Rodgers,K. B., Sabine, C. L., Sarmiento, J. L., Schlitzer, R., Slater, R.D., Totterdell, I. J., Weirig, M.-F., Yamanaka, Y., and Yool, A.:Anthropogenic ocean acidification over the twenty-first centuryand its impact on calcifying organisms, Nature, 437, 681–686,doi:10.1038/nature04095, 2005.
Pane, E. F. and Barry, J. P.: Extracellular acid-base regulation duringshort-term hypercapnia is effective in a shallow-water crab, butineffective in a deep-sea crab, Mar. Ecol.-Prog. Ser., 334, 1–9,2007.
Parker, L. M., Ross, P. M., and O’Connor, W. A.: Comparing the ef-fect of elevatedpCO2 and temperature on the fertilization andearly development of two species of oysters, Mar. Biol., 157,2435–2452, doi:10.1007/s00227-010-1508-3, 2010.
Parker, L. M., Ross, P. M., and O’Connor, W. A.: Popula-tions of the Sydney rock oyster, Saccostrea glomerata, varyin response to ocean acidification, Mar. Biol., 158, 689–697,doi:10.1007/s00227-010-1592-4, 2011.
Parker, L. M., Ross, P. M., O’Connor, W. A., Borysko, L., Raftos,D. A., and Pörtner, H.-O.: Adult exposure influences offspringresponse to ocean acidification in oysters, Glob. Change Biol.,18, 82–92, doi:10.1111/j.1365-2486.2011.02520.x, 2012.
Pierrot, D. E., Lewis, D. W., and Wallace, R.: MS Excel ProgramDeveloped for CO2 System Calculations, ORNL/CDIAC-105a. Carbon Dioxide Information Analysis Center, Oak RidgeNational Laboratory, US Department of Energy, Oak Ridge, Ten-nessee, doi:10.3334/CDIAC/otg.CO2SYS_XLS_CDIAC105a,2006.
Range, P., Chícharo, M. A., Ben-Hamadou, R., Piló, D., Matias,D., Joaquim, S., Oliveira, A. P., and Chíchar, L.: Calcification,growth and mortality of juvenile clams Ruditapes decussatus un-der increasedpCO2 and reduced pH: Variable responses to oceanacidification at local scales?, J. Exp. Mar. Biol. Ecol., 396, 177–184, doi:10.1016/j.jembe.2010.10.020, 2011.
Raven, J., Caldeira, K., Elderfield, H., Hoegh-Guldberg, O., Liss,P., Riebesell, U., Sheperd, J.,Turley C., and Watson, A.: Oceanacidification due to increasing atmospheric carbon dioxide, TheRoyal Society. 2005.
Ries, J. B., Cohen, A. L., and McCorkle, D. C.: Marine calcifiersexhibit mixed responses to CO2-induced ocean acidification, Ge-ology, 37, 1131–1134, doi:10.1130/G30210A.1, 2009.
Schalkhausser, B., Bock, C., Stemmer, K., Brey, T., Pörtner, H.-O.,and Lanning, G.: Impact of ocean acidification on escape perfor-
www.biogeosciences.net/10/6161/2013/ Biogeosciences, 10, 6161–6184, 2013
6184 S. Andersen et al.: Effect of increasedpCO2 level on early shell development in great scallop
mance of the king scallop, Pecten maximus, from Norway, Mar.Biol., doi:10.1007/s00227-012-2057-8, 2012.
Spangenberg, J. V. and Cherr, G. N.: Developmental effects of bar-ium exposure in a marine bivalve (Mytilus californianus), Envi-ron. Toxicol. Chem., 15, 1769–1774, 1996.
Strand, Ø. and Parson, G. J.: Scandinavia, 1067–1091, in: Scallops:Biology, ecology, and aquaculture, edited by: Shumway, S. E.and Parsons, G. J., Elsevier, 2006.
Sunday, J. M., Crim, R. N., Harley, C. D. G., and Hart,M. W.: Quantifying rates of evolutionary adaptation inresponse to ocean acidification, PLoS ONE, 6, e22881,doi:10.1371/journal.pone.0022881, 2011.
Talmage, S. C. and Gobler, C. J.: The effects of elevated carbondioxide concentrations on the metamorphosis, size, and survivalof larval hard clams (Mercenaria mercenaria), bay scallops (Ar-gopecten irrardians), and Eastern oysters (Crassostrea virginica),Limnol. Oceanogr., 54, 2072–2080, 2009.
Talmage, S. C. and Gobler, C. J.: Effects of past, present, and futureocean carbon dioxide concentrations on the growth and survivalof larval shellfish, P. Natl. Acad Sci. USA, 107, 17246–17251,2010.
Talmage, S. C. and Gobler, C. J.: Effects of elevated temperatureand carbon dioxide on the growth and survival of larvae and juve-niles of three species of Northwest Atlantic bivalves, PLoS ONE,6, e26941, doi:10.1371/journal.pone.0026941, 2011.
Thomsen, J., Gutowska, M. A., Saphörster, J., Heinemann, A.,Trübenbach, K., Fietzke, J., Hiebenthal, C., Eisenhauer, A.,Körtzinger, A., Wahl, M., and Melzner, F.: Calcifying inverte-brates succeed in a naturally CO2-rich coastal habitat but arethreatened by high levels of future acidification, Biogeosciences,7, 3879–3891, doi:10.5194/bg-7-3879-2010, 2010.
Thomsen, J., Casties, I., Pansch, C., Körtzinger, A., and Melzner,F.: Food availability outweighs ocean acidification effects in ju-venile Mytilus edulis: laboratory and field experiments, Glob.Change Biol., 19, 1017–1027, doi:10.1111/gcb.12109, 2013.
Waldbusser, G. G., Bergschneider, H., and Green, M. A.:Size-dependent pH effect on calcification in post-larval hardclam Mercenaria spp., Mar. Ecol.-Prog. Ser., 417, 171–18,doi:10.3354/meps08809, 2010.
Watson, S. A., Southgate, P. C., Tyler, P. A., and Lloyd, P. S.: Earlylarval development of the Sydney rock oyster Saccostrea glomer-ata under near-future predictions of CO2-driven ocean acidifica-tion, J. Shellfish Res., 28, 431–437, doi:10.2983/035.028.0302,2009.
Weiss, I. M., Tuross, N., Addadi, L., and Weiner, S.: Mollusc lar-val shell formation: Amorphous calcium carbonate is a precursorphase for Aragonite, J. Exp. Zool., 293, 478–491, 2002.
Welladsen, H. M., Southgate, P. C., and Heimann, K.: The effectsof exposure to near-future levels of ocean acidification on shellcharacteristics of Pinctada fucata (Bivalvia: Pteriidae), Mollus-can Res., 30, 125–130, 2010.
Wernberg, T. D., Smale, A., and Thomsen, M. S.: A decade ofclimate change experiments on marine organisms: procedures,patterns and problems, Glob. Change Biol., 18, 1491–1498,doi:10.1111/j.1365-2486.2012.02656.x, 2012.
Zondervan, I., Zeebe, R. E., Rost, B., and Riebesell, U.: Decreasingmarine biogenic calcification: A negative feedback on rising at-mospheric pCO2, Global Biogeochem. Cy., 15, 507–516, 2001.
Biogeosciences, 10, 6161–6184, 2013 www.biogeosciences.net/10/6161/2013/


![[Cariel] Manual PCO2](https://static.fdocuments.net/doc/165x107/577ccd351a28ab9e788bca03/cariel-manual-pco2.jpg)