Effect of heat-moisture treatment on multi-scale ...425889/UQ425889_OA.pdf · 1 Effect of...
38
Accepted Manuscript Title: Effect of heat-moisture treatment on multi-scale structures and physicochemical properties of breadfruit starch Author: <ce:author id="aut0005" author-id="S0144861717300309- c21010ce4f5cb76e1835cdc576bbcf20"> Xiaoyan Tan<ce:author id="aut0010" author-id="S0144861717300309- b0152bac1b82d542534ccffc2f69c61f"> Xiaoxi Li<ce:author id="aut0015" author-id="S0144861717300309- 1e0e038cb7619f8f0c8e7091a1bc3278"> Ling Chen<ce:author id="aut0020" author-id="S0144861717300309- 25b5af2dc052b721037d77a98313cd98"> Fengwei Xie<ce:author id="aut0025" author-id="S0144861717300309- 96d825d513aef82999be24334a620dd0"> Lin Li<ce:author id="aut0030" author-id="S0144861717300309- 5a471071a3e839d6f48a68b471011009"> Jidong Huang PII: S0144-8617(17)30030-9 DOI: http://dx.doi.org/doi:10.1016/j.carbpol.2017.01.029 Reference: CARP 11907 To appear in: Received date: 29-9-2016 Revised date: 5-1-2017 Accepted date: 6-1-2017 Please cite this article as: Tan, Xiaoyan., Li, Xiaoxi., Chen, Ling., Xie, Fengwei., Li, Lin., & Huang, Jidong., Effect of heat-moisture treatment on multi-scale structures and physicochemical properties of breadfruit starch.Carbohydrate Polymers http://dx.doi.org/10.1016/j.carbpol.2017.01.029 This is a PDF file of an unedited manuscript that has been accepted for publication. As a service to our customers we are providing this early version of the manuscript. The manuscript will undergo copyediting, typesetting, and review of the resulting proof before it is published in its final form. Please note that during the production process errors may be discovered which could affect the content, and all legal disclaimers that apply to the journal pertain.
Transcript of Effect of heat-moisture treatment on multi-scale ...425889/UQ425889_OA.pdf · 1 Effect of...

Accepted Manuscript
Title: Effect of heat-moisture treatment on multi-scalestructures and physicochemical properties of breadfruit starch
Author: <ce:author id="aut0005"author-id="S0144861717300309-c21010ce4f5cb76e1835cdc576bbcf20"> XiaoyanTan<ce:author id="aut0010"author-id="S0144861717300309-b0152bac1b82d542534ccffc2f69c61f"> Xiaoxi Li<ce:authorid="aut0015" author-id="S0144861717300309-1e0e038cb7619f8f0c8e7091a1bc3278"> Ling Chen<ce:authorid="aut0020" author-id="S0144861717300309-25b5af2dc052b721037d77a98313cd98"> FengweiXie<ce:author id="aut0025"author-id="S0144861717300309-96d825d513aef82999be24334a620dd0"> Lin Li<ce:authorid="aut0030" author-id="S0144861717300309-5a471071a3e839d6f48a68b471011009"> JidongHuang
PII: S0144-8617(17)30030-9DOI: http://dx.doi.org/doi:10.1016/j.carbpol.2017.01.029Reference: CARP 11907
To appear in:
Received date: 29-9-2016Revised date: 5-1-2017Accepted date: 6-1-2017
Please cite this article as: Tan, Xiaoyan., Li, Xiaoxi., Chen, Ling., Xie, Fengwei.,Li, Lin., & Huang, Jidong., Effect of heat-moisture treatment on multi-scalestructures and physicochemical properties of breadfruit starch.Carbohydrate Polymershttp://dx.doi.org/10.1016/j.carbpol.2017.01.029
This is a PDF file of an unedited manuscript that has been accepted for publication.As a service to our customers we are providing this early version of the manuscript.The manuscript will undergo copyediting, typesetting, and review of the resulting proofbefore it is published in its final form. Please note that during the production processerrors may be discovered which could affect the content, and all legal disclaimers thatapply to the journal pertain.

1
Effect of heat-moisture treatment on multi-scale structures and physicochemical
properties of breadfruit starch
Xiaoyan Tana, Xiaoxi Lia, Ling Chena,*, Fengwei Xieb,**, Lin Lia, Jidong Huangc
a Ministry of Education Engineering Research Center of Starch & Protein Processing, Guangdong Province Key
Laboratory for Green Processing of Natural Products and Product Safety, School of Food Science and Engineering,
South China University of Technology, Guangzhou, Guangdong 510640, China
b School of Chemical Engineering, The University of Queensland, Brisbane, Qld 4072, Australia
c Guangdong Zhongqing Font Biochemical Science and Technology Co. Ltd., Maoming, Guangdong 525427, China
* Corresponding author. Tel.: +86 20 8711 3252; fax: +86 20 8711 3252. Email: [email protected] (L. Chen)
** Corresponding author. Tel.: +61 7 334 67756; Email: [email protected], [email protected] (F. Xie).

2
Graphical abstract
Highlights
Breadfruit starch was modified by heat-moisture treatment (HMT)
Moisture of starch played a major role in HMT
HMT altered the multi-scale structures and properties of starch
HMT was effective to enhance the enzyme resistance of breadfruit starch
Abstract:
Breadfruit starch was subjected to heat-moisture treatment (HMT) at different moisture content (MC).
HMT did not apparently change the starch granule morphology but decreased the molecular weight
and increased the amylose content. With increased MC, HMT transformed the crystalline structure
(B → A+B → A) and decreased the relative crystallinity. With ≥25% MC, the scattering peak at ca.
0.6 nm−1 disappeared, suggesting the lamellar structure was damaged. Compared with native starch,
HMT-modified samples showed greater thermostability. Increased MC contributed to a higher
pasting temperature, lower viscosity, and no breakdown. The pasting temperature of native and HMT
samples ranged from 68.8 to 86.2 °C. HMT increased the slowly-digestible starch (SDS) and
resistant starch (RS) contents. The SDS content was 13.24% with 35% MC, which was 10.25%

3
higher than that of native starch. The increased enzyme resistance could be ascribed to the
rearrangement of molecular chains and more compact granule structure.
Keywords: Heat-moisture treatment; Breadfruit starch; Multi-scale structure; Physicochemical
properties
Chemical compounds studied in this article
Starch (PubChem CID: 24836924); Water (PubChem CID: 962)
1. Introduction
Starch, a semi-crystalline biopolymer, is a very versatile raw material with a broad range of
applications such as staple foodstuffs in the human diet, food additives, biodegradable packaging
materials, and so on. For the applications of starch, the structures (semi-crystalline lamellae,
crystalline structure and molecular structure) and properties (swelling index, thermal property,
pasting property, and digestibility) of various starches have been extensively studied (Błaszczak et al.,
2007; Huang et al., 2016; Tan et al., 2015; Wongsagonsup, Varavinit & BeMiller, 2008). In particular,
corn (Wongsagonsup, Varavinit & BeMiller, 2008), rice (Deng et al., 2014), cassava (Mei et al.,
2015), and potato (Huang et al., 2016) starches have been well studied. However, the growing
demand of starches from the modern industry has created a strong interest in the novel and
underutilized sources of this polysaccharide. There are also some less common starch types, such as
breadfruit starch, that are worth investigation. To develop new starch-based products with improved

4
properties, it is important to explore new starch types and to understand how the properties of starch
(e.g., digestibility) could be enhanced by ‘green’ modifications.
In general, starch consists of two major macromolecules: the linear chain amylose and the
heavily-branched amylopectin (Tan et al., 2015). The structure of starch depends on the way in
which amylose and amylopectin are associated and distributed throughout the starch granule (Zhang
et al., 2014b). It has been reported that the multi-scale structures of native starch were organized in
multiple scales scales: the molecular scale (~0.1 nm), the lamellar structure (8–9 nm), the growth
rings (~0.1 μm), and the whole granular morphology (0.5–100 μm) (Pikus, 2005). The original
complex structure of starch greatly affects its physicochemical properties.
Various modifications including chemical, physical and enzymatic methods are widely used to
improve the functional and other physicochemical properties of starch. In recent years, physical
techniques for the starch modification (e.g., ultrasound, microwave, high-pressure, ball-milling and
heat-moisture) have attracted considerable attention due to their advantages such as increased safety
and reduced waste generation (Adebowale et al., 2005; Błaszczak et al., 2007; Huang et al., 2016;
Tan et al., 2015; Zhang et al., 2014b).
Heat-moisture treatment (HMT) of starches is commonly defined as a physical modification
method that involves the treatment of starch granules at a low moisture content (<35% w/w), and at a
temperature (84–120 °C) above the glass transition temperature (Tg) but below the gelatinization
temperatures for a period of time (Hormdok & Noomhorm, 2007; Jacobs & Delcour, 1998; Wang et
al., 2016). Previous research has shown that HMT can influence the structure and physicochemical
properties of cereal, tuber, and legume starches, as reflected by significant changes in the X-ray

5
diffraction (XRD) pattern, crystallinity, granule swelling, amylose leaching, gelatinization
parameters, viscosity, thermal stability, rheological characteristics, and acid/enzyme susceptibility
(Andrade et al., 2014; Jiranuntakul et al., 2011; Jiranuntakul et al., 2013; Miyoshi, 2002; Pepe et al.,
2016; Watcharatewinkul et al., 2009; Zavareze & Dias, 2011; Zhang et al., 2014b). While the
HMT-induced changes to the starch structure and properties have been found to depend on the starch
source and treatment conditions (e.g. temperature, moisture, and time), generally HMT starches
tended to have a higher gelatinization temperature, lower paste viscosity, a decrease in the granule
swelling, and an increase in the thermal stability (Jiranuntakul et al., 2011; Watcharatewinkul et al.,
2009; Zavareze & Dias, 2011). HMT can cause a shift in the crystalline structure from B- to A-type
for potato starch (Vermeylen, Goderis & Delcour, 2006) and yam starch (Gunaratne & Hoover, 2002),
and a transition from Ca-type pattern to A-type for sweet potato starch (Huang et al., 2016).
Nonetheless, there are also some types of starch for which the X-ray pattern can hardly be affected
by HMT, such as normal corn starch (Chung, Hoover & Liu, 2009) and rice starch (Jiranuntakul et
al., 2011).
Breadfruit (Artocarpus artilis) is tropical fruit and is native to Malaysia, Southern Pacific and
the Caribbean, which belongs to the family Moraceae (Wang et al., 2011). Due to its high
carbohydrate content (ca. 76.7%) and valuable starch, breadfruit has been used as an important
source of energy over the years (Adebowale et al., 2005). With the poor storage properties of the
fresh fruit, the conversion of the fruit to flour and starch would provide a more stable form and
increase its versatility. Since ancient times, native breadfruit starches have been used as a raw
material to prepare different products. To broaden their applications, various physical and chemical

6
modifications of breadfruit starch, such as acetylation, oxidation, HMT, and fermentation, have
recently been studied (Adebowale et al., 2005; Daramola & Adegoke, 2007; Haydersah et al., 2012).
Nonetheless, the digestibility of breadfruit starch has scarcely been reported. Haydersah et al. (2012)
studied the digestibility of breadfruit starch and found fermentation could increase its resistant starch
content.
The physical modification by hydrothermal treatments such as HMT is consistent with the
social trend towards natural products and offers the potential to modulate the starch functionality in a
cost-effective and environmentally-friendly way. Adebowale et al. (2005) studied the swelling and
pasting properties of breadfruit starch as varied by HMT, without analyzing the structural evolution.
This study aimed to investigate the effects of HMT on the multi-scale structure and physicochemical
properties (especially digestibility) of breadfruit starch systematically. We hope the results generated
from our studies would assist in the search for new starch sources useful for both food and non-food
applications.
2. Materials and methods
2.1. Materials and starch isolation
Porcine pancreatic α-amylase (P-7545, activity 8 USP/g) and amyloglucosidase (A3306, 318
u/mL) were obtained from Sigma-Aldrich (USA). The glucose oxidase-peroxidase assay kit
(K-GLUC) was supplied by Megazyme (Ireland).
The breadfruit starch used in this study was isolated from peeled and dried breadfruit sheets
from Madagascar. The slices were washed thoroughly and soaked in water for 3 h before milling.

7
Then, the slurry was dispersed in excess distilled water and filtered through a No.240 sieve (61 μm),
and the starch suspensions were stored at 4 °C overnight. The supernatant and residue above the
starch layer were discarded. The brown sludge which settled with the starch was washed away by
treating it with 0.3% (w/v) sodium hydroxide solution (Schoch & Maywald, 1968). The sediments
were washed several times by re-suspending in distilled water and precipitating until the mash
appeared to be free of non-starch material and the washing water was neutral to litmus. The starch
obtained was dried at 40 °C for 48 h.
2.2. Chemical compositions analysis
The protein and total lipid contents of the starch samples were determined according to the
Standard AOAC methods 979.09 and 948.15, respectively (AOAC, 1990). Protein was determined
from estimates of total nitrogen using a conversion factor of 6.25 (Thitipraphunkul et al., 2003). A
moisture analyzer (MA35, Sartorius Stedim Biotech GmbH, Germany) was used to determine the
moisture content (MC) of each sample.
2.3. Heat-moisture treatment
The moisture levels of starch samples were adjusted to 15%, 20%, 25%, 30% and 35% (the MC
of native starch was predetermined) by dispersing in an appropriate amount of distilled water. All
samples were held in sealed plastic bags and kept for 24 h at 4 °C. 30 g of the starch sample with an
adjusted MC was transferred into a 500mL screw-capped airtight container and rotated in a
thermostatically-controlled oil bath at 120 °C for 4 h. After cooling to ambient temperature,

8
HMT-modified starches were removed from containers and dried at 40 °C in a convection oven to
achieve a uniform MC (ca. 12%). The samples were ground and screened through a 100-mesh sieve,
packed and stored in several airtight plastic bags at ambiance temperature for further use. In the
following discussion, the code typically as “S-HMT-15” is used, in which “S” means “starch”,
“HMT” represents the heat-moisture treatment and “15” indicates the MC of the sample during the
treatment.
2.4. Scanning electron microscopy (SEM)
The granule morphology was observed using an EVO18 scanning electron microscope (ZEISS,
Germany), operated at 10.0 kV. The starch samples were sprinkled on a double-sided adhesive tape
mounted on an aluminum stub and coated with a thin gold film using 108auto sputter coater
(Cressington Scientific Instruments Ltd, UK). Representative digital images of starch granules were
obtained at 1000 and 5000 magnifications.
2.5. Gel permeation chromatography coupled with multi-angle light scattering (GPC-MALS)
A GPC (Waters Co., USA) system equipped with a MALS detector (Wyatt Co., USA) and a
refractive index detector was used to determine the molecular weight and the mean square radius of
gyration for samples. Toluene was utilized as standards for the calibration of instrument constants,
and dextran with Mw of 4104 was took for normalization. The mobile phase was pure DMSO, which
had been filtered through a 0.45μm membrane filter (Millipore Co., USA) and degassed by
ultrasound before use. The samples of a certain amount (ca. 3 mg) were heated in 6 mL of DMSO

9
with LiBr (50 mmol/L) at 60 °C overnight (Liu, Halley & Gilbert, 2010; Zhang et al., 2014a). Then
the completely dissolved sample solutions were filtered using a 5μm membrane filter (Millipore Co.,
USA) and transferred to sample bottles. Two chromatographic columns (OHpak SB-806 HQ, OHpak
SB-804 HQ, Shodex, Japan), and the laser with a wavelength of 658 nm were used in the experiment.
The flow rate and injection volume were 0.3 ml/min and 500 μL, respectively. The temperature of
columns and the detector was 50 °C and 40 °C, respectively. Detectors at 42.3°, 48.6°, 55.9°, 63.2 °,
71.5°, 80.7°, 90.0°, 99.3°, 108.5°, 117.8°, 127.2°, 143.0° and 149.6° were used. The data of light
scattering were collected and analyzed using the Astra V software. Mean square radius of gyration
(Rg), indicating the square of the distance from the center of mass, could also be calculated with
Astra V software.
2.6. Amylose content
The apparent amylose contents of the starch samples were determined using the AACC method
61-03 (10) with modifications through the spectrophotometric detection, which is based on blue
color formation upon the reaction of amylose with iodine. 10 mg of dry starch was dispersed in 1 mL
of anhydrous ethanol and 9 mL of 1M NaOH aqueous solution and was completely dissolved by
heating at 100 °C for 10 min with shaking. After cooling to room temperature, the starch solution
was diluted with water into 100 mL. The diluted solution (2.5 mL) was mixed with 25 mL of
deionized water, then added with 0.5 mL of 1M acetic acid solution and 0.5 mL of 0.2% iodine
solution, and made up to 50 ml with distilled water. A UV-3802 spectrophotometer (UNICO, New
Jersey, USA) was used to measure the color at 620 nm. The amylose content values were calculated

10
from a standard curve established using mixture solutions of amylose and amylopectin. All the
measurements were undertaken in triplicate.
2.7. X-ray diffraction (XRD)
X-ray diffraction patterns of the starch samples were measured using an Xpert PRO
diffractometer (PANalytical, Netherlands), operated at 40 mA and 40 kV, using Cu-Kα radiation with
a wavelength of 0.1542 nm as the X-ray source. The diffraction angle (2θ) scanning was from 5° to
40° with a scanning speed of 10°/min and a scanning step of 0.033°. The MC of each sample was ca.
12%. The studies were performed in triplicate.
2.8. Small-angle X-ray scattering (SAXS)
SAXS experiments were performed on an SAXSess small-angle X-ray scattering system
(Anton-Paar, Austria) equipped with a PW3830 X-ray generator (PANalytical), operated at 50 mA
and 40 kV, using Cu-Kα radiation with a wavelength of 0.1542 nm as the X-ray source. The samples
(ca. 60% MC) used for the SAXS measurement were prepared by premixing 100 mg of the starch
samples with added water in glass vials and were equilibrated at 20 °C for 24 h before the analysis.
Each sample was placed in a sample paste cell (an alloyed sample cell with a colorless window
specific designed for Anton Paar instrument for the SAXS tests of solid or semi-solid samples) and
was exposed to the incident X-ray monochromatic beam for 5 min. The data, recorded using an
image plate, were collected by the IP Reader software with a PerkinElmer storage phosphor system.
11
All data were normalized, and the background intensity and smeared intensity were removed using
the SAXSquant 3.0 software for further analysis. The studies were performed in triplicate.
2.9. Differential Scanning Calorimetry (DSC)
The thermal properties of starches were determined by a PerkinElmer Diamond differential
scanning calorimeter with an internal coolant (Intercooler 1P). Nitrogen purge gas was used in the
experimental work. A high-pressure stainless steel pan (PE No. B0182901) with a gold-plated copper
seal (PE No. 042-191758) was used to achieve a constant MC at a high temperature during DSC
measurements. The samples (ca. 70% MC) used were prepared by premixing the starch samples with
added water in glass vials and were equilibrated at 4 °C for 24 h before the analysis. After the sample
was prepared and the desired condition was reached, the DSC heating program was immediately
started from 25 ° to 120 °C at a heating rate 5 °C/min. An empty pan was used as a reference. The
enthalpy of gelatinization was calculated on the dry mass of the starch. DSC measurements were
performed in triplicate, and results were presented as the mean of repeats.
2.10. Paste viscosity profiles
Pasting properties were measured on a Modular Compact Rheometer-MCR302 (Anton-Paar,
Austria), 20 g of 6.0% (w/w) starch suspensions were stirred at a paddle speed of 250 rpm. Each
starch suspension was heated from 30 to 95 °C at 1.5 °C/min, held at 95 °C for 30 min, cooled from
95 ° to 50 °C at 1.5 °C/min, and held at 50 °C for 30 min. The studies were performed in triplicate.

12
2.11. Light microscopy of starch gels
Ordinary light microscopy of starch gels obtained from paste viscosity experiments were
performed using a polarized optical microscope (Axioskop 40 Pol/40A Pol, ZEISS, Germany)
equipped with a 35 mm SLA camera (Power Shot G5, Canon, Japan). A drop of the starch gel was
cast into a thin film on a slide and covered with a coverslip, and the images were recorded at 500×
magnification.
2.12. Starch digestibility
The slightly modified method of Englyst (Englyst, Kingman & Cummings, 1992) was used to
determine in-vitro values for rapidly-digestible starch (RDS), slowly-digestible starch (SDS), and
resistant starch (RS) fractions. The enzyme mixture was freshly prepared before each digestion trial.
3 g of porcine pancreatic α-amylase was dispersed in 20 mL of deionized water with magnetical
stirring and centrifuged at 4500 rpm for 15 min. The supernatant (13.5 mL) was transferred into a
beaker and mixed with 0.7 mL of amyloglucosidase and 0.8 mL of deionized water. The enzyme
solution was stored at 4 °C for the following use. Samples of 1 g of the dry starch and 20 mL of
0.1 M sodium acetate buffer (pH = 5.2) were cooked in a boiling water bath for 30 min and then
cooled to 37°C. 5 mL of the enzyme mixture was added to the starch dispersion and shaken in a 37°C
water bath with a speed of 170 rpm. After 20 min, a 0.5 mL aliquot was removed and placed into a
tube containing 20 mL of 66% ethanol. The mixed solution was centrifuged at 4500 r/min for 5 min,
and the hydrolyzed glucose content was determined using the glucose oxidase-peroxidase assay kit.
Based on the hydrolysis rate, starch was classified as RDS (digested within 20 min), SDS (digested

13
between 20 min and 120 min), and RS (undigested within 120 min), respectively. Each sample was
analyzed in triplicate.
2.13. Statistical analysis
The experiments were conducted in triple (n = 3) and the data were analyzed using the SPSS
20.0 statistical software. Analysis of variance (ANOVA) was carried out followed by the Duncan’s
multiple-range test. The significance level was set at P < 0.05.
3. Results and discussion
3.1. Chemical composition
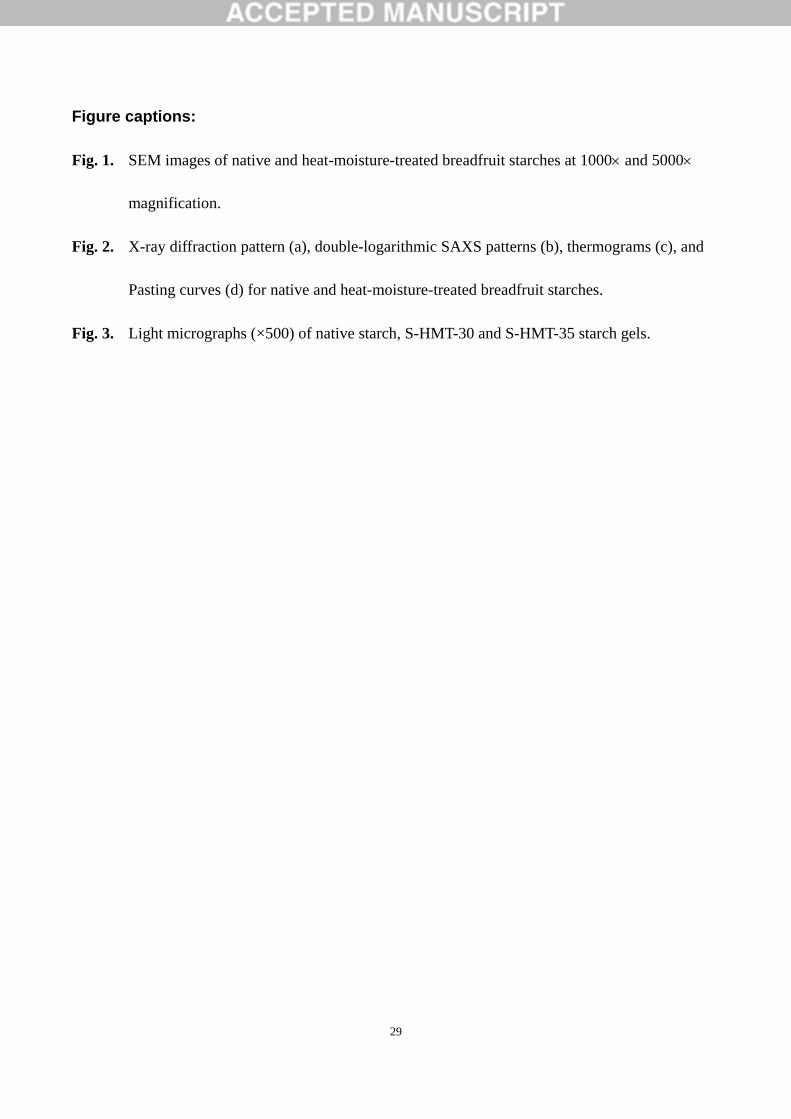
The chemical composition of native breadfruit starch was shown in Table 1 and expressed as
mean value ± standard deviation. Breadfruit starch contained very low amounts of protein and total
lipid, which were similar to the results in other studies (Wang et al., 2011). However, the amylose
content (16.83%) was greatly lower than that of the above-mentioned report (30.18%). The
difference in the amylose content could be due to the difference in the cultivars.
3.2. Granule morphology
The micrographs of native and HMT-modified breadfruit starches at two different
magnifications obtained using SEM are presented in Fig. 1. The image indicated breadfruit starch
granules were small, and the granules had spherical, elliptical and polyhedral shapes with diameters
mostly less than 10 µm (based on the scale plates of SEM micrograph ), which was in agreement

14
with previous work (Adebayo, Brown-Myrie & Itiola, 2008; Nwokocha & Williams, 2011). HMT
was seen to have no apparent effect on the morphology and size of the starch. It was proposed that
with a limited MC (≤35%), limited hydration occurred to alter the granule morphology. While the
aggregation of starch granules was shown with the increased treatment MC, and the S-HMT-30 and
S-HMT-35 granules appeared in clusters. At 5000 magnification, it could be seen that the surfaces
of S-HMT-25, S-HMT-30, and S-HMT-35 showed apparent dents. This disruption might occur
within the granule where the tissue structure was weak. The pressure and heating outside the starch
might make granules into a compact form during HMT and even result in concavities on the surface.
The starch granules became tight and compact after HMT, similar to the results observed for
HMT-modified canna starch (Watcharatewinkul et al., 2009).
3.3. Molecular weight and amylose content
Table 2 lists the GPC-MALS results for all the samples. The weight-average molecular weight (Mw)
and mean square radius of gyration (Rg) became smaller after HMT compared to those of the native
starch. Mw and Rg of the native starch was 2.386×10⁷ g/mol and 105.5 nm, respectively. These values
were higher than that reported for native breadfruit starch with an amylose content of 18.58%
(1.72107 g/mol and 88.6 nm, respectively) (Nwokocha & Williams, 2011). The differences could
probably due to the different experimental method. After HMT, Starch with higher moisture had
relatively lower Mw, and Mw of S-HMT-35 was nearly half that of native starch. This change in Mw
was probably due to the degradation of amylopectin during HMT (Lu, Chen & Lii, 1996). Some
research (Chung, Hoover & Liu, 2009) found that HMT (30% MC, 120 °C, 24 h) decreased the

15
amount of amylopectin long branch chains (degree of polymerization, or DP, >37) of normal corn
starch, indicating the breakage of some covalent linkages by excessive heating during HMT.
Moreover, Table 2 showed that the molecular fractions of Mw >3107 g/mol and 1×10⁷~3×
107 g/mol were decreased greatly after HMT, while the low Mw fraction (Mw <1×10⁷ g/mol) was
substantially increased. S-HMT-30 and S-HMT-35 with higher MCs showed higher percentages of
molecular fractions in the range of Mw <1×10⁷ g/mol (47.78 and 55.01%, respectively). This
indicated that higher degrees of destruction occurred to the starch with higher MCs during HMT. Rg,
a parameter showing the size of molecules, was observed to display a similar trend as Mw. During
HMT, part of the molecular chains of starch degraded, indicating the mass averaged distance of each
point in a molecule from the molecular center of gravity was decreased. Therefore, it was reasonable
to see the decrease in Rg. Both Mw and Rg showed the degradation of starch molecular chains after
HMT.
Table 3 also shows the apparent amylose content of native and modified starches. The amylose
content of untreated breadfruit starch was 16.83%. The different modified samples showed increased
amylose content (with increments of 1.27%–4.09%). HMT-35 had the highest amylose content
(20.92%). The increase in the amylose content could be due to the degradation of the exterior linear
chains of amylopectin by HMT (Miyoshi, 2002), which was consistent with the results of Mw.

16
3.4. Crystalline structure and crystallinity
Native starches are known to display either of the four characteristic XRD patterns, i.e., A-type,
B-type, C-type, and V-type. Similar to potato starch, breadfruit starch exhibited diffraction peaks at
2θ of 5.6, 15, 17, 19.3, 22 and 24° (Fig. 2a), indicating a typical B-type pattern (Nwokocha &
Williams, 2011; Tumaalii & Wootton, 1988). All HMT-modified samples displayed significantly
altered X-ray diffractograms. The original peak at 5.6° was absent. Furthermore, when the treatment
MC was ≥25%, the peak at 19.3° also disappeared, and the peaks at and 22° and 24° merged into a
single peak at 23°. Hence, HMT changed the XRD pattern of breadfruit starch from B-type to
combined B- and A-types, as previously reported for potato starch and waxy potato starch
(Gunaratne & Hoover, 2002; Lee et al., 2012). With the treatment MC increased to 25%, a full
A-type XRD pattern was shown, with the main 2θ reflections at 15.1, 17.2, 18.1 and 23.3°. In
contrast, Lawal (2005) reported that for cocoyam starches, HMT could hardly change the crystalline
pattern but only increased diffraction intensity.
Starch crystallinity can be influenced by the crystallite size and content, the average chain
length of amylopectin, and the orientation of the double helices (within the crystallites) (Tester &
Morrison, 1990). The relative crystallinity was calculated according to the literature (Zhang et al.,
2009). As shown in Table 3, the relative crystallinities of the treated samples S-HMT-15 (12.23%),
S-HMT-20 (11.15%), S-HMT-25 (10.08%), S-HMT-30 (9.98%), and S-HMT-35 (9.10%) were
lower than that of the native starch (14.30%). In particular, S-HMT-35 showed the greatest reduction
in relative crystallinity. In other words, HMT samples treated at a higher MC showed larger

17
reductions in relative crystallinity. It has been reported before that excessive moisture or heat during
HMT could reduce crystallinity (Andrade et al., 2014; Vermeylen, Goderis & Delcour, 2006).
In a previous study, it was observed that the DP of amylopectin of A-type was <19.7, and that
of B-type was ≥21.6 (Hizukuri et al., 1981), while the rest short amylopectin chains tended to form
the A-type crystalline structure after HMT. However, in another study (Gidley & Bulpin, 1987), the
short chains (DP <10) did not form stable double helices, and a large fraction of short amylopectin
chains were unlikely to participate in starch crystallites, which was responsible for the decreased
relative crystallinity. Lee et al. (2012) suggested that because the B-type crystalline structure has an
open packing of helices with 36 inter-helical water molecules in each hexagonal crystal unit, HMT
might cause the movement of double helices in the B-type crystal unite, eventually causing
double-helices combined with 8 intra-helical water molecules to experience a transition into A-type
crystals. This was same as the results of HMT-modified potato starches (Zhang et al., 2014b).
Moreover, a higher moisture (30–35%) tended to cause the movement of double helices more easily.
Here, we observed HMT induced changes in the XRD pattern (B→A+B→A), decreases in relative
crystallinity and molecular weight, and an increase in amylose content. HMT was proposed to result
in the breakage of original hydrogen bonding, the movement and dissociation of double helices, and
the rearrangement and breakage of molecular chains.
3.5. Lamellar structure
Starch granules show a lamellar structure of alternating crystalline and amorphous regions with
a regular repeat distance of 9–10 nm and can be detected by SAXS (Cameron & Donald, 1992).

18
Based on the Woolf-Bragg’s equation: d = 2π/q, the average thickness (d) of semi-crystalline
lamellae is corresponding to the q position of a scattering peak can be calculated (Tan et al., 2015;
Zhang et al., 2016). Fig. 2b shows the log I vs. log q SAXS patterns for native and modified
breadfruit starches. It could be seen that the native starch possessed a SAXS scattering peak at
0.6932 nm−1, corresponding to a d value of 9.06 nm (Table 3). After HMT, the scattering peak at ca.
0.6 nm−1 became ambiguous, and almost disappeared when the treatment MC was ≥25%. Similarly,
Vermeylen, Goderis and Delcour (2006) observed that the XRD diffraction peak at 2θ = 5.6°
disappeared for HMT starches. The disappearance of the XRD diffraction peaks suggested structural
disorganization with a reduction in the perfection and the ordering degree of the semi-crystalline
structure. It was noteworthy that the q position for S-HMT-15 and S-HMT-20 was increased
marginally, and the repeat distance of the alternating crystalline and amorphous lamellae was
decreased correspondingly. HMT disturbed the stacked lamellar system. The breakage of some
amylopectin chains and the changed crystal form from B- to A-type (relatively shorter chain length)
might lead to thinner crystalline lamellae. The increased treatment MC (≥25% ) gradually reduced
the ~9 nm scattering maximum, precluding the determination of d.
From the SAXS data, more information of a theoretical model for the lamellar structure in
starch can be obtained (Cameron & Donald, 1993), including Δρ = ρc – ρa , the difference in electron
density between crystalline and amorphous lamellae (where ρc and ρa are the electron densities of the
crystalline and amorphous regions in semi-crystalline lamellae, respectively); and Δρu= ρu – ρa, the
difference in electron density between amorphous lamellae and the amorphous amylose background
(where ρu is the electron density of the amorphous amylose background). The major effect of

19
increasing Δρ is to increase the overall intensity including the peak intensity, and Δρu has concurrent
effects of raising the low-angle intensity and lowering the definition of the peak without changing
the peak position (Cameron & Donald, 1992). An increase in the overall intensity, but a decrease in
the definition of the scattering peak (which became broader and even disappeared at 30% and 35%
high MCs) was observed for HMT-modified starches in Fig. 2b. This indicated that Δρ and Δρu of
HMT starches could be simultaneously increased resulting from the greatest destruction to the
amorphous lamellae, the intermediate destruction to the amorphous background and the weakest
destruction to the crystalline lamellae during HMT. Also, Δρ and Δρu were increased with the
increased treatment MCs. The electron density of the crystalline region (ρc) of starch tended to
possess the minimum decrease during HMT, presumably due to the rearranged crystalline structure
from B- to A-pattern. Furthermore, the fractured amylopectin chains may realign into some ordered
regions, which would increase Δρu accordingly.
3.6. Gelatinization parameters
DSC provides the possibility of analyzing the transition temperatures as well as the transition
enthalpies, which correspond to the melting of starch crystallites during heating. Fig. 2c shows the
DSC thermograms of native and HMT-modified breadfruit starches. Table 4 presents the
gelatinization parameters onset (To), peak (Tp), and conclusion (Tc) temperatures and gelatinization
enthalpy (ΔH). The modified samples showed increases in To, Tp, Tc, and the gelatinization
temperature range (Tc−To), and a decrease in gelatinization enthalpy (ΔH) in comparison with those
for the native starch. The Tc−To value for S-HMT-25 was approximately 13.4 °C higher than that for

20
the native starch. HMT at 30–35% MC could make the endothermic transition less apparent and
became broader. Also, HMT led to starch with greater thermal stability as the transition was moved
to higher temperatures.
The difference in gelatinization temperature may be attributed to the difference in amylose
content, size, form and distribution of starch granules, and to the internal interaction and/or
realignment of starch chains within the granule (Miao, Zhang & Jiang, 2009). The melting
temperatures (To, Tp, and Tc) of starch crystallites are controlled indirectly by the surrounding
amorphous region (Gunaratne & Hoover, 2002). After HMT, the starch became more closely packed
in crystalline and non-crystalline structures, resulting in reduced granule swelling, which would
reduce the destabilization effect of the amorphous region on the crystallite melting. Therefore, a
higher temperature would be required to melt the crystallites of HMT-modified starches. To, Tp, and
Tc was increased with a higher MC. The higher Tc–To values after HMT might be caused by the
rearrangement of molecules forming some ordered and stable structure. (Wongsagonsup, Varavinit &
BeMiller, 2008). The ΔH value, calculated based on the area of the endothermic peak, represents the
number of double helices that unravel and melt during gelatinization (Cooke & Gidley, 1992). As
seen in Fig. 2c, the endothermic peak for S-HMT-30 and S-HMT-35 shrank or even disappeared. The
modified starches with high MCs showed larger reductions in ΔH than those treated at low MCs,

21
indicating that HMT disrupted the double helices in the crystalline and non-crystalline regions of
starch granules. These results were consistent with the XRD analysis.
3.7. Paste viscosity properties
The pasting curve obtained is a measure of the viscosity of starch suspension during the heating
cycle. Fig. 2d shows that after HMT, the pasting curves for breadfruit starch became significantly
different. Table 5 summarizes the corresponding paste parameters. For breadfruit starch, HMT
resulted in much lower paste viscosity, more stable viscosity (with not detected peak viscosity and
breakdown) and a noticeable decrease in setback value. It can be seen that these changes were more
apparent when a higher treatment MC was used. Also, the pasting temperature was increased with
MC. The native starch had a pasting temperature of 68.8 °C. The HMT-modified samples had higher
pasting temperatures ranging from 69.5 to 86.2 °C. The highest paste viscosity was found in native
starch, which was probably due to a complete rupture of the starch granules. Subsequently, the
network formation upon cooling was rendered easier by the highly dispersed amylose, leading to a
high setback value (Watcharatewinkul et al., 2009). Here, an increase in the pasting temperature after
HMT could be related to the limited swelling. On the other hand, there might be two reasons for the
reduction in viscosity for the modified samples: firstly, fewer granules were destroyed by heat and
shear during pasting; and secondly, there was less entanglement of chains during pasting due to the
shorter chains in the HMT-modified starches. These changes were more apparent with a higher
treatment MC (S-HMT-30 and S-HMT-35), and the viscosity could approach zero.

22
The lower paste viscosity and higher pasting temperature indicated that breadfruit starch
granules were strengthened by HMT. These changes were probably attributed to structural
rearrangement by HMT. Also, the heat and vapor pressure during HMT could lead to a relatively
compact granule structure. The enhancement of intra-molecular bonding allows the starch to require
more heat for the structural disintegration and the paste formation (Adebowale et al., 2005).
3.8. Starch gel morphology
The pasting characteristics of the starch samples could be further characterized by the
morphologies of the starch gels obtained from paste viscosity experiments. Fig. 3 shows the
micrographs of native, S-HMT-30 and S-HMT-35 starch gels. S-HMT-30 and S-HMT-35 were used
as representative HMT-modified samples.
The granules of untreated starch have been fully broken to form a paste. In contrast, most of the
HMT-modified starch granules remained in the granule form with a high swelling. Moreover, the
extent of disintegration of S-HMT-35 seemed lower than that of S-HMT-30.
The gel morphologies corresponded to the pasting behaviors of starches as shown in the above
section. Native breadfruit starch possessed the highest paste viscosity, which was due to a complete
rupture of the starch granules. However, the decrease in viscosity resulting from HMT could be
related to the gel morphology by the finding that fewer and fewer granules were destroyed by the
heat and shear during paste viscosity measurements. HMT, especially with a higher MC, could

23
strengthen the starch granules. In this way, the higher the sample MC during HMT, the lower was the
paste viscosity of the treated starch.
3.9. Enzymatic digestibility
According to Englyst (Englyst, Kingman & Cummings, 1992), starch consists of rapidly
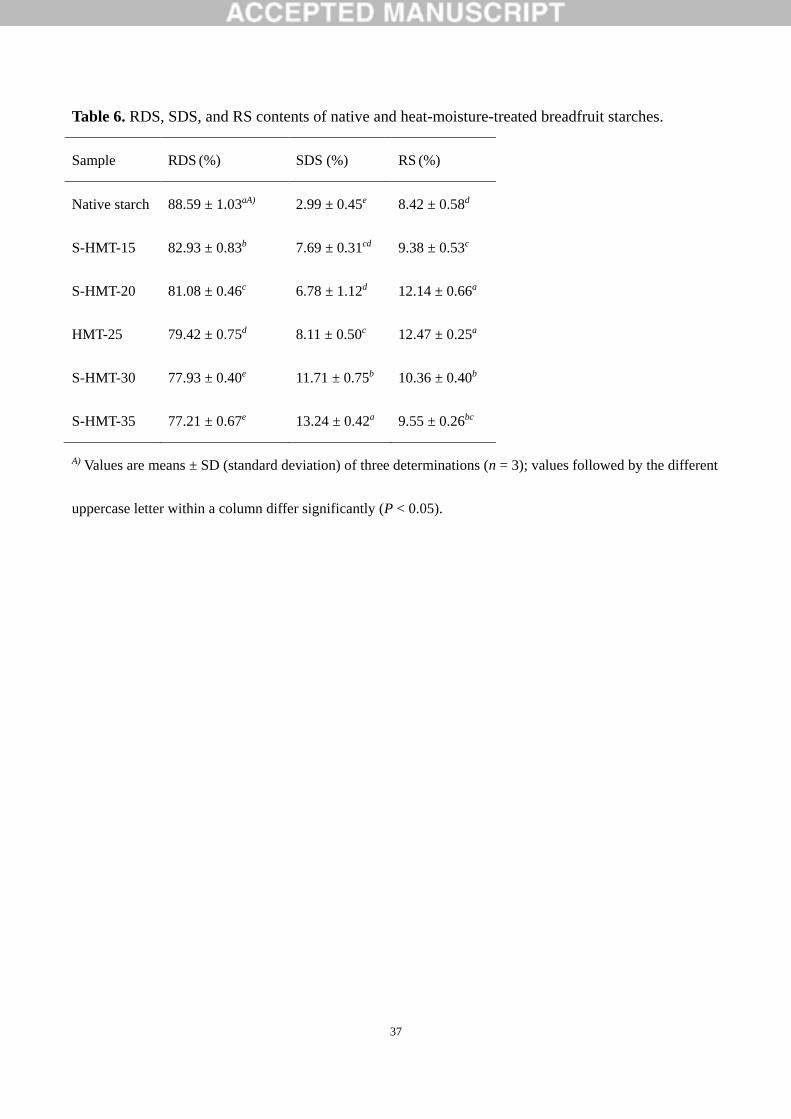
digestible starch (RDS), slowly digestible starch (SDS) and resistant starch (RS). Table 6 shows the
portions of RDS, SDS, and RS of native and HMT-modified starches. It can be seen that HMT
decreased the RDS content but increased the SDS and RS contents. The RDS of starch decreased
from 88.59% to 77.21% (S-HMT-35). Also, a higher treatment MC resulted in a higher SDS content.
S-HMT-35 had the highest SDS content (13.24%), which was 10.25% higher than that of the native
starch. S-HMT-25 had the highest RS content. These results suggested that the moisture during HMT
played a significant role in controlling the starch digestibility.
The increase in the SDS and RS contents after HMT could be related to the changes in starch
structure. The rearrangement of starch chains and dehydration transformed the crystalline structure
(from B-type to A-type). The A-type crystalline structure is more compact than the B-type crystalline
structure, and the A-type amorphous lamellae also have tight packing with higher density (Zhang,
Venkatachalam & Hamaker, 2006). Furthermore, as discussed before, the short chains debranched
from amylopectin could have less tendency to participate in forming starch crystallites but realign
into some ordered region with structural rigidity, which improved the enzyme resistance of the
treated starches.

24
4. Conclusion
This work showed that HMT could significantly vary the multi-scale structures and
physicochemical properties of breadfruit starch. The treated samples had similar granule morphology
although higher MCs could lead to granules with concavities. HMT decreased Mw and increased the
amylose content. The change in the XRD pattern (B→A+B→A) during HMT was accompanied by a
reduction in relative crystallinity (especially for the samples at higher treatment MCs), which
suggested HMT-induced realignment of chains. Compared with native breadfruit starch, the modified
starches possessed a slight decrease in the average repeat distance (d) of semicrystalline lamellae.
The HMT-modified starches showed increased thermal stability, a higher pasting temperatures, and
lower viscosities. Moreover, the treated samples had enhanced enzyme resistance (i.e., the increased
SDS and RS contents), which could be correlated to the rearrangement of molecular chains and more
compact granule structure. Overall, all these results have demonstrated that the variations of
physicochemical properties of breadfruit starch were attributed to the HMT-induced changes of
multi-scale structures. These changes were more evident with a higher treatment MC. Therefore, MC
could control the quality of breadfruit starch-based products for practical applications.
This study suggested that HMT could be used as an effective ‘green’ process for increasing the
total SDS and RS contents of breadfruit starch. Therefore, our results are expected to provide
guidance to the applications of breadfruit starch in the fields such as functional foods and
starch-based carrier materials.

25
Acknowledgements
This research has been financially supported by the Key Project of the National Natural Science
Foundation of China (NSFC) (No. 31130042), the NSFC-Guangdong Joint Foundation Key Project
(No. U1501214), the YangFan Innovative and Entrepreneurial Research Team Project
(No.2014YT02S029), the National Natural Science Foundation of Chine (NSFC) (No. 31271824),
the Key R&D Projects of Zhongshan (2014A2FC217), and the R&D Projects of Guangdong
Province (No. 2014B090904047).

26
References
Adebayo, S. A., Brown-Myrie, E., & Itiola, O. A. (2008). Comparative disintegrant activities of breadfruit starch and
official corn starch. Powder Technology, 181(2), 98-103.
Adebowale, K. O., Olu-Owolabi, B. I., kehinde Olawumi, E., & Lawal, O. S. (2005). Functional properties of native,
physically and chemically modified breadfruit (Artocarpus artilis) starch. Industrial Crops and Products, 21(3), 343-351.
Andrade, M. M. P., de Oliveira, C. S., Colman, T. A. D., da Costa, F. J. O. G., & Schnitzler, E. (2014). Effects of heat–
moisture treatment on organic cassava starch. Journal of Thermal Analysis and Calorimetry, 115(3), 2115-2122.
AOAC, A. o. O. A. C. (1990). Official Methods of Analysis, 15th ed. The Association of Official Analytical Chemists,
Arlington. Inc.
Błaszczak, W., Fornal, J., Kiseleva, V., Yuryev, V., Sergeev, A., & Sadowska, J. (2007). Effect of high pressure on thermal,
structural and osmotic properties of waxy maize and Hylon VII starch blends. Carbohydrate polymers, 68(3), 387-396.
Cameron, R., & Donald, A. (1992). A small-angle X-ray scattering study of the annealing and gelatinization of starch.
Polymer, 33(12), 2628-2635.
Cameron, R. E., & Donald, A. M. (1993). A small‐angle x‐ray scattering study of starch gelatinization in excess and
limiting water. Journal of Polymer Science Part B: Polymer Physics, 31(9), 1197-1203.
Chung, H.-J., Hoover, R., & Liu, Q. (2009). The impact of single and dual hydrothermal modifications on the molecular
structure and physicochemical properties of normal corn starch. International journal of biological macromolecules,
44(2), 203-210.
Cooke, D., & Gidley, M. J. (1992). Loss of crystalline and molecular order during starch gelatinisation: origin of the
enthalpic transition. Carbohydrate Research, 227, 103-112.
Daramola, B., & Adegoke, G. (2007). Production and partial characterization of food grade breadfruit acetylated starch.
JOURNAL OF FOOD AGRICULTURE AND ENVIRONMENT, 5(2), 50.
Deng, Y., Jin, Y., Luo, Y., Zhong, Y., Yue, J., Song, X., & Zhao, Y. (2014). Impact of continuous or cycle high hydrostatic
pressure on the ultrastructure and digestibility of rice starch granules. Journal of Cereal Science, 60(2), 302-310.
Englyst, H. N., Kingman, S., & Cummings, J. (1992). Classification and measurement of nutritionally important starch
fractions. European journal of clinical nutrition, 46, S33-50.
Gidley, M. J., & Bulpin, P. V. (1987). Crystallisation of malto-oligosaccharides as models of the crystalline forms of starch:
minimum chain-length requirement for the formation of double helices. Carbohydrate research, 161(2), 291-300.
Gunaratne, A., & Hoover, R. (2002). Effect of heat–moisture treatment on the structure and physicochemical properties
of tuber and root starches. Carbohydrate polymers, 49(4), 425-437.
Haydersah, J., Chevallier, I., Rochette, I., Mouquet‐Rivier, C., Picq, C., Marianne‐Pépin, T., Icard‐Vernière, C., &
Guyot, J. P. (2012). Fermentation by amylolytic lactic acid bacteria and consequences for starch digestibility of plantain,
breadfruit, and sweet potato flours. Journal of food science, 77(8), M466-M472.
Hizukuri, S., Takeda, Y., Yasuda, M., & Suzuki, A. (1981). Multi-branched nature of amylose and the action of debranching
enzymes. Carbohydrate research, 94(2), 205-213.
Hormdok, R., & Noomhorm, A. (2007). Hydrothermal treatments of rice starch for improvement of rice noodle quality.
LWT - Food Science and Technology, 40(10), 1723-1731.
Huang, T.-T., Zhou, D.-N., Jin, Z.-Y., Xu, X.-M., & Chen, H.-Q. (2016). Effect of repeated heat-moisture treatments on
digestibility, physicochemical and structural properties of sweet potato starch. Food Hydrocolloids, 54, 202-210.

27
Jacobs, H., & Delcour, J. A. (1998). Hydrothermal Modifications of Granular Starch, with Retention of the Granular
Structure: A Review. Journal of Agricultural and Food Chemistry, 46(8), 2895-2905.
Jiranuntakul, W., Puttanlek, C., Rungsardthong, V., Puncha-Arnon, S., & Uttapap, D. (2011). Microstructural and
physicochemical properties of heat-moisture treated waxy and normal starches. Journal of Food Engineering, 104(2),
246-258.
Jiranuntakul, W., Sugiyama, S., Tsukamoto, K., Puttanlek, C., Rungsardthong, V., Puncha-Arnon, S., & Uttapap, D. (2013).
Nano-structure of heat–moisture treated waxy and normal starches. Carbohydrate polymers, 97(1), 1-8.
Lawal, O. S. (2005). Studies on the hydrothermal modifications of new cocoyam (Xanthosoma sagittifolium) starch.
International journal of biological macromolecules, 37(5), 268-277.
Lee, C. J., Kim, Y., Choi, S. J., & Moon, T. W. (2012). Slowly digestible starch from heat-moisture treated waxy potato
starch: Preparation, structural characteristics, and glucose response in mice. Food chemistry, 133(4), 1222-1229.
Liu, W.-C., Halley, P. J., & Gilbert, R. G. (2010). Mechanism of Degradation of Starch, a Highly Branched Polymer, during
Extrusion. Macromolecules, 43(6), 2855-2864.
Lu, S., Chen, C.-Y., & Lii, C. (1996). Gel-chromatography fractionation and thermal characterization of rice starch affected
by hydrothermal treatment. Cereal chemistry, 73(1), 5-11.
Mei, J.-Q., Zhou, D.-N., Jin, Z.-Y., Xu, X.-M., & Chen, H.-Q. (2015). Effects of citric acid esterification on digestibility,
structural and physicochemical properties of cassava starch. Food chemistry, 187, 378-384.
Miao, M., Zhang, T., & Jiang, B. (2009). Characterisations of kabuli and desi chickpea starches cultivated in China. Food
chemistry, 113(4), 1025-1032.
Miyoshi, E. (2002). Effects of heat-moisture treatment and lipids on gelatinization and retrogradation of maize and
potato starches. Cereal chemistry, 79(1), 72-77.
Nwokocha, L. M., & Williams, P. A. (2011). Comparative study of physicochemical properties of breadfruit (Artocarpus
altilis) and white yam starches. Carbohydrate polymers, 85(2), 294-302.
Pepe, L. S., Moraes, J., Albano, K. M., Telis, V. R., & Franco, C. M. (2016). Effect of heat-moisture treatment on the
structural, physicochemical, and rheological characteristics of arrowroot starch. Food Science and Technology
International, 22(3), 256-265.
Pikus, S. (2005). Small-angle X-Ray scattering (SAXS) studies of the structure of starch and starch products. Fibres &
Textiles in Eastern Europe, 13(5), 82-86.
Schoch, T. J., & Maywald, E. C. (1968). Preparation and properties of various legume starches. Cereal Chem, 45(6),
564-573.
Tan, X., Zhang, B., Chen, L., Li, X., Li, L., & Xie, F. (2015). Effect of planetary ball-milling on multi-scale structures and
pasting properties of waxy and high-amylose cornstarches. Innovative Food Science & Emerging Technologies, 30,
198-207.
Tester, R. F., & Morrison, W. R. (1990). Swelling and gelatinization of cereal starches. I. Effects of amylopectin, amylose,
and lipids. Cereal Chem, 67(6), 551-557.
Thitipraphunkul, K., Uttapap, D., Piyachomkwan, K., & Takeda, Y. (2003). A comparative study of edible canna (Canna
edulis) starch from different cultivars. Part I. Chemical composition and physicochemical properties. Carbohydrate
polymers, 53(3), 317-324.
Tumaalii, F., & Wootton, M. (1988). Properties of starches isolated from Western Samoan breadfruit using a traditional
method. Starch‐Stärke, 40(1), 7-10.
Vermeylen, R., Goderis, B., & Delcour, J. A. (2006). An X-ray study of hydrothermally treated potato starch. Carbohydrate
Polymers, 64(2), 364-375.

28
Wang, H., Zhang, B., Chen, L., & Li, X. (2016). Understanding the structure and digestibility of heat-moisture treated
starch. International journal of biological macromolecules, 88, 1-8.
Wang, X., Chen, L., Li, X., Xie, F., Liu, H., & Yu, L. (2011). Thermal and rheological properties of breadfruit starch. Journal
of food science, 76(1), E55-E61.
Watcharatewinkul, Y., Puttanlek, C., Rungsardthong, V., & Uttapap, D. (2009). Pasting properties of a heat-moisture
treated canna starch in relation to its structural characteristics. Carbohydrate polymers, 75(3), 505-511.
Wongsagonsup, R., Varavinit, S., & BeMiller, J. N. (2008). Increasing slowly digestible starch content of normal and waxy
maize starches and properties of starch products. Cereal chemistry, 85(6), 738-745.
Zavareze, E. d. R., & Dias, A. R. G. (2011). Impact of heat-moisture treatment and annealing in starches: A review.
Carbohydrate polymers, 83(2), 317-328.
Zhang, B., Xie, F., Zhang, T., Chen, L., Li, X., Truss, R. W., Halley, P. J., Shamshina, J. L., McNally, T., & Rogers, R. D. (2016).
Different characteristic effects of ageing on starch-based films plasticised by 1-ethyl-3-methylimidazolium acetate and
by glycerol. Carbohydrate polymers, 146, 67-79.
Zhang, B., Xiong, S., Li, X., Li, L., Xie, F., & Chen, L. (2014a). Effect of oxygen glow plasma on supramolecular and
molecular structures of starch and related mechanism. Food Hydrocolloids, 37, 69-76.
Zhang, B., Zhao, Y., Li, X., Zhang, P., Li, L., Xie, F., & Chen, L. (2014b). Effects of amylose and phosphate monoester on
aggregation structures of heat-moisture treated potato starches. Carbohydrate polymers, 103, 228-233.
Zhang, G., Venkatachalam, M., & Hamaker, B. R. (2006). Structural basis for the slow digestion property of native cereal
starches. Biomacromolecules, 7(11), 3259-3266.
Zhang, L., Xie, W., Zhao, X., Liu, Y., & Gao, W. (2009). Study on the morphology, crystalline structure and thermal
properties of yellow ginger starch acetates with different degrees of substitution. Thermochimica Acta, 495(1–2), 57-62.
29
Figure captions:
Fig. 1. SEM images of native and heat-moisture-treated breadfruit starches at 1000 and 5000
magnification.
Fig. 2. X-ray diffraction pattern (a), double-logarithmic SAXS patterns (b), thermograms (c), and
Pasting curves (d) for native and heat-moisture-treated breadfruit starches.
Fig. 3. Light micrographs (×500) of native starch, S-HMT-30 and S-HMT-35 starch gels.

30
Fig. 1. SEM images of native and heat-moisture-treated breadfruit starches at 1000 and 5000
magnification.

31
10 20 30
Re
lative
in
ten
sity (
a.u
.)
Native starch
S-HMT-15
S-HMT-20
S-HMT-25
S-HMT-30
S-HMT-35
2 Theta (°)
1
1
10
Native starch
S-HMT-15
S-HMT-20
S-HMT-25
S-HMT-30
S-HMT-35
Inte
nsi
ty (
a.u
.)
q (nm-1)
(a) (b)
40 50 60 70 80 90 100 110
S-HMT-35
S-HMT-30
S-HMT-25
S-HMT-20
S-HMT-15
Native starch
He
at F
low
End
o U
p (
mW
)
Temperature (°C)
0 10 20 30 40 50 60 70
0
200
400
600
800
1000
1200
Tem
pera
ture
(°C
)
m
Pa
.s
Time (min)
Native starch
S-HMT-15
S-HMT-20
S-HMT-25
S-HMT-30
S-HMT-35
Temp
0
10
20
30
40
50
60
70
80
90
(c) (d)
Fig. 2. X-ray diffraction pattern (a), double-logarithmic SAXS patterns (b), thermograms (c), and
pasting curves (d) for native and heat-moisture-treated breadfruit starches.

32
Fig. 3. Light micrographs (×500) of native starch, S-HMT-30 and S-HMT-35 starch gels.
33
Table 1. Chemical composition of native breadfruit starch.
Sample
Composition (%)
Moisture Protein Total lipid Amylose content
Native starch 13.24 ± 0.07 0.31 ± 0.04 0.46 ± 0.02 16.83 ± 0.02
Table 2. Weight-average molecular weight (Mw), mean square radius of gyration (Rg) and Mw
distribution for native and heat-moisture-treated breadfruit starches.
Sample Mw (107 g/mol) Rg (nm) Mw distribution(%)
˂1×10⁷ g/mol 1×10⁷~3×10⁷ g/mol >3×10⁷ g/mol
Native starch 2.386 (1%)A 105.5 (0.6%) 7.79 80.35 11.86
S-HMT-15 1.459 (1%) 85.0 (0.6%) 47.55 48.27 4.18
S-HMT-20 1.407 (1%) 83.6 (0.6%) 43.86 51.38 4.76
S-HMT-25 1.477 (1%) 78.6 (0.8%) 44.15 50.12 5.73
S-HMT-30 1.426 (1%) 79.6 (0.7%) 47.78 45.90 6.32
S-HMT-35 1.186 (1%) 71.1 (0.7%) 55.01 41.49 3.50
A The data in parentheses represent the precision of global fit.

34
Table 3. Apparent amylose content, relative crystallinity and lamellar structural characteristics of
native and heat-moisture-treated breadfruit starches.
Sample Amylose content (%) Relative crystallinity (%) q (nm−1) d (nm)
Native starch 16.83 ± 0.02eA 14.30 ± 0.46a 0.6932 ±0.0036c 9.06 ±0.05a
S-HMT-15 18.10 ± 0.01d 12.23 ± 0.32b 0.7011 ±0.0024b 8.96 ±0.03b
S-HMT-20 19.02 ± 0.03c 11.15 ± 0.43c 0.7077 ±0.0027a 8.87 ±0.04c
S-HMT-25 20.69 ± 0.02b 10.08 ± 0.35d -B -
S-HMT-30 20.64 ± 0.07b 9.98 ± 0.27d - -
S-HMT-35 20.92 ± 0.03a 9.10 ± 0.24d - -
A Values are means ± SD (standard deviation) of three determinations (n = 3); values followed by the different
uppercase letter within a column differ significantly (P < 0.05).
B -, means not detected.

35
Table 4 Thermal behaviors parameters of native and heat-moisture-treated breadfruit starches.
Sample
Transition temperature (°C)
Tc–To (°C) △H (J/g)
To Tp Tc
Native starch 67.3±0.2cA) 70.9±0.2c 74.9±0.1d 7.6±0.3c 18.5±1.2a
S-HMT-15 67.9±0.2b 71.7±0.3b 75.7±0.3c 7.8±0.1c 11.1±0.6b
S-HMT-20 68.2±0.3b 72.4±0.3b 77.2±0.1b 9.0±0.2b 10.3±0.4bc
S-HMT-25 71.1±0.4a 84.9±0.6a 92.1±0.8a 21±0.4a 9.6±0.5c
S-HMT-30 -B - - - -
S-HMT-35 - - - - -
A) Values are means ± SD (standard deviation) of three determinations (n = 3); values followed by the different
uppercase letter within a column differ significantly (P < 0.05).
B -, means not detected.

36
Table 5 Pasting characteristics for native and heat-moisture-treated breadfruit starch A.
Sample
Tp ηpk ηsh ηsc ηec ηf ηbd ηsb
(°C) (cP)B (cP) (cP) (cP) (cP) (cP) (cP)
Native starch 68.8±0.3eD) 1140±56 1094±29a 327±13a 686±11a 640±27a 813±43 359±24a
S-HMT-15 69.5±0.3e - C 94±4b 259±8b 415±5b 409±19b - 156±13b
S-HMT-20 70.9±0.4d - 40±2c 259±10b 388±5c 358±14c - 129±5c
S-HMT-25 79.5±0.3c - 3±1d 84±3c 132±7d 123±9d - 48±4d
S-HMT-30 82.5±0.6b - 2±1d 28±2d 47±3e 46±3e - 19±1e
S-HMT-35 86.2±0.9a - 2±1d 21±1d 32±1f 31±2e - 11±2e
A Tp, pasting temperature; ηpk, peak viscosity; ηsh, viscosity at start of holding (95 °C); ηsc, viscosity at the start
of cooling (95 °C); ηec, viscosity at the end of cooling; ηf, final viscosity; ηbd (ηpk – ηsc), breakdown viscosity;
and ηsb (ηec – ηsc), setback viscosity.
B The unit of pasting properties of starch is expressed as cP, where cP is the unit of viscosity from the Modular
Compact Rheometer. 1 cP = 1 mPa.s
C -, means not detected.
D) Values are means ± SD (standard deviation) of three determinations (n = 3); values followed by the different
uppercase letter within a column differ significantly (P < 0.05).
37
Table 6. RDS, SDS, and RS contents of native and heat-moisture-treated breadfruit starches.
Sample RDS (%) SDS (%) RS (%)
Native starch 88.59 ± 1.03aA) 2.99 ± 0.45e 8.42 ± 0.58d
S-HMT-15 82.93 ± 0.83b 7.69 ± 0.31cd 9.38 ± 0.53c
S-HMT-20 81.08 ± 0.46c 6.78 ± 1.12d 12.14 ± 0.66a
HMT-25 79.42 ± 0.75d 8.11 ± 0.50c 12.47 ± 0.25a
S-HMT-30 77.93 ± 0.40e 11.71 ± 0.75b 10.36 ± 0.40b
S-HMT-35 77.21 ± 0.67e 13.24 ± 0.42a 9.55 ± 0.26bc
A) Values are means ± SD (standard deviation) of three determinations (n = 3); values followed by the different
uppercase letter within a column differ significantly (P < 0.05).
![Heat and Moisture Transfer in Wood-Based_[Report]_1995](https://static.fdocuments.net/doc/165x107/577d23a31a28ab4e1e9a5b66/heat-and-moisture-transfer-in-wood-basedreport1995.jpg)