Effect of Fly Ash on the Hydration Process in Cemented...
8
Effect of Fly Ash on the Hydration Process in Cemented Paste Backfill at Early Stages Dragana Simon Department of Civil Engineering – University of Toronto, Toronto, Ontario, Canada Murray W. Grabinsky Department of Civil Engineering – University of Toronto, Toronto, Ontario, Canada ABSTRACT Partial replacement of Portland cement with supplementary cementitious materials, such as fly ash or ground blast furnace slag, can significantly reduce the production costs and/or improve the performance of typical cement-based pastes, such as concrete and cement pastes. Nonetheless, the effect of fly ash on cement-containing pastes with remarkably low cement content, such as cemented paste backfill, is still unclear. This paper studies the effect of fly ash on the hydration process in cemented paste backfill at early stages of hydration using non-destructive, electromagnetic wave-based techniques. It was found that by replacing a part of Portland cement with fly ash, the hydration process in cemented paste backfill is delayed at early times, and the delay is proportional to the replacement level: the higher the replacement level, the later the onset of the hydration process will take place. At later times, the fly ash particles enhance the hydration process by providing additional ions that can contribute to formation of hydration products and ultimately increase the mechanical strength of CPB. RÉSUMÉ Un remplacement partiel de ciment de Portland avec le matériel cementitious supplémentaire, comme les cendres volantes ou les crasses de haut-fourneau de terre, peut de façon significative réduire les prix de production et-ou améliorer la performance de colles à base de ciment typiques, comme le béton et cimenter des colles. Pourtant, l'effet de cendres volantes sur les colles contenant ciment avec le contenu de ciment remarquablement bas, comme le remblai en pâte cimenté, est toujours peu évident. Cet article étudie l'effet de cendres volantes sur le processus d'hydratation dans le remblai en pâte cimenté à de premiers stades d'hydratation en utilisant des techniques à base de signe non-destructives, électromagnétiques. Il a été constaté qu'en remplaçant une partie de ciment de Portland avec les cendres volantes, le processus d'hydratation dans le remblai en pâte cimenté est retardé et le retard est proportionnel au niveau de remplacement: plus haut le niveau de remplacement, plus tard le commencement du processus d'hydratation surviendra. Aux temps derniers, les particules de cendres volantes améliorent le processus d'hydratation en fournissant des ions supplémentaires qui peuvent contribuer à la formation de produits d'hydratation et augmenter finalement la force mécanique de remblai en pâte cimenté. 1 INTRODUCTION Ground stabilization is an important part of underground mining operations. One of the sustainable backfilling techniques is Cemented Paste Backfill (CPB), which utilizes mine waste for filling the voids created by underground mining. CPB’s advantages over conventional backfilling technologies include (i) rapid transport to the stopes (i.e., voids created by underground mining), (ii) shorter turn-around cycle time (i.e., CPB technique requires less time to fill the stope and enable further mining of the adjacent stope than rockfill or hydraulic fill), (iii) elimination of the drainage barricades in the CPB-filled stopes as opposed to stopes filled with hydraulic fill, and (iv) diversion of mine waste from surface disposal sites to underground stopes. CPB consists of mine tailings (a by-product of mineral processing), water and binder (typically Portland cement (PC) or a mixture of Portland cement and supplementary cementitious materials, such as fly ash (FA) or blast furnace slag (BFS)). CPB ingredients are mixed together to form a non-segregating, non-plastic, paste-like material that is flowable enough to be pumped efficiently from the paste plant to the underground stope and strong enough upon hardening to provide ground support to the adjacent stopes. Properties, such as good workability, mechanical strength upon hardening, resistance to liquefaction and low production costs, are required in CPB design. Better understanding of the effect of CPB composition, binder type and content on the hydration and hardening mechanisms can aid optimize CPB design. Typically the fly ash is used in cement-based materials to provide similar and/or improved performance at reduced production cost as compared to ‘regular’ cement-based pastes with no supplementary materials. Some of the benefits of replacing a part of Portland cement with fly ash in cement pastes or concrete include (i) improved workability of fresh paste (ACI Committee 226, 1987), (ii) improved durability and strength of hardened paste (Baert et al., 2008), (iii) lower heat development during binder hydration (Cengiz, 2002), and (iv) lower production costs and energy consumption. Furthermore, a partial replacement of Portland cement with fly ash has a beneficial environmental effect as it 835 GeoHalifax2009/GéoHalifax2009
Transcript of Effect of Fly Ash on the Hydration Process in Cemented...

Effect of Fly Ash on the Hydration Process in Cemented Paste Backfill at Early Stages Dragana Simon Department of Civil Engineering – University of Toronto, Toronto, Ontario, Canada Murray W. Grabinsky Department of Civil Engineering – University of Toronto, Toronto, Ontario, Canada ABSTRACT Partial replacement of Portland cement with supplementary cementitious materials, such as fly ash or ground blast furnace slag, can significantly reduce the production costs and/or improve the performance of typical cement-based pastes, such as concrete and cement pastes. Nonetheless, the effect of fly ash on cement-containing pastes with remarkably low cement content, such as cemented paste backfill, is still unclear. This paper studies the effect of fly ash on the hydration process in cemented paste backfill at early stages of hydration using non-destructive, electromagnetic wave-based techniques. It was found that by replacing a part of Portland cement with fly ash, the hydration process in cemented paste backfill is delayed at early times, and the delay is proportional to the replacement level: the higher the replacement level, the later the onset of the hydration process will take place. At later times, the fly ash particles enhance the hydration process by providing additional ions that can contribute to formation of hydration products and ultimately increase the mechanical strength of CPB. RÉSUMÉ Un remplacement partiel de ciment de Portland avec le matériel cementitious supplémentaire, comme les cendres volantes ou les crasses de haut-fourneau de terre, peut de façon significative réduire les prix de production et-ou améliorer la performance de colles à base de ciment typiques, comme le béton et cimenter des colles. Pourtant, l'effet de cendres volantes sur les colles contenant ciment avec le contenu de ciment remarquablement bas, comme le remblai en pâte cimenté, est toujours peu évident. Cet article étudie l'effet de cendres volantes sur le processus d'hydratation dans le remblai en pâte cimenté à de premiers stades d'hydratation en utilisant des techniques à base de signe non-destructives, électromagnétiques. Il a été constaté qu'en remplaçant une partie de ciment de Portland avec les cendres volantes, le processus d'hydratation dans le remblai en pâte cimenté est retardé et le retard est proportionnel au niveau de remplacement: plus haut le niveau de remplacement, plus tard le commencement du processus d'hydratation surviendra. Aux temps derniers, les particules de cendres volantes améliorent le processus d'hydratation en fournissant des ions supplémentaires qui peuvent contribuer à la formation de produits d'hydratation et augmenter finalement la force mécanique de remblai en pâte cimenté. 1 INTRODUCTION Ground stabilization is an important part of underground mining operations. One of the sustainable backfilling techniques is Cemented Paste Backfill (CPB), which utilizes mine waste for filling the voids created by underground mining. CPB’s advantages over conventional backfilling technologies include (i) rapid transport to the stopes (i.e., voids created by underground mining), (ii) shorter turn-around cycle time (i.e., CPB technique requires less time to fill the stope and enable further mining of the adjacent stope than rockfill or hydraulic fill), (iii) elimination of the drainage barricades in the CPB-filled stopes as opposed to stopes filled with hydraulic fill, and (iv) diversion of mine waste from surface disposal sites to underground stopes. CPB consists of mine tailings (a by-product of mineral processing), water and binder (typically Portland cement (PC) or a mixture of Portland cement and supplementary cementitious materials, such as fly ash (FA) or blast furnace slag (BFS)). CPB ingredients are mixed together to form a non-segregating, non-plastic, paste-like material
that is flowable enough to be pumped efficiently from the paste plant to the underground stope and strong enough upon hardening to provide ground support to the adjacent stopes. Properties, such as good workability, mechanical strength upon hardening, resistance to liquefaction and low production costs, are required in CPB design. Better understanding of the effect of CPB composition, binder type and content on the hydration and hardening mechanisms can aid optimize CPB design.
Typically the fly ash is used in cement-based materials to provide similar and/or improved performance at reduced production cost as compared to ‘regular’ cement-based pastes with no supplementary materials. Some of the benefits of replacing a part of Portland cement with fly ash in cement pastes or concrete include (i) improved workability of fresh paste (ACI Committee 226, 1987), (ii) improved durability and strength of hardened paste (Baert et al., 2008), (iii) lower heat development during binder hydration (Cengiz, 2002), and (iv) lower production costs and energy consumption. Furthermore, a partial replacement of Portland cement with fly ash has a beneficial environmental effect as it
835
GeoHalifax2009/GéoHalifax2009

reduces/eliminates the need for surface disposal of fly ash. Typical amount of fly ash used in ‘regular’ blended cement-based pastes and concrete ranges between 10 and 30 per cent by mass of Portland cement. In mining applications, such as CPB backfilling technique, the fly ash content typically exceeds the conventional replacement level found in regular concrete/cement pastes. Therefore, better understanding of the effect of high fly ash content on the performance and hydration process in CPB is required, especially since CPB has significantly lower overall binder content than regular concrete and cement pastes. For this purpose, electromagnetic wave-based techniques are utilized to study the hydration process in high fly ash content CPB. Electromagnetic (EM) waves have been long recognized as a useful tool in studying physicochemical processes in geomaterials (Santamarina et al., 2001) and cement-based pastes (McCarter, 1996; Christensen et al., 1994; and Perez-Pena et al., 1986). This study focuses on using EM wave-based techniques to monitor the hydration process in CPB containing high fly ash replacement levels. The EM test results on CPB obtained in the controlled laboratory environment are compared with in situ test results obtained in an actual backfilled test stope. 2 FLY ASH AND ITS ACTIVATION Fly ash is a by-product of coal combustion, and, owing to its cementitious property, is used in concrete industry as a supplementary material. The cementitious property of fly ash comes from its pozzolanic nature, that is the ability of fly ash, which itself possesses little or no cementitious value, but, if activated, is able to chemically react with calcium hydroxide (i.e., lime liberated during the hydration of Portland cement) at ordinary temperature to form compounds with cementitious properties (ASTM C125, 2007). Fly ash has specific physical and chemical features that differ from those of Portland cement. These features include (i) small particle size (FA particles are smaller than PC particles), (ii) spherical particle shape (FA particles are mainly sphere-shaped, while PC particles are mainly angular), and (iii) specific chemical composition (glass content, Ca content, Si content). The active component of fly ash is glassy, amorphous compound made of siliceous and alumino-silicate and/or calcium-alumino silicates. High alkalinity is required to activate fly ash particles to react with water. Some researchers (Neville, 1995) suggest that the minimum pH required to activate the glassy component in fly ash is 13.2. The high alkalinity (i.e., high concentration of OH- ions) of a pore solution, caused by the hydration of Portland cement, enhances the dissociation of the glassy component of the fly ash particles. The SiO4
- and H+ ions are deliberated from the fly ash surface into the pore solution, which makes the surface of the fly ash particles depleted of Si4+ ions. These ‘empty’ sites attract Ca2+ ions previously released during the Portland cement hydration, causing an enhanced formation of calcium silicate hydrates (a.k.a. C-S-H) – a newly formed hydration product accountable for hardening of cement-based
pastes. During the hydration, the fly ash particles have a dual role: (i) chemical role: upon activation, the fly ash particle fixate Ca2+ ions while releasing SiO4
4- ions into solution, thus enhancing the formation of C-S-H, which thickens as hydration progresses, and (ii) physical role: the fly ash particles act as additional nucleation sites where newly-formed hydration products, such as C-S-H, can grow while reducing the porosity of the paste. 3 ELECTROMAGNETIC PARAMETERS The response of a material to an applied electromagnetic field can be described using three basic EM parameters: (i) complex dielectric permittivity ε*, which, if normalized with respect to the permittivity of vacuum εO, becomes relative permittivity κ*, (ii) electrical conductivity EC, and (iii) complex magnetic permeability µ*. The complex relative permittivity κ* consists of real part κ’, which is a measure of material polarizability, that is the ability of a material to orient its dipoles towards an applied electromagnetic field, and imaginary part κ’’, which represents polarization losses. The effective imaginary permittivity is
ωε
σ+κ=κ
o
dceff "" [1]
where σdc is dc conductivity, εo is the permittivity of vacuum, and ω is the angular frequency of the applied electromagnetic field. Equation [1] can also be written in terms of effective electrical conductivity σeff, such that
ωεκ+σ=σ odceff " [2]
Electrical conductivity is a measure of charge mobility and/or ion availability, and will be denoted as EC throughout the text.
The complex magnetic permeability µ* is a measure of material’s ability to orient its magnetic dipoles towards an applied magnetic field. The paste used in this study has a low content of ferromagnetic inclusions (see Table 1 for more details). Klein and Santamarina (2000) showed that if the volume fraction of ferromagnetic inclusions spatially distributed in a non-ferromagnetic medium does not exceed 0.1, the complex magnetic permeability µ* of CPB is equal to magnetic permeability of vacuum µo, and, as such, will not be considered in this study.
The material’s ability to respond to an applied electromagnetic field at a certain frequency is controlled by opposing viscous and inertial forces. These forces can cause restrained relative displacement of material’s dipoles, such as electrons, ions, atoms and molecules, in an applied EM field at a certain frequency. This phenomenon is also known as polarization mechanism. The polarization mechanisms that may arise in CPB as a response to an applied EM field at frequencies ranging between 20 MHz and 1.3 GHz are (i) orientational (molecular) polarization and (ii) bound water polarization.
836
GeoHalifax2009/GéoHalifax2009
Free water molecules are highly polar; therefore, the dielectric permittivity of water is significantly higher (κ’~78) than that of most minerals (κ’~3-5) or air (κ’~1), which makes κ’ a good indicator of free water content. In addition, the polarizability of water molecules depends on the water structure: free water molecules relaxation begins at about GHz frequencies, while bound water molecules are more likely to polarize at low MHz frequency (i.e., frequencies smaller than 500 MHz). Furthermore, variations in the mobility and availability of ions during the process of hydration of cementitious materials are readily measured using EC measurements. All the above pieces of information are extremely useful when analyzing the state and amount of water in mineral-water mixtures, as well as monitoring the stages of hydration in hydrating cement-containing mixtures, such as CPB.
4 EXPERIMENTAL PROCEDURE
4.1 Specimen Preparation
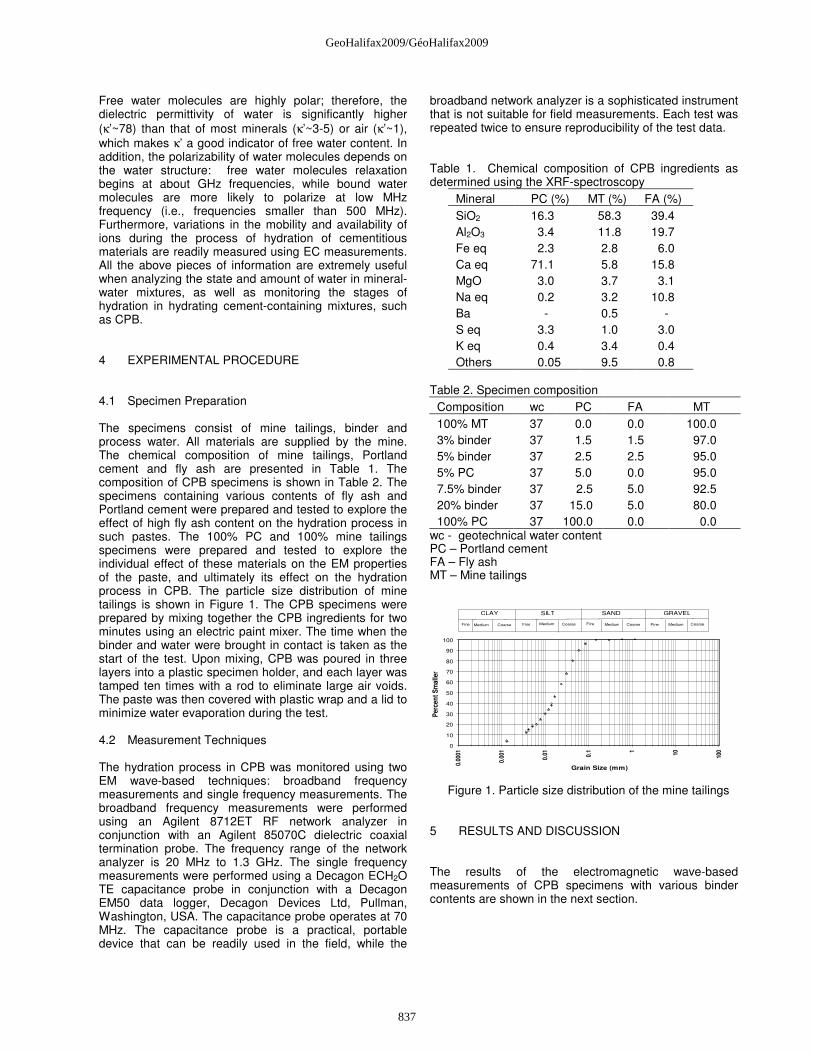
The specimens consist of mine tailings, binder and process water. All materials are supplied by the mine. The chemical composition of mine tailings, Portland cement and fly ash are presented in Table 1. The composition of CPB specimens is shown in Table 2. The specimens containing various contents of fly ash and Portland cement were prepared and tested to explore the effect of high fly ash content on the hydration process in such pastes. The 100% PC and 100% mine tailings specimens were prepared and tested to explore the individual effect of these materials on the EM properties of the paste, and ultimately its effect on the hydration process in CPB. The particle size distribution of mine tailings is shown in Figure 1. The CPB specimens were prepared by mixing together the CPB ingredients for two minutes using an electric paint mixer. The time when the binder and water were brought in contact is taken as the start of the test. Upon mixing, CPB was poured in three layers into a plastic specimen holder, and each layer was tamped ten times with a rod to eliminate large air voids. The paste was then covered with plastic wrap and a lid to minimize water evaporation during the test. 4.2 Measurement Techniques The hydration process in CPB was monitored using two EM wave-based techniques: broadband frequency measurements and single frequency measurements. The broadband frequency measurements were performed using an Agilent 8712ET RF network analyzer in conjunction with an Agilent 85070C dielectric coaxial termination probe. The frequency range of the network analyzer is 20 MHz to 1.3 GHz. The single frequency measurements were performed using a Decagon ECH2O TE capacitance probe in conjunction with a Decagon EM50 data logger, Decagon Devices Ltd, Pullman, Washington, USA. The capacitance probe operates at 70 MHz. The capacitance probe is a practical, portable device that can be readily used in the field, while the
broadband network analyzer is a sophisticated instrument that is not suitable for field measurements. Each test was repeated twice to ensure reproducibility of the test data. Table 1. Chemical composition of CPB ingredients as determined using the XRF-spectroscopy
Mineral PC (%) MT (%) FA (%) SiO2 16.3 58.3 39.4 Al2O3 3.4 11.8 19.7 Fe eq 2.3 2.8 6.0 Ca eq 71.1 5.8 15.8 MgO 3.0 3.7 3.1 Na eq 0.2 3.2 10.8 Ba - 0.5 - S eq 3.3 1.0 3.0 K eq 0.4 3.4 0.4 Others 0.05 9.5 0.8
Table 2. Specimen composition
Composition wc PC FA MT 100% MT 37 0.0 0.0 100.0 3% binder 37 1.5 1.5 97.0 5% binder 37 2.5 2.5 95.0 5% PC 37 5.0 0.0 95.0 7.5% binder 37 2.5 5.0 92.5 20% binder 37 15.0 5.0 80.0 100% PC 37 100.0 0.0 0.0
wc - geotechnical water content PC – Portland cement FA – Fly ash MT – Mine tailings
0
10
20
30
40
50
60
70
80
90
100
0.00
01
0.00
1
0.01 0.1 1 10 100
Grain Size (mm)
Per
cen
t S
mal
ler
SAND GRAVELSILTCLAY
Fine FineFine MediumMedium MediumCoarse Coarse Coarse Fine Medium Coarse
Figure 1. Particle size distribution of the mine tailings 5 RESULTS AND DISCUSSION The results of the electromagnetic wave-based measurements of CPB specimens with various binder contents are shown in the next section.
837
GeoHalifax2009/GéoHalifax2009
5.1 Frequency Response of Broadband Frequency Measurements
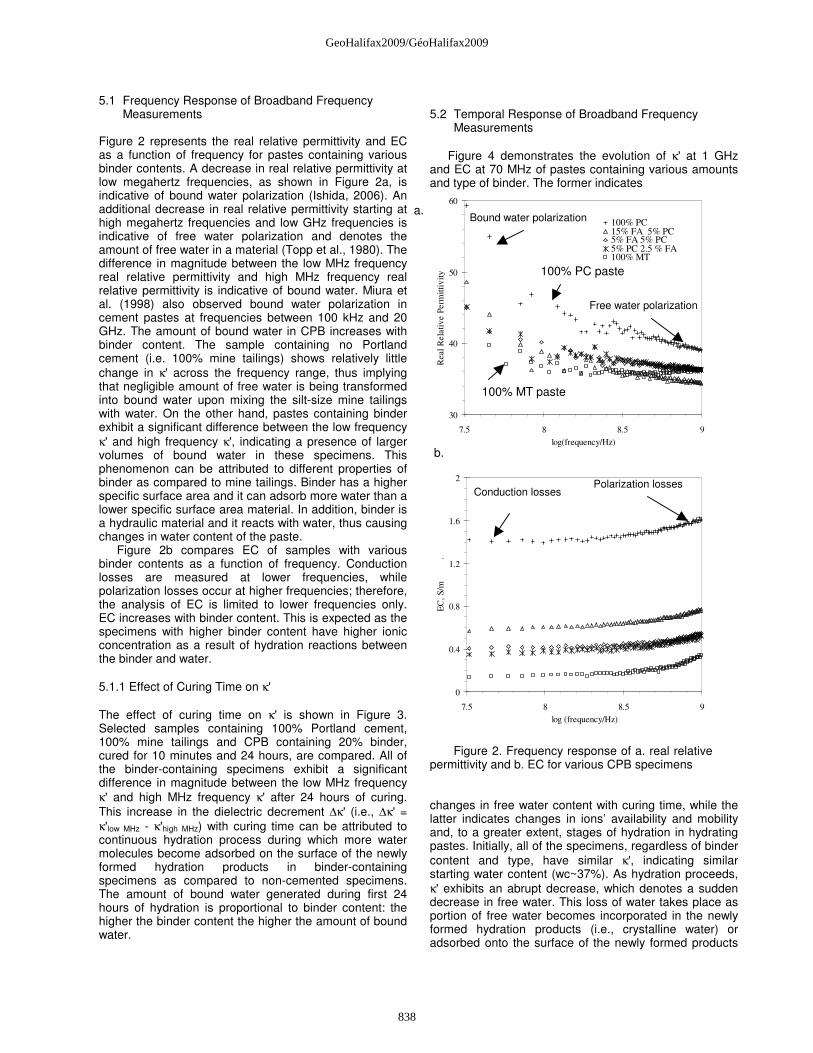
Figure 2 represents the real relative permittivity and EC as a function of frequency for pastes containing various binder contents. A decrease in real relative permittivity at low megahertz frequencies, as shown in Figure 2a, is indicative of bound water polarization (Ishida, 2006). An additional decrease in real relative permittivity starting at high megahertz frequencies and low GHz frequencies is indicative of free water polarization and denotes the amount of free water in a material (Topp et al., 1980). The difference in magnitude between the low MHz frequency real relative permittivity and high MHz frequency real relative permittivity is indicative of bound water. Miura et al. (1998) also observed bound water polarization in cement pastes at frequencies between 100 kHz and 20 GHz. The amount of bound water in CPB increases with binder content. The sample containing no Portland cement (i.e. 100% mine tailings) shows relatively little change in κ' across the frequency range, thus implying that negligible amount of free water is being transformed into bound water upon mixing the silt-size mine tailings with water. On the other hand, pastes containing binder exhibit a significant difference between the low frequency κ' and high frequency κ', indicating a presence of larger volumes of bound water in these specimens. This phenomenon can be attributed to different properties of binder as compared to mine tailings. Binder has a higher specific surface area and it can adsorb more water than a lower specific surface area material. In addition, binder is a hydraulic material and it reacts with water, thus causing changes in water content of the paste.
Figure 2b compares EC of samples with various binder contents as a function of frequency. Conduction losses are measured at lower frequencies, while polarization losses occur at higher frequencies; therefore, the analysis of EC is limited to lower frequencies only. EC increases with binder content. This is expected as the specimens with higher binder content have higher ionic concentration as a result of hydration reactions between the binder and water.
5.1.1 Effect of Curing Time on κ' The effect of curing time on κ' is shown in Figure 3. Selected samples containing 100% Portland cement, 100% mine tailings and CPB containing 20% binder, cured for 10 minutes and 24 hours, are compared. All of the binder-containing specimens exhibit a significant difference in magnitude between the low MHz frequency κ' and high MHz frequency κ' after 24 hours of curing. This increase in the dielectric decrement ∆κ' (i.e., ∆κ' = κ'low MHz - κ'high MHz) with curing time can be attributed to continuous hydration process during which more water molecules become adsorbed on the surface of the newly formed hydration products in binder-containing specimens as compared to non-cemented specimens. The amount of bound water generated during first 24 hours of hydration is proportional to binder content: the higher the binder content the higher the amount of bound water.
5.2 Temporal Response of Broadband Frequency
Measurements Figure 4 demonstrates the evolution of κ' at 1 GHz
and EC at 70 MHz of pastes containing various amounts and type of binder. The former indicates
30
40
50
60
7.5 8 8.5 9
log(frequency/Hz)R
eal
Rela
tiv
e P
erm
itti
vit
y
.
100% PC15% FA 5% PC5% FA 5% PC 5% PC 2.5 % FA100% MT
0
0.4
0.8
1.2
1.6
2
7.5 8 8.5 9
log (frequency/Hz)
EC
, S
/m
.
Figure 2. Frequency response of a. real relative
permittivity and b. EC for various CPB specimens changes in free water content with curing time, while the latter indicates changes in ions’ availability and mobility and, to a greater extent, stages of hydration in hydrating pastes. Initially, all of the specimens, regardless of binder content and type, have similar κ', indicating similar starting water content (wc~37%). As hydration proceeds, κ' exhibits an abrupt decrease, which denotes a sudden decrease in free water. This loss of water takes place as portion of free water becomes incorporated in the newly formed hydration products (i.e., crystalline water) or adsorbed onto the surface of the newly formed products
a.
b.
Conduction losses Polarization losses
Bound water polarization
Free water polarization
100% PC paste
100% MT paste
838
GeoHalifax2009/GéoHalifax2009

(i.e., gel water), thus causing the free water content to decrease with hydration time. The degree of water reduction with curing time increases with binder content: the higher the binder content, the faster the rate of hydration reactions and so the faster the water is being used up/adsorbed with curing time.
20
30
40
50
60
70
80
90
100
110
7.5 8 8.5 9
log(frequency/Hz)
Real
Rela
tiv
e P
erm
itti
vit
y
.
100% PC 10 min
100% PC 5 h
15% FA 5% PC 10 min
15% FA 5% PC 24 h
100% MT 10 min
100% MT 24 h
Figure 3. κ' as a function of frequency for various pastes cured for 10 min and several hours
The evolution of EC at 70 MHz for specimens with various binder content and type is shown in Figure 4b. Since EC is a measure of availability and mobility of charges/ions, its temporal evolution is a good indicator of stages of hydration in binder-containing pastes. The EC data show that all of the binder-containing specimens, regardless of binder content and type, exhibit a peak in EC, whereas the non-cemented samples (i.e., 100% MT) shows a negligible change in EC throughout the test. This indicates that the tailings-water mixture does not exhibit a significant variation in ionic concentration and EC with time. An increase in EC (i.e., a pre-peak region) is indicative of ion dissolution as a result of binder reactions with water, while a decrease in EC (i.e., a post-peak region) denotes a stage when the dissolved ions begin to be removed from the pore solution and start to be incorporated in the newly formed hydration products at a faster rate than the on-going dissolution of the remaining unhydrated binder. This post-peak region can be referred to as ‘acceleration stage’ in the process of hydration during which the new hydration products begin to form at accelerated rate. The time when the paste reaches the peak EC depends on binder type and content. The CPB specimen containing 5% Portland cement (no fly ash) seems to exhibit the primary EC peak earlier (at ~ 130 min) than the specimens with fly ash. This is in agreement with Glasser et al. (1987) and Fajun et al. (1985), who also found that fly ash has a retarding effect on the hydration process in cement pastes containing fly ash. Furthermore, Al-Zahrani et al. (2006) showed that the degree of hydration is reduced by replacing a part of
PC with fly ash. The presence of fly ash increases the time required for paste to reach the primary EC peak by 30 min (~23%) in the specimen containing 2.5% FA and 5% PC and by 90 min (~70%) in the specimen containing 15% FA and 5% PC. The specimen that contained 5% binder, where half of the cement was replaced by fly ash, required the longest time (~330 min) to reach the primary EC peak. Another feature found in the temporal response of EC is the presence of the secondary EC peak. The magnitude of the secondary EC peak seems to increase as the PC replacement level with fly ash increases. Thus, the most significant secondary EC peak is found in CPB containing the highest level of fly ash (i.e., 15% FA and 5% PC), followed by the 2.5% FA and 2.5% PC specimen and 2.5% FA and 5% PC specimen. In contrast, Fajun et al. (1985), who studied the hydration process in fly ash-containing cement pastes by measuring the heat evolution, identified one (primary) peak.
The specimen with no fly ash (i.e., 5% PC CPB) had the least distinguished secondary EC peak. The presence of the secondary EC in pastes with high replacement level of Portland cement with fly ash indicates that additional ions become available for ionic conduction at later times as a result of hydration of fly ash. 5.3 Single Frequency Measurements Evolution of EC at 70 MHz for various specimens, measured using a single frequency capacitance probe, is presented in Figure 5. The capacitance probe test results agree well with the broadband frequency EC test results. Data show that at early times the presence of fly ash causes a delay in the primary EC peak indicating a slowdown in the initial hydration reactions. The delay in the primary EC peak is proportional to the fly ash content and ranges from approximately 30% for 2.5% FA and 5% PC specimen to approximately 70% for 15% FA and 5% PC specimen. As hydration proceeds, the CPB containing fly ash exhibits the secondary EC peak, indicating that fly ash acts as an additional source of ions that contribute to electrical conductivity of the paste.
6 STRENGTH DEVELOPMENT IN CPB WITH HIGH FLY ASH CONTENT
Electromagnetic wave-based techniques have demonstrated that fly ash initially causes a delay in hydration at early times, but later on it enhances the hydration process in fly ash-containing pastes. The
839
GeoHalifax2009/GéoHalifax2009

20
25
30
35
40
1 10 100 1000 10000
Time, min
Rea
l R
elat
ive
Per
mit
tivity @
1G
Hz
.
15% FA 5% PC
5% PC 2.5 % FA
2.5% PC 2.5% FA
5% PC
100% MT
0
0.2
0.4
0.6
0.8
1
1 10 100 1000 10000Time, min
E.
Co
nd
uct
ivity
, S
/m
.
Figure 4. Temporal response of a. real relative
permittivity and b. EC for various CPB specimens
0
0.2
0.4
0.6
0.8
1
1.2
10 100 1000 10000Time, min
Ele
ctri
cal C
ondu
ctiv
ity,
S/m
.
5:15 PC:FA
5:5 PC:FA
5:2.5 PC:FA
5:0 PC:FA
100 MT
2.5:2.5 PC:FA
Figure 5. Evolution of EC with time for various CPB
specimens measured with a single frequency capacitance probe
standard Unconfined Compressive Strength Test (UCS) results on selected CPB specimens containing various contents of PC and/or FA are presented in Table 3. Table 3. UCS of various CPB cured for 1, 3 and 7 days
Specimen 1-day UCS 3-day UCS 7-day UCS
95:5 MT:PC
97±7 kPa 129±2 kPa 158±22 kPa
95:2.5:2.5 MT:PC:FA
56±1 kPa 90±11 kPa 153±3 kPs
80:20 MT:FA
<40 kPa)* <40 kPa)* <40 kPa)*
80:5:15 MT:PC:FA
202±20 kPa 431±5 kPa 813±15 kPs
)* specimen was too frail to be tested in a standard UCS test
All specimens exhibit an increase in UCS during the
first 7 days of curing; however, the rate of strength development depends on the binder type and content. The specimens containing fly ash exhibit a higher rate of strength development with time than the specimen containing only PC. Although the specimen where 50% of Portland cement was replaced with fly ash exhibits a reduced UCS (~56 kPa) after one day of curing than the specimen with no fly ash (~97 kPa), the fly ash-containing CPB has attained similar UCS as Portland cement only-containing CPB after 7 days of curing (~150 kPa). The specimen that contains only fly ash (without PC) failed to develop enough strength in order to be used in the UCS test. Insufficient pH and absence of Portland cement are the factors that failed to activate the fly ash surface and hindered the hydration process and hardening of this paste. 7 FIELD DATA
Capacitance probes were installed in a previously excavated stope prior backfilling with an intention to monitor changes in water content and stages of hydration in a large scale backfilled stope. As much as 50% of Port land cement was replaced with fly ash. The total binder content of the paste was 3%. Figure 6 presents the temporal responses of EC for CPB with 3% binder (50:50 PC:FA) in the controlled laboratory condition and in situ. The additional laboratory-prepared specimen containing 3% PC (no fly ash) was prepared and tested to explore the effect of fly ash on the rate of hydration. The times required for EC to reach the peak value in laboratory-prepared CPB and in situ CPB containing 3% binder are ~850 minutes (~14 hours) and ~960 minutes (~16 hours), respectively. This small time difference in EC peak occurrence between the in situ and laboratory test results is most likely due to the difference in ambient temperature and ambient relative humidity between the mine and the laboratory that may have caused the variations in the rate of hydration. On the other hand, the time when the CPB containing 3% PC (no fly ash) reaches the peak EC is significantly shorter: it takes only ~340 minutes (~5.5 hours) for EC to reach the peak value as compared to 16 hours for fly ash-containing specimen.
a.
b.
Primary EC peak
Secondary EC peak
840
GeoHalifax2009/GéoHalifax2009

This comparative analysis has shown that while there is a little difference in stages of binder hydration between the laboratory-prepared CPB and in situ CPB at early times (i.e., during the first 24 hours), the fly ash replacement may have significant effect. Furthermore, the long-term behaviour of in situ paste and laboratory-cured paste may differ due to the difference in ambient temperature and relative humidity. In addition, a partial replacement of Portland cement with fly ash may cause a delay in binder hydration at early times as EC peak is shifted to later times.
0
0.1
0.2
0.3
0.4
10 100 1000 10000
Time, min
Ele
ctric
al C
ondu
ctiv
ity, S
/m
In situ EC 3% binder (50:50 PC:FA)
Lab EC 3% binde (50:50 PC:FA)
Lab EC 3% PC
Figure 6. Field and lab EC data for 3% CPB (50:50
PC:FA) and 3% PC CPB lab EC data
8 CONCLUSIONS This study has shown that EM-wave based techniques are sensitive to paste composition, including binder content, binder type and water content of the paste. Initially the high fly ash content in CPB causes a delay in hydration process at early times of hydration reactions. However, at later times the fly ash seems to enhance the hydration reactions in CPB by increasing the ionic concentration, and, consequently, providing the additional ions needed in creation of new hydration products. Low cost capacitance probe has proved to be a useful tool for monitoring the hydration stages in otherwise inaccessible locations, such as backfilled stopes in underground mines. 9 ACKNOWLEDGEMENT This study is supported financially by Hemlo Operations of Barrick and NSERC. The authors would also like to
thank Dr. Ben Thompson for providing the in situ EM data and summer students Emilie Schnarr and Scott Whitehurst for helping with the laboratory experimental work. 10 REFERENCES ACI Committee 226, 1987. Use of Fly Ash in Concrete.
ACI Materials Journal, ACI, 226.3R-87: 381-409. Al-Zahrani, M.M., Al-Tayyib, A.-H.J., Al-Dulaijan, S.U. and
Osei-Twum E. 2006. Si MAS-NMR study of hydrated cement paste and mortar with varying content of fly ash, Advances in Cement Research, 1:27-34.
ASTM, C125. 2007. Standard Terminology Relating to
Concrete and Concrete Aggregates, ASTM Subcommittee C09.91. Volume 04.02.
Baert, G., Pope, A.-M. and De Belie, N. 2008. Strength
and Durability of High-Volume Fly Ash Concrete, Structural Concrete, 9(2): 101-108.
Cengiz, D. A. 2002. Heat Evolution of High-Volume Fly
Ash Concrete, Cement and Concrete Research, 32(5): 751-756.
Christensen, B.J., Coverdale, T.R., Olson, R.A. Ford,
S.J., Garboczi, E.J., Jennings, H.M. and Mason, T.O. 1994. Impedance spectroscopy of hydrating cement-based materials: measurement, interpretation and application, Journal of American Ceramic Society, 77(11): 2789-2804.
Fajun W., Grutzeck M.W. and Roy, D.M. 1985. The
retarding effects of fly ash upon the hydration of cement pastes: the first 24 hours. Cement and Concrete Research, 15:174-184.
Glasser, F.P., Diamond, S., and Roy, D.M. 1987.
Hydration reactions in cement pastes incorporating fly ash and other pozzolanic materials, in Microstructural Development During Hydration of Cement, Struble, L. and Brown, P., Ed., Materials Research Society: 167-186.
Ishida, N. 2006. Dielectric Behaviour of Clay Surfaces, in
Encyclopedia of Surface and Colloid Science, Ponisseril Somasundaran (ed.), CRC Press, Taylor and Francis Group, Boca Raton, FL, USA, 1670-1675.
Klein, K.A. and Santamarina, J.C. 2000. Ferromagnetic
inclusions in geomaterials: Implications, Journal of Geotechnical and Geoenvironmental Engineering, 126(2): 167-179.
McCarter, W.J. 1996. The AC impedance response of
concrete during early hydration, Journal of Material Science, 34:6285-6292.
EC peak
841
GeoHalifax2009/GéoHalifax2009
Miura N., Shinyashiki N., and Yagihara S. 1998. Microwave dielectric study of water structure in the hydration process of cement paste, Journal of American Ceramic Society, 81(1): 213-216.
Neville, A.M. 1995. Properties of Concrete, Burnt Mill,
Harlow, Essex; New York: Longman Scientific & Technical, 844p.
Perez-Pena, M., Roy, D.M., Bhalla, A.S. and Cross, L.E.
1986. Dielectric properties of densified hardened cementitious materials, Cement and Concrete Research, 16:951-965.
Santamarina, J.C., Klein, K.A. and Fam, M.A. 2001. Soils
and Waves, John Wiley & Sons Ltd., New York, NY, USA.
Topp, G.C., Davis, J.L. and Annan, A.P. 1980.
Electromagnetic determination of soil water content: measurements in coaxial transmission lines. Water Resources Research, 16(3): 574–582.
842
GeoHalifax2009/GéoHalifax2009