EFFECT OF FIELD UTILIZATION FACTOR ON AIR BREAKDOWN ...
39
EFFECT OF FIELD UTILIZATION FACTOR ON AIR BREAKDOWN LEVEL UNDER LIGHTNING IMPULSE NOOR AIN BINTI YUSOFF A project report submitted in partial fulfillment of the requirement for the award of the Master of Electrical Engineering Faculty of Electrical and Electronic Engineering Universiti Tun Hussein Onn Malaysia JANUARY 2015
Transcript of EFFECT OF FIELD UTILIZATION FACTOR ON AIR BREAKDOWN ...

EFFECT OF FIELD UTILIZATION FACTOR ON AIR BREAKDOWN LEVEL
UNDER LIGHTNING IMPULSE
NOOR AIN BINTI YUSOFF
A project report submitted in partial
fulfillment of the requirement for the award of the
Master of Electrical Engineering
Faculty of Electrical and Electronic Engineering
Universiti Tun Hussein Onn Malaysia
JANUARY 2015

vi
ABSTRACT
The goal of this project is to develop a relationship between field utilization factor
(ɳ) and air breakdown level under lightning test. Standard lightning impulse of
1.2/50 is used in this study, along with three difference electrode configurations (rod-
rod electrode, rod-sphere electrode and sphere-sphere electrode) with variable gap
lengths. In addition, the lightning impulse breakdown level considering utilization
factors are studied for the establishment of insulation design criteria of high voltage
power equipment. The utilization factors are represented as the ratio of minimum
electric field (Emin) to maximum electric filed (Emax). COMSOL software is used to
develop electrode model in order to analyses the electric field. It was found that
higher gap lengths provide higher U50 for a given electrode configuration, although
the rise in U50 is more clearly in sphere-sphere electrode configuration. Where,
sphere-sphere electrode configuration require higher U50 to breakdown it is 40% than
rod-sphere electrode configuration (30%) and rod-rod electrode configuration (28%),
respectively. A difference in Emax values where the higher gap length provide lower
Emax for sphere-sphere electrode configuration, while the higher gap length provide
higher Emax for rod-rod and rod-sphere electrode configurations. Considering the
effects of field utilization factor, which was based on difference electrode
configurations, it was found that sphere-sphere electrode more uniformity at gap
length 0.5 cm (0.9968) than rod-rod electrode at gap length 1 cm (0.2057) and rod-
sphere electrode at gap length 1 cm (0.1546). Where the values of each field
utilization factor (ɳ) is 1 in the uniform field and 0<ɳ<1 is in the non-uniform.
Furthermore, it can be concluded that electrode configuration, which includes
electrode geometry and gap length, plays a big role in determining U50 values for air
breakdown level in order affected to uniformity in field utilization factor (ɳ) values.

vii
ABSTRAK
Tujuan projek ini adalah untuk membangunkan satu hubungan diantara faktor
penggunaan bidang (ɳ) dan tahap pecahan udara dibawah ujian kilat. Piawaian
denyutan kilat 1.2/50 telah digunakan dalam kajian ini, beserta dengan tiga susunan
elektrod yang berbeza-beza (rod-rod elektrod, rod-sfera elektrod dan sfera-sfera
elektrod) dengan panjang diantara dua elektrod yang berubah-ubah. Selain itu, ciri-
ciri pecahan denyutan kilat yang dikaji telah mempertimbangkan faktor-foktor
penggunaan bagi penubuhan kriteria reka bentuk penebat peralatan kuasa voltan
tinggi. Faktor-faktor penggunaan yang dimaksudkan adalah nisbah bagi minimum
medan elektrik (Emin) sehingga maksimum medan elektrik (Emax). Perisian COMSOL
digunakan untuk membangunkan model elektrod seterusnya menganalisis medan
elektrik. Ia telah mendapati bahawa panjang diantara dua elektrod yang lebih tinggi
menyediakan U50 yang lebih tinggi untuk konfigurasi elektrod yang diberikan,
walaupun kenaikan U50 adalah lebih jelas dalam konfigurasi elektrod sfera-sfera. Di
mana, konfigurasi elektrod sfera-sfera memerlukan U50 lebih tinggi untuk berlaku
pecahan iaitu 40% daripada konfigurasi rod-sfera elektrod (30%) dan konfigurasi
elektrod rod-rod (28%), masing-masing. Berbeza dengan nilai Emax di mana semakin
luas panjang diantara dua elektrod, semakin rendah nilai Emax bagi konfigurasi
elektrod sfera-sfera, manakala semakin luas panjang diantara dua elektrod, semakin
tinggi nilai Emax bagi konfigurasi elektrod rod-rod dan rod-sfera. Dengan mengambil
kira kesan faktor penggunaan medan (ɳ), yang mana berdasarkan konfigurasi
elektrod yang berbeza, didapati bahawa elektrod sfera-sfera lebih seragam pada
panjang diantara dua elektrod 0.5 cm (0.9968) berbanding elektrod rod-rod dengan
panjang diantara dua elektrod 1 cm (0.2057) dan rod- elektrod sfera dengan panjang
diantara dua elektrod 1 cm (0.1546). Di mana nilai setiap faktor penggunaan medan
(ɳ) adalah 1 dalam medan yang seragam dan 0 <ɳ <1 adalah tidak seragam.Selain itu,

viii
ia boleh disimpulkan bahawa konfigurasi elektrod, yang merangkumi geometri
elektrod dan panjang jurang, memainkan peranan yang penting dalam menentukan
nilai-nilai U50 pada tahap pecahan udara seterusnya memberi kesan kepada
keseragaman pada nilai faktor penggunaan medan (ɳ).

ix
LIST OF CONTENT
TITLE i
DECLARATION ii
DEDICATION iv
ACKNOWLEDGEMENT v
ABSTRACT vi
LIST OF CONTENT ix
LIST OF TABLE xii
LIST OF FIGURE xiii
LIST OF SYMBOLS AND ABBREVIATION xvi
CHAPTER 1 INTRODUCTION 1
1.1 Project Background 1
1.2 Problem Statement 2
1.3 Objective 3
1.4 Scope of Project 3
1.5 Content of Report 3
CHAPTER 2 AIR BREAKDOWN UNDER LIGHTNING
IMPULSE: A REVIEW 5
2.1 Introduction 5
2.2 Lightning Threat 6
2.2.1 Mechanism of Lightning Occurrence 6
2.2.2 Effect of Direct Lightning Strikes 7
2.2.3 Effects of Induced lightning from
Overhead Electric and so on 8

x
2.3 Air Breakdown 8
2.3.1 Breakdown of Gases 9
2.3.2 Non-Sustaining Discharges and
Self-Sustaining Types 10
2.4 50% Breakdown Voltage of Air 12
2.5 Analysis Electric Field from Previous Work 14
2.6 Lightning Impulse Voltage 17
2.6.1 Tolerance 19
2.7 Capacitive Voltage Divider 19
2.8 Electric Field 20
2.8.1 Uniform and Non Uniform Electric
Field 21
2.9 Equipotential Lines 23
2.10 Conclusion 24
CHAPTER 3 EXPERIMENTAL SETUP AND SIMULATION
TECHNIQUE 25
3.1 Introduction 25
3.2 Testing 25
3.2.1 Lightning Impulse Circuit 26
3.2.2 Block Diagram Lightning Impulse
Circuit 28
3.2.3 Single-stage Impulse Voltage Generator 29
3.2.4 Lightning Impulse Setup on the
Control Desk (HV9103) Procedure 30
3.2.5 Lightning Impulse Waveform 1.2/50 us
Standard by the experimental 32
3.2.6 Up-And-Down Method 35
3.3 Simulation 36
3.3.1 Finite Element Method 36
3.3.2 Create the Model 37
3.3.3 Material properties 39
3.3.4 Boundary Condition 39
3.3.5 Mesh 39

xi
3.3.6 Solver Setting 41
3.4 Conclusion 41
CHAPTER 4 BREAKDOWN LEVEL OF AIR UNDER
LIGHTNING IMPULSE: EFFECT OF
ELECTRODE CONFIGURATION AND GAP
LENGTHS 43
4.1 Effect of Electrode Configuration 43
4.2 U50 for difference electrode configuration 47
4.3 Electric Potential (kV) for difference
Electrode configuration 45
4.4 Maximum Electric Field (Emax) for
difference Electrode Configuration 47
4.5 Effect of Gap Length 56
4.6 Effect of Gap Length for U50 57
4.7 Effect of Gap Length for Maximum
Electric Field, Emax 58
4.8 Effect of Gap Length for Field Utilization
Factor, ɳ 59
4.9 Relationship between maximum
electric field, Emax (kV/cm) and U50 (kV) 61
4.10 Conclusion 62
CHAPTER 5 GENERAL CONCLUSION AND
RECOMANDATION 64
5.1 Conclusion 64
5.2 Recommendation for Future Work 65
REFERENCE 67

xii
LIST OF TABLES
2.1 Field utilization factor for each electrode configuration
with V=1 kV 15
2.2 Tolerances of lightning impulse 19
3.1 Component description for the experimental setup lightning
Impulse 27
3.2 Standard impulse voltage tolerances (1.2/50 µs) 33
4.1 U50 (kV) for difference electrode configuration 44
4.2 Emax for difference electrode configurations (kV/cm) 51
4.3 Field utilization factor, ɳ for difference electrode 53
4.4 U50 (kV) and field utilization factor, ɳ, for all electrodes 53
4.5 Emax (kV) and field utilization factor, ɳ, for all electrodes 53
4.6 Sphere-sphere electrode configuration 56
4.7 Rod-rod electrode configuration result 56
4.8 Rod-sphere electrode configuration result 57

xiii
LIST OF FIGURES
2.1 Lightning 6
2.2 Lightning generation mechanism 7
2.3 Effect of direct lightning strikes 7
2.4 A lightning surge is unbound charge flowing into
the ground 8
2.5 Ionisation by electron collision with gas 9
2.6 Secondary ionization due to cathode collision 11
2.7 An avalanche, consisting of fast moving electrons and
slow positive ions 11
2.8 Streamer formation 12
2.9 U50 (kV) for rod-plane electrode 13
2.10 U50 (kV) for sphere-sphere electrode 13
2.11 Lines of electric field with equal magnitudes with
maximum electric field region at the edge of the
electrode for plane-plane configuration (kV/cm) 14
2.12 Lines of electric field with equal magnitudes with
maximum electric field region at the tip of,
(a) rod-plane configuration and (b) sphere gap
configuration (kV/cm) 15
2.13 Maximum electric field (kV/cm) vs. gap distance (cm) 16
2.14 (a) Full lightning impulse voltage, (b) lightning impulse
voltage chopped on the tail, (c) lightning impulse voltage
chopped on the front 18
2.15 Capacitive Divider 20
2.16 Direction of an electric field 21

xiv
2.17 Magnitud and direction same at all point 22
2.18 Different movement of magnitude and direction 23
2.19 Equipotential lines and electric field (E) 24
3.1 Experimental setup for generation of lightning
impulse voltages in HV laboratory 26
3.2 Schematic circuit for generation of lightning impulse
voltages 27
3.3 Block diagram lightning impulse circuit 28
3.4 Single-stage impulse voltage generator circuit 29
3.5 Turn ON at Control Desk procedure 31
3.6 Turn OFF at Control Desk procedure 32
3.7 Front time (T1) for lightning impulse waveform 33
3.8 Tail time (T2) for lightning impulse waveform 34
3.9 Breakdown waveform 34
3.10 Flowchart up-and-down method 35
3.11 General procedures for FEM simulations in COMSOL
Multiphysics 36
3.12 A 2D axis-symmetric model in COMSOL
Multiphysics for rod-sphere electrode configuration 37
3.13 A 2D axis-symmetric model in COMSOL Multiphysics
for rod-rod electrode configuration 38
3.14 A 2D axis-symmetric model in COMSOL Multiphysics
for sphere-sphere electrode configuration 38
3.15 The meshing of model (rod electrode) 40
3.16 The maximum value of electric field in 2D graph 41
4.1 Contour of electric potential for three electrode
configurations at gap length 2 cm, where, (a) rod-rod
electrode, (b) rod-sphere electrode, and (c) sphere-sphere
electrode 46
4.2 Electric potential (kV) graph from point ‘a’ to point
‘b’ for electrode configurations. 47
4.3 Lines of electric field with equal magnitudes with
maximum electric field region at the tip of the
electrode for rod-rod configuration (kV/cm) 48

xv
4.4 Lines of electric field with equal magnitudes with
maximum electric field region at the tip of the
electrode for rod-sphere configuration (kV/cm) 48
4.5 Lines of electric field with equal magnitudes with
maximum electric field region at the edge of the
electrode for sphere-sphere configuration (kV/cm) 49
4.6 Electric field magnitude along the gap of rod-rod
electrode (Refer for the Figure 4.3) 50
4.7 Electric field magnitude along the gap of rod-sphere
electrode (Refer for the Figure 4.3) 50
4.8 Electric field magnitude along the gap of sphere-sphere
electrode (Refer for the Figure 4.5) 51
4.9 U50 (kV) curve in relation to the field utilization
factor, ɳ, for all electrode configuration 54
4.10 Emax (kV/cm) curve in relation to the field utilization
factor, ɳ, for all electrode configuration 55
4.11 Relationship between U50 (kV) versus gap length (cm) 58
4.12 Relationship between maximum electric field,
Emax (kV/cm) versus gap length (cm) 59
4.13 Relationship between gap length (cm) versus field
utilization factor, ɳ 60
4.14 Relationship between maximum electric field,
Emax (kV/cm) versus U50 (kV) 61

xvi
LIST OF SYMBOLS AND ABBREVIATIONS
Emax - Maximum electric field
Emin - Minimum electric field
ɳ - Field utilization factor
U50 - 50% breakdown voltage
LI - Lightning impulse
UTHM - Universiti Tun Hussein Onn Malaysia
AC - Alternating current
DC - Direct current
HV - High voltage
cm - Centimeter
kV/cm - Kilo volt/centimeter
kV - Kilo volt

` `
CHAPTER 1
INTRODUCTION
1.1 Project Background
The accidents caused by insulating instability have been increasing in high voltage
power equipment. It is important to increase the insulation reliability of a high
voltage power equipment to reduce the damage from electrical hazards such as, spark
over voltage causes by the lightning stroke. As an engineer’s, it is important to built a
perfect and safe condition of high voltage power equipment, (such as overhead line,
substation equipment and various air insulated high voltage equipment) in providing
electricity to the consumers [1]. To develop electrically reliable high voltage power
equipment, the study on the relationship between field utilization factor and air
breakdown level under lightning test is needed. The tests were performed using the
international IEC standards [2].
This project used three pair of electrode configurations such as rod-rod
electrode configuration, rod-sphere electrode configuration and sphere-sphere
electrode configuration. It is used to measure U50 (kV) values for each breakdown
level by using Up-And-Down method under 1.2/50 µs standard lightning impulse.
The standard lightning impulse waveform has been determined and explains at next
chapter.

2
In addition, the lightning impulse breakdown characteristics considering
utilization factors are studied for the establishment of insulation design criteria of
high voltage power equipment. The utilization factors are represented as the ratio of
minimum electric field (Emin) to maximum electric filed (Emax). To develop electrode
model by using COMSOL software in order to analyses the electric field.
1.2 Problem Statement
In electrical power system, high voltage power equipment is mainly subjected with
spark over voltage causes by the lightning stroke. The lightning strikes on the
overhead transmission line. The strikes on the shield wire would transmit the induced
voltage to the ground. The strikes on the lines would cause dual travelling waves in
which the surges will travel to the generator and to the distribution sides. Voltage
induced would cause damage to the component (such as transformer, generator, fuses
and connector). Coordination gap is placed on the line to re-direct the surge to the
ground.
In an electricity network, some of the high voltage application make use of
gas as insulation medium, such as in the gas insulated switchgear (GIS), gas
insulated transmission line (GIL) and gas circuit breaker (GCB). Whereby air
insulated is categories in gas insulated [3]. In the high voltage power equipment
more electrode configuration can use for measurement electric field which is sphere-
sphere, sphere-plate, rod-rod, rod-plate and plate-plate. However, in this project only
use three pairs of electrode configurations there are rod-rod electrode configuration,
rod-sphere electrode configuration and sphere-sphere electrode configuration. For
example by placing different gap length between three pair of electrode
configurations and apply U50 (kV) values may be can get the difference value of
electric field, thus can be compared to either with the short or long distance will be
breakdown. Therefore, to analysis this effect the relationship between utilization
factor and air breakdown level under lightning impulse will be develop.

3
1.3 Objective
The main objectives of this project are:
i. To find the air breakdown voltage level and electric field for different
electrodes configuration using lightning impulse test.
ii. To develop electrode model using COMSOL software in order to analyses the
electric field.
iii. To develop the relationship between field utilization factor and air breakdown
level under lightning impulse.
1.4 Scope of Project
i. Maximum impulse voltage is 140 kV, but for safety reasons, the allowable
limit is 100 kV.
ii. Use air = gas at atmosphere P = 1bar.
iii. Temperature and humidity effect are not considered.
iv. Gap length < 5 cm due to the limitation on the impulse.
v. Simulation work carried out in 2D axisymmetric plane only.
1.5 Content of Report
This thesis divided into five chapters which are including the introduction, air
breakdown under lightning impulse: a review, experimental setup and simulation
technique, effect of electrode configurations and effect of gap length, and general
conclusion and recommendation. This thesis focused for the effect of field utilization
factor on air breakdown level under lightning impulse.
Chapter 2 describes on literature review. This chapter contains theory of
breakdown, research on previous work and a fundamental analysis on electric field.

4
Previous related works in this chapter helps a lot to guide and as reference in this
project.
Chapter 3 emphasizes on the methodology to the whole project consisting
procedure of testing and simulation. In this chapter the apparatus required for
measurement of air breakdown voltage, description of equipment used for air
breakdown test, schematic diagram for air breakdown voltage and experimental
procedure for conducting the air breakdown voltage are discussed.
Chapters 4 consist of result and analysis from test and simulation. In this
chapter discusses about results and discussion part of the thesis and all the results are
furnished in a tabular as well as the graphical from to clarify the objective of the
thesis. It is also covers the difference types of performance characteristics of air
breakdown voltage with difference physical condition.
Chapter 5 will explain about the whole conclusion in this project and also
some important discussion about the future work of the thesis which helps the
advancements in technology.

CHAPTER 2
AIR BREAKDOWN UNDER LIGHTNING IMPULSE: A REVIEW
2.1 Introduction
Lightning is a high frequency electrical phenomenon which causes overvoltage on all
conductive items, especially on electrical cabling and equipment. A lightning stroke
can fall near an electrical power line. It is the electromagnetic radiation of the
lightning current that produces a high current and an overvoltage on the electric
power supply network. In the latter two cases, the hazardous current and voltage are
transmitted by the power supply network thus will occur breakdown in equipment
electrical.
The aim of this chapter is to provide a comprehensive review of the studies
related to the research programmes in order to provide a good understanding of air
breakdown under lightning impulse. By refer from variable source such journals,
books, websites and articles, the data and information can be collected.

6
2.2 Lightning Threat
With the spread of advanced information technology trough out society in recent
years, lightning damage is having an increasing effect on the electronic equipment,
computer system, and networks that play an important role and are indispensible for
comfortable living. Conventional lightning rods guide lightning through lightning
conductions rod, such as a building’s steel framework, so that a large current flows to
the ground. As a result, electromagnetic induction occurs, and a large surge current
flows in the ground, which causes damage to electronic equipment by penetration
from power supplies or communication cable and so on. Figure 2.1 shows example
the picture of the lightning occurred [5].
Figure 2.1: Lightning [4]
2.2.1 Mechanism of Lightning Occurrence
In most cases the mechanism for occurrence of thunder clouds is rising air currents
due to the air being heated near the ground by strong sunlight. The air in this rising
air current is cooled, and the charge is separated when hail is generated, so the
thunder clouds grow large due to the effect of electricity being generated. Figure 2.2
show the lightning generation mechanism.

7
Figure 2.2: Lightning generation mechanism[4]
Normally, a positive charge accumulates in the top of a thunder cloud and a
negative charge accumulates in the bottom, so positively charged static electricity is
induced near the ground surface. In this way, a strong electric field is generated
between the thunder cloud and the earth, and when this exceeds the insulation
capacity of the air, lightning is generated [6].
2.2.2 Effect of Direct Lightning Strikes
When lightning strikes a lightning rod, a large lightning current flows into the
groundthrough the lightning rod conduction wires and the steel framework of the
building. A magnetic field is generated by this excessive electric current, and a surge
voltage is induced in cables and electronic equipment by electromagnetic induction.
Also, an induced voltage is generated in equipment near the grounding cables and in
buried electric lines by the surge current that flows into the earth.
Figure 2.3: Effect of direct lightning strikes [4]
Burn Effect

8
Figure 2.3 shown effects of direct lightning strikes. Lightning current is large
in the range 1 to 200 kA, and the rise time is large (9 to 5kA/µs), so a large surge
voltage is generated that is capable of causing damage to nearby electronic
equipment such as computer system and telephone exchanges [7].
2.2.3 Effects of Induced lightning from Overhead Electric and so on
Induced lightning surges that penetrate from power supply lines and so on. As a
result of the discharge in the lightning and thunder clouds and so on, the balance in
the previously balanced electrostatic charge in overhead electric lines becomes
unbalanced, so surge current flows into equipment from power supply lines and
telephone lines and so on, which have surge current, so damage can result. Figure 2.4
show a lightning surge is unbound charge flowing into the ground [7].
Figure 2.4: A lightning surge is unbound charge flowing into the ground [4]
2.3 Air Breakdown
The breakdown in air (spark breakdown) is the transition of a non-sustaining
discharge into a self-sustaining discharge. The buildup of high current in a
breakdown is due to the ionization in which electrons and ions are created from
neutral atom or molecules, and their migration to the anode and cathode respectively
leads to high currents. Whereby, in a self-sustaining discharge the potential gradient
9
is sufficiently high that free electrons are accelerated hard enough to ionise atoms
they collide with. This means that as the current flows it keeps a population of ion
and free electron present. However if the potential gradient is too low, free electrons
cannot ionise other atoms, and the populations of ions and free electrons is readily
depleted. Then, need some external influence to ionize the gas in order to get current
flow. This is a non-sustaining discharge [8]. Townsend theory and streamer theory
are the present two types of theories which explain the mechanism of breakdown
under different conditions as temperature pressure, nature of electrode surfaces,
electrode field configuration and availability of initial conducting particles. Normally
air medium is widely used as an insulating medium in different electrical power
equipment and overhead lines as its breakdown strength is 30kV/cm [9].
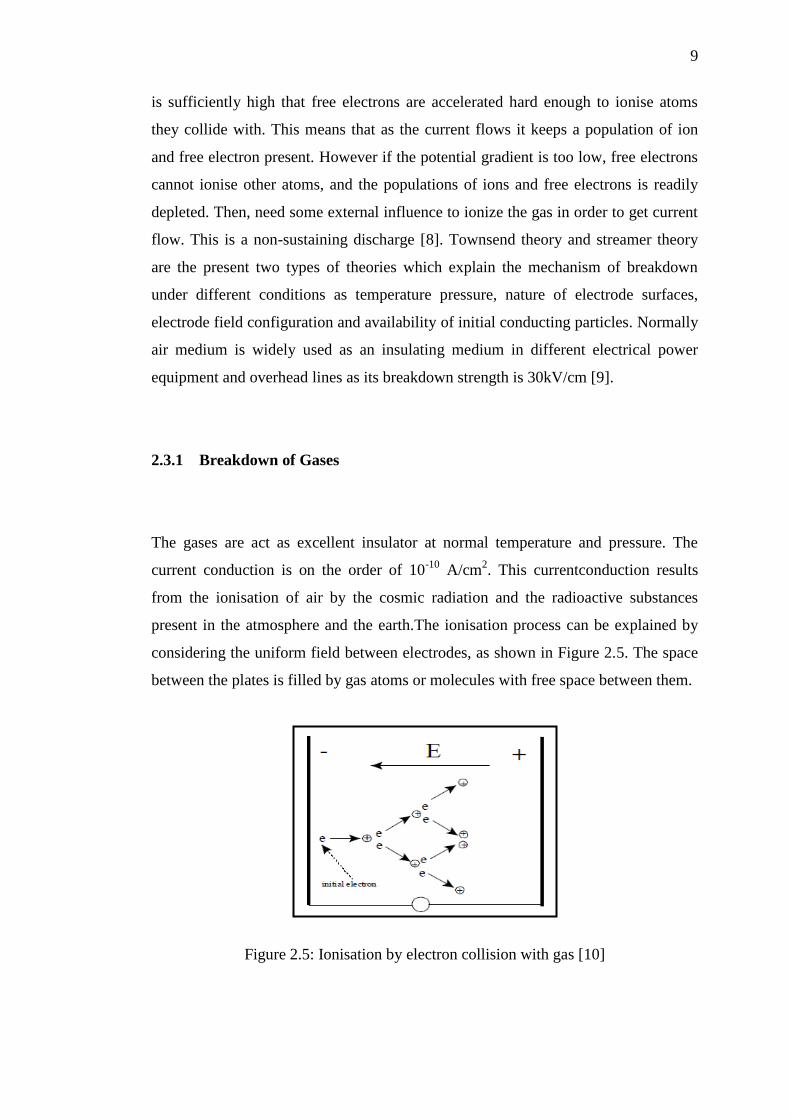
2.3.1 Breakdown of Gases
The gases are act as excellent insulator at normal temperature and pressure. The
current conduction is on the order of 10-10
A/cm2. This currentconduction results
from the ionisation of air by the cosmic radiation and the radioactive substances
present in the atmosphere and the earth.The ionisation process can be explained by
considering the uniform field between electrodes, as shown in Figure 2.5. The space
between the plates is filled by gas atoms or molecules with free space between them.
Figure 2.5: Ionisation by electron collision with gas [10]

10
The process is initiated by the presence of free electrons in the atmosphere,
due to ionisation by cosmic radiation. Such an initial electron is accelerated in the
field away from the negatively charged plate (the negatively charged electron is
repelled by the negative electrode) and it may collide against an atom or molecule of
the gas.If the initial electron attains a high enough speed, it may, during an inelastic
collision, transfer some of its kinetic energy to the gas molecule. If this energy
exceeds the ionisation energy of the gas atom, one or more electrons may leave their
orbits and the atom will lose a negative charge, thus becoming a positive ion. The
free electrons are accelerated towards the positive electrode and may, depending on
the density of the atoms, partake in further collisions. As will be seen later, the
probability of a collision depends on how densely the atoms are packed. This
explanation has been discussed by [11], [12].
2.3.2 Non-Sustaining Discharges and Self-Sustaining Types
In order to understand the breakdown phenomenon in gases, the electrical properties
of gases should be studied. The processes by which high currents are produced in
gases are essential. The electrical discharges in gases are of two types:
i. Non-sustaining discharges
ii. Self-sustaining types
For example, as was shown in Figure 2.6, positive ions are formed during the
avalanche process. A single electron, starting at the cathode, produces new electrons
and positive ions while moving over the distance towards the anode. The heavy ions
experience a force due the electric field and are accelerated towards the cathode, as
shown in Figure 2.6. The cathode is a conductor and it can emit electrons when
receiving sufficient external energy, either thermally, through photons or by impact.
Over the distance to the cathode the heavy positive ions build up sufficient kinetic
energy to release more initiating electrons during impact with the cathode. Each
colliding electron releases new electrons. This process as described are self-sustained
gas discharge (townsend discharge).

11
Figure 2.6: Secondary ionization due to cathode collision [10]
Figure 2.7: An avalanche, consisting of fast moving electrons and slow positive ions
[10]
It is clear that the number of electrons and positive ions increase
exponentially with the length of the discharge. Such a discharge is called an
avalanche. A typical avalanche is shown in Figure 2.7. The mass of a hydrogen
positive ion is 1860 that of an electron. It therefore accelerates much slower than the
electron. The fast moving high (high mobility) electrons are at the tip of the
avalanche with the heavy positive ions (low mobility) moving slowly towards the
negative electrode. The discharges as described in this section are non-self-
sustaining, for example they continuously require initiating electrons and as soon as
the initiating electrons cease to appear, the process stop. Such avalanches alone
cannot lead to flashover, but require a positive feed-back process to develop into a
flashover. Townsend showed that secondary processes, such as ion impact at the
cathode or photo-ionisation, provide such feed-back [13].
Distance
Length of discharge
12
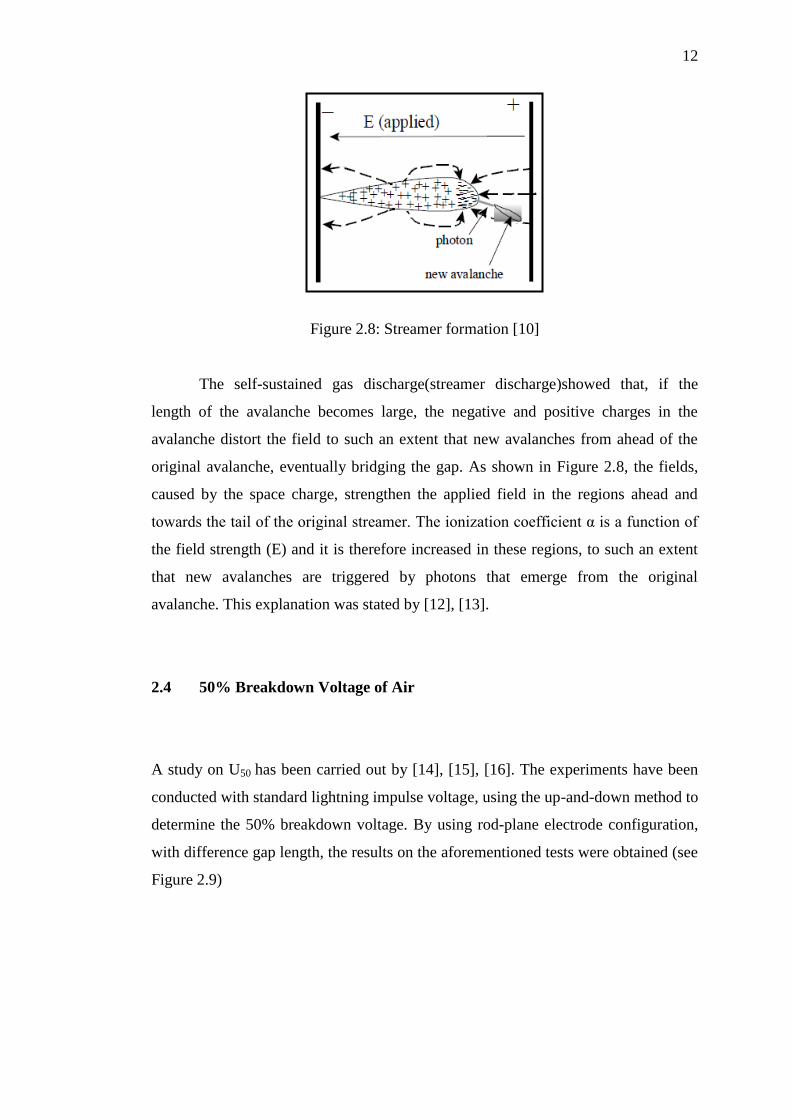
Figure 2.8: Streamer formation [10]
The self-sustained gas discharge(streamer discharge)showed that, if the
length of the avalanche becomes large, the negative and positive charges in the
avalanche distort the field to such an extent that new avalanches from ahead of the
original avalanche, eventually bridging the gap. As shown in Figure 2.8, the fields,
caused by the space charge, strengthen the applied field in the regions ahead and
towards the tail of the original streamer. The ionization coefficient α is a function of
the field strength (E) and it is therefore increased in these regions, to such an extent
that new avalanches are triggered by photons that emerge from the original
avalanche. This explanation was stated by [12], [13].
2.4 50% Breakdown Voltage of Air
A study on U50 has been carried out by [14], [15], [16]. The experiments have been
conducted with standard lightning impulse voltage, using the up-and-down method to
determine the 50% breakdown voltage. By using rod-plane electrode configuration,
with difference gap length, the results on the aforementioned tests were obtained (see
Figure 2.9)

13
Figure 2.9: U50 (kV) for rod-plane electrode [16]
Further tests on U50 have been carried out by [17], [18], [19]. Standard lightning
impulse of 1.2/50 is used in this study, along with sphere-sphere electrode
configuration with variable gap length. By applying the up-and-down method to get
50% breakdown value, the results from this study were obtained (see Figure 2.10).
Figure 2.10: U50 (kV) for sphere-sphere electrode [18]
Referring to Figure 2.9 and Figure 2.10, it is clear the U50 values increase
with increase the gap length. In both electrode configurations, the U50 curves increase
linearly with the proportion gap length. Therefore, from this study the result shows a
linear relationship between gap length and breakdown voltage.
U5
0 (
kV
)

14
2.5 Analysis Electric Field from Previous Work
Studies on electric field have been carried out by [20]. This paper describes
sparkover characteristics of CF3I-Co2, gas mixture, with focus on 30%-70% mixture.
Standard lightning impulse of 1.2/50 is used in this study. By using three difference
electrode configurations with variable gap lengths, the results from this study were
obtained (see Figure 2.11 and Figure 2.12).
As a clearly shown in Figure 2.11, the maximum electric field, Emax occurs at
the very edge of the high voltage plane electrode at gap length 3 cm. Figure 2.12
shows that the Emax occurs at the tip of R12 and sphere high voltage electrode at gap
length 4 cm and 1 cm, respectively. Whereby red lines shows the maximum electric
field and the blue lines shows the minimum electric field.
From Figure 2.11 and Figure 2.12, the maximum electric field is focused on a
small surface at high voltage electrode. This is the most likely location where the
pre-discharges will occur, followed by air breakdown. This study shows that, a small
surface on the electrode lead to the occurrence of maximum electric field values.
This results is the same as reported by [15], [18], [21].
Figure 2.11: Lines of electric field with equal magnitudes with maximum electric
field region at the edge of the electrode for plane-plane configuration (kV/cm) [20]

15
(a)
(b)
Figure 2.12: Lines of electric field with equal magnitudes with maximum electric
field region at the tip of, (a) rod-plane configuration and (b) sphere gap configuration
(kV/cm) [20]
Table 2.1: Field utilization factor for each electrode configuration with V=1 kV [20]
The electric field utilization factor (ɳ) is presented a ratio of mean electric
field and maximum electric field as a calculated result about the electric field
strength and distribution. The factor (ɳ) is independent of the voltage and is

16
determind by the shape and the arrangement of electrode. So, the electric field
utilization factor of the similar electrode arrangements should be almost same. The
value of each factor (ɳ) is 1 in the uniform field and 0 < ɳ< 1in the non-uniform field
[22]. Referring to the table 2.1, the results of field utilization factor for each electrode
configuration with V= 1 kV has been carried out by [20]. It is found that higher gap
length provides higher U50 and Emax for a given electrode configuration, although the
rise in U50 is more obvious in sphere-sphere configuration, due to more uniform
field.
Further tests on electric field have been carried out by [17]. This paper
describes measurement of air breakdown voltage and electric field using standard
sphere gap. The experiment is conducted at the normal temperature and pressure.
Finite element method is used for finding the electric field between standard sphere
electrodes. The electric field distribution for sphere gap arrangements is also
calculated with the help of COMSOL. By using sphere gap electrode with standard
diameter of 25 cm and variable gap length, the results from this study were obtained
(see Figure 2.13). Figure 2.13 shows that the maximum electric field decreases with
the increase in the gap distance. In the beginning there is sharp drop in the maximum
electric field but it gradually saturates with increase in the gap distance. It found that,
from this study that higher gap distance provides higher Emax for a sphere-sphere
electrode configuration. This result is the same as described by [18].
Figure 2.13: Maximum electric field (kV/cm) vs. gap distance (cm) [17]

17
2.6 Lightning Impulse Voltage
As mentioned that lightning impulse also known as the fast-front overvoltages
(FFO).This is due to very fast rise-time occurring on the waveform shape. The
electrical strength of high voltage apparatus against external overvoltage that can
appear in power supply system due to lightning strokes is tested with lightning
impulse voltage. One differentiates thereby between full and chopped lightning
impulse voltage [2]. A standard full lightning impulse voltage rises to its peak value
in less than a few microseconds and falls, appreciably slower, ultimately back to zero
(Figure 2.14a). The rising part of the impulse voltage is referred to as the front, the
maximum as the peak and the decreasing part as the tail. Chopping of a lightning
impulse voltage in the test field is done by a chopping gap, whereby one
differentiates between chopping on the tail (Figure 2.14b), at the peak and on the
front (Figure 2.14c). The standard chopped lightning impulse voltage has a time to
chopping between 2 µs (chopping at the peak) and 5 µs (chopping on the tail) (Figure
2.14b). The voltage collapse on the tail shall take place appreciably faster than the
voltage rise on the front. Due to such rapid voltage collapse, the test object is
subjected to an enormously high stress. Special requirements may be placed on the
form of chopped impulse voltages for individual high voltage apparatus. Lightning
impulse voltage chopped on the front have times to chopping between 2 µs and low
down to 0.5 µs. At short times to chopping, the waveform at the front between 0.3 on
the peak voltage and the chopping instant is nearly. If variations from linearity are
found within ±5 % of the front time[23].
(a)
kV

18
(b)
(c)
Figure 2.14: (a) Full lightning impulse voltage, (b) lightning impulse voltage
chopped on the tail, (c) lightning impulse voltage chopped on the front [2]
The various lightning impulse voltage are identified in the test specifications
by the following time parameters [2]:
i. Front time T1 and To half value T2 for full lightning impulse voltages
ii. Lightning impulse voltage chopped on the front between 0.5 µs to 2 µs
iii. Lightning impulse voltage chopped on the tail between 2 µs to 5 µs
For charactherising a full impulse voltage, numerical values of front times
and times to half value in microseconds are introduced as symbols. The standard
1.2/50 lightning impulse voltage has accordingly a front time T1 = 1.2 µs and a tail
time T2 = 50 µs.
kV
kV
t
t

19
2.6.1 Tolerance
While generating impulse voltages, deviations from the impulse parameter of the test
standards laid down for high voltage apparatus are permissible. The tolerances for
lightning impulse voltages amount shown in table 2.2.
Table 2.2: Tolerances of lightning impulse [2]
Lightning Impulse Front Time (T1) Tail Time (T2)
Tolerances ±30% ±20%
Standard Time (µs) 1.2 50
Voltage 0.90Vpeak 0.5Vpeak
The reason for the large amount of tolerances on the time parameters lies in
the varying degrees of interaction of the test objects with the generator circuit, due to
which the waveform and thus, the time parameter of the generated lightning impulse
voltage are affected to a greater or smaller extent. The elements of the lightning
impulse voltage generator with which the waveform is obtained need not be changed
each time the load presented by the test object is marginally altered. No tolerances
are fixed for the time to chopping Tc[24].
2.7 Capacitive Voltage Divider
A capacitive voltage divider consists two capacitor in series. It is commonly used to
create a reference voltage, or to get a low voltage signal proportional to the voltage
to be measured, and may also be used as a signal attenuator at low frequencies. For
direct current and relatively low frequencies, a capacitive divider may be sufficiently
accurate if made only of capacitors, where frequency response over a wide range is
required, (such as in an oscilloscope probe), the voltage divider may have capacitive
elements added to allow compensation for load capacitance. In electric power
transmission, a capacitive voltage divider is used for measurement of high voltage.

20
Figure 2.15: Capacitive Divider
Capacitive divider formula:
Figure 2.15 shows the capacitive divider that is connected in series. Whereby
the capacitor with the smaller capacitance will have the greater voltage, and
conversely, the capacitor with the smaller greater capacitance will have the smaller
voltage [25]
2.8 Electric Field
An electric field is generated by electrically charged and time-varying magnetic field.
The electric field describes force experienced by a motionless positively charged to
negatively charge. The electric field direction is always direct away from positive
source charges and toward negative source charges such as figure 2.16. Surrounding
any object with charge, or collection of objects with charge, is an electric field. Any
charge placed in an electric field will experience an electrical force.
Vi
C1
C2
Osc
Vout

21
(a).Positive Charge (b) Negative Charge
(c).Positive and Negative Charge (d) Positive and PositivCharge
Figure 2.16: Direction of an electric field[22]
Some fieldsare uniform (parallel, equally spaced fields lines) such as the field on the
left formed by a sheet of negative charge. Nonuniform fields are stronger where the
field lines are closer together, such as the field on the right produced by a sphere of
negative charge [26].
2.8.1 Uniform and Non Uniform Electric Field
The explanations of uniform and non uniform electric field are:
i. Uniform electric field

22
Figure 2.17: Magnitud and direction same at all point[26]
A uniform electric field is one whose magnitude and direction is same at all
points in space and it will exert same force of a charge regardless of the position of
charge in space such as figure 2.17. It is represented by parallel and evenly spaced
lines. For example we find uniform electric field between parallel plates of a
capacitor. The equipotential surfaces(dotted lines) drawn normal to the field lines are
also equidistance from each other.
ii. Non uniform electric field
A non uniform electric field is one which is not uniform, it has either
different magnitudes or different directions or both different in a given region of
space such as figure 2.18. For example the field due to a point charge, shown by
radial lines. It depends inversely as square of distance from the point charge . The
equipotential surfaces are also at unequal distances (closely spaced near the charge
and farther separating as we move away from the charge) [27].

23
Figure 2.18: Different movement of magnitude and direction[27]
2.9 Equipotential Lines
Figure 2.19 show the equipotential lines and electric field lines. The electric field
lines will always 90 degree to the equipotential lines. The horizontal and parallel
lines are the field lines. The electric field is essentially uniform in between the plates
[28].

24
Figure 2.19: Equipotential lines and electric field (E) [28]
2.10 Conclusion
In this chapter, a review on the air breakdown under lightning impulse has been
presented.From the reading of previous work, explanation is the lightning threat and
air breakdown in gases, from the study can determine the factors causing air
breakdown in gases. Besides, it can know the characteristics of the damage occurred
in the gas as Townsend and Streamer. Besides, by refer from variable sources such
journals, books, websites and articles, the data and information can be collected. The
research and deep study all related journal, book, manual guide, blog and another
reference helped a lot in understanding this project and also as a guide along this
project.
In addition, the study on lightning impulse voltage has been carried out,
explaining that the waveforms according to IEC international standard for the 1.2 /
50 lightning impulse waveform. Study on standard lightning impulse waveform is
important to know correct circuit used during the test run. Study on electric field is
also important to know the characteristics that exist on electric field.
Equipotential Lines
Electric Field
Lines
E
REFERENCE
[1] M.E. E1-Hawary, Introduction to Electrical Power System. Institute of
Electrical Engineering; 2008.
[2] BSI Standards Publication. High Voltage Test Techniques, Part 1: General
Definitions and Test Requirements. IEC 60060-1:2010.
[3] JP Holtzhausen. WL Vosloo. High Voltage Engineering. Practice and
Theory. 2013. 47-84.
[4] David Selby. (2008). Lightning Bolts Hitting Atlanta Skyscrapers.
http://commons.wikimedia.org/wiki/File:Atlanta_Lightning_Strike_edit1.jpg.
access date: 28th
December 2014.
[5] Holle R, Lopez R, Vavrek R, Howard K. Educating Individuals about Lightning.
Paper Presented at America Meteorological Society &th Symposium on
Lightning, January 11-16 1998. Phoenix. AZ
[6] Craig Sr. When Lightning Strikes. Pathophysiology and Treatment of Lightning
Injuries. Postgrad Med. 1986, 79(4):109-112, 121-124.
[7] Uman m. All about Lightning. New York, NY Dover Publications; 1986.
[8] Crowe. R. W, Bragg. J. K and Thomas, Space Charge Formation and the
Townsend Mechanism of Spark Breakdown in Gases, General Electric Research
Laboratory, Schenectady, New York; 10/1954.
[9] Y. Nishikori, S. Kojima, and T. Kouno, A study of the field utilization factor and
the maximum electric field at spark over of the standard sphere gaps, Translated from
Denki Gakkai Ronbunshi. Vol.21-B, No.3, March 2001.

68
[10] Perry Paisley Goh. (2011). Gas/Vacuum Insulation and Breakdown.
http://highvoltageisoco.blogspot.com/2011_03_01_archive.html. access date:
28th
December 2014.
[11] Stefan Lorin1, Erik Grusell
1, Nina Tilly
1, Joakim Medin
2, Peter Kimstrand
1 and
Bengt Glimelius1, Reference Dosimetry in a Scanned Pulsed Proton Beam Using
Ionisation Chambers and a Faraday cup, Phys.Med. Biol, 2008.
[12] N St J Braithwaite, Introduction to Gas Discharges. The Open Univercity,
Oxford Research Unit, Foxcombe Hall, Boars Hill; 2000
[13] S. Ray. An Introduction to High Voltage Engineering. Prentice Hall India; 2004.
[14] P. N. Mavroidis, P. N. Mikropoulos, C. A. Stassinopoulos, A. Dodos and P.
Zannias, Discharge Characteristics in Short Rod-Plane Gaps with Dielectric-
Covered Rod under Lightning Impulse Voltage. High Voltage Laboratory, School
of Electrical and Computer Engineering Faculty of Engineering, Aristotle
University of Thessaloniki, 54124 Thessaloniki Greece; 2008.
[15] J. S. Jorstad. Effect of Barriers in Air Insulated Rod-Plane. Norwegian
University of Science and Technology Department of Electric Power
Engineering; June 2012.
[16] N. L. Allen and M. Boutlendj. Dielectric Breakdown in Nonuniform Field Air
Gaps. Department of Electronic and Electrical Engineering, The University of
Leeds, UK; April 1993.
[17] Paraselli Bheema Sankar. Measurement of Air Breakdown Voltage and Electric
Field using Standard Sphere Gap Method. Department of Electrical Engineering
National Institute of Technology, Rourkela, Rourkela-769008, India; June 2011.
[18] A. Srikant and Shekhar Chandra Pradhan. Simulation of Air Breakdown
Mechanism using different Electrodes. National Institute of Technology,
Rourkela Odisha; 2011.
[19] K. L. Chrzan, H. Schwarz. Effect of Impulse Polarity on the Flashover Voltage of
Polluted Cap and Pin Insulators. H. Hausler, Wroclaw University of
Technology, Institute 1-7, 50-370 Wroclaw, Poland; 2009.
69
[20] Muhammad Saufi Kamarudin. Experimental Investigation of CF3i-CO2 Gas
Mixtures on The Breakdown Characteristics in Uniform and Non-Uniform Field
Cinfigurations. School of Engineering Cardiff University; June 2013.
[21] Su-Youl Woo, Dong-Hoon Jeong, Kyoung-Bo Seo and Jin-Ho Kim. A Study
on Dielectric Strength and Insulation Property of SF6/N2 Mixtures for GIS.
Journal of international Council on Electrical Engineering Vol. 2, No. 1, pp.
104~109, 2012.
[22] Ozcan Kalenderli etal, “Computing the Corona Onset and the Utilization Factor
of Rod-Plane Electrode by using Charge Simulation Method”, Trans. of IEEE,
2001.
[23] I. Cotton. An Introduction to High Voltage Testing. MSc. Lecture Note, The
University of Manchester; 2006
[24] Md Nor Ramdon, HV Generation and Testing 1.0 UTHM Slides High
Voltage Engineering (MEK 10303)
[25] M. Denicolai. Tesla Transformer for Exprimentation and Research. Report
TKK- SJT-52, High Voltage Institute. Helsinki University of Technology; 2001.
[26] Zbigniew Oziewicz. Electric field and magnetic field in a moving reference
system. Universidad Nacional Aut´Onoma De M´Exico; December 2006.
[27] Njatc, Electrical Field Reference Handbook, 25 April 2008.
[28] G.A.G. Bennet, Edward Arnold, Electricity and Modern Physics (2nd Edition),
(UK), 1974,
[29] A. kara, O. Kalenderli, K. Mardikyan. Effect of Dielectric Barriers to the
Electric Field of Rod-Plane Air Gap. Istanbul Technical University, Electrical
and Electronic Engineering Faculty, Istanbul, Turkey; 2006
[30] M. S Kamarudin, A. Haddad and S. J. Macgregor, “Experimental Investigation
of CF3I-CO2 Gas mixtures under Lightning Impulse”, 20th
International
Conference on Gas Discharges and their Application, 6-11 July 2014