Effect of extrusion cooking on the nutritional properties ... · Effect of extrusion cooking on the...
99
ISSN 0355-1180 UNIVERSITY OF HELSINKI Department of Food and Environmental Sciences EKT Series 1632 Effect of extrusion cooking on the nutritional properties of amaranth, quinoa, kañiwa and lupine Lakshminarasimhan Sundarrajan Helsinki 2014
Transcript of Effect of extrusion cooking on the nutritional properties ... · Effect of extrusion cooking on the...
ISSN 0355-1180
UNIVERSITY OF HELSINKI
Department of Food and Environmental Sciences
EKT Series 1632
Effect of extrusion cooking on the nutritional properties of
amaranth, quinoa, kañiwa and lupine
Lakshminarasimhan Sundarrajan
Helsinki 2014
Tiedekunta/Osasto Fakultet/Sektion – Faculty
Faculty of Agriculture and Forestry
Laitos/Institution– Department
Department of Food and Environmental Sciences Tekijä/Författare – Author
Lakshminarasimhan Sundarrajan
Työn nimi / Arbetets titel – Title
Effect of extrusion cooking on the nutritional properties of amaranth, quinoa, kañiwa and lupine Oppiaine /Läroämne – Subject
Food Sciences (Food Bioprocessing)
Työn laji/Arbetets art – Level
M.Sc. Thesis
Aika/Datum – Month and year
January 2014
Sivumäärä/ Sidoantal – Number of pages
98
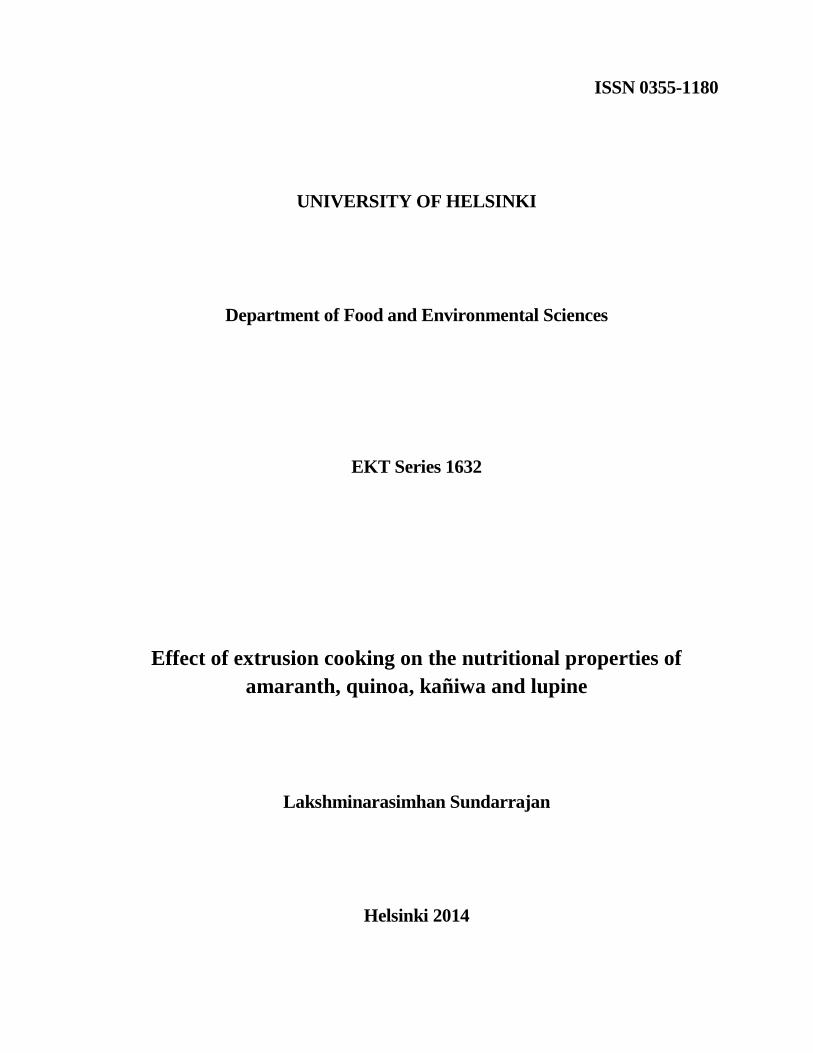
Tiivistelmä/Referat – Abstract
Amaranth, quinoa, kañiwa and lupine are good sources of protein, fat, dietary fibre and bioactive
compounds. The literature review deals with the nutritional properties and the stability of bioactive
compounds and the effect of extrusion cooking on amaranth, quinoa, kañiwa and lupine. The main aim
of this study was to (1) chemically characterize amaranth, quinoa, kañiwa and lupine, and (2) to
determine the effect of extrusion cooking on the nutritional properties and the stability of bioactive
compounds.
Extrudates were processed using twin screw extruder at two different extrusion temperatures (140 and
160 °C) containing two different contents of tested flour mixtures (20 and 50%). The raw materials and
the extrudates were stored at -18 °C and chemically characterized to determine fatty acid composition,
tocopherol composition and total phenolic acid content. Fatty acid composition was determined using
GC while tocopherol composition was detected using HPLC. The total phenolic acid content was
analyzed using Folin-Ciocalteu method.
The protein and dietary fibre content in lupine accounted for 29 and 50 g/100 g d.m., respectively. The
extrudates containing 50% lupine and processed at 140 °C possessed higher content of oleic, linoleic
and linolenic fatty acids. At higher content of tested flours, extrusion cooking at 160 °C resulted in
better retention of unsaturated fatty acids in the extrudates of amaranth, kañiwa and quinoa. Higher
extrusion temperatures resulted in lower retention of tocopherols in all the extrudates. The total phenolic
acid resulted in higher contents in the extrudates of kañiwa when compared to other extrudates. At
higher seed contents of tested flours (%), higher retention of total phenolic acid was achieved during
extrusion cooking at 140 °C in the extrudates of amaranth, quinoa and kañiwa.
This study showed that extrusion conditions could be optimized in order to obtain lesser effects on the
nutritional properties and better retention of bioactive compounds. The research study provides
supportive information for obtaining gluten-free cereal snack products with lower glycemic index.
Avainsanat – Nyckelord – Keywords
Amaranth, quinoa, kañiwa, lupine, extrusion, nutritional properties, bioactive compounds
Säilytyspaikka – Förvaringställe – Where deposited
The Digital Repository of University of Helsinki, Helda
Muita tietoja – Övriga uppgifter – Additional information
EKT Series 1632
PREFACE
The Master’s thesis research was carried out in cooperation with the Food chemistry and Food
technology under the Department of Food and Environmental studies at University of
Helsinki, Finland. The present research study was a part of Jose Martin Ramos Diaz’s PhD
project and the study took approximately a year for its completion (January 2013- 2014). The
research group comprised of PhD. University Lecturer Kirsi Jouppila, PhD University lecturer
Anna-Maija Lampi and M.Sc. Jose Martin Ramos Diaz.
I am highly indebted to my supervisors PhD. University Lecturer Kirsi Jouppila, PhD
University lecturer Anna-Maija Lampi and M.Sc. Jose Martin Ramos Diaz for giving me this
wonderful opportunity to pursue my Master’s thesis research in the field of Food Sciences and
also helping me in arranging financial support during my research study. I really thank PhD
University lecturer Anna-Maija Lampi for creating a lovely environment and offering tireless
help and support during my laboratory work. I would also like to thank PhD. University
Lecturer Seppo Tenitz for guiding me to learn the statistical analysis and helping me
whenever needed.
I gratefully thank the University of Helsinki for giving the opportunity to pursue my Master’s
degree in the field of Food sciences as an International student. I also gratefully thank the staff
of Food chemistry for helping me during the course of laboratory work. I would like to thank
my colleagues and fellow classmates Anish, Maheswor, Suresh, Sriyapathy and Ashok for
continuously offering their support and motivation during the research study.
I am highly indebted to WCC cricket team, friends and my family members for delivering
their constant support and encouragement.
Helsinki, January 2014
Lakshminarasimhan Sundarrajan
TABLE OF CONTENTS
1 INTRODUCTION .................................................................................................................. 5
2 LITERATURE REVIEW........................................................................................................ 7
2.1 General aspects of amaranth, lupine, kañiwa and quinoa ................................................ 7
2.1.1 Origin of amaranth, lupine, kañiwa and quinoa ......................................................... 7
2.1.2 Traditional uses and current utilization of the seeds.................................................. 8
2.2 Nutritional properties ....................................................................................................... 9
2.2.1 Protein and amino acid composition ........................................................................ 11
2.2.2 Total fat and fatty acid composition ........................................................................ 14
2.2.3 Carbohydrates and dietary fiber content .................................................................. 16
2.3 Bioactive components and micronutrients ..................................................................... 18
2.3.1 Phenolic compounds and flavonoids ....................................................................... 19
2.3.2 Vitamins and minerals ............................................................................................. 23
2.4 Antinutrients ................................................................................................................... 27
2.5 Extrusion ........................................................................................................................ 28
2.5.1 Processing parameters affecting extruded snacks .................................................... 29
2.5.2 Physical and chemical changes during extrusion .................................................... 30
2.5.3 Effect of extrusion on the nutritional properties of extruded snacks ....................... 31
2.5.4 Effect of extrusion on the antinutritional properties of extruded snacks ................. 35
2.6 The effect of other processing methods on the nutritional properties of amaranth, quinoa,
kañiwa and lupine ................................................................................................................. 37
3 Experimental study................................................................................................................ 38
3.1 Aims and overview of the study ..................................................................................... 38
3.2 Materials ......................................................................................................................... 40
3.3 Methods .......................................................................................................................... 40
3.3.1 Chemical characterization of raw materials and extrudates of amaranth, quinoa,
lupine and kañiwa ............................................................................................................. 40
3.3.2 Analysis of bioactive compounds of flour samples and extrudate samples of
amaranth, quinoa, lupine and kañiwa ............................................................................... 44
3.3.3 Statistical analysis .................................................................................................... 46
3.4 Results ............................................................................................................................ 47
3.4.1 Chemical composition of amaranth, quinoa, kañiwa, polenta and lupine ............... 47
3.4.2 Estimation of bioactive compounds of flour samples and extrudates ..................... 51
3.4.3 PCA and PLS data analysis of extrudates ................................................................ 57
3.5 Discussion ...................................................................................................................... 64
3.5.1 Chemical composition of raw materials of amaranth, quinoa, kañiwa and lupine .. 64
3.5.2 Effect of extrusion on fatty acid composition of amaranth, quinoa, kañiwa and
lupine ................................................................................................................................ 67
3.5.3 Effect of extrusion on tocopherol content of amaranth, quinoa, kañiwa and lupine 69
3.5.4 Effect of extrusion on total phenolic content of amaranth, quinoa, kañiwa and
lupine ................................................................................................................................ 70
4 Conclusions ........................................................................................................................... 73
References ................................................................................................................................ 75
Appendix .................................................................................................................................. 87
5
1 INTRODUCTION
The Andean environment is an important center for cultivating different crop species such as
barley, potatoes and legumes (Repo-Carrasco et al. 2010a). The extreme tolerance of Andean
crops towards unfavorable conditions has attracted the interest worldwide to cultivate on a
larger scale (Mujica et al. 2001). The Andean seeds are served as a substitute for animal
proteins and are still the major source of proteins with well-balanced composition very similar
to that of casein (Repo-Carrasco et al. 2003). Quinoa, kañiwa and amaranth are considered as
Andean pseudocereals while the seeds of lupine are grouped under the class of Andean
legumes (Sujak et al. 2006; Peñarrieta et al. 2008; Repo-Carrasco et al. 2010a).
The nutritional quality of the Andean crops varies widely depending on the species. The
Andean crops quinoa, kañiwa, amaranth and lupine are suited for people suffering from celiac
disease (disease due to gluten intolerance) since these seeds are gluten-free (Peñarrieta et al.
2008). The protein and fat content of kañiwa is slightly higher when compared to quinoa and
amaranth (Repo-Carrasco et al. 1992). Quinoa and kañiwa was found to be rich in
carbohydrates and dietary fiber when compared to the seeds of amaranth. Likewise tarwi (L.
mutabilis) and L. angustifolius are also rich sources of protein, dietary fiber and fat (Gross et
al. 1988; Sujak et al. 2006). In fact, the high content of essential amino acids present in
amaranth makes it an interesting alternative to meat products (Pisarikova et al. 2005). The
seeds of amaranth, quinoa, kañiwa and lupine also contained higher content of lysine, a
limiting amino acid amongst the cereals (Repo-Carrasco et al. 1992; Lqari et al. 2002; Stikic
et al. 2012).
Quinoa, amaranth, kañiwa and lupine are reported to contain high content of micronutrients
and bioactive compounds (Calhoun et al. 1960; Gamel et al. 2006). The seeds of quinoa,
kañiwa and amaranth are considered rich sources of α-tocopherols, phenolic compounds that
plays an important role as an antioxidant and are also beneficial in reducing the risk of
cardiovascular and cancer diseases (Liu et al. 1999; Geleijnse et al. 2002; Brigelius and Flohé
2006; Repo-Carrasco et al. 2009b). The antinutrients that are present in the seeds of quinoa,
kañiwa, amaranth and lupine are saponins, phytic acid and toxic alkaloids that affect the
nutritional properties of the seeds by lowering starch digestibility, protein and micronutrient
6
absorption (Repo-Carrasco et al. 2003; Valencia 2004; Martínez-Villaluenga et al. 2006). The
presence of phytates in quinoa seeds was found to decrease the bioavailability of minerals
such as iron, magnesium and zinc (Ruales and Nair 1993).
Due to desirable nutrient composition of amaranth, quinoa, kañiwa and lupine they can be
processed by implementing low-cost food processing technique such as extrusion (Brennan et
al. 2011). Extrusion cooking is a high temperature short residence time process which can be
used to process a wide variety of raw materials (Singh et al. 2007; Yagci and Gögus 2009).
Extrusion causes several changes such as starch gelatinization, protein denaturation, alteration
in the content of dietary fiber, bioactive compounds and vitamins, and elimination of
antinutrients factors which modifies the nutritional and physical properties of the extrudates
(Cheftel et al. 1989; Camire et al. 1990; Guy 2001b).
There are several studies on the effect of extrusion on the nutritional properties and the
stability of bioactive compounds. Extrusion processing increased the retention of total lipids
in the raw materials containing lower fat content (< 5%) (Nierle et al. 1980). Also due to high
temperature extrusion processing, the process of lipid oxidation increased in the case of the
corn extrudates (Camire et al. 1982; Zadernowski et al. 1997). With respect to the bioactive
compounds, the retention of heat-sensitive vitamins namely α-tocopherol, vitamin B1 and B2
were better due to milder extrusion temperatures and short residence time during the extrusion
processing (Killeit and Weidmann 1984; Grela et al. 1999). High temperature extrusion
cooking increased the content of total phenolics by releasing the bound phenolics from the
cell matrix (Yagci and Gögus 2009). Therefore, the study of extrusion on nutritional
properties and the stability of bioactive compounds can provide valuable data for the
production of gluten-free snacks of high nutritional value.
The literature review discussed on the nutritional properties and the bioactive compounds of
the flours of amaranth, quinoa, kañiwa and lupine. The effect of extrusion on the nutritional
properties and the stability of bioactive compounds were also studied in literature review. The
objective of this study was to determine the effect of extrusion cooking on the nutritional
properties and the stability of bioactive compounds of extrudates containing quinoa, kañiwa,
amaranth and lupine.
7
2 LITERATURE REVIEW
2.1 General aspects of amaranth, lupine, kañiwa and quinoa
The term ‘Andean crops’ is generally referred to as cereals, pseudocereals and legumes
cultivated in Andes and considered as staple food (Mujica et al. 1994). Due to their high
nutritional quality, the cultivation of Andean grains has increased not only in the Andean
regions of Ecuador and Bolivia but also in other parts of the world such as Australia, New-
Zealand and Finland (Jacobsen et al. 2011). The seeds of quinoa, lupine, amaranth and kañiwa
can be milled into flour and can be directly used in a similar way to cereal seeds either as a
direct addition for extruded snacks or as an ingredient in weaning food mixtures. Quinoa,
kañiwa, and amaranth are not grouped under the same family as cereals (Gramineae).
However, since these seeds are used for similar applications as cereals they are termed
pseudocereals (Repo-Carrasco et al. 2010a). The seeds of lupine are grouped under the
legume family, Fabaceae.
2.1.1 Origin of amaranth, lupine, kañiwa and quinoa
Quinoa also known as quinua (Chenopodium quinoa Willd) is considered as staple food in the
Andes region. During the first phase of the 20th
century, cultivation of quinoa started to
decline in the Andes due to introduction of intensive agriculture while the cultivation of wheat
and barley increased considerably. Chenopodium quinoa, a tetraploid species said to be called
as ‘mother seed’ by the Incas, is an ancient civilization from South America. Quinoa is annual
herbaceous, semi-vigorous root in the Andean region (Franc and Martina 2006). Quinoa has
also been selected as one of the crops to offer food security in the 21st century by Food
Agricultural Organization (FAO) (Jacobsen et al. 2003).
Amaranth is an ancient crop cultivated for the past 5000-7000 years and is considered as
staple food for Aztecs (now south-central Mexico). Domestication of amaranth originated
from the regions of Columbia, Argentina and Peru (Petterson 2004a; Repo-Carrasco et al.
2009b). In recent times, amaranth plant has been monitored continuously due to its great
8
tolerance; nutritional quality and possessing good biomass yield. The amaranth plant can be
consumed both as vegetable and the seeds like the cereal (Saunders and Becker 1984).
Kañiwa (Chenopodium pallidicaule) has always been considered as an important crop to the
people in the Andean region and are cultivated mostly in the rural areas of Peru and Bolivia
(Repo-Carrasco et al. 2010b). Like quinoa and amaranth, kañiwa can adapt well to extreme
environmental conditions. Due to its desirable nutritional composition, it can be substituted
for the animal protein in the normal diet (Repo-Carrasco et al. 2009a).
Lupine, a leguminous seed originated during the pre-Incas civilization more than 3500-4000
years ago and is being increasingly used as human food due to its nutritional and functional
properties (Duranti et al. 2008). L angustifolius are the narrow leafed lupines which are
considered as an alternative rich source of protein for the poultry feed in the Pacific regions
particularly in Australia (Nalle et al. 2011). Torres et al. (2007) reported that seeds of lupine
varieties (L.angustifolius, L.albus) are considered as rich source of protein content in human
nutritional diet which can be replaced for foods of high protein soy diet. Sujak et al. (2006)
also reported that the L angustifolius has higher amounts of lysine than wheat seed. Andean
lupine called tarwi (L. mutabilis) was a common food during Pre-Hispanic times and is still
consumed in some regions of South America
2.1.2 Traditional uses and current utilization of the seeds
The Andean seeds are used traditionally in many different ways. Kañiwa is consumed by
toasting and milling as a meal called as kañiwako (Repo-Carrasco et al. 2003). Kañiwa is also
used by mixing the flour with wheat in bread and also used as an ingredient in beverages
(Peñarrieta et al. 2008). Toasted amaranth is used as a puffed product which is used to make a
type of snack bar (turrone) and also used as an ingredient in preparing baby foods to make
porridge (Repo-Carrasco et al. 2009b). With respect to quinoa, the traditional uses comprises
of bread made of quinoa flour (kispiño), quinoa porridge (katawi lawa) and meal containing
toasted quinoa and meat (sankhu) (Macedo 2003). Lupine is also toasted or boiled to make a
snack (kirku) and the lupine seeds are commonly used as to prepare edible refined oil. The
9
application of the Andean seeds is gradually increasing with its introduction as an ingredient
in the extruded products. Quinoa, kañiwa, amaranth and lupine are regarded as gluten-free
sources which can help in providing health benefits such as reducing the cholesterol level in
blood and improving digestion (Repo-Carrasco et al. 2003).
2.2 Nutritional properties
Quinoa, kañiwa, amaranth and lupine have a distinct chemical composition compared to that
of cereals like wheat, rye and corn. However, the Andean crops can also be used as suitable
substitutes for cereals in providing highly nutritious product (Repo-Carrasco et al. 2010a).
The nutritional quality of a product depends on the quality and quantity of the nutrients
present (Repo-Carrasco et al. 1992). The Andean crops quinoa, kañiwa and amaranth are
reported to have high content of protein, dietary fibre and specific bioactive compounds such
as tocopherols and phenolics. The distribution of chemical constituents in the seed varies
according to species and the cultivars. Nutritional composition of the quinoa, amaranth,
kañiwa and lupine are presented in Table 1. The protein content of the lupine species was
higher when compared to cereals as well as pseudocereals, whereas the protein content of
amaranth, kañiwa and quinoa were comparatively similar to wheat, corn, oats and rye. The
seeds of amaranth and lupine possessed higher fat content when compared to kañiwa, quinoa
and most cereals (Lqari et al. 2002; Repo-Carrasco et al. 2009b).
Amaranth, quinoa and kañiwa possessed lower proportion of carbohydrates when compared
to cereals like oats, corn and wheat whereas there were similarities in the content of
carbohydrates within the seeds of amaranth, quinoa, kañiwa. Dietary fiber content was higher
in the species of L. angustifolius when compared to cereals and pseudocereals (Lqari et al.
2002). There was a three-fold increase in the content of dietary fiber in the results determined
by Alvarez et al. 2010 when compared to results obtained by Repo-Carrasco et al (2009b,
2010b). Repo-Carrasco et al (2010a) reported that the high content of dietary fiber was related
to the presence of perigonium layer, outer covering of the seed which was removed in the
study performed by Repo-Carrasco et al (2009b; 2010b) explaining the reason for lower
content of dietary fiber in the seeds of amaranth and quinoa.
10
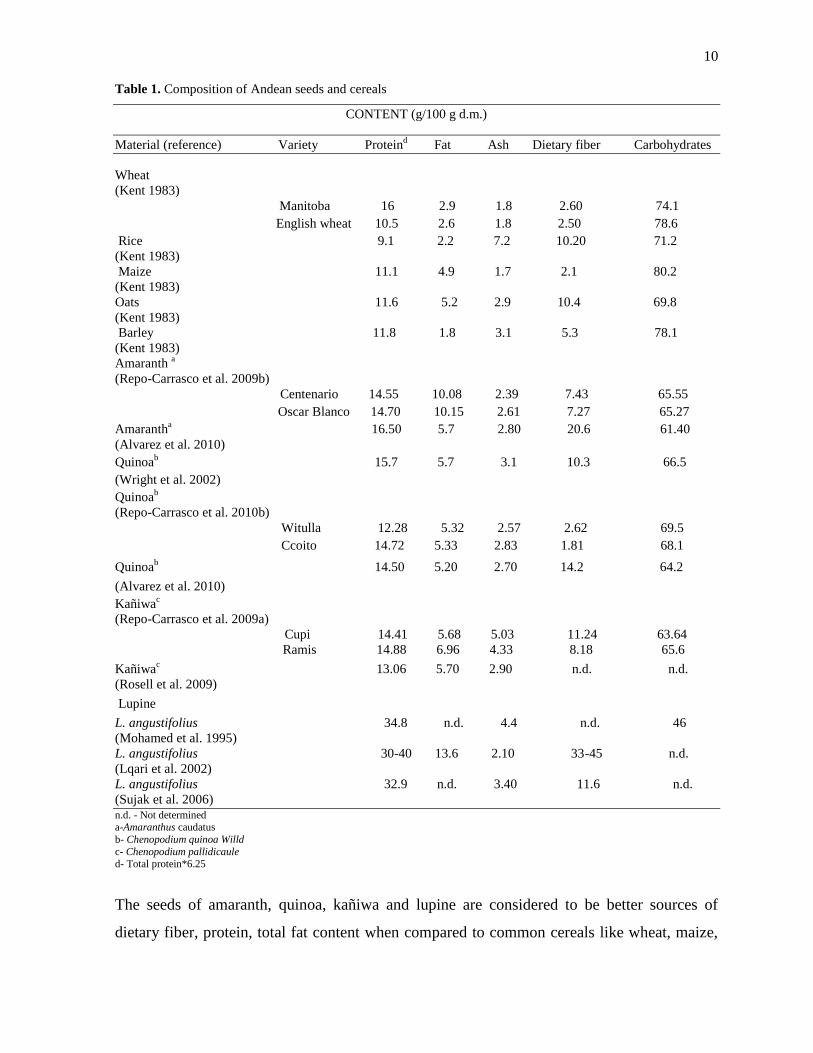
Table 1. Composition of Andean seeds and cereals
CONTENT (g/100 g d.m.)
Material (reference) Variety Proteind Fat Ash Dietary fiber Carbohydrates
Wheat
(Kent 1983)
Manitoba 16 2.9 1.8 2.60 74.1
English wheat 10.5 2.6 1.8 2.50 78.6
Rice
9.1 2.2 7.2 10.20 71.2
(Kent 1983)
Maize 11.1 4.9 1.7 2.1 80.2
(Kent 1983)
Oats
11.6 5.2 2.9 10.4 69.8
(Kent 1983)
Barley
11.8 1.8 3.1 5.3 78.1
(Kent 1983)
Amaranth a
(Repo-Carrasco et al. 2009b)
Centenario
14.55 10.08 2.39 7.43 65.55
Oscar Blanco
14.70 10.15 2.61 7.27
65.27
Amarantha 16.50 5.7 2.80 20.6 61.40
(Alvarez et al. 2010)
Quinoab 15.7 5.7 3.1 10.3 66.5
(Wright et al. 2002)
Quinoab
(Repo-Carrasco et al. 2010b)
Witulla 12.28 5.32 2.57 2.62 69.5
Ccoito 14.72 5.33 2.83 1.81 68.1
Quinoab 14.50 5.20 2.70 14.2 64.2
(Alvarez et al. 2010)
Kañiwac
(Repo-Carrasco et al. 2009a)
Cupi 14.41 5.68 5.03 11.24 63.64
Ramis 14.88 6.96 4.33 8.18 65.6
Kañiwac 13.06 5.70 2.90 n.d. n.d.
(Rosell et al. 2009)
Lupine
L. angustifolius 34.8 n.d. 4.4 n.d. 46
(Mohamed et al. 1995)
L. angustifolius 30-40 13.6 2.10 33-45 n.d.
(Lqari et al. 2002)
L. angustifolius 32.9 n.d. 3.40 11.6 n.d.
(Sujak et al. 2006) n.d. - Not determined a-Amaranthus caudatus
b- Chenopodium quinoa Willd
c- Chenopodium pallidicaule d- Total protein*6.25
The seeds of amaranth, quinoa, kañiwa and lupine are considered to be better sources of
dietary fiber, protein, total fat content when compared to common cereals like wheat, maize,
11
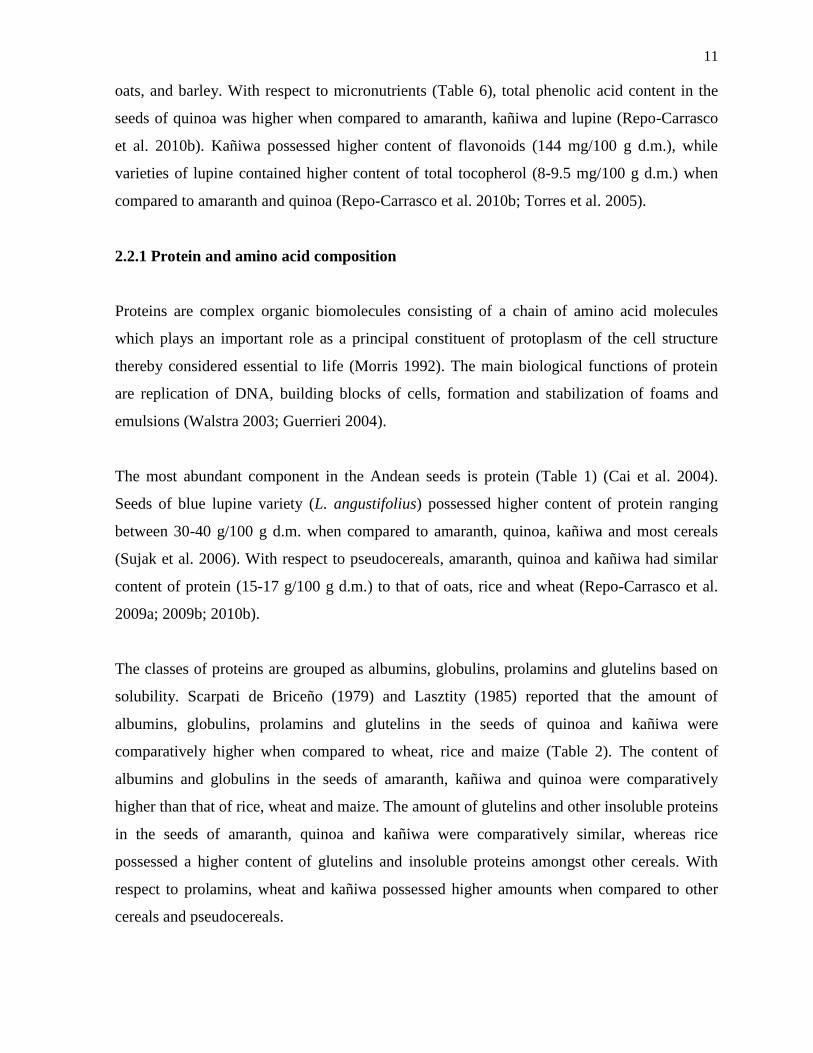
oats, and barley. With respect to micronutrients (Table 6), total phenolic acid content in the
seeds of quinoa was higher when compared to amaranth, kañiwa and lupine (Repo-Carrasco
et al. 2010b). Kañiwa possessed higher content of flavonoids (144 mg/100 g d.m.), while
varieties of lupine contained higher content of total tocopherol (8-9.5 mg/100 g d.m.) when
compared to amaranth and quinoa (Repo-Carrasco et al. 2010b; Torres et al. 2005).
2.2.1 Protein and amino acid composition
Proteins are complex organic biomolecules consisting of a chain of amino acid molecules
which plays an important role as a principal constituent of protoplasm of the cell structure
thereby considered essential to life (Morris 1992). The main biological functions of protein
are replication of DNA, building blocks of cells, formation and stabilization of foams and
emulsions (Walstra 2003; Guerrieri 2004).
The most abundant component in the Andean seeds is protein (Table 1) (Cai et al. 2004).
Seeds of blue lupine variety (L. angustifolius) possessed higher content of protein ranging
between 30-40 g/100 g d.m. when compared to amaranth, quinoa, kañiwa and most cereals
(Sujak et al. 2006). With respect to pseudocereals, amaranth, quinoa and kañiwa had similar
content of protein (15-17 g/100 g d.m.) to that of oats, rice and wheat (Repo-Carrasco et al.
2009a; 2009b; 2010b).
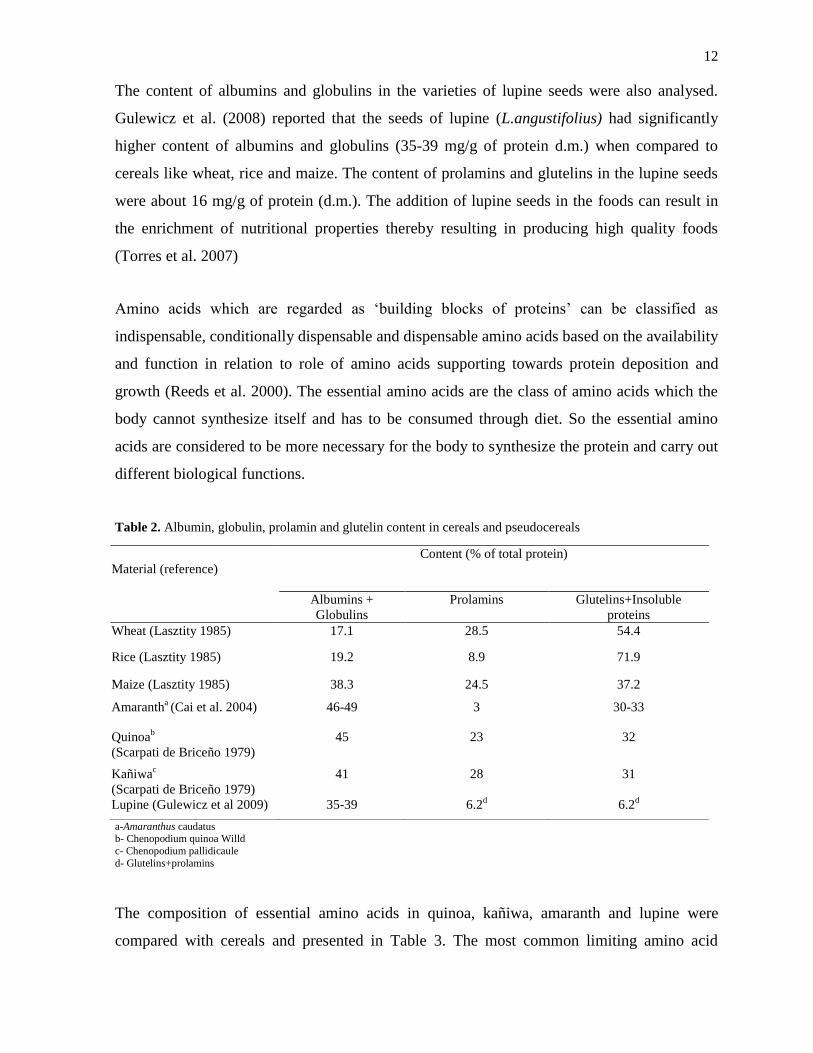
The classes of proteins are grouped as albumins, globulins, prolamins and glutelins based on
solubility. Scarpati de Briceño (1979) and Lasztity (1985) reported that the amount of
albumins, globulins, prolamins and glutelins in the seeds of quinoa and kañiwa were
comparatively higher when compared to wheat, rice and maize (Table 2). The content of
albumins and globulins in the seeds of amaranth, kañiwa and quinoa were comparatively
higher than that of rice, wheat and maize. The amount of glutelins and other insoluble proteins
in the seeds of amaranth, quinoa and kañiwa were comparatively similar, whereas rice
possessed a higher content of glutelins and insoluble proteins amongst other cereals. With
respect to prolamins, wheat and kañiwa possessed higher amounts when compared to other
cereals and pseudocereals.
12
The content of albumins and globulins in the varieties of lupine seeds were also analysed.
Gulewicz et al. (2008) reported that the seeds of lupine (L.angustifolius) had significantly
higher content of albumins and globulins (35-39 mg/g of protein d.m.) when compared to
cereals like wheat, rice and maize. The content of prolamins and glutelins in the lupine seeds
were about 16 mg/g of protein (d.m.). The addition of lupine seeds in the foods can result in
the enrichment of nutritional properties thereby resulting in producing high quality foods
(Torres et al. 2007)
Amino acids which are regarded as ‘building blocks of proteins’ can be classified as
indispensable, conditionally dispensable and dispensable amino acids based on the availability
and function in relation to role of amino acids supporting towards protein deposition and
growth (Reeds et al. 2000). The essential amino acids are the class of amino acids which the
body cannot synthesize itself and has to be consumed through diet. So the essential amino
acids are considered to be more necessary for the body to synthesize the protein and carry out
different biological functions.
Table 2. Albumin, globulin, prolamin and glutelin content in cereals and pseudocereals
a-Amaranthus caudatus b- Chenopodium quinoa Willd
c- Chenopodium pallidicaule
d- Glutelins+prolamins
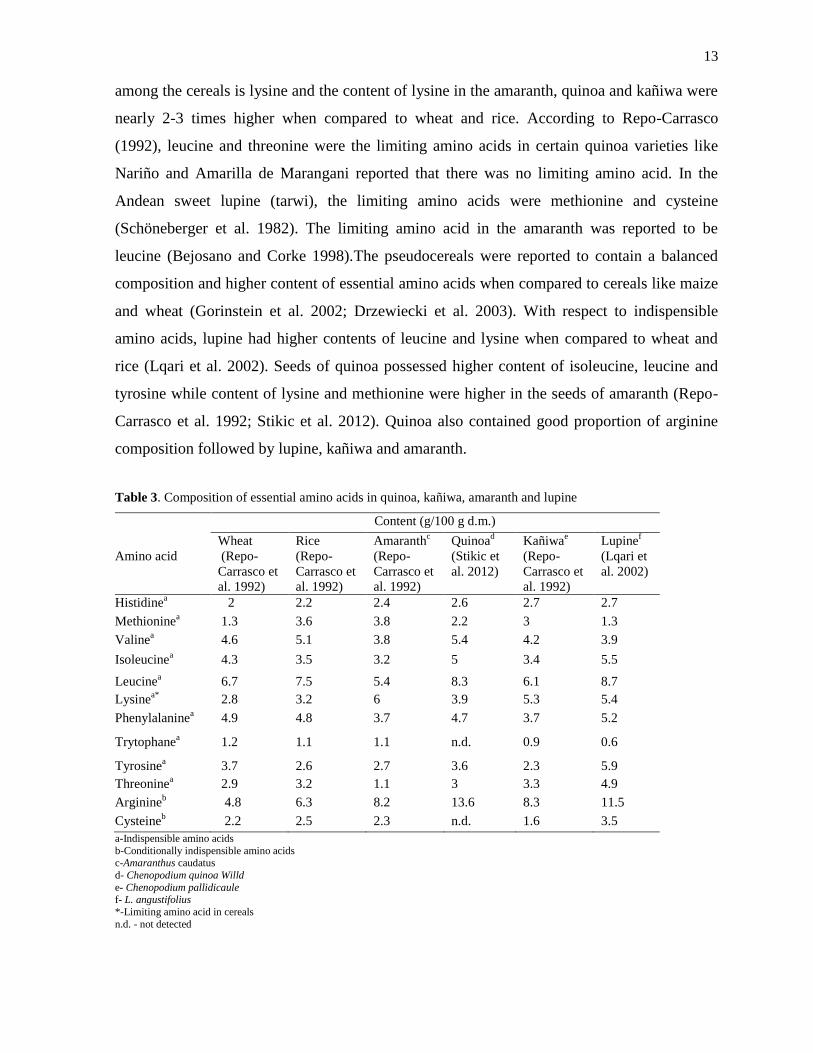
The composition of essential amino acids in quinoa, kañiwa, amaranth and lupine were
compared with cereals and presented in Table 3. The most common limiting amino acid
Material (reference)
Content (% of total protein)
Albumins +
Globulins
Prolamins Glutelins+Insoluble
proteins
Wheat (Lasztity 1985) 17.1 28.5 54.4
Rice (Lasztity 1985) 19.2 8.9 71.9
Maize (Lasztity 1985) 38.3 24.5 37.2
Amarantha (Cai et al. 2004) 46-49 3 30-33
Quinoab
(Scarpati de Briceño 1979)
45 23 32
Kañiwac
(Scarpati de Briceño 1979)
41 28 31
Lupine (Gulewicz et al 2009) 35-39 6.2d
6.2d
13
among the cereals is lysine and the content of lysine in the amaranth, quinoa and kañiwa were
nearly 2-3 times higher when compared to wheat and rice. According to Repo-Carrasco
(1992), leucine and threonine were the limiting amino acids in certain quinoa varieties like
Nariño and Amarilla de Marangani reported that there was no limiting amino acid. In the
Andean sweet lupine (tarwi), the limiting amino acids were methionine and cysteine
(Schöneberger et al. 1982). The limiting amino acid in the amaranth was reported to be
leucine (Bejosano and Corke 1998).The pseudocereals were reported to contain a balanced
composition and higher content of essential amino acids when compared to cereals like maize
and wheat (Gorinstein et al. 2002; Drzewiecki et al. 2003). With respect to indispensible
amino acids, lupine had higher contents of leucine and lysine when compared to wheat and
rice (Lqari et al. 2002). Seeds of quinoa possessed higher content of isoleucine, leucine and
tyrosine while content of lysine and methionine were higher in the seeds of amaranth (Repo-
Carrasco et al. 1992; Stikic et al. 2012). Quinoa also contained good proportion of arginine
composition followed by lupine, kañiwa and amaranth.
Table 3. Composition of essential amino acids in quinoa, kañiwa, amaranth and lupine
Content (g/100 g d.m.)
Amino acid
Wheat
(Repo-
Carrasco et
al. 1992)
Rice
(Repo-
Carrasco et
al. 1992)
Amaranthc
(Repo-
Carrasco et
al. 1992)
Quinoad
(Stikic et
al. 2012)
Kañiwae
(Repo-
Carrasco et
al. 1992)
Lupinef
(Lqari et
al. 2002)
Histidinea 2 2.2 2.4 2.6 2.7 2.7
Methioninea 1.3 3.6 3.8 2.2 3 1.3
Valinea 4.6 5.1 3.8 5.4 4.2 3.9
Isoleucinea 4.3 3.5 3.2 5 3.4 5.5
Leucinea 6.7 7.5 5.4 8.3 6.1 8.7
Lysinea*
2.8 3.2 6 3.9 5.3 5.4
Phenylalaninea 4.9 4.8 3.7 4.7 3.7 5.2
Trytophanea 1.2 1.1 1.1 n.d. 0.9 0.6
Tyrosinea 3.7 2.6 2.7 3.6 2.3 5.9
Threoninea 2.9 3.2 1.1 3 3.3 4.9
Arginineb
4.8 6.3 8.2 13.6 8.3 11.5
Cysteineb 2.2 2.5 2.3 n.d. 1.6 3.5
a-Indispensible amino acids
b-Conditionally indispensible amino acids c-Amaranthus caudatus
d- Chenopodium quinoa Willd
e- Chenopodium pallidicaule f- L. angustifolius
*-Limiting amino acid in cereals
n.d. - not detected
14
2.2.2 Total fat and fatty acid composition
Amaranth, quinoa, kañiwa and lupine are considered to possess higher content of total fat
when compared to cereals like wheat, rice, oats and maize (Table 1). Lqari et al. (2002)
reported that the content of fat in the seeds of lupine was 14 g/100 g d.m. respectively.
Amongst the pseudocereals, varieties of amaranth (Centenario and Oscar Blanco) contained
higher contents of fat while kañiwa and quinoa contained similar fat content in the range
between 5-6 g/100 g d.m. (Repo-Carrasco et al. 2009a; 2010b).
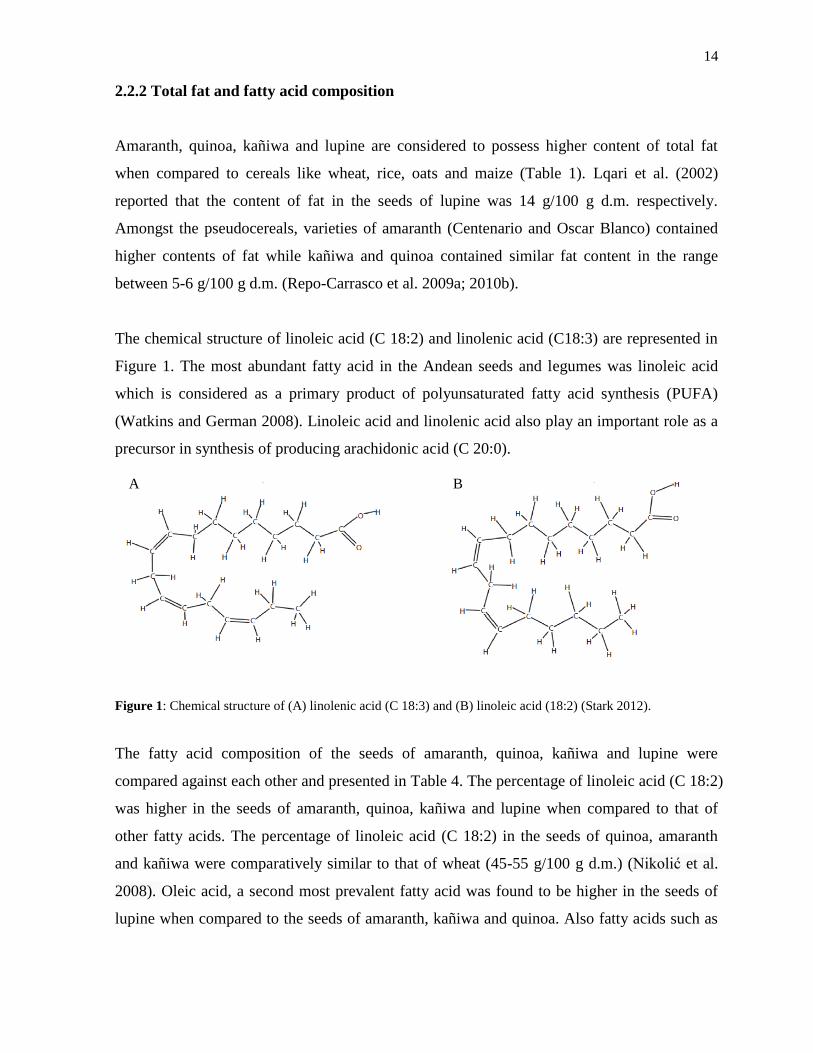
The chemical structure of linoleic acid (C 18:2) and linolenic acid (C18:3) are represented in
Figure 1. The most abundant fatty acid in the Andean seeds and legumes was linoleic acid
which is considered as a primary product of polyunsaturated fatty acid synthesis (PUFA)
(Watkins and German 2008). Linoleic acid and linolenic acid also play an important role as a
precursor in synthesis of producing arachidonic acid (C 20:0).
Figure 1: Chemical structure of (A) linolenic acid (C 18:3) and (B) linoleic acid (18:2) (Stark 2012).
The fatty acid composition of the seeds of amaranth, quinoa, kañiwa and lupine were
compared against each other and presented in Table 4. The percentage of linoleic acid (C 18:2)
was higher in the seeds of amaranth, quinoa, kañiwa and lupine when compared to that of
other fatty acids. The percentage of linoleic acid (C 18:2) in the seeds of quinoa, amaranth
and kañiwa were comparatively similar to that of wheat (45-55 g/100 g d.m.) (Nikolić et al.
2008). Oleic acid, a second most prevalent fatty acid was found to be higher in the seeds of
lupine when compared to the seeds of amaranth, kañiwa and quinoa. Also fatty acids such as
A B
15
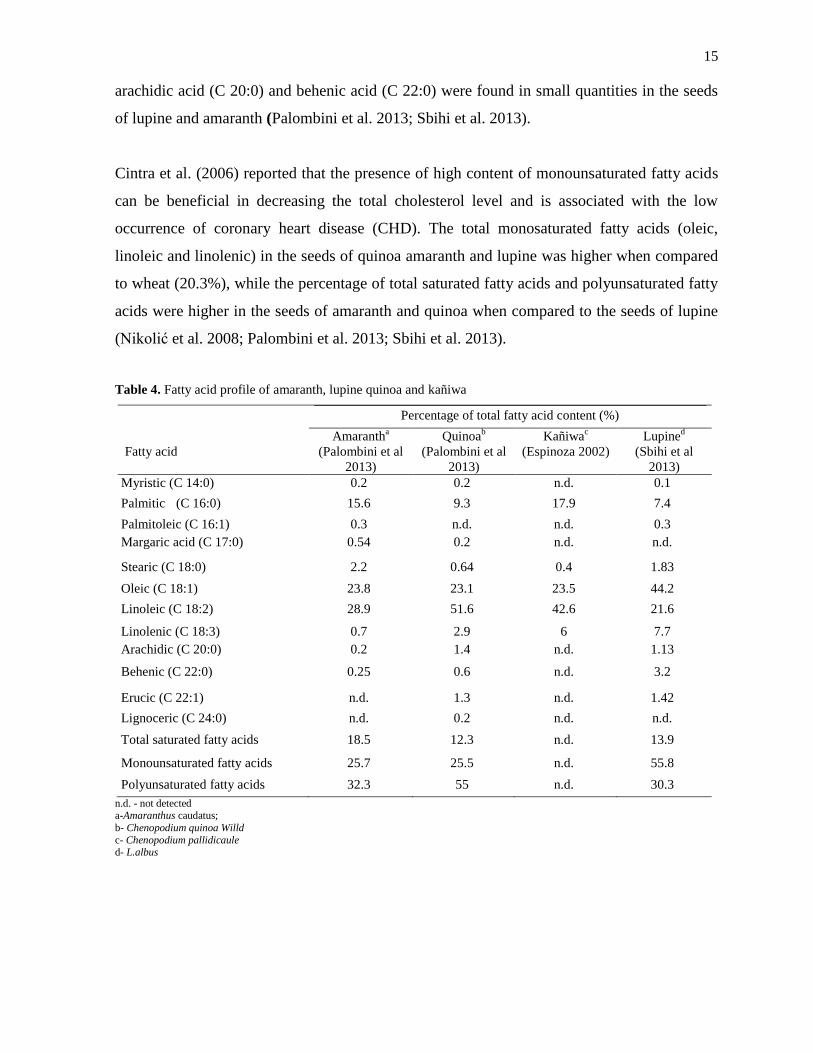
arachidic acid (C 20:0) and behenic acid (C 22:0) were found in small quantities in the seeds
of lupine and amaranth (Palombini et al. 2013; Sbihi et al. 2013).
Cintra et al. (2006) reported that the presence of high content of monounsaturated fatty acids
can be beneficial in decreasing the total cholesterol level and is associated with the low
occurrence of coronary heart disease (CHD). The total monosaturated fatty acids (oleic,
linoleic and linolenic) in the seeds of quinoa amaranth and lupine was higher when compared
to wheat (20.3%), while the percentage of total saturated fatty acids and polyunsaturated fatty
acids were higher in the seeds of amaranth and quinoa when compared to the seeds of lupine
(Nikolić et al. 2008; Palombini et al. 2013; Sbihi et al. 2013).
Table 4. Fatty acid profile of amaranth, lupine quinoa and kañiwa
Percentage of total fatty acid content (%)
Fatty acid
Amarantha
(Palombini et al
2013)
Quinoab
(Palombini et al
2013)
Kañiwac
(Espinoza 2002)
Lupined
(Sbihi et al
2013)
Myristic (C 14:0) 0.2 0.2 n.d. 0.1
Palmitic (C 16:0) 15.6 9.3 17.9 7.4
Palmitoleic (C 16:1) 0.3 n.d. n.d. 0.3
Margaric acid (C 17:0) 0.54 0.2 n.d. n.d.
Stearic (C 18:0) 2.2 0.64 0.4 1.83
Oleic (C 18:1) 23.8 23.1 23.5 44.2
Linoleic (C 18:2) 28.9 51.6 42.6 21.6
Linolenic (C 18:3) 0.7 2.9 6 7.7
Arachidic (C 20:0) 0.2 1.4 n.d. 1.13
Behenic (C 22:0) 0.25 0.6 n.d. 3.2
Erucic (C 22:1) n.d. 1.3 n.d. 1.42
Lignoceric (C 24:0) n.d. 0.2 n.d. n.d.
Total saturated fatty acids 18.5 12.3 n.d. 13.9
Monounsaturated fatty acids 25.7 25.5 n.d. 55.8
Polyunsaturated fatty acids 32.3 55 n.d. 30.3
n.d. - not detected a-Amaranthus caudatus;
b- Chenopodium quinoa Willd
c- Chenopodium pallidicaule d- L.albus
16
2.2.3 Carbohydrates and dietary fiber content
Lupine, quinoa and kañiwa are considered to be rich sources of dietary fiber which are
generally above 10%, but are not as good sources of carbohydrates when compared to the
cereals like wheat, rice, maize etc (Table 1). The carbohydrate content was comparatively
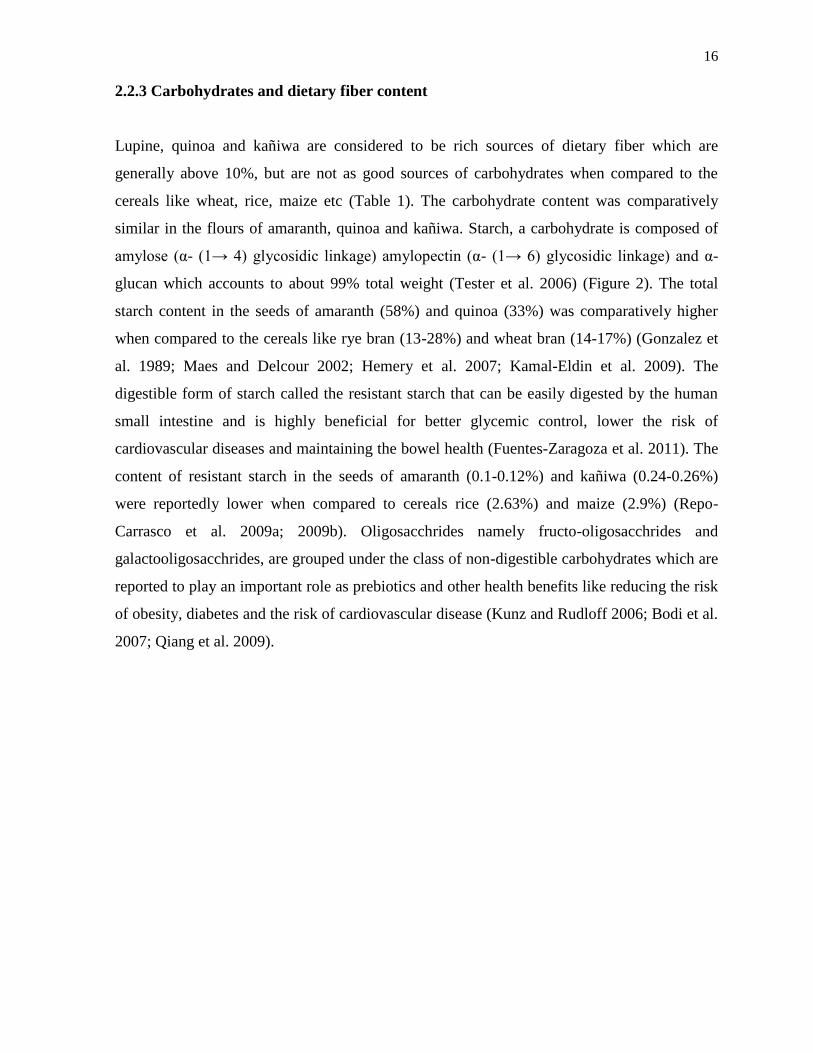
similar in the flours of amaranth, quinoa and kañiwa. Starch, a carbohydrate is composed of
amylose (α- (1→ 4) glycosidic linkage) amylopectin (α- (1→ 6) glycosidic linkage) and α-
glucan which accounts to about 99% total weight (Tester et al. 2006) (Figure 2). The total
starch content in the seeds of amaranth (58%) and quinoa (33%) was comparatively higher
when compared to the cereals like rye bran (13-28%) and wheat bran (14-17%) (Gonzalez et
al. 1989; Maes and Delcour 2002; Hemery et al. 2007; Kamal-Eldin et al. 2009). The
digestible form of starch called the resistant starch that can be easily digested by the human
small intestine and is highly beneficial for better glycemic control, lower the risk of
cardiovascular diseases and maintaining the bowel health (Fuentes-Zaragoza et al. 2011). The
content of resistant starch in the seeds of amaranth (0.1-0.12%) and kañiwa (0.24-0.26%)
were reportedly lower when compared to cereals rice (2.63%) and maize (2.9%) (Repo-
Carrasco et al. 2009a; 2009b). Oligosacchrides namely fructo-oligosacchrides and
galactooligosacchrides, are grouped under the class of non-digestible carbohydrates which are
reported to play an important role as prebiotics and other health benefits like reducing the risk
of obesity, diabetes and the risk of cardiovascular disease (Kunz and Rudloff 2006; Bodi et al.
2007; Qiang et al. 2009).
17
Figure 2. Structure of amylase and amylopectin (Tester and Karkalas 2002)
According to AACC 2001, “Dietary fibre is an edible part of plant or analogous carbohydrates
that are resistant to digestion and absorption in the human small intestine with complete or
partial fermentation in the large intestine. Dietary fibre includes polysaccharides,
oligosaccharides, lignin and associated plant substances”. The soluble dietary fiber (eg. pectin)
are class of carbohydrates which are absorbed by the small intestine whereas the insoluble
dietary are the carbohydrates (eg. hemicellulose) which cannot be absorbed and less
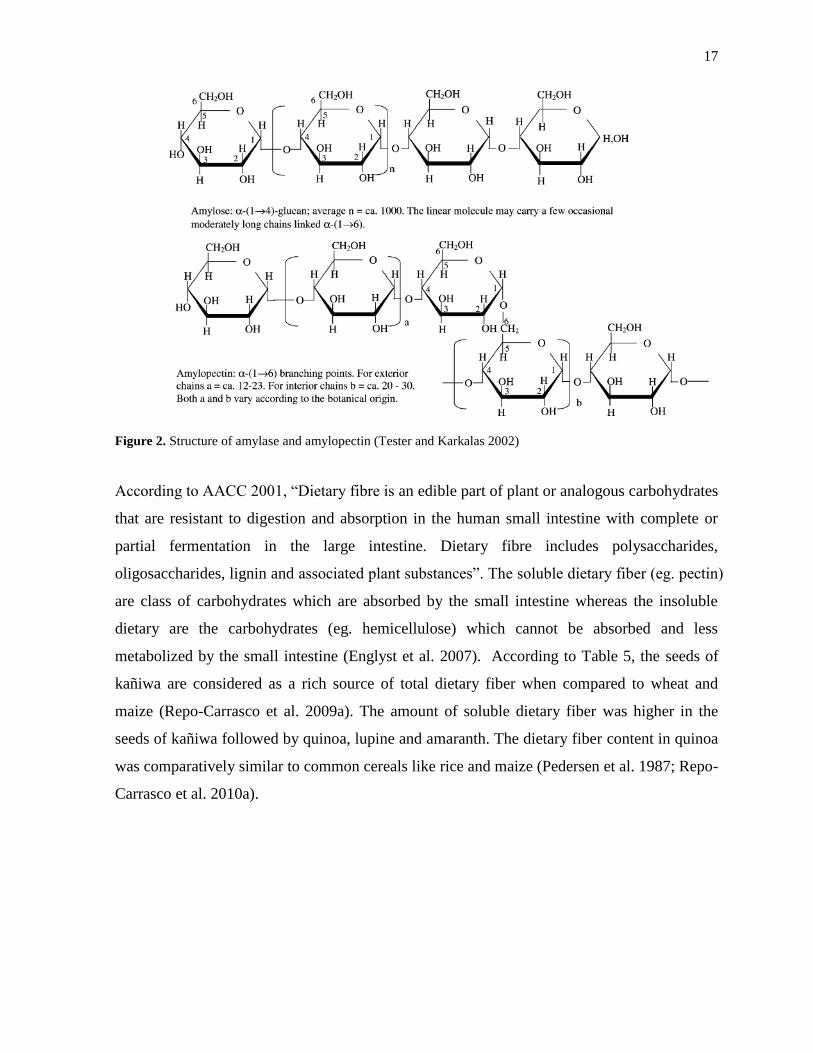
metabolized by the small intestine (Englyst et al. 2007). According to Table 5, the seeds of
kañiwa are considered as a rich source of total dietary fiber when compared to wheat and
maize (Repo-Carrasco et al. 2009a). The amount of soluble dietary fiber was higher in the
seeds of kañiwa followed by quinoa, lupine and amaranth. The dietary fiber content in quinoa
was comparatively similar to common cereals like rice and maize (Pedersen et al. 1987; Repo-
Carrasco et al. 2010a).
18
Table 5. Dietary fiber content in the seeds of quinoa, kañiwa, amaranth and lupine
Material (reference)
Content (g/kg d.m.)
Total dietary fiber Insoluble dietary fiber Soluble dietary fiber
Wheat (Gélinas and
McKinnon 2013)
147 107.2 40
Maize (Honig and
Rackis 1979)
96.8 93.7 3.1
Amarantha (Repo-
Carrasco et al. 2010a)
58 54 4.5
Quinoab (Repo-
Carrasco et al. 2010a)
88.7 78.5 10.2
Kañiwac (Repo-
Carrasco et al. 2010a)
125.6 106.4 19.2
Kañiwace
(Repo-
Carrasco et al. 2009a)
252.4 22.7 29.8
Kañiwacf
(Repo-
Carrasco et al. 2009a)
259.5 231.6 27.9
Lupined (Martins
2005)
84 83 1
n.d. - not detected
a-Amaranthus caudatus
b- Chenopodium quinoa Willd c- Chenopodium pallidicaule
d- L. angustifolius
e- Cupi variety of Kañiwa
f- Ramis variety of Kañiwa
2.3 Bioactive components and micronutrients
Bioactive compounds are secondary metabolites that are present abundantly in plants and
plant foods possessing biological activity (Ho et al. 2007). Some class of bioactive
compounds (eg. polyphenols) play an important role as an antioxidant and anti inflammatory
effects in the human diet (Ferrazzano et al. 2011). Recent studies have suggested that
bioactive compounds, especially polyphenols help in reducing the risk of neurodegenerative
and diabetic diseases and regulation of apoptosis in tumor cells (Block et al. 1992; Scalbert et
al. 2005; Ferrazzano et al. 2011). Polyphenols, a class of bioactive compounds in the food,
attributes to the bitterness, color and flavor of the products (Shahidi and Naczk 1995; Han et
al. 2007). Moghadasian and Frohlich (1999) reported that phytosterols are an important class
of bioactive compounds that help in lowering the cholesterol absorption in the human
intestine. In addition, phytosterols have also shown antiviral and anti-tumor properties (Li and
Zhang 2001). The seeds of amaranth, quinoa and kañiwa possessed higher content of
19
bioactive compounds (phenolic compounds and flavonoids) when compared to legumes
(lupine) (Repo-Carrasco et al. 2010b; Siger et al. 2012). Andean pseudocereals and legumes
also possessed desirable composition of micronutrients (vitamins and minerals) when
compared to wheat, oats and rice (Kent 1983; Collazos et al. 1993).
2.3.1 Phenolic compounds and flavonoids
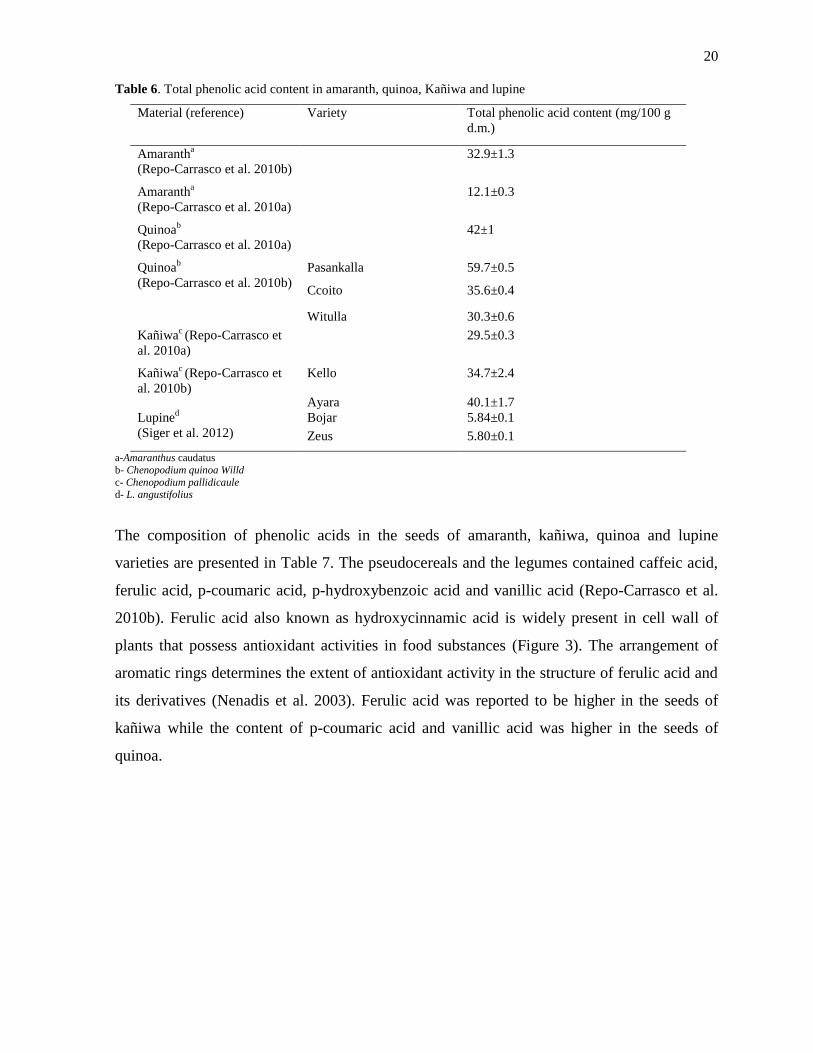
Phenolic compounds are classified under the group of bioactive compounds possessing strong
antioxidant activity (Bonoli et al. 2004). The total phenolic acid content of the seeds of
amaranth, quinoa, kañiwa and lupine are presented in Table 6. Amongst the pseudocereals,
quinoa possesses higher contents of total phenolic acids when compared to that of the seeds of
kañiwa and amaranth (Repo-Carrasco et al. 2010b). Repo-Carrasco also reported that the
phenolic acid content in the seeds of quinoa (42±1 mg GAE/100 g d.m.) were similar to the
total phenolic acid content in sorghum (Repo-Carrasco et al. 2010a). However, the content of
phenolic acids present in the pseudocereals was relatively lower when compared to cereals
like oats, rye and barley. Pasankalla variety of quinoa had the higher total phenolic acid
content when compared to other two varieties (Ccoito and Witulla) of quinoa. Amongst the
varieties of kañiwa, Ayara variety of kañiwa had the higher contents of total phenolic acids
when compared to Kello variety of kañiwa. The white and lupine varieties (Bojar and Zeus)
had the least content of total phenolic acids (0.5-6 mg/100 g d.m.) (Kalogeropoulos et al. 2010;
Siger et al. 2012).
20
Table 6. Total phenolic acid content in amaranth, quinoa, Kañiwa and lupine
Material (reference) Variety Total phenolic acid content (mg/100 g
d.m.)
Amarantha
(Repo-Carrasco et al. 2010b)
32.9±1.3
Amarantha
(Repo-Carrasco et al. 2010a)
12.1±0.3
Quinoab
(Repo-Carrasco et al. 2010a)
42±1
Quinoab
(Repo-Carrasco et al. 2010b)
Pasankalla 59.7±0.5
Ccoito 35.6±0.4
Witulla 30.3±0.6
Kañiwac (Repo-Carrasco et
al. 2010a)
29.5±0.3
Kañiwac (Repo-Carrasco et
al. 2010b)
Kello 34.7±2.4
Ayara 40.1±1.7
Lupined
(Siger et al. 2012)
Bojar 5.84±0.1
Zeus 5.80±0.1
a-Amaranthus caudatus
b- Chenopodium quinoa Willd
c- Chenopodium pallidicaule d- L. angustifolius
The composition of phenolic acids in the seeds of amaranth, kañiwa, quinoa and lupine
varieties are presented in Table 7. The pseudocereals and the legumes contained caffeic acid,
ferulic acid, p-coumaric acid, p-hydroxybenzoic acid and vanillic acid (Repo-Carrasco et al.
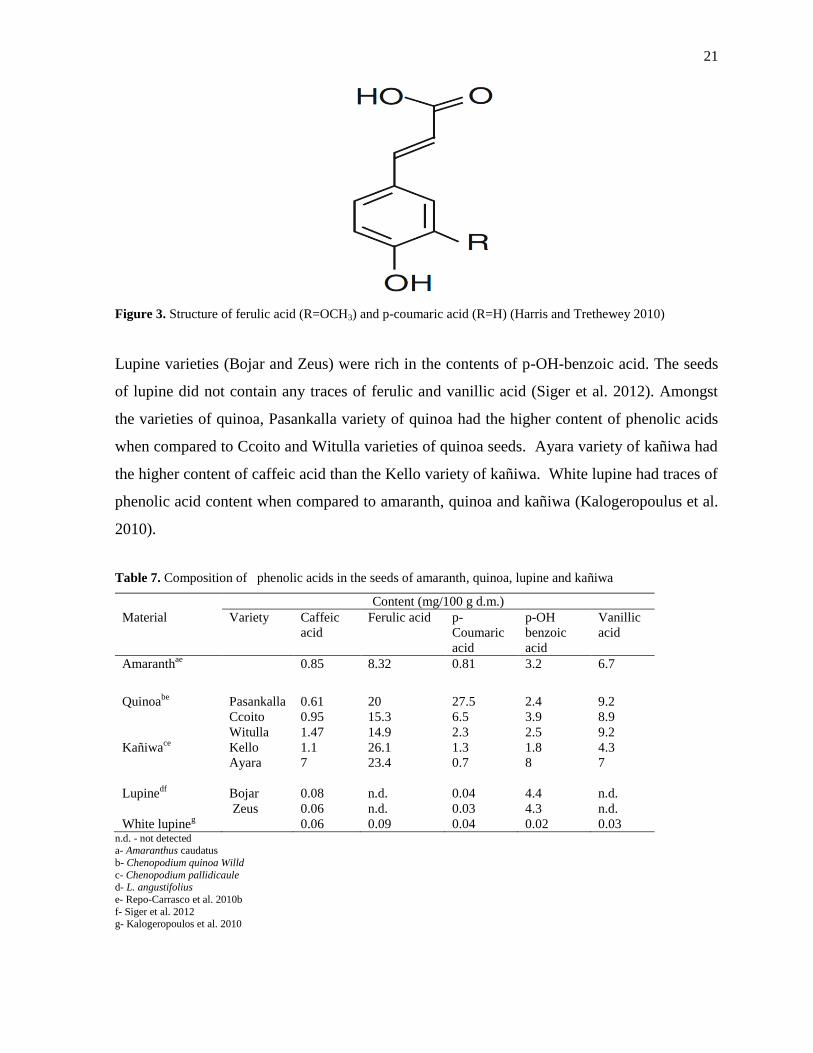
2010b). Ferulic acid also known as hydroxycinnamic acid is widely present in cell wall of
plants that possess antioxidant activities in food substances (Figure 3). The arrangement of
aromatic rings determines the extent of antioxidant activity in the structure of ferulic acid and
its derivatives (Nenadis et al. 2003). Ferulic acid was reported to be higher in the seeds of
kañiwa while the content of p-coumaric acid and vanillic acid was higher in the seeds of
quinoa.
21
Figure 3. Structure of ferulic acid (R=OCH3) and p-coumaric acid (R=H) (Harris and Trethewey 2010)
Lupine varieties (Bojar and Zeus) were rich in the contents of p-OH-benzoic acid. The seeds
of lupine did not contain any traces of ferulic and vanillic acid (Siger et al. 2012). Amongst
the varieties of quinoa, Pasankalla variety of quinoa had the higher content of phenolic acids
when compared to Ccoito and Witulla varieties of quinoa seeds. Ayara variety of kañiwa had
the higher content of caffeic acid than the Kello variety of kañiwa. White lupine had traces of
phenolic acid content when compared to amaranth, quinoa and kañiwa (Kalogeropoulus et al.
2010).
Table 7. Composition of phenolic acids in the seeds of amaranth, quinoa, lupine and kañiwa
Content (mg/100 g d.m.)
Material Variety Caffeic
acid
Ferulic acid p-
Coumaric
acid
p-OH
benzoic
acid
Vanillic
acid
Amaranthae
0.85
8.32 0.81 3.2 6.7
Quinoabe
Pasankalla Ccoito Witulla
0.61
0.95
1.47
20
15.3
14.9
27.5
6.5
2.3
2.4
3.9
2.5
9.2
8.9
9.2
Kañiwace
Kello Ayara
1.1
7
26.1
23.4
1.3
0.7
1.8
8
4.3
7
Lupinedf
Bojar Zeus
0.08
0.06
n.d.
n.d.
0.04
0.03
4.4
4.3
n.d.
n.d.
White lupineg 0.06 0.09 0.04 0.02 0.03
n.d. - not detected a- Amaranthus caudatus
b- Chenopodium quinoa Willd
c- Chenopodium pallidicaule d- L. angustifolius
e- Repo-Carrasco et al. 2010b
f- Siger et al. 2012 g- Kalogeropoulos et al. 2010
22
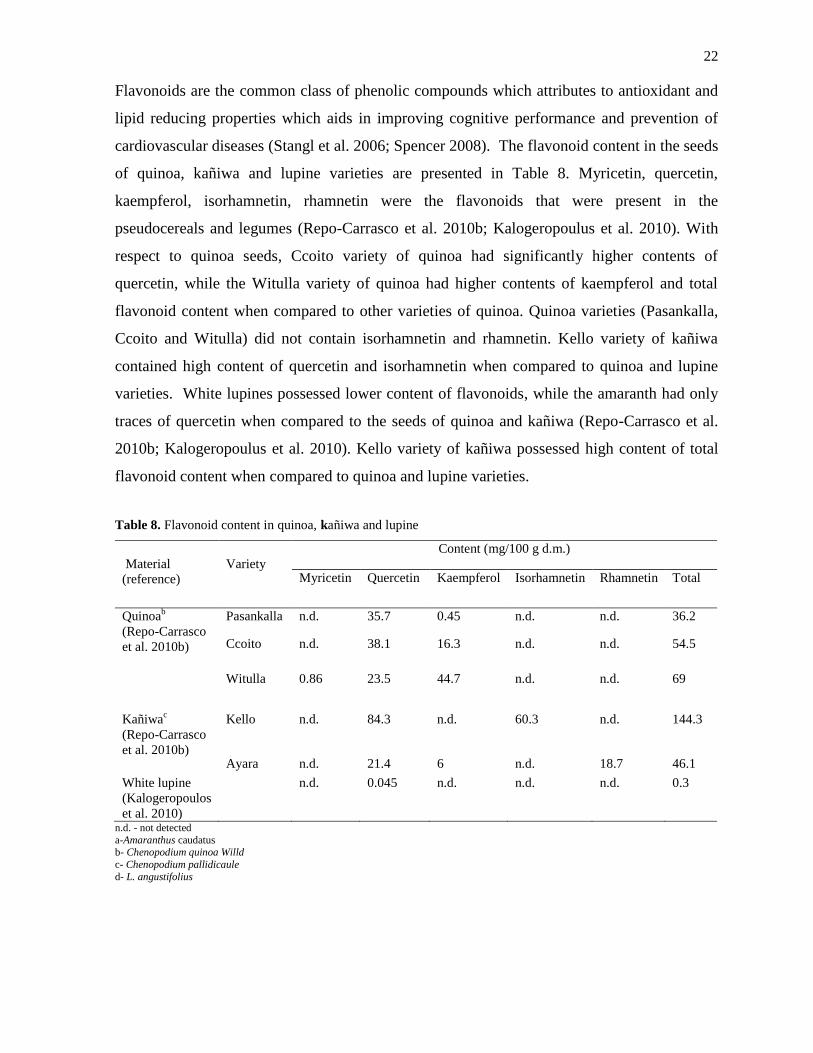
Flavonoids are the common class of phenolic compounds which attributes to antioxidant and
lipid reducing properties which aids in improving cognitive performance and prevention of
cardiovascular diseases (Stangl et al. 2006; Spencer 2008). The flavonoid content in the seeds
of quinoa, kañiwa and lupine varieties are presented in Table 8. Myricetin, quercetin,
kaempferol, isorhamnetin, rhamnetin were the flavonoids that were present in the
pseudocereals and legumes (Repo-Carrasco et al. 2010b; Kalogeropoulus et al. 2010). With
respect to quinoa seeds, Ccoito variety of quinoa had significantly higher contents of
quercetin, while the Witulla variety of quinoa had higher contents of kaempferol and total
flavonoid content when compared to other varieties of quinoa. Quinoa varieties (Pasankalla,
Ccoito and Witulla) did not contain isorhamnetin and rhamnetin. Kello variety of kañiwa
contained high content of quercetin and isorhamnetin when compared to quinoa and lupine
varieties. White lupines possessed lower content of flavonoids, while the amaranth had only
traces of quercetin when compared to the seeds of quinoa and kañiwa (Repo-Carrasco et al.
2010b; Kalogeropoulus et al. 2010). Kello variety of kañiwa possessed high content of total
flavonoid content when compared to quinoa and lupine varieties.
Table 8. Flavonoid content in quinoa, kañiwa and lupine
Material
(reference)
Variety
Content (mg/100 g d.m.)
Myricetin Quercetin Kaempferol Isorhamnetin Rhamnetin Total
Quinoab
(Repo-Carrasco
et al. 2010b)
Pasankalla n.d. 35.7 0.45 n.d. n.d. 36.2
Ccoito n.d. 38.1 16.3 n.d. n.d. 54.5
Witulla 0.86 23.5 44.7 n.d. n.d. 69
Kañiwac
(Repo-Carrasco
et al. 2010b)
Kello n.d. 84.3 n.d. 60.3 n.d. 144.3
Ayara n.d. 21.4 6 n.d. 18.7 46.1
White lupine
(Kalogeropoulos
et al. 2010)
n.d. 0.045 n.d. n.d. n.d. 0.3
n.d. - not detected
a-Amaranthus caudatus b- Chenopodium quinoa Willd
c- Chenopodium pallidicaule
d- L. angustifolius
23
Betalains are considered to be yellow and red compounds that are present in plants like cactus
pears, beetroots and amaranth (Repo-Carrasco et al. 2010b). These compounds contain
betaxanthins. Betaxanthins are compounds which are derived from betalamic acid and
betacyanins. Kanner et al. (2001) and Cai et al. (2003) reported that the species of amaranth
contained desirable quantity of betacyanins and betaxanthins which exhibited antioxidant
activity.
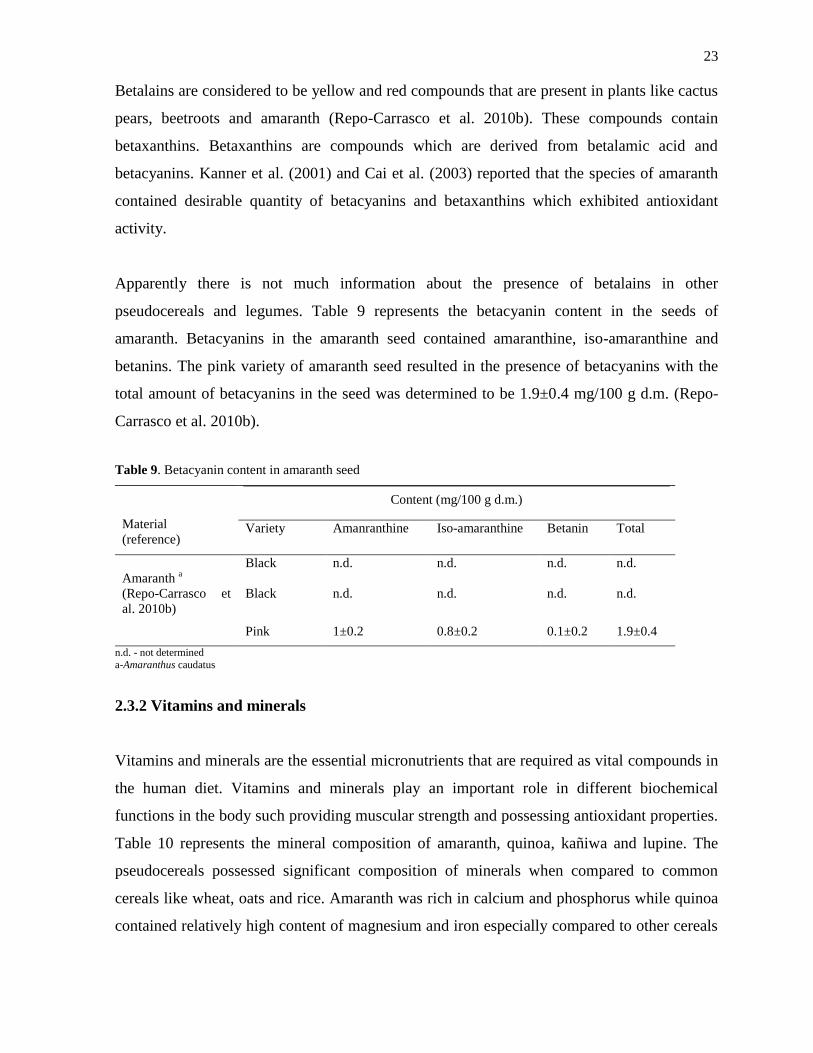
Apparently there is not much information about the presence of betalains in other
pseudocereals and legumes. Table 9 represents the betacyanin content in the seeds of
amaranth. Betacyanins in the amaranth seed contained amaranthine, iso-amaranthine and
betanins. The pink variety of amaranth seed resulted in the presence of betacyanins with the
total amount of betacyanins in the seed was determined to be 1.9±0.4 mg/100 g d.m. (Repo-
Carrasco et al. 2010b).
Table 9. Betacyanin content in amaranth seed
Material
(reference)
Content (mg/100 g d.m.)
Variety Amanranthine Iso-amaranthine Betanin Total
Amaranth a
(Repo-Carrasco et
al. 2010b)
Black
n.d. n.d. n.d. n.d.
Black
n.d. n.d. n.d. n.d.
Pink
1±0.2 0.8±0.2 0.1±0.2 1.9±0.4
n.d. - not determined
a-Amaranthus caudatus
2.3.2 Vitamins and minerals
Vitamins and minerals are the essential micronutrients that are required as vital compounds in
the human diet. Vitamins and minerals play an important role in different biochemical
functions in the body such providing muscular strength and possessing antioxidant properties.
Table 10 represents the mineral composition of amaranth, quinoa, kañiwa and lupine. The
pseudocereals possessed significant composition of minerals when compared to common
cereals like wheat, oats and rice. Amaranth was rich in calcium and phosphorus while quinoa
contained relatively high content of magnesium and iron especially compared to other cereals
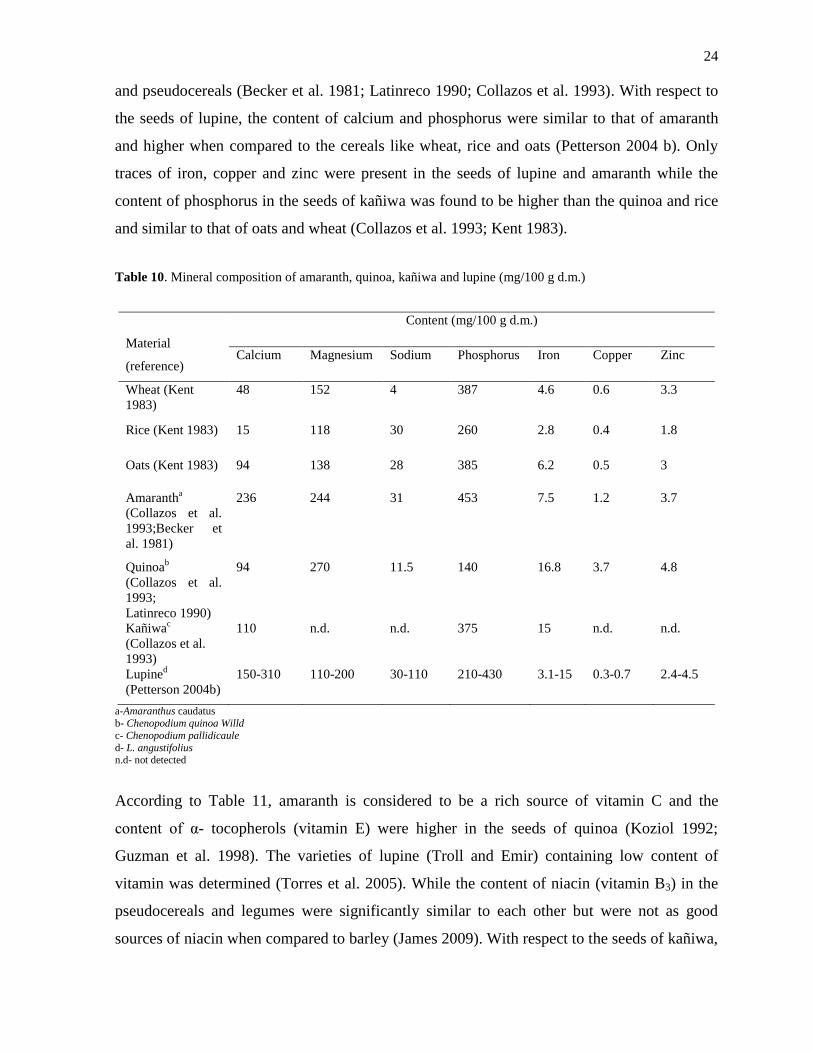
24
and pseudocereals (Becker et al. 1981; Latinreco 1990; Collazos et al. 1993). With respect to
the seeds of lupine, the content of calcium and phosphorus were similar to that of amaranth
and higher when compared to the cereals like wheat, rice and oats (Petterson 2004 b). Only
traces of iron, copper and zinc were present in the seeds of lupine and amaranth while the
content of phosphorus in the seeds of kañiwa was found to be higher than the quinoa and rice
and similar to that of oats and wheat (Collazos et al. 1993; Kent 1983).
Table 10. Mineral composition of amaranth, quinoa, kañiwa and lupine (mg/100 g d.m.)
a-Amaranthus caudatus
b- Chenopodium quinoa Willd
c- Chenopodium pallidicaule
d- L. angustifolius n.d- not detected
According to Table 11, amaranth is considered to be a rich source of vitamin C and the
content of α- tocopherols (vitamin E) were higher in the seeds of quinoa (Koziol 1992;
Guzman et al. 1998). The varieties of lupine (Troll and Emir) containing low content of
vitamin was determined (Torres et al. 2005). While the content of niacin (vitamin B3) in the
pseudocereals and legumes were significantly similar to each other but were not as good
sources of niacin when compared to barley (James 2009). With respect to the seeds of kañiwa,
Material
(reference)
Content (mg/100 g d.m.)
Calcium Magnesium Sodium Phosphorus Iron Copper Zinc
Wheat (Kent
1983)
48 152 4 387 4.6 0.6 3.3
Rice (Kent 1983) 15 118 30 260 2.8 0.4 1.8
Oats (Kent 1983) 94 138 28 385 6.2 0.5 3
Amarantha
(Collazos et al.
1993;Becker et
al. 1981)
236 244 31 453 7.5 1.2 3.7
Quinoab
(Collazos et al.
1993;
Latinreco 1990)
94 270 11.5 140 16.8 3.7 4.8
Kañiwac
(Collazos et al.
1993)
110
n.d.
n.d.
375
15
n.d.
n.d.
Lupined
(Petterson 2004b)
150-310 110-200 30-110 210-430 3.1-15 0.3-0.7 2.4-4.5

25
the content of thiamin (vitamin B1) and riboflavin (vitamin B2) was similar to that of seeds of
lupine ranging around 0.7 mg/100 g d.m. and 0.3 mg/100 g d.m. respectively (Collazos et al.
1993; Torres et al. 2005).
Table 11. Vitamin composition of amaranth, quinoa, kañiwa and lupine
Content (mg/100 g d.m.)
Material
(reference)
Ascorbic
acid (C)
Α--tocopherol
(E)
Thiamin (B1) Riboflavin
(B2)
Niacin (B3)
Barley (James 2009) n.d. n.d. 0.2 0.11 4.6
Amarantha (Collazos
et al. 1993)
1.3 n.d. 0.3 0.01 0.4
Amarantha
(Guzman
et al. 1998)
3-7.1 1.6 0.1-0.14 0.2-0.3 1-1.5
Quinoab (Koziol
1992)
4 5.4 0.4 0.4 1.1
Quinoab (James
2009)
n.d. n.d. 0.3-0.4 0.3-0.32 1.24-1.5
Kañiwac (Collazos et
al. 1993)
n.d. n.d. 0.7 0.3 1.5
Lupinede
(Torres et
al. 2005)
n.d. 0.43 0.71 0.24 n.d.
Lupinedf
(Torres et
al. 2005)
n.d. 0.9 0.6 0.3 n.d.
n.d. – not determined
a-Amaranthus caudatus b- Chenopodium quinoa Willd
c- Chenopodium pallidicaule
d- L. angustifolius e- L. angustifolius variety Troll
f- L. angustifolius variety Emir
The term α-tocopherol relates to the vitamin E activity. Vitamin E possesses different
biological functions in relation to human health. It plays a key role as an antioxidant in
addition to its functioning as regulating the gene expression, cell signaling etc. (Azzi and
Stocker 2000; Brigelius and Flohé 2006; Nesaretnam et al. 2007). Structure of tocopherol and
tocotrienol is represented in the Figure 4. The tocopherol consists of three chiral carbon atoms
(C-2, C-4’ and C-8’) and the four forms of tocopherols (α, β, γ, δ) are differentiated with the
position and number of methyl groups present in the chromanol ring of the tocopherol
structure (Munné-Bosch 2007; Pacifico et al. 2012) while the structures of tocotrienols are
represented by the presence of three double bonds in the side chain molecule (C-3’, C-7’, C-
11’).
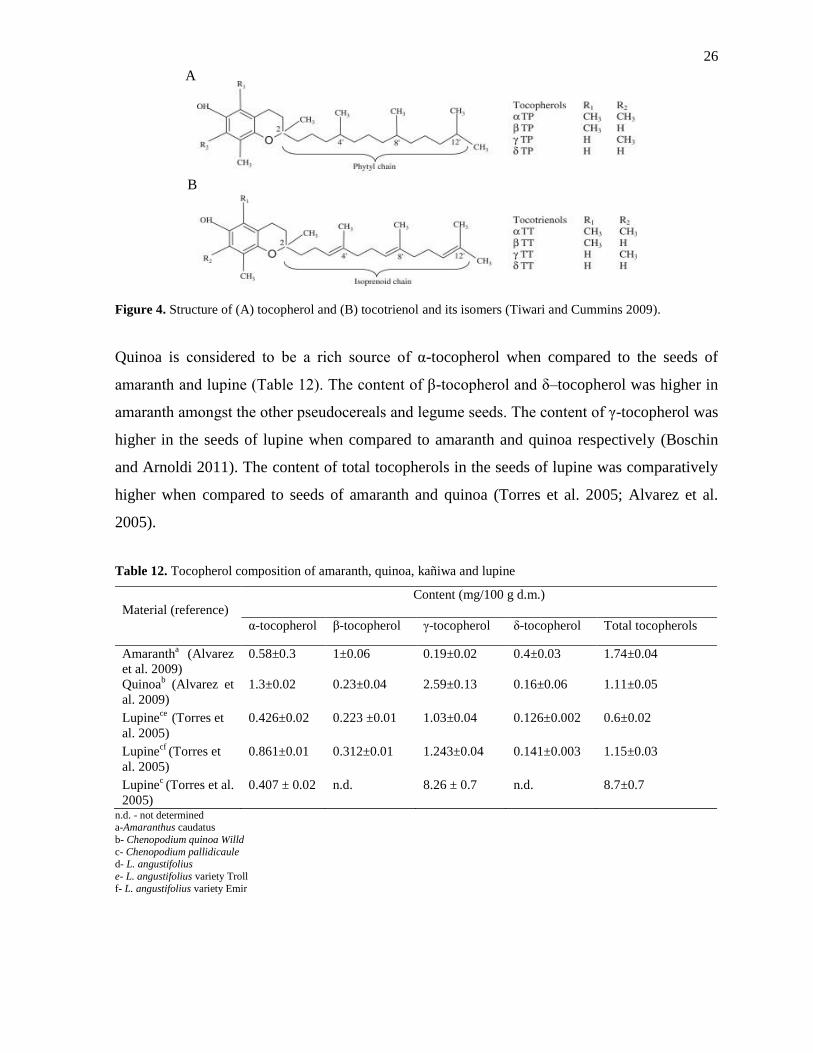
26
Figure 4. Structure of (A) tocopherol and (B) tocotrienol and its isomers (Tiwari and Cummins 2009).
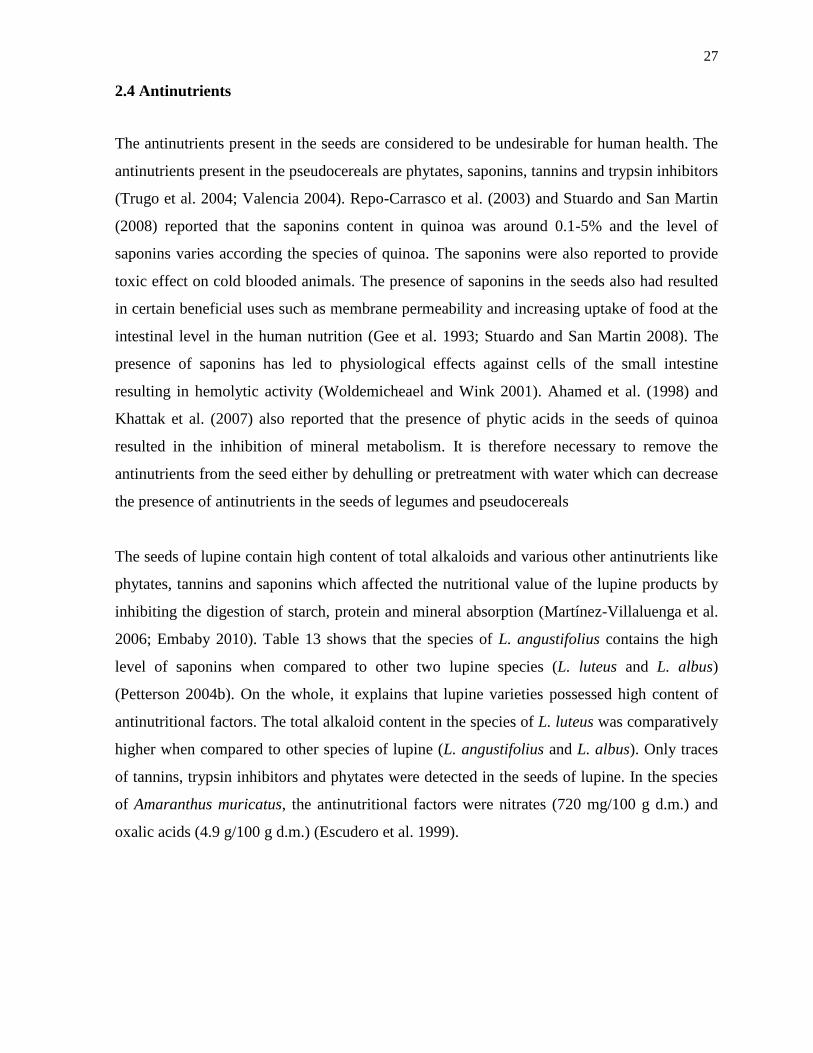
Quinoa is considered to be a rich source of α-tocopherol when compared to the seeds of
amaranth and lupine (Table 12). The content of β-tocopherol and δ–tocopherol was higher in
amaranth amongst the other pseudocereals and legume seeds. The content of γ-tocopherol was
higher in the seeds of lupine when compared to amaranth and quinoa respectively (Boschin
and Arnoldi 2011). The content of total tocopherols in the seeds of lupine was comparatively
higher when compared to seeds of amaranth and quinoa (Torres et al. 2005; Alvarez et al.
2005).
Table 12. Tocopherol composition of amaranth, quinoa, kañiwa and lupine
Material (reference)
Content (mg/100 g d.m.)
α-tocopherol β-tocopherol γ-tocopherol δ-tocopherol Total tocopherols
Amarantha (Alvarez
et al. 2009)
0.58±0.3 1±0.06 0.19±0.02 0.4±0.03 1.74±0.04
Quinoab (Alvarez et
al. 2009)
1.3±0.02 0.23±0.04 2.59±0.13 0.16±0.06 1.11±0.05
Lupinece
(Torres et
al. 2005)
0.426±0.02 0.223 ±0.01 1.03±0.04 0.126±0.002 0.6±0.02
Lupinecf
(Torres et
al. 2005)
0.861±0.01 0.312±0.01 1.243±0.04 0.141±0.003 1.15±0.03
Lupinec (Torres et al.
2005)
0.407 ± 0.02 n.d. 8.26 ± 0.7 n.d. 8.7±0.7
n.d. - not determined a-Amaranthus caudatus
b- Chenopodium quinoa Willd
c- Chenopodium pallidicaule d- L. angustifolius
e- L. angustifolius variety Troll
f- L. angustifolius variety Emir
A
B
27
2.4 Antinutrients
The antinutrients present in the seeds are considered to be undesirable for human health. The
antinutrients present in the pseudocereals are phytates, saponins, tannins and trypsin inhibitors
(Trugo et al. 2004; Valencia 2004). Repo-Carrasco et al. (2003) and Stuardo and San Martin
(2008) reported that the saponins content in quinoa was around 0.1-5% and the level of
saponins varies according the species of quinoa. The saponins were also reported to provide
toxic effect on cold blooded animals. The presence of saponins in the seeds also had resulted
in certain beneficial uses such as membrane permeability and increasing uptake of food at the
intestinal level in the human nutrition (Gee et al. 1993; Stuardo and San Martin 2008). The
presence of saponins has led to physiological effects against cells of the small intestine
resulting in hemolytic activity (Woldemicheael and Wink 2001). Ahamed et al. (1998) and
Khattak et al. (2007) also reported that the presence of phytic acids in the seeds of quinoa
resulted in the inhibition of mineral metabolism. It is therefore necessary to remove the
antinutrients from the seed either by dehulling or pretreatment with water which can decrease
the presence of antinutrients in the seeds of legumes and pseudocereals
The seeds of lupine contain high content of total alkaloids and various other antinutrients like
phytates, tannins and saponins which affected the nutritional value of the lupine products by
inhibiting the digestion of starch, protein and mineral absorption (Martínez-Villaluenga et al.
2006; Embaby 2010). Table 13 shows that the species of L. angustifolius contains the high
level of saponins when compared to other two lupine species (L. luteus and L. albus)
(Petterson 2004b). On the whole, it explains that lupine varieties possessed high content of
antinutritional factors. The total alkaloid content in the species of L. luteus was comparatively
higher when compared to other species of lupine (L. angustifolius and L. albus). Only traces
of tannins, trypsin inhibitors and phytates were detected in the seeds of lupine. In the species
of Amaranthus muricatus, the antinutritional factors were nitrates (720 mg/100 g d.m.) and
oxalic acids (4.9 g/100 g d.m.) (Escudero et al. 1999).
28
Table 13. Antinutrient content in various lupine species
Content (Unit) L. albus L. angustifolius L. luteus
(Petterson 2004b) (Petterson 2004b) (Petterson 2004b)
Total alkaloids (mg/kg d.m.) <200 <200 200-500
Oligosaccharides (%) 7.5 5.2 12.3
Saponins (mg/kg d.m.) <1 570 55
Condensed tannins (%) 0.01 <0.01 0.02
Trypsin inhibitors (mg/g d.m.) 0.13 0.14 0.29
Phytate (%) 0.79 0.58 0.96
2.5 Extrusion
Extrusion technology has created a huge impact in the food industries towards shaping and
deriving ready to eat products (Fellows 2009). The use of extrusion in the food processing has
increased its popularity due to its versatility, cost-effectiveness, environmental friendliness
and better product output (Guy 2001a).
The principle of the extrusion process involves the loading of raw materials in the feeding
hopper where the screw conveys through the raw materials. When the raw materials pass
down the barrel, the volume is reduced and thereby the food is compressed under pressure
into a semi-solid, plasticized mass. The selection of right extruder for the production of ready
to eat (RTE) or cereal snacks depends on the nature of raw materials used, bulk density and
type of product to be produced (Fellows 2009).
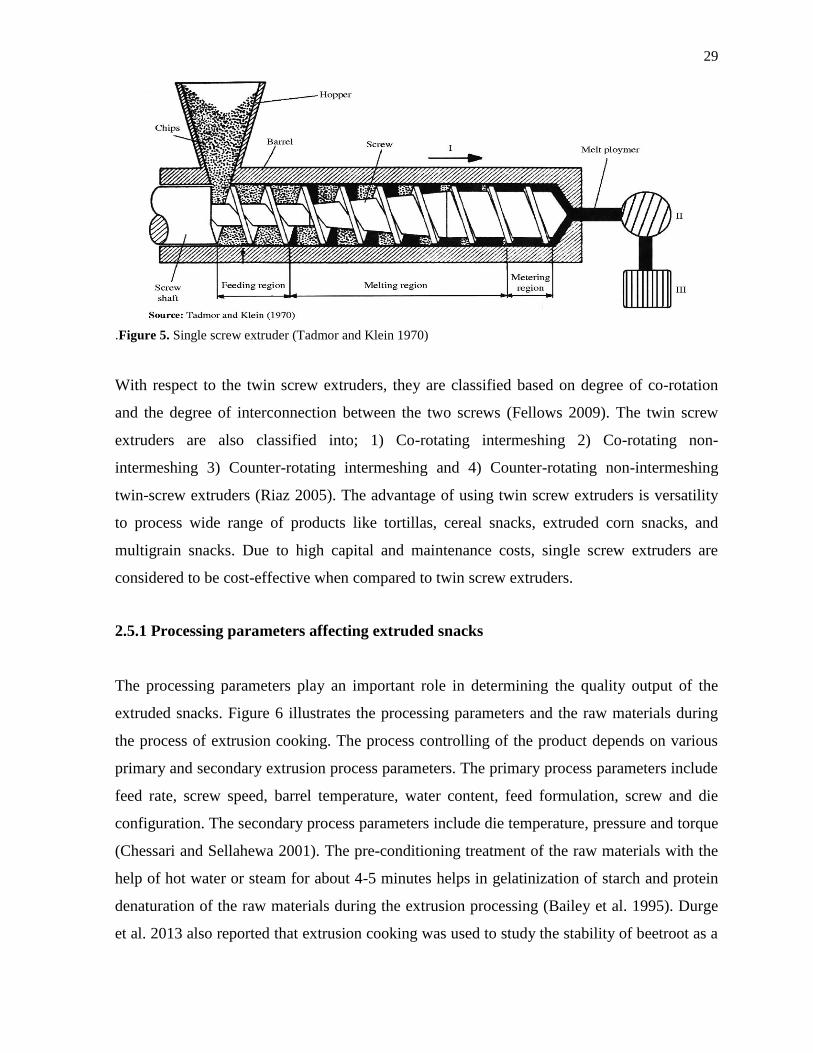
The general differences between the extruders are whether it is single or twin screw extruders.
The single screw extruders (Figure 5) are classified into 1) low shear forming extruder, 2) low
shear cooking, 3) medium shear cooking and 4) high shear cooking single screw extruders
(Riaz 2005). The size and shape of the extrudates and efficiency of the extruder performance
are interdependent on the operational parameters like temperature, pressure and screw speed
(Fellows 2009). The residence time in the extrusion plays an important role in the
performance of the product which can be controlled by screw speed.
29
.Figure 5. Single screw extruder (Tadmor and Klein 1970)
With respect to the twin screw extruders, they are classified based on degree of co-rotation
and the degree of interconnection between the two screws (Fellows 2009). The twin screw
extruders are also classified into; 1) Co-rotating intermeshing 2) Co-rotating non-
intermeshing 3) Counter-rotating intermeshing and 4) Counter-rotating non-intermeshing
twin-screw extruders (Riaz 2005). The advantage of using twin screw extruders is versatility
to process wide range of products like tortillas, cereal snacks, extruded corn snacks, and
multigrain snacks. Due to high capital and maintenance costs, single screw extruders are
considered to be cost-effective when compared to twin screw extruders.
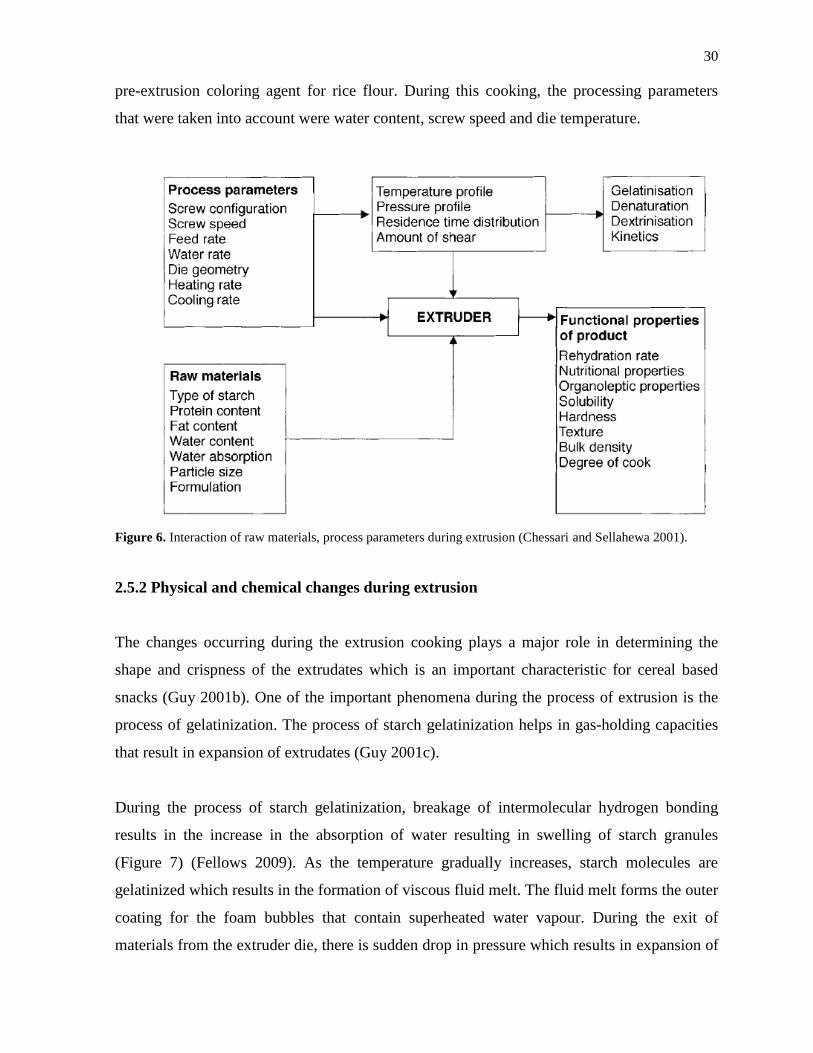
2.5.1 Processing parameters affecting extruded snacks
The processing parameters play an important role in determining the quality output of the
extruded snacks. Figure 6 illustrates the processing parameters and the raw materials during
the process of extrusion cooking. The process controlling of the product depends on various
primary and secondary extrusion process parameters. The primary process parameters include
feed rate, screw speed, barrel temperature, water content, feed formulation, screw and die
configuration. The secondary process parameters include die temperature, pressure and torque
(Chessari and Sellahewa 2001). The pre-conditioning treatment of the raw materials with the
help of hot water or steam for about 4-5 minutes helps in gelatinization of starch and protein
denaturation of the raw materials during the extrusion processing (Bailey et al. 1995). Durge
et al. 2013 also reported that extrusion cooking was used to study the stability of beetroot as a
30
pre-extrusion coloring agent for rice flour. During this cooking, the processing parameters
that were taken into account were water content, screw speed and die temperature.
Figure 6. Interaction of raw materials, process parameters during extrusion (Chessari and Sellahewa 2001).
2.5.2 Physical and chemical changes during extrusion
The changes occurring during the extrusion cooking plays a major role in determining the
shape and crispness of the extrudates which is an important characteristic for cereal based
snacks (Guy 2001b). One of the important phenomena during the process of extrusion is the
process of gelatinization. The process of starch gelatinization helps in gas-holding capacities
that result in expansion of extrudates (Guy 2001c).
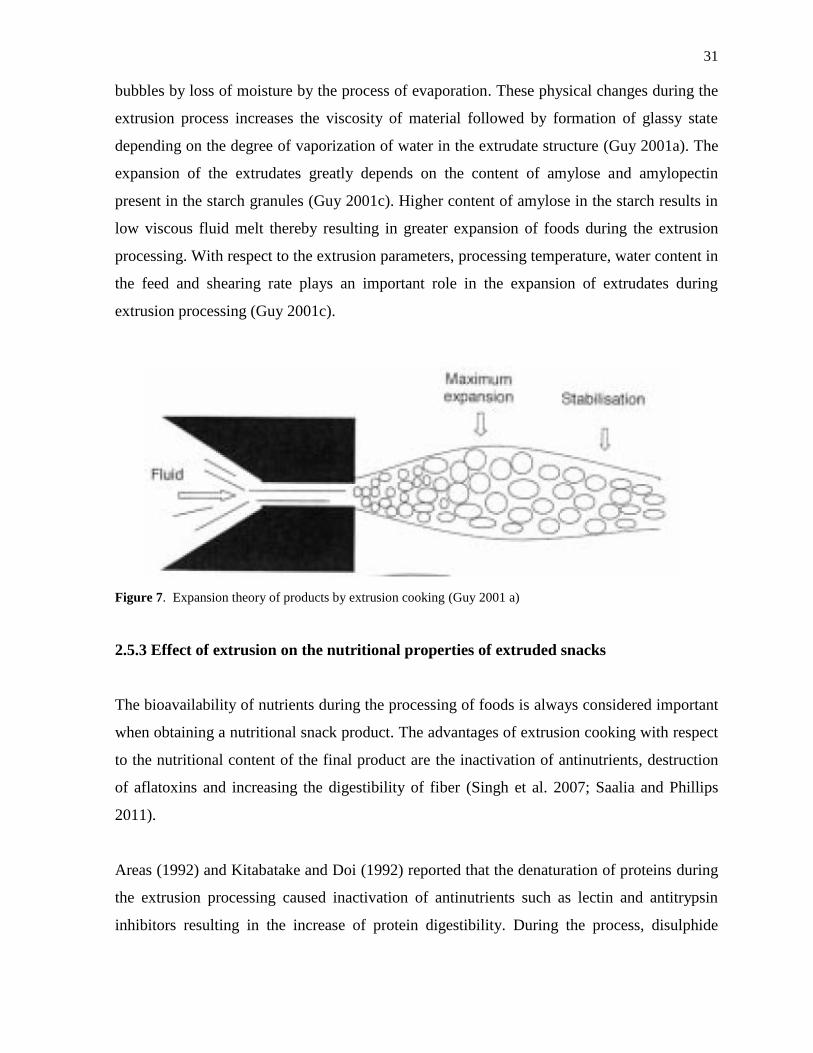
During the process of starch gelatinization, breakage of intermolecular hydrogen bonding
results in the increase in the absorption of water resulting in swelling of starch granules
(Figure 7) (Fellows 2009). As the temperature gradually increases, starch molecules are
gelatinized which results in the formation of viscous fluid melt. The fluid melt forms the outer
coating for the foam bubbles that contain superheated water vapour. During the exit of
materials from the extruder die, there is sudden drop in pressure which results in expansion of
31
bubbles by loss of moisture by the process of evaporation. These physical changes during the
extrusion process increases the viscosity of material followed by formation of glassy state
depending on the degree of vaporization of water in the extrudate structure (Guy 2001a). The
expansion of the extrudates greatly depends on the content of amylose and amylopectin
present in the starch granules (Guy 2001c). Higher content of amylose in the starch results in
low viscous fluid melt thereby resulting in greater expansion of foods during the extrusion
processing. With respect to the extrusion parameters, processing temperature, water content in
the feed and shearing rate plays an important role in the expansion of extrudates during
extrusion processing (Guy 2001c).
Figure 7. Expansion theory of products by extrusion cooking (Guy 2001 a)
2.5.3 Effect of extrusion on the nutritional properties of extruded snacks
The bioavailability of nutrients during the processing of foods is always considered important
when obtaining a nutritional snack product. The advantages of extrusion cooking with respect
to the nutritional content of the final product are the inactivation of antinutrients, destruction
of aflatoxins and increasing the digestibility of fiber (Singh et al. 2007; Saalia and Phillips
2011).
Areas (1992) and Kitabatake and Doi (1992) reported that the denaturation of proteins during
the extrusion processing caused inactivation of antinutrients such as lectin and antitrypsin
inhibitors resulting in the increase of protein digestibility. During the process, disulphide
32
bonds break and reunite, while the high molecular proteins dissociate into smaller subunits
(Guy 2001a). It was also reported that the nutritional value was increased in the vegetable
protein due to mild extrusion processing conditions (Srihara and Alexander 1984, Hakansson
et al. 1987, Colonna et al. 1989, Areas 1992). Chávez-Jáuregui et al. (2000) and Repo-
Carrasco et al. (2009a) reported that there was better retention of protein content during the
extrusion processing on amaranth and kañiwa. Texturization of the protein-based foods was
resulted due to the effect of extrusion cooking thereby improving taste of the extrudates.
(Cheftel et al. 1992). According to Areas (1992) the electrostatic interactions and disulphide
bonding could have an important role in texturization of foods during the extrusion process.
Retention of lysine in the breakfast cereals is considered most important since it is the limiting
amino acid amongst most of cereal snacks. The lysine content in the extruded soy potato
blends were around 68-100% depending on the content of feed (Iwe et al. 2004). There was
increase in the availability of lysine during the extrusion processing with the increase in the
screw speed and the feed rate. However, with the increase in the processing temperature, die
diameter and water content during the extrusion processing decreased the lysine availability
(Noguchi et al. 1982; Pham and Del Rosario 1984). During the extrusion cooking of amaranth
it was reported that there was no significant effect on lysine availability (6-7 g/100 g d.m.)
(Chávez-Jáuregui et al. 2000). During high extrusion processing with lower water content of
the feed initiates non-enzymatic browning reaction termed as Maillard reaction. Noguchi et al.
1982 reported that the availability of lysine decreased during the Maillard reaction at high
extrusion processing (≥180 °C) and lower water content (≤15 %) of the feed. Also the
nutritional effect of protein and amino acid availability was negatively affected by browning
and caramelization involving proteins and sugars (Singh et al. 2007).
The effects of extrusion on fat were also studied. Raw materials containing less than 5% total
fat content have resulted in better retention of lipids when compared to raw materials of
higher fat content (Nierle et al. 1980). The addition of antioxidants (eg. phenolics) also
reduced the effect of lipid oxidation in the extrudates and thereby resulting in the better
retention of nutritional properties (Camire et al. 2005). The process of extrusion cooking at
higher extrusion temperatures also enhanced the process lipid oxidation in extruded corn
based snacks (Rao and Artz 1989; Martin et al. 1993; Zadernowski et al. 1997).
33
There are also certain effects of extrusion in relation to dietary fiber content. Increase in the
total dietary fiber content of the extruded barley flours was determined with respect to content
of soluble dietary fiber. Effect of extrusion on the dietary fiber content led to the
transformation of insoluble dietary fiber to the soluble dietary form in addition to the
formation of resistant starch and enzyme resistant glucans through the process of
transglycosidation (Vasanthan et al. 2002). During the extrusion processing of amaranth
varieties (Centenario, Oscar blanco), the content of insoluble dietary fiber was decreased
resulting in the increase in the content of soluble dietary fiber (Repo-Carrasco et al. 2009b).
The increase in the soluble dietary fiber content during the process of extrusion was reported
to be due to shear stress and high processing temperatures which caused breakage of chemical
bonds thereby forming cluster of tiny particles which were soluble in form resulting in the
increase of soluble dietary fiber content in the extrudates of amaranth varieties (Gualberto et
al. 1997).
Vitamin losses were also reported in the foods that were produced through extrusion. α-
tocopherol content in the extruded peas decreased with an increase in the extrusion
temperature (Grela et al. 1999). Also, loss of riboflavin was reported with the increase in
water content of the feed and screw speed (Harper 1988). Milder extrusion temperatures
(150 °C) and short residence time resulted in better retention of heat-sensitive vitamins
(vitamin B1, B2) (Killeit and Weidmann 1984; Pham and Del Rosario 1986). Singh et al. (2007)
summarized that the heat-sensitive vitamins were lost during extrusion. Athar et al. (2006)
reported that there was 44-62% retention of B vitamins in snacks during the extrusion
processing of cereals and resulted in higher stability of riboflavin (vitamin B2) and niacin
(vitamin B3). Absorption of minerals can be enhanced by the process of extrusion (Alonso et
al. 2001). From his study he reported that the phytates and tannins form complexes with the
minerals that inhibit mineral absorption. Extrusion cooking has resulted in breaking down the
complex by hydrolysis thereby increasing the mineral availability in the extrudates.
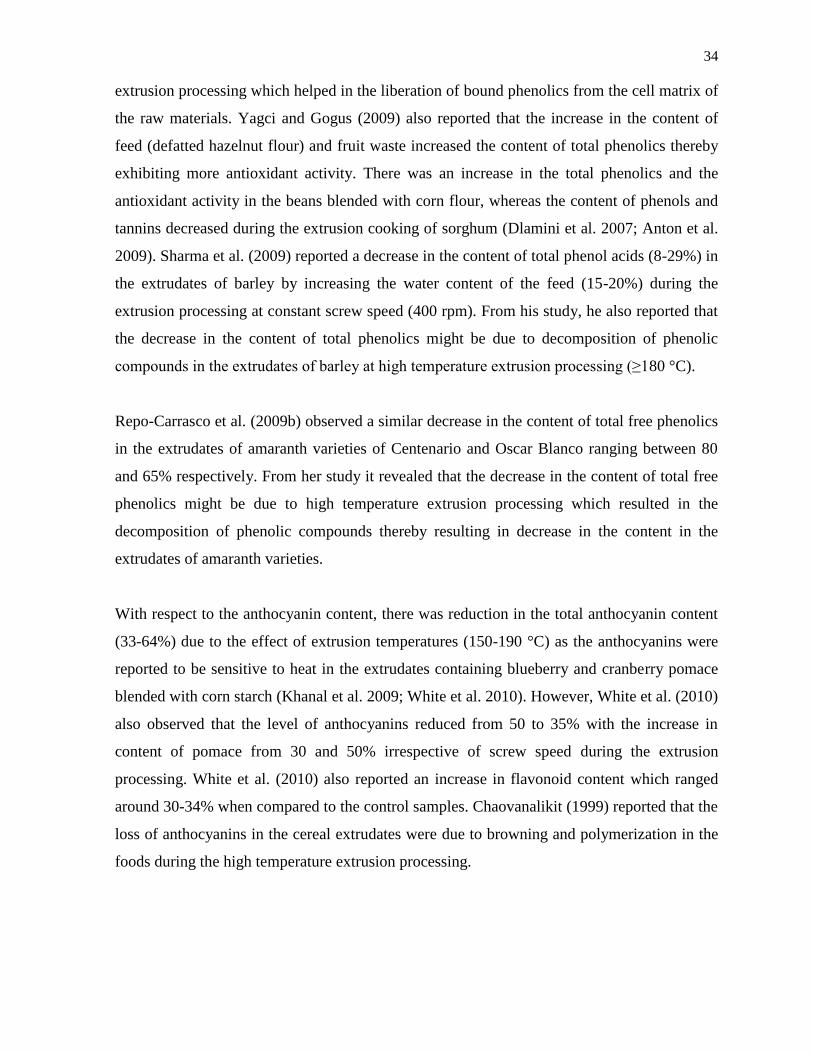
The impact of extrusion on the bioactive compounds is presented in the Table 14. The content
of total phenolics was reported to be increased during the extrusion of rice-based snacks
(water content- 12-18%, temperature- 150-175 °C) (Yagci and Gögus 2009). The increase in
the content of total phenolics was due to the effect of high temperature generated during the
34
extrusion processing which helped in the liberation of bound phenolics from the cell matrix of
the raw materials. Yagci and Gogus (2009) also reported that the increase in the content of
feed (defatted hazelnut flour) and fruit waste increased the content of total phenolics thereby
exhibiting more antioxidant activity. There was an increase in the total phenolics and the
antioxidant activity in the beans blended with corn flour, whereas the content of phenols and
tannins decreased during the extrusion cooking of sorghum (Dlamini et al. 2007; Anton et al.
2009). Sharma et al. (2009) reported a decrease in the content of total phenol acids (8-29%) in
the extrudates of barley by increasing the water content of the feed (15-20%) during the
extrusion processing at constant screw speed (400 rpm). From his study, he also reported that
the decrease in the content of total phenolics might be due to decomposition of phenolic
compounds in the extrudates of barley at high temperature extrusion processing (≥180 °C).
Repo-Carrasco et al. (2009b) observed a similar decrease in the content of total free phenolics
in the extrudates of amaranth varieties of Centenario and Oscar Blanco ranging between 80
and 65% respectively. From her study it revealed that the decrease in the content of total free
phenolics might be due to high temperature extrusion processing which resulted in the
decomposition of phenolic compounds thereby resulting in decrease in the content in the
extrudates of amaranth varieties.
With respect to the anthocyanin content, there was reduction in the total anthocyanin content
(33-64%) due to the effect of extrusion temperatures (150-190 °C) as the anthocyanins were
reported to be sensitive to heat in the extrudates containing blueberry and cranberry pomace
blended with corn starch (Khanal et al. 2009; White et al. 2010). However, White et al. (2010)
also observed that the level of anthocyanins reduced from 50 to 35% with the increase in
content of pomace from 30 and 50% irrespective of screw speed during the extrusion
processing. White et al. (2010) also reported an increase in flavonoid content which ranged
around 30-34% when compared to the control samples. Chaovanalikit (1999) reported that the
loss of anthocyanins in the cereal extrudates were due to browning and polymerization in the
foods during the high temperature extrusion processing.
35
Table 14: Effect of extrusion on bioactive compounds
Raw materials (reference) Process conditions Bioactive compounds
Wheat flour (8-20%), Grape seed
(30%), white sorghum flour (80%)
and rice grits (3-7%), defatted
hazelnut flour (5-15%)
(Yagci and Gögus 2009)
Temperature (150-175 °C)
Water content (12-18%)
Screw speed (200-280 rpm)
Phenolic compounds (free
and bound phenolics) (↑)
Barley flour
(Sharma et al. 2012)
Temperature (150-180 °C)
Water content (15-20%)
Screw speed (400 rpm)
Phenolic compounds (free
and bound phenolics) (↓)
Blueberry pomace (30%) and white
sorghum flour (70%)
(Khanal et al. 2009)
Temperature (160 and 180 °C)
Screw speed ( 150 and 200 rpm)
Total anthocyanins (↓)
Total procyanidin (↑)
Cranberry pomace and corn starch
(30:70, 40:60 and 50:50)
(White et al. 2010)
Temperature (150, 170, 190 °C)
Screw speed (150 and 200 rpm)
Total anthocyanins (↓)
Flavonols (↑)
Wheat flour (Zielinski et al. 2001) Temperature (120-160-200 °C)
Water content (20%)
Phenolic compounds (free
and bound phenolics) (↑)
The extrusion processing at higher extrusion temperatures resulted in the reduction in the total
content of isoflavones (≤ 20%) in the extrudates of okra (Rinaldi et al. 2000). Effect of
extrusion on the extrudates containing soybean and acha flour blends resulted in decrease in
the content of tannins and riboflavin at 150 °C (Anuonye et al. 2010). There was no
significant difference in the levels of ascorbic acid and total phenolic content in the extrudates
containing soyabean and acha flour blends. On the whole, extrusion of raw materials
involving high temperature conditions which short residence time could help in obtaining
high nutritional snack product.
2.5.4 Effect of extrusion on the antinutritional properties of extruded snacks
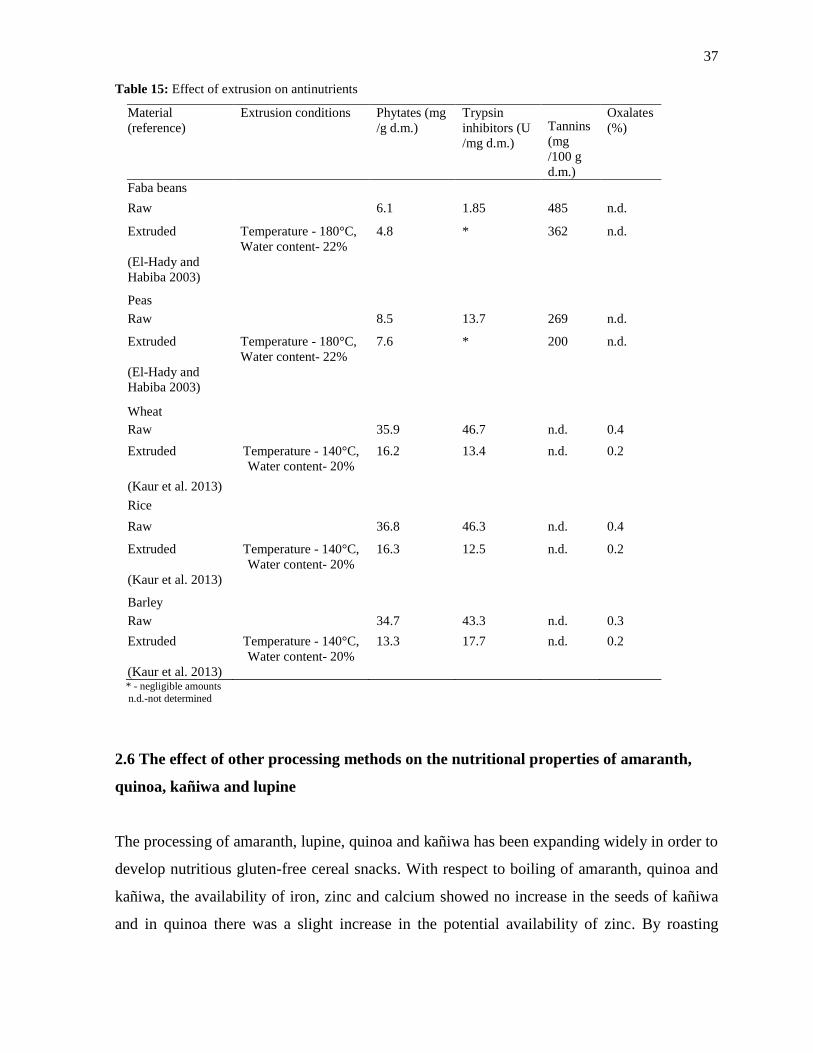
Effect of extrusion processing parameters favoring the reduction of antinutritional factors is
presented in Table 15. Extrusion of faba beans and peas at higher temperature (180 °C) and
water content (22%) helped in the complete elimination of trypsin inhibitors in the extrudates
(El-Hady and Habiba 2003). The content of trypsin inhibitors in the extrudates of faba beans
and peas were reduced to negligible amounts during the extrusion processing. The
inactivation of lectins and trypsin inhibitors increased with the increase in the processing
36
temperature and water content of the raw materials (Björck and Asp 1983). El-Hady and
Habiba (2003) also reported that the soaking of beans and peas for a period of 16 hours
followed by extrusion processing resulted in better elimination of antinutrients in the
extrudates. Extrusion of cereals was also studied extensively (Kaur et al. 2013). The extrusion
of wheat, rice and barley at 140 °C and water content (20%) resulted in more than 50%
reduction in the content of phytates, trypsin inhibitors and oxalates in the extruded cereal
snacks. Camire (2001) also has summarized the effect of extrusion on antinutritional factors
against various extrusion parameters. Elimination of protease inhibitors can be successfully
achieved by the process of extrusion at higher temperatures while the complete inhibition of
gossypol can be achieved by increasing the water content of the feed during the extrusion
processing (Camire 2001).
37
Table 15: Effect of extrusion on antinutrients
Material
(reference)
Extrusion conditions Phytates (mg
/g d.m.)
Trypsin
inhibitors (U
/mg d.m.)
Tannins
(mg
/100 g
d.m.)
Oxalates
(%)
Faba beans
Raw
6.1 1.85 485 n.d.
Extruded Temperature - 180°C,
Water content- 22%
4.8 * 362 n.d.
(El-Hady and
Habiba 2003)
Peas
Raw 8.5 13.7 269 n.d.
Extruded Temperature - 180°C,
Water content- 22%
7.6 * 200 n.d.
(El-Hady and
Habiba 2003)
Wheat
Raw
35.9 46.7 n.d. 0.4
Extruded Temperature - 140°C,
Water content- 20%
16.2 13.4 n.d. 0.2
(Kaur et al. 2013)
Rice
Raw 36.8 46.3 n.d. 0.4
Extruded Temperature - 140°C,
Water content- 20%
16.3 12.5 n.d. 0.2
(Kaur et al. 2013)
Barley
Raw 34.7 43.3 n.d. 0.3
Extruded Temperature - 140°C,
Water content- 20%
13.3 17.7 n.d. 0.2
(Kaur et al. 2013) * - negligible amounts
n.d.-not determined
2.6 The effect of other processing methods on the nutritional properties of amaranth,
quinoa, kañiwa and lupine
The processing of amaranth, lupine, quinoa and kañiwa has been expanding widely in order to
develop nutritious gluten-free cereal snacks. With respect to boiling of amaranth, quinoa and
kañiwa, the availability of iron, zinc and calcium showed no increase in the seeds of kañiwa
and in quinoa there was a slight increase in the potential availability of zinc. By roasting
38
method, there was no difference between the original samples with respect to nutritional
composition (Repo-Carrasco et al. 2010a). The effect of soaking, dehulling and microwave
cooking increased the levels of phytic acid, tannins and trypsin inhibitors by 1 % in the bitter
lupine seeds (Lupinus termis) and 16% in sweet lupine seeds (Lupinus albus). But there was
75% reduction in the lectin activity of bitter lupine seeds and 88% reduction in the sweet
lupine varieties. The effect of microwave cooking did not favor in the inactivation of
antinutritional factors (Embaby 2010).
3 Experimental study
3.1 Aims and overview of the study
The main aim of this research study was to determine the effect of extrusion cooking on the
nutritional properties of amaranth, quinoa, kañiwa and lupine.
The objectives of the experimental study were
1. To chemically characterize quinoa, amaranth, kañiwa and lupine before and after extrusion
processing and,
2. To find out the effects of extrusion cooking on the stability of bioactive compounds.
The overview of the study is presented in Figure 8.
In the first part of the study the seeds of amaranth, quinoa, kañiwa and lupine were chemically
characterization to study the moisture content, protein content, ash and total dietary fiber
content. The raw materials were further analyzed to determine the fatty acid composition,
tocopherols and total phenolic content.
In the second part of the study, the extrudates were processed at two different extrusion
temperatures (140 and 160 °C) containing two different content of tested flours (20% and
50%). The extrudates were further characterized for fatty acid analysis, tocopherol content
and total phenolic content. The effect of extrusion processing on the nutritional properties and
the stability of bioactive compounds was further studied. The interactions between the
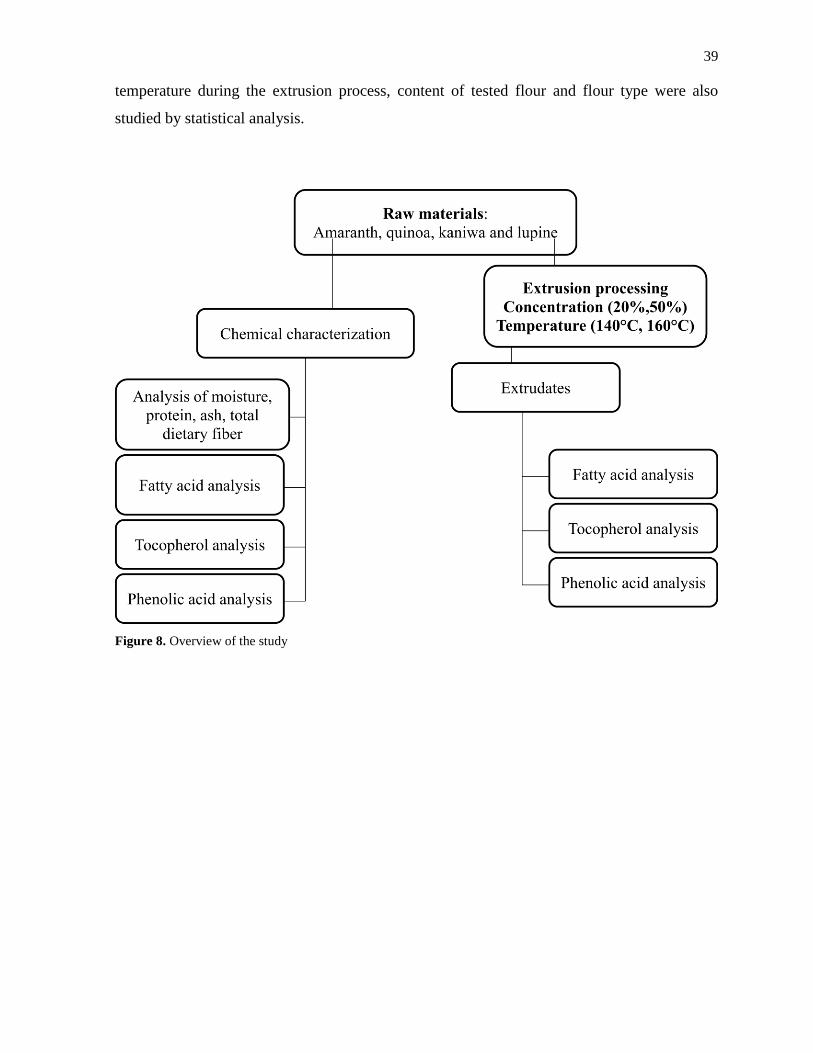
39
temperature during the extrusion process, content of tested flour and flour type were also
studied by statistical analysis.
Figure 8. Overview of the study
40
3.2 Materials
Quinoa (Chenopodium quinoa Willd) (Ziegler,Peru), kañiwa (Chenopodium pallidicaule)
(Ziegler, Peru) and amaranth (Amaranthus caudatus) (Ziegler,Peru) were commercially
available and were imported from Peru. Lupine (Lupinus angustifolius) was obtained from
the experimental fields of Viikki, Finland. Polenta (Risenta, Prisma, Helsinki, Finland) was
obtained from a local store. The seeds were milled in VTT Research centre, Finland while the
extrudate samples were milled into powder form (0.5 mm) (Retsch ZM200, Haan, Germany).
The flour and the extrudate samples were stored in vacuum-packed polyethylene bags and
stored at -18 °C.
The extrusion processing was carried out in a twin screw extruder (Thermo Prism PTW24,
Thermo Haake, Polylab system, Germany). The screw speed was maintained at 500 rpm. The
water content of the feed (14%) was adjusted by peristaltic pump (Watson Marlow 505S,
Watson-Marlow ltd. Falmouth, Cornwall, UK). The temperature profile was also adjusted.
The first section of the extruder was set at 90 °C, second and third at 95 °C, fourth at 100 °C,
fifth at 110 °C and finally the die section was set either at 140 °C or 160 °C during the
extrusion process. The extrudates containing 20 and 50% content of tested flours were
produced at two extrusion temperatures 140°C and 160°C during the extrusion processing.
The raw materials and extrudates were subjected to chemical characterization and
determination of bioactive compounds.
3.3 Methods
3.3.1 Chemical characterization of raw materials and extrudates of amaranth, quinoa,
lupine and kañiwa
All the chemical analyses were conducted according to the instructions of EK125- course with
slight modifications (Lampi and Ollilainen 2012).
41
Determination of ash content
Fresh samples were weighed and ashed using the muffle furnace at 550 °C overnight. Ashing
of the samples at 550 °C results in degradation of food matrix. A small volume of nitric acid
(1-2 ml) was added to the partly dried sample on the following day and the samples were
placed in sand bath for 2 hours maintained at 40 °C. The samples were again placed in the
muffle furnace at 550 °C overnight and collected as residues. The residues contained the total
amount of mineral components present in the sample. The residues were cooled in a
desiccator and weighed to determine the ash content in the samples. The analyses were carried
out in triplicates to all the raw materials.
Analysis of protein content
Fresh samples were weighed in a tecator tubes and a Kjell tablet was added to the tubes.
Concentrated sulphuric acid (95-97%) was added to the tubes and the tubes were placed in a
heating bath maintained at 400 °C for a period of 2 hours. Addition of concentrated sulphuric
acid degrades the organic material and converts nitrogen to ammonium sulphate. Distillation
was carried out using Kjeltec analyzer unit (FOSS ORDIOR 2300, Finland). During the
distillation process, ammonium sulfate reacts with a strong alkali (35% NaOH) and ammonia
is liberated. Ammonia reacts with boric acid (1%) and produces ammonium. The titer value
determines the amount of ammonium present in the sample. The amount of ammonium
detected was directly proportional to the nitrogen content in the sample. The protein content
of the raw materials was detected with respect to total nitrogen, since the proteins are main
constituents of nitrogen compounds. The crude protein present in the raw materials was
determined by multiplying the obtained value with 6.25 (since proteins contain 16% nitrogen).
The analyses were carried out in triplicates to all the raw materials. The protein content was
calculated using equation (1).
Protein content (g/100 g d.m.) = (Vsample – Vreagent blank,ml) x MHCl (mmol/ml) x 14 (mg/mmol)
x6.25 (1)
Vsample is Volume of titrant consumed in the sample (ml)
Vreagent blank is Volume of titrant consumed in the blank (ml)
42
MHCl is Molarity of HCl (0.05 M).
Analysis of dietary fiber content
Fresh samples were weighed in an Erlenmeyer flask and 40 ml buffer solution (pH 8.2, 0.05
M TRIS) was added. 200 µl of α-amylase (Sigma Aldrich, MO, USA) was added to the
sample and incubated for 35 min at 95-100 °C in shaking water bath (Grant OLS 200, UK)
and mixtures were cooled. 10 ml of water and 100 µl of protease (Sigma Aldrich, MO, USA,
50 mg/ml MES-TRIS buffer) were added to the cooled mixture. The mixtures were again
incubated for a period of 30 min at 60 °C in the water bath. The mixtures were adjusted to a
pH 4.1-4.8 with 0.5 M hydrochloric acid (HCl) and 100 µl of amyloglucosidase (Sigma
Aldrich, MO, USA) was added. After the enzymatic treatment of the samples, the fiber was
precipitated with ethanol (purity ≥ 78%) (Altia Oyj Ltd., Rajamäki, Finland). The samples
were dried using the filter suction with ethanol (purity ≥ 95%) (Altia Oyj Ltd., Rajamäki,
Finland) and acetone and the precipitate was collected in the sinter containing dry celite. The
sinters were dried over night at 105 °C and cooled in a desiccator before it was weighed to
determine the content of dietary fiber in the original sample. The analyses were carried out in
triplicates to all the raw materials. The dietary fiber was then further analyzed for residual ash
and protein analysis for weight correction. The total dietary fiber content was determined by
subtracting residual weight from protein content and residual ash and expressed in g/100 g
d.m.
Moisture content analysis
The determination of moisture content of the raw materials and extrudates were performed
gravimetrically according to hot air oven method. The water content in the sample by oven
method was determined by evaporation of water lost in the sample. Approximately 2-3 g fresh
sample was weighted in triplicates and dried in oven at 105 °C overnight and cooled in a
desiccator. The dried samples were then weighed to calculate the moisture content.
43
Analysis of fat content
The fatty acid samples were subjected to extraction using accelerated solvent extractor
(Dionex ASE 200, Sunnyvale, CA; Pressure- 1000 psi) using acetone (Sigma Aldrich, MO,
USA, HPLC grade) as extraction solvent at 100 °C. The extracted lipid samples were
collected in the extraction vials and an internal standard (C 19:0) (Nu Check Prep, Inc.) was
added to each of the extraction vials before carrying out further solvent evaporation. The lipid
samples were collected in 10 ml flasks and dissolved in heptane solution for further
methylation. The lipid samples were subjected to methylation wherein the fatty acids were
converted into methyl esters which were volatile and could be subjected to gas
chromatographic (GC) analysis. During methylation, 5 ml of the extracted lipid extracts were
evaporated to dryness using nitrogen gas stream at 37 °C. The rest of the extracted lipid
samples were stored for carrying out the tocopherol analysis. To the extracted lipid samples,
1ml of 0.5 M sodium hydroxide-methanol solution was added to the test-tubes and was heated
in a boiling water bath for a period of 5 min. 2 ml of boron triflouride-methanol (10%
concentration) solution was added to the cooled test-tubes and again heated for 5 min. The
tubes were once again cooled to room temperature and were mixed with 3ml n-heptane
(HPLC-grade) (b.p. - 98.4 °C) and 2 ml saturated sodium chloride solution. The samples were
vortexed and allowed to stand until the phases were separated. The upper phase containing the
heptane solution was transferred to another test tube containing the drying agent (sodium
sulfate). The samples were transferred to the GC vials and stored in refrigerator for carrying
out GC analysis. The analyses were carried out in triplicates to all the raw materials and
extrudates. The fatty acid samples were analyzed using GC-system (Hewlett Packard 5890,
Palo Alto, USA) having a flame ionization detector (FID) and autosampler. The samples were
separated using the silica-fused capillary column (DB-FFAP, 30 m × 0.32 mm, 0.25 µm,
Agilent technologies). The fatty acid content of the samples was calculated from fatty acid
method esters present in the samples.
44
3.3.2 Analysis of bioactive compounds of flour samples and extrudate samples of
amaranth, quinoa, lupine and kañiwa
Tocopherol analysis
Each tocopherol stock solution (α, β, γ and δ) was diluted with AAS-ethanol (≥99.5%)
(Schwartz et al. 2008). The diluted samples were measured for determining the content of the
stock solutions using spectrophotometer (Perkin Elmer, Lambda 25, Shelton, USA). The
diluted samples were stored at -18 °C for preparing the tocopherol standards.
Preparation of tocopherol standards
Diluted samples (1 ml) for the preparation of tocopherol standards were taken in two different
flasks and were diluted to content of 20 mg/l and 5 mg/l. Ethanol was evaporated under
nitrogen gas and the solutions were again re-dissolved in heptane. The mixture was again
diluted to a content of 2 mg/l and 0.2 mg/l and the standards were stored at -18 °C.
Analysis of tocopherol content
The determination of tocopherols was performed according to procedure given by Schwartz et
al. (2008). The same ASE extracts were used for tocopherol analysis than for fatty acid
analysis. The ASE extracts were collected and stored in HPLC vials (Filter – 0.45 µm) for
carrying out tocopherol analysis. The analyses were carried out in triplicates to all the raw
materials and extrudates. The samples were then detected for the determination of α, β, γ and
δ tocopherols by HPLC (HPLC system, Waters Corporation, Milford, MA, USA; Column
DP-FFAP: 30 m × 0.32 mm, 0.25 µm, Agilent Technologies, Varian Inc, Palo Alto, CA,
USA).
45
Determination of total phenolic content from raw materials and extrudates
Preparation of Gallic acid standards
A stock solution of gallic acid (1 mg/ml) (Extrasynthese, Genay, France) was prepared. The
gallic acid standards were prepared according to the various dilution factors (1:200, 1:100,
1:50, 1:33.3, 1:25, 1:10). 200 µl of the standards were taken and mixed with 1ml of Folin
reagent (1:10) and 0.8ml sodium carbonate (7.5%). The mixture was vortexed and placed in
the dark for a period of 30 min. The samples were measured spectrophotometrically at 765
nm using spectrophotometer (Perkin Elmer, Lambda 25, Shelton, USA). The contents of the
gallic acid standard solutions were calculated to estimate the total phenolic content in the raw
materials and extrudates of amaranth, quinoa, kañiwa and lupine.
Analysis
The total phenolic content in the raw materials and extrudates were carried according to
Gorinstein et al. (2007). To determine the free phenolic content of the samples, 50 mg of the
fresh sample was weighed and mixed with 5 ml 50% methanol-water (1:1) solution. The
mixture was heated at 90 °C for a period of 3 hours in a hot water bath (Falc Instruments,
Treviglio, Italy). The samples were cooled in room temperature and diluted to 10 ml with
methanol. The diluted sample was subjected to centrifugation at 5000 rpm for 5 min. To
determine the free and bound phenolic content of the samples, approximately 50 mg of the
fresh sample was weighed and mixed with 5 ml solution containing 1.2 M hydrochloric acid
in 50% methanol-water (1:1) solution. The samples were then treated with the similar
procedure as normal treatment involving heating and centrifugation. The supernatants were
collected from both the extraction methods and were analyzed for the determination of free
and bound phenolic content by the Folin-Ciocalteu method. During the methanol-water
treatment, the free phenolics in the raw materials and extrudates was determined, while the
acid hydrolysis treatment produced free and bound phenolics by breaking the glycosidic bond
thereby releasing bound phenolics from the cell matrix by the addition of acid in the raw
materials and the extrudates. The samples were measured using spectrophotometer at 765 nm
46
(Perkin Elmer, Lambda 25, Shelton, USA). The analyses were carried out in triplicates to all
the raw materials and extrudates.
3.3.3 Statistical analysis
The chemical composition and the content of bioactive compounds of the raw materials and
the extrudate samples were analyzed in triplicates and the data were reported as means and
standard deviations (SD). Principal component analysis (PCA) and partial least squares
regression analysis (PLS) was carried out using the Unscrambler X 10.1 program (CAMO
software). The corresponding calculated value (T.V) was obtained from the data derived from
the raw materials depending on the contents of tested flour (20 and 50%) and polenta. The
T.V was then compared with extrudates processed at 140 and 160 °C in order to determine the
effect of extrusion processing. The pretreatment of the data in PCA and PLS data analyses
was to center and scale the data. The other statistical analysis of the data was performed using
MATLAB (R2012a, The Mathworks, Inc, U.S.A). A three-way ANOVA and Tukey-Kramer
test were performed for the data consisting of the experimental and calculated values of the
extrudates (140 and 160 °C) and the calculated values for the flour mixture. Physical
measurements data of the extrudates were obtained from Martin Ramos research study
(unpublished data).
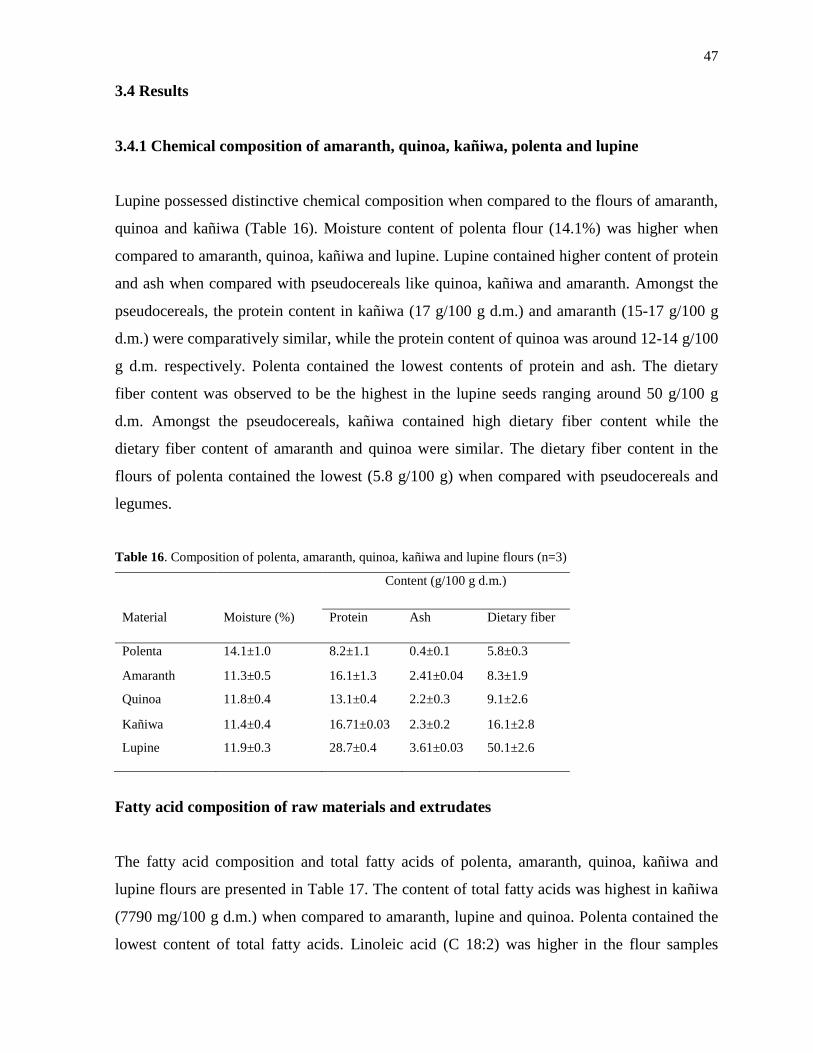
47
3.4 Results
3.4.1 Chemical composition of amaranth, quinoa, kañiwa, polenta and lupine
Lupine possessed distinctive chemical composition when compared to the flours of amaranth,
quinoa and kañiwa (Table 16). Moisture content of polenta flour (14.1%) was higher when
compared to amaranth, quinoa, kañiwa and lupine. Lupine contained higher content of protein
and ash when compared with pseudocereals like quinoa, kañiwa and amaranth. Amongst the
pseudocereals, the protein content in kañiwa (17 g/100 g d.m.) and amaranth (15-17 g/100 g
d.m.) were comparatively similar, while the protein content of quinoa was around 12-14 g/100
g d.m. respectively. Polenta contained the lowest contents of protein and ash. The dietary
fiber content was observed to be the highest in the lupine seeds ranging around 50 g/100 g
d.m. Amongst the pseudocereals, kañiwa contained high dietary fiber content while the
dietary fiber content of amaranth and quinoa were similar. The dietary fiber content in the
flours of polenta contained the lowest (5.8 g/100 g) when compared with pseudocereals and
legumes.
Table 16. Composition of polenta, amaranth, quinoa, kañiwa and lupine flours (n=3)
Content (g/100 g d.m.)
Material Moisture (%) Protein Ash Dietary fiber
Polenta 14.1±1.0 8.2±1.1 0.4±0.1 5.8±0.3
Amaranth 11.3±0.5 16.1±1.3 2.41±0.04 8.3±1.9
Quinoa 11.8±0.4 13.1±0.4 2.2±0.3 9.1±2.6
Kañiwa 11.4±0.4 16.71±0.03 2.3±0.2 16.1±2.8
Lupine 11.9±0.3 28.7±0.4 3.61±0.03 50.1±2.6
Fatty acid composition of raw materials and extrudates
The fatty acid composition and total fatty acids of polenta, amaranth, quinoa, kañiwa and
lupine flours are presented in Table 17. The content of total fatty acids was highest in kañiwa
(7790 mg/100 g d.m.) when compared to amaranth, lupine and quinoa. Polenta contained the
lowest content of total fatty acids. Linoleic acid (C 18:2) was higher in the flour samples
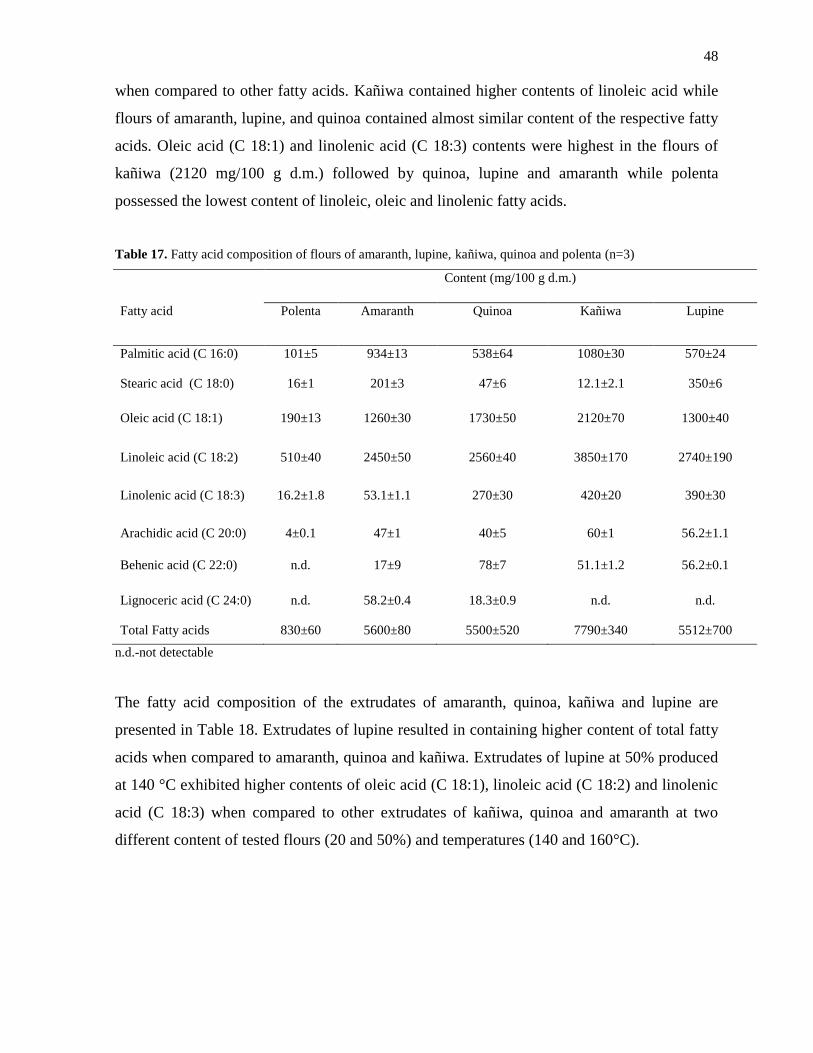
48
when compared to other fatty acids. Kañiwa contained higher contents of linoleic acid while
flours of amaranth, lupine, and quinoa contained almost similar content of the respective fatty
acids. Oleic acid (C 18:1) and linolenic acid (C 18:3) contents were highest in the flours of
kañiwa (2120 mg/100 g d.m.) followed by quinoa, lupine and amaranth while polenta
possessed the lowest content of linoleic, oleic and linolenic fatty acids.
Table 17. Fatty acid composition of flours of amaranth, lupine, kañiwa, quinoa and polenta (n=3)
Content (mg/100 g d.m.)
Fatty acid Polenta Amaranth Quinoa Kañiwa Lupine
Palmitic acid (C 16:0) 101±5 934±13 538±64 1080±30 570±24
Stearic acid (C 18:0) 16±1 201±3 47±6 12.1±2.1 350±6
Oleic acid (C 18:1) 190±13 1260±30 1730±50 2120±70 1300±40
Linoleic acid (C 18:2) 510±40 2450±50 2560±40 3850±170 2740±190
Linolenic acid (C 18:3) 16.2±1.8 53.1±1.1 270±30 420±20 390±30
Arachidic acid (C 20:0) 4±0.1 47±1 40±5 60±1 56.2±1.1
Behenic acid (C 22:0) n.d. 17±9 78±7 51.1±1.2 56.2±0.1
Lignoceric acid (C 24:0) n.d. 58.2±0.4 18.3±0.9 n.d. n.d.
Total Fatty acids 830±60 5600±80 5500±520 7790±340 5512±700
n.d.-not detectable
The fatty acid composition of the extrudates of amaranth, quinoa, kañiwa and lupine are
presented in Table 18. Extrudates of lupine resulted in containing higher content of total fatty
acids when compared to amaranth, quinoa and kañiwa. Extrudates of lupine at 50% produced
at 140 °C exhibited higher contents of oleic acid (C 18:1), linoleic acid (C 18:2) and linolenic
acid (C 18:3) when compared to other extrudates of kañiwa, quinoa and amaranth at two
different content of tested flours (20 and 50%) and temperatures (140 and 160°C).
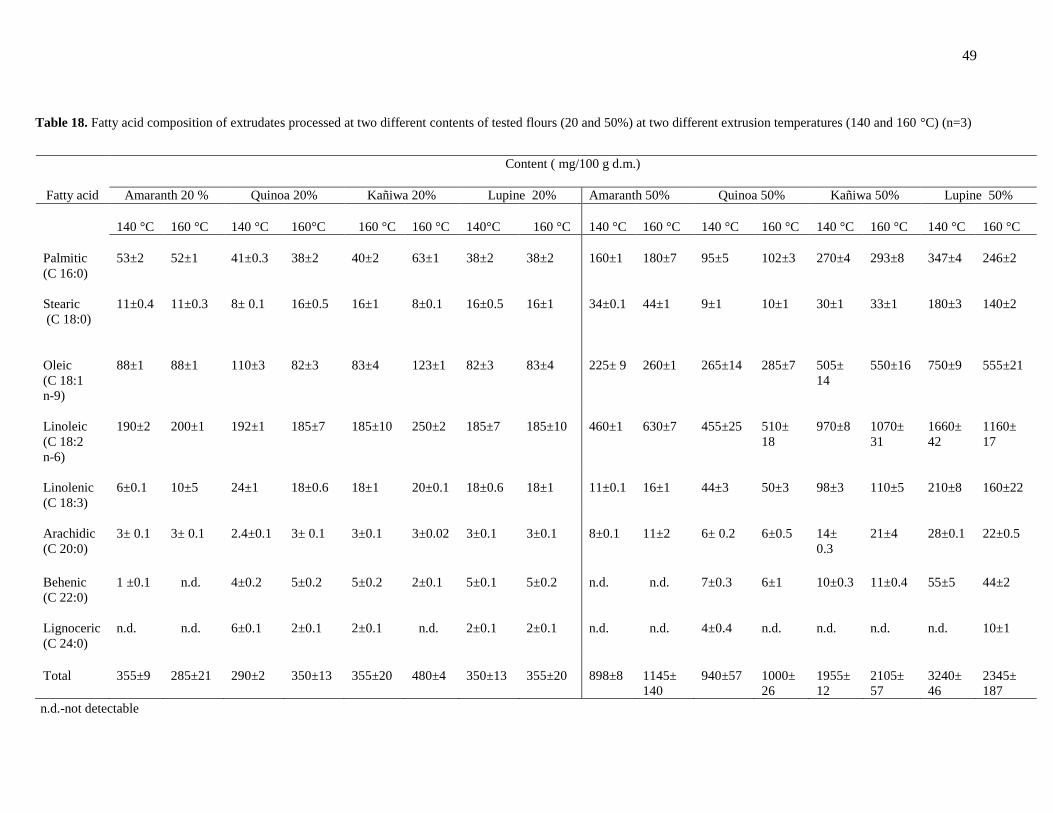
49
Content ( mg/100 g d.m.)
Fatty acid Amaranth 20 % Quinoa 20% Kañiwa 20% Lupine 20% Amaranth 50% Quinoa 50% Kañiwa 50% Lupine 50%
140 °C
160 °C
140 °C
160°C
160 °C
160 °C
140°C
160 °C
140 °C
160 °C
140 °C
160 °C
140 °C
160 °C
140 °C
160 °C
Palmitic
(C 16:0)
53±2
52±1
41±0.3
38±2
40±2
63±1
38±2
38±2
160±1
180±7
95±5
102±3
270±4
293±8
347±4
246±2
Stearic
(C 18:0)
11±0.4
11±0.3
8± 0.1
16±0.5
16±1
8±0.1
16±0.5
16±1
34±0.1
44±1
9±1
10±1
30±1
33±1
180±3
140±2
Oleic
(C 18:1
n-9)
88±1
88±1
110±3
82±3
83±4
123±1
82±3
83±4
225± 9
260±1
265±14
285±7
505±
14
550±16
750±9
555±21
Linoleic
(C 18:2
n-6)
190±2
200±1
192±1
185±7
185±10
250±2
185±7
185±10
460±1
630±7
455±25
510±
18
970±8
1070±
31
1660±
42
1160±
17
Linolenic
(C 18:3)
6±0.1
10±5
24±1
18±0.6
18±1
20±0.1
18±0.6
18±1
11±0.1
16±1
44±3
50±3
98±3
110±5
210±8
160±22
Arachidic
(C 20:0)
3± 0.1
3± 0.1
2.4±0.1
3± 0.1
3±0.1
3±0.02
3±0.1
3±0.1
8±0.1
11±2
6± 0.2
6±0.5
14±
0.3
21±4
28±0.1
22±0.5
Behenic
(C 22:0)
1 ±0.1
n.d.
4±0.2
5±0.2
5±0.2
2±0.1
5±0.1
5±0.2
n.d.
n.d.
7±0.3
6±1
10±0.3
11±0.4
55±5
44±2
Lignoceric
(C 24:0)
n.d.
n.d.
6±0.1
2±0.1
2±0.1
n.d.
2±0.1
2±0.1
n.d.
n.d.
4±0.4
n.d.
n.d.
n.d.
n.d.
10±1
Total
355±9
285±21
290±2
350±13
355±20
480±4
350±13
355±20
898±8
1145±
140
940±57
1000±
26
1955±
12
2105±
57
3240±
46
2345±
187
n.d.-not detectable
Table 1 Table 18. Fatty acid composition of extrudates processed at two different contents of tested flours (20 and 50%) at two different extrusion temperatures (140 and 160 °C) (n=3)
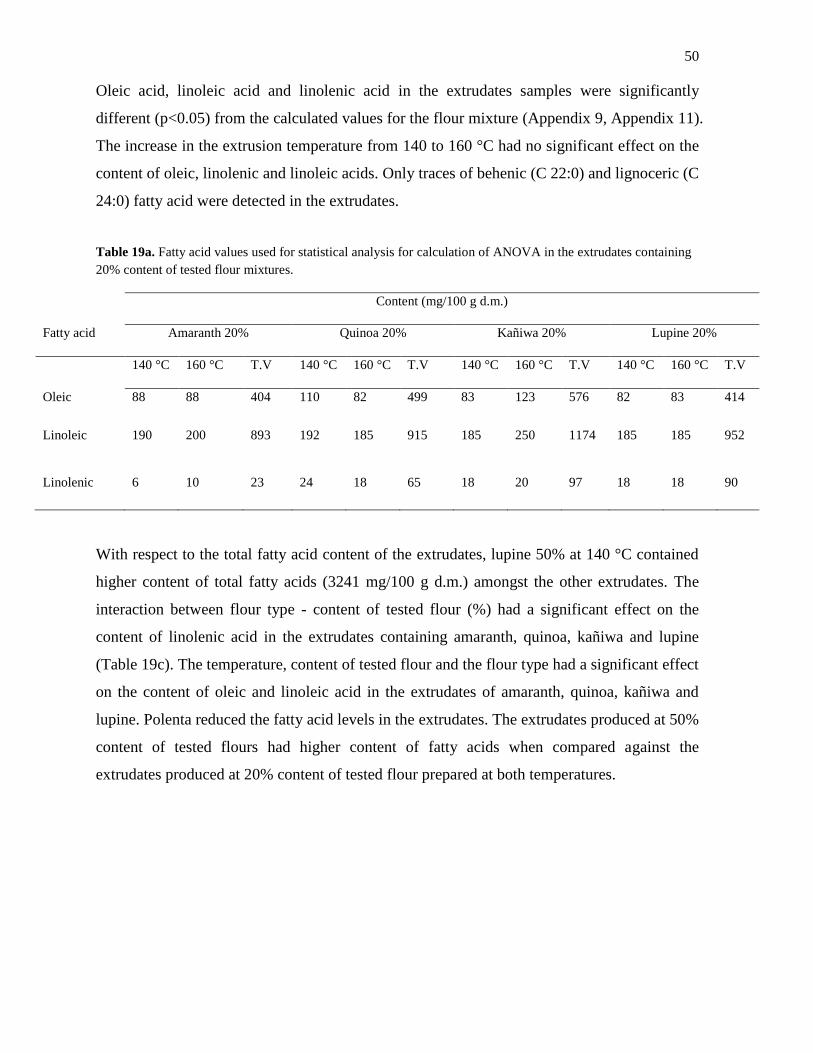
50
Oleic acid, linoleic acid and linolenic acid in the extrudates samples were significantly
different (p<0.05) from the calculated values for the flour mixture (Appendix 9, Appendix 11).
The increase in the extrusion temperature from 140 to 160 °C had no significant effect on the
content of oleic, linolenic and linoleic acids. Only traces of behenic (C 22:0) and lignoceric (C
24:0) fatty acid were detected in the extrudates.
Table 19a. Fatty acid values used for statistical analysis for calculation of ANOVA in the extrudates containing
20% content of tested flour mixtures.
Content (mg/100 g d.m.)
Fatty acid Amaranth 20% Quinoa 20% Kañiwa 20% Lupine 20%
140 °C 160 °C T.V 140 °C 160 °C T.V 140 °C 160 °C T.V 140 °C 160 °C T.V
Oleic 88 88 404 110 82 499 83 123 576 82 83 414
Linoleic 190 200 893 192 185 915 185 250 1174 185 185 952
Linolenic 6 10 23 24 18 65 18 20 97 18 18 90
With respect to the total fatty acid content of the extrudates, lupine 50% at 140 °C contained
higher content of total fatty acids (3241 mg/100 g d.m.) amongst the other extrudates. The
interaction between flour type - content of tested flour (%) had a significant effect on the
content of linolenic acid in the extrudates containing amaranth, quinoa, kañiwa and lupine
(Table 19c). The temperature, content of tested flour and the flour type had a significant effect
on the content of oleic and linoleic acid in the extrudates of amaranth, quinoa, kañiwa and
lupine. Polenta reduced the fatty acid levels in the extrudates. The extrudates produced at 50%
content of tested flours had higher content of fatty acids when compared against the
extrudates produced at 20% content of tested flour prepared at both temperatures.
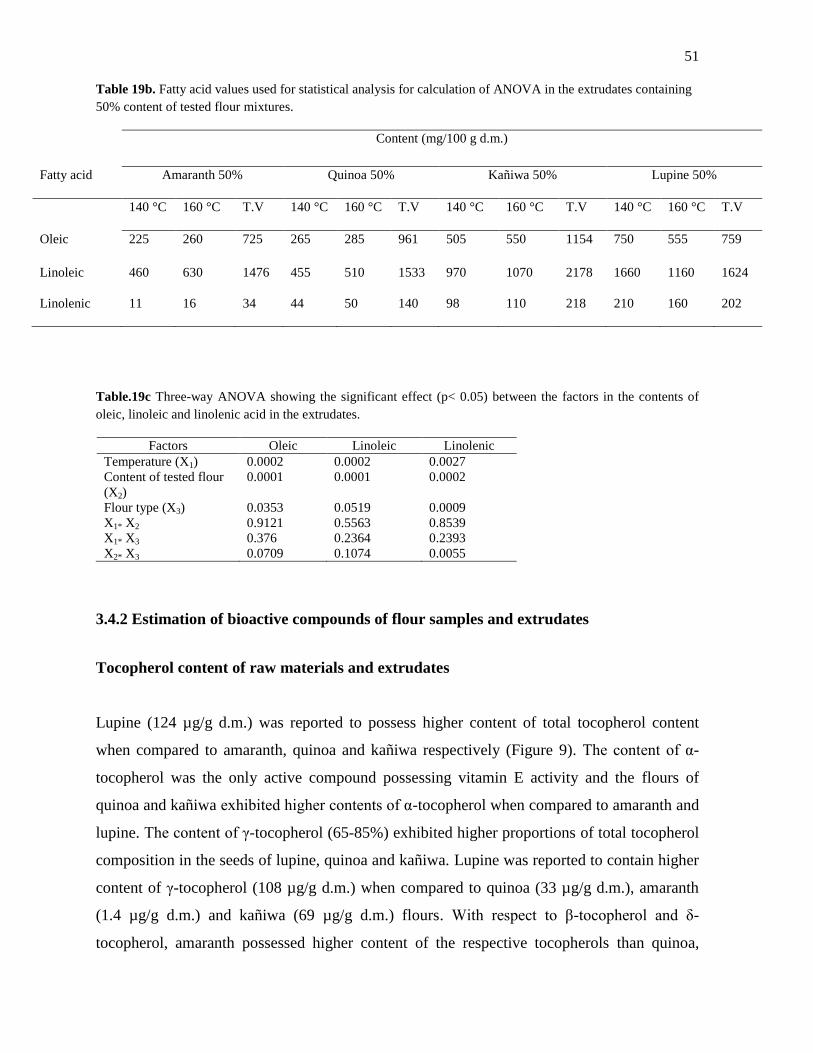
51
Table 19b. Fatty acid values used for statistical analysis for calculation of ANOVA in the extrudates containing
50% content of tested flour mixtures.
Content (mg/100 g d.m.)
Fatty acid Amaranth 50% Quinoa 50% Kañiwa 50% Lupine 50%
140 °C 160 °C T.V 140 °C 160 °C T.V 140 °C 160 °C T.V 140 °C 160 °C T.V
Oleic 225 260 725 265 285 961 505 550 1154 750 555 759
Linoleic 460 630 1476 455 510 1533 970 1070 2178 1660 1160 1624
Linolenic 11 16 34 44 50 140 98 110 218 210 160 202
Table.19c Three-way ANOVA showing the significant effect (p< 0.05) between the factors in the contents of
oleic, linoleic and linolenic acid in the extrudates.
Factors Oleic Linoleic Linolenic
Temperature (X1) 0.0002 0.0002 0.0027
Content of tested flour
(X2)
0.0001 0.0001 0.0002
Flour type (X3) 0.0353 0.0519 0.0009
X1* X2 0.9121 0.5563 0.8539
X1* X3 0.376 0.2364 0.2393
X2* X3 0.0709 0.1074 0.0055
3.4.2 Estimation of bioactive compounds of flour samples and extrudates
Tocopherol content of raw materials and extrudates
Lupine (124 µg/g d.m.) was reported to possess higher content of total tocopherol content
when compared to amaranth, quinoa and kañiwa respectively (Figure 9). The content of α-
tocopherol was the only active compound possessing vitamin E activity and the flours of
quinoa and kañiwa exhibited higher contents of α-tocopherol when compared to amaranth and
lupine. The content of γ-tocopherol (65-85%) exhibited higher proportions of total tocopherol
composition in the seeds of lupine, quinoa and kañiwa. Lupine was reported to contain higher
content of γ-tocopherol (108 µg/g d.m.) when compared to quinoa (33 µg/g d.m.), amaranth
(1.4 µg/g d.m.) and kañiwa (69 µg/g d.m.) flours. With respect to β-tocopherol and δ-
tocopherol, amaranth possessed higher content of the respective tocopherols than quinoa,
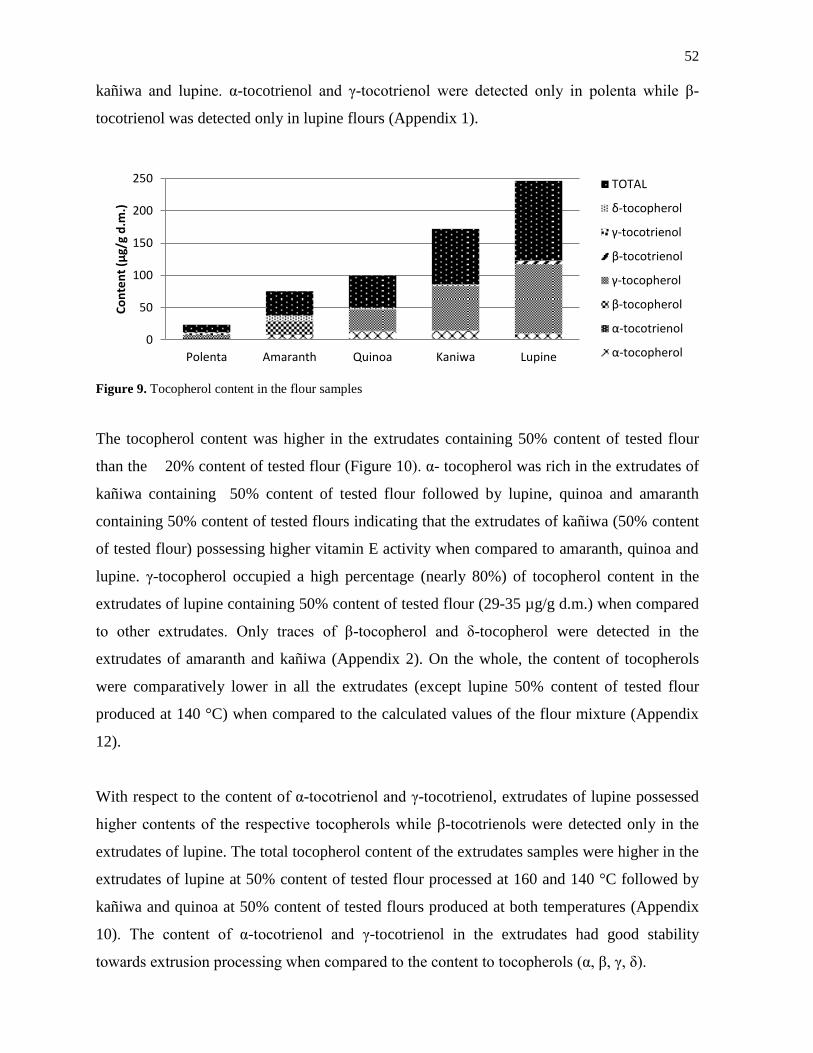
52
kañiwa and lupine. α-tocotrienol and γ-tocotrienol were detected only in polenta while β-
tocotrienol was detected only in lupine flours (Appendix 1).
Figure 9. Tocopherol content in the flour samples
The tocopherol content was higher in the extrudates containing 50% content of tested flour
than the 20% content of tested flour (Figure 10). α- tocopherol was rich in the extrudates of
kañiwa containing 50% content of tested flour followed by lupine, quinoa and amaranth
containing 50% content of tested flours indicating that the extrudates of kañiwa (50% content
of tested flour) possessing higher vitamin E activity when compared to amaranth, quinoa and
lupine. γ-tocopherol occupied a high percentage (nearly 80%) of tocopherol content in the
extrudates of lupine containing 50% content of tested flour (29-35 µg/g d.m.) when compared
to other extrudates. Only traces of β-tocopherol and δ-tocopherol were detected in the
extrudates of amaranth and kañiwa (Appendix 2). On the whole, the content of tocopherols
were comparatively lower in all the extrudates (except lupine 50% content of tested flour
produced at 140 °C) when compared to the calculated values of the flour mixture (Appendix
12).
With respect to the content of α-tocotrienol and γ-tocotrienol, extrudates of lupine possessed
higher contents of the respective tocopherols while β-tocotrienols were detected only in the
extrudates of lupine. The total tocopherol content of the extrudates samples were higher in the
extrudates of lupine at 50% content of tested flour processed at 160 and 140 °C followed by
kañiwa and quinoa at 50% content of tested flours produced at both temperatures (Appendix
10). The content of α-tocotrienol and γ-tocotrienol in the extrudates had good stability
towards extrusion processing when compared to the content to tocopherols (α, β, γ, δ).
0
50
100
150
200
250
Polenta Amaranth Quinoa Kaniwa Lupine
Co
nte
nt
(µg/
g d
.m.)
TOTAL
δ-tocopherol
γ-tocotrienol
β-tocotrienol
γ-tocopherol
β-tocopherol
α-tocotrienol
α-tocopherol
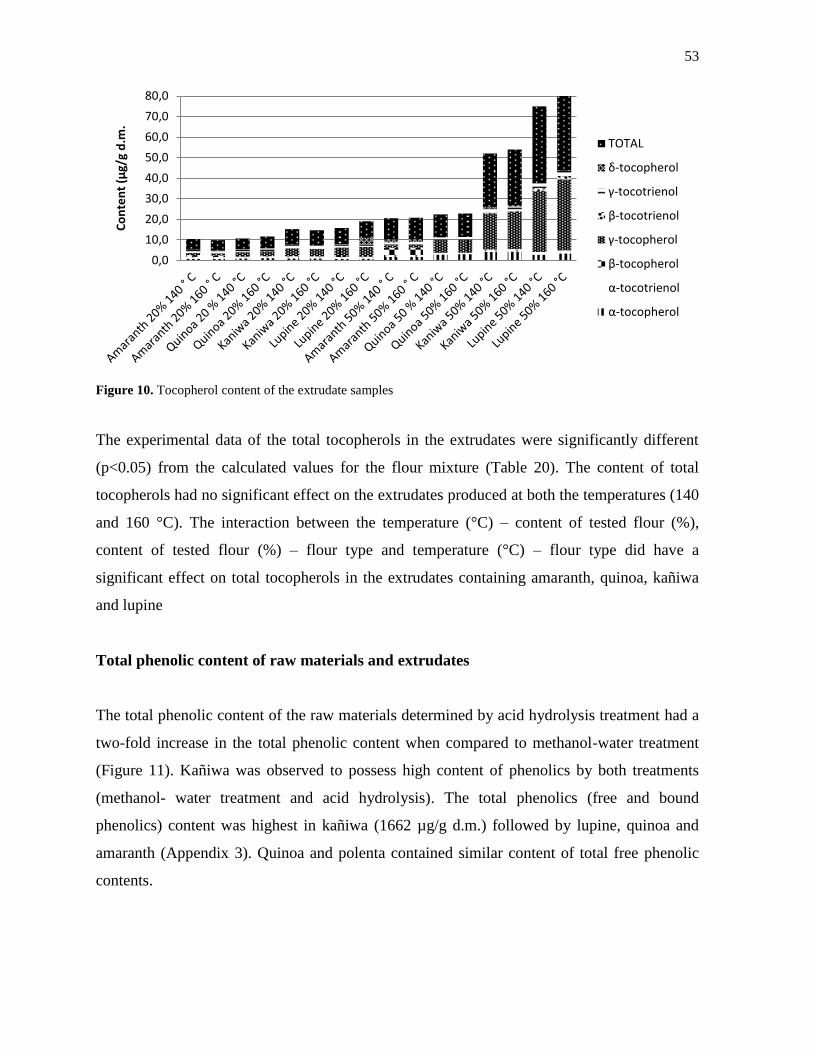
53
Figure 10. Tocopherol content of the extrudate samples
The experimental data of the total tocopherols in the extrudates were significantly different
(p<0.05) from the calculated values for the flour mixture (Table 20). The content of total
tocopherols had no significant effect on the extrudates produced at both the temperatures (140
and 160 °C). The interaction between the temperature (°C) – content of tested flour (%),
content of tested flour (%) – flour type and temperature (°C) – flour type did have a
significant effect on total tocopherols in the extrudates containing amaranth, quinoa, kañiwa
and lupine
Total phenolic content of raw materials and extrudates
The total phenolic content of the raw materials determined by acid hydrolysis treatment had a
two-fold increase in the total phenolic content when compared to methanol-water treatment
(Figure 11). Kañiwa was observed to possess high content of phenolics by both treatments
(methanol- water treatment and acid hydrolysis). The total phenolics (free and bound
phenolics) content was highest in kañiwa (1662 µg/g d.m.) followed by lupine, quinoa and
amaranth (Appendix 3). Quinoa and polenta contained similar content of total free phenolic
contents.
0,0
10,0
20,0
30,0
40,0
50,0
60,0
70,0
80,0
Co
nte
nt
(µg/
g d
.m.
TOTAL
δ-tocopherol
γ-tocotrienol
β-tocotrienol
γ-tocopherol
β-tocopherol
α-tocotrienol
α-tocopherol
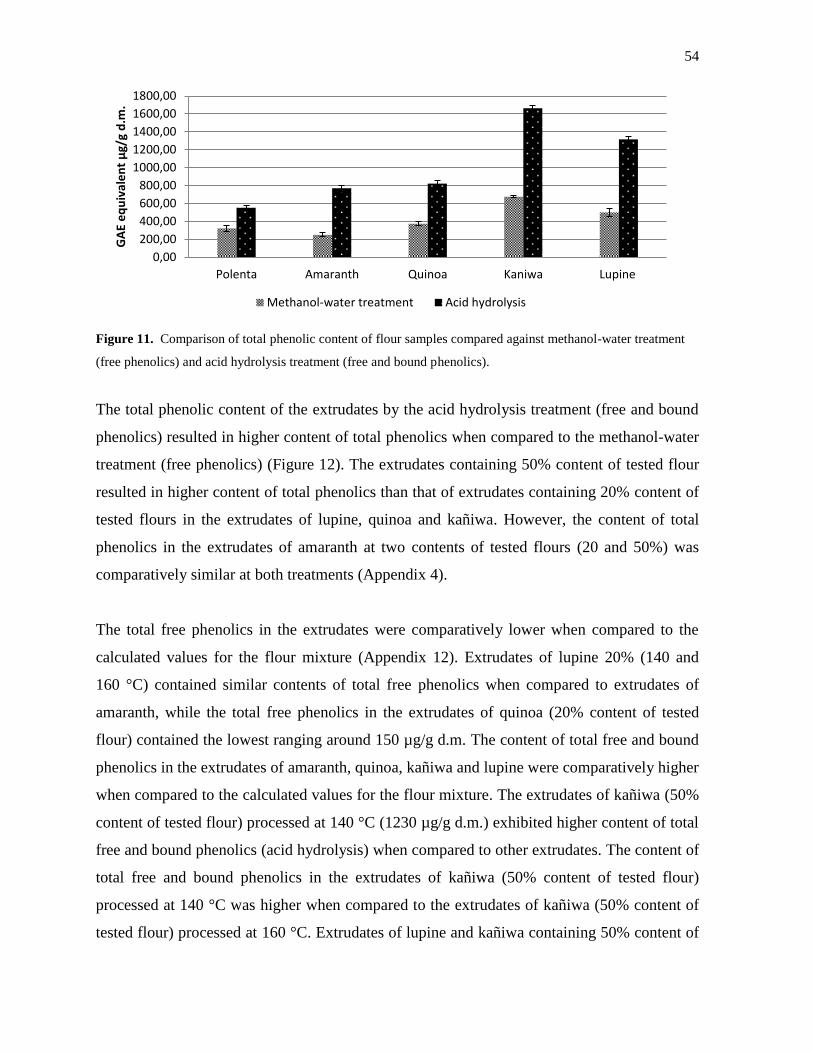
54
Figure 11. Comparison of total phenolic content of flour samples compared against methanol-water treatment
(free phenolics) and acid hydrolysis treatment (free and bound phenolics).
The total phenolic content of the extrudates by the acid hydrolysis treatment (free and bound
phenolics) resulted in higher content of total phenolics when compared to the methanol-water
treatment (free phenolics) (Figure 12). The extrudates containing 50% content of tested flour
resulted in higher content of total phenolics than that of extrudates containing 20% content of
tested flours in the extrudates of lupine, quinoa and kañiwa. However, the content of total
phenolics in the extrudates of amaranth at two contents of tested flours (20 and 50%) was
comparatively similar at both treatments (Appendix 4).
The total free phenolics in the extrudates were comparatively lower when compared to the
calculated values for the flour mixture (Appendix 12). Extrudates of lupine 20% (140 and
160 °C) contained similar contents of total free phenolics when compared to extrudates of
amaranth, while the total free phenolics in the extrudates of quinoa (20% content of tested
flour) contained the lowest ranging around 150 µg/g d.m. The content of total free and bound
phenolics in the extrudates of amaranth, quinoa, kañiwa and lupine were comparatively higher
when compared to the calculated values for the flour mixture. The extrudates of kañiwa (50%
content of tested flour) processed at 140 °C (1230 µg/g d.m.) exhibited higher content of total
free and bound phenolics (acid hydrolysis) when compared to other extrudates. The content of
total free and bound phenolics in the extrudates of kañiwa (50% content of tested flour)
processed at 140 °C was higher when compared to the extrudates of kañiwa (50% content of
tested flour) processed at 160 °C. Extrudates of lupine and kañiwa containing 50% content of
0,00
200,00
400,00
600,00
800,00
1000,00
1200,00
1400,00
1600,00
1800,00
Polenta Amaranth Quinoa Kaniwa Lupine
GA
E e
qu
ival
en
t µ
g/g
d.m
.
Methanol-water treatment Acid hydrolysis
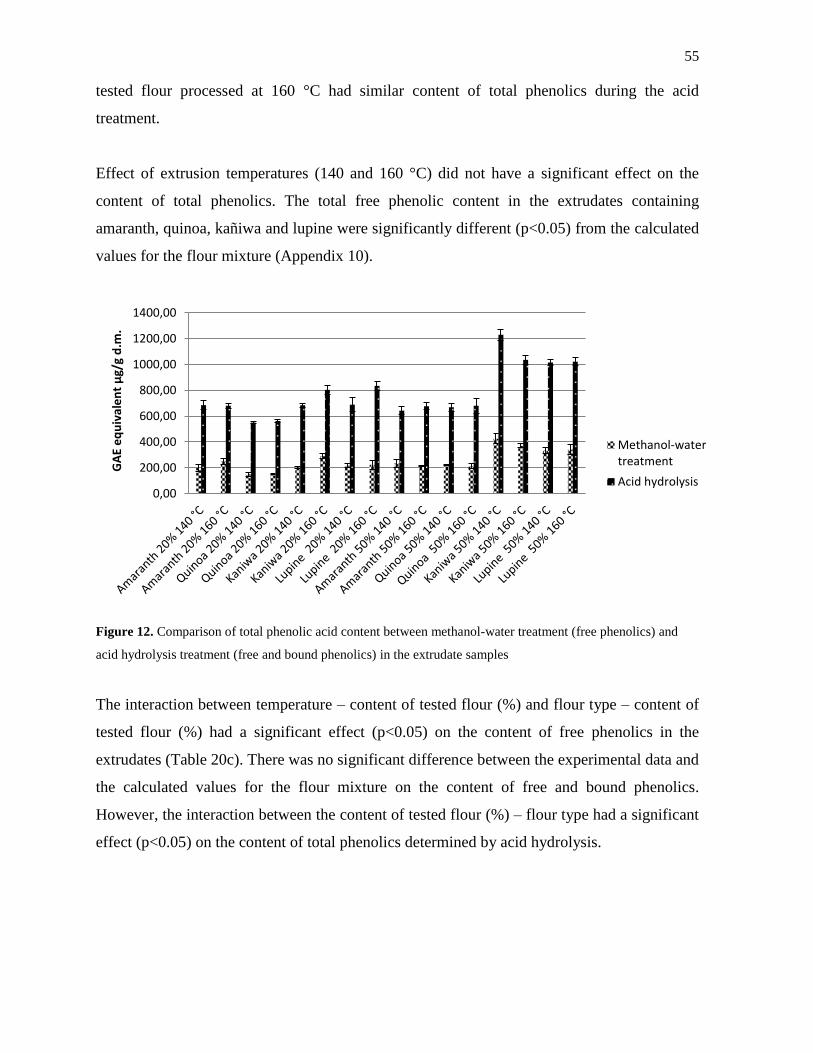
55
tested flour processed at 160 °C had similar content of total phenolics during the acid
treatment.
Effect of extrusion temperatures (140 and 160 °C) did not have a significant effect on the
content of total phenolics. The total free phenolic content in the extrudates containing
amaranth, quinoa, kañiwa and lupine were significantly different (p<0.05) from the calculated
values for the flour mixture (Appendix 10).
Figure 12. Comparison of total phenolic acid content between methanol-water treatment (free phenolics) and
acid hydrolysis treatment (free and bound phenolics) in the extrudate samples
The interaction between temperature – content of tested flour (%) and flour type – content of
tested flour (%) had a significant effect (p<0.05) on the content of free phenolics in the
extrudates (Table 20c). There was no significant difference between the experimental data and
the calculated values for the flour mixture on the content of free and bound phenolics.
However, the interaction between the content of tested flour (%) – flour type had a significant
effect (p<0.05) on the content of total phenolics determined by acid hydrolysis.
0,00
200,00
400,00
600,00
800,00
1000,00
1200,00
1400,00
GA
E e
qu
ival
en
t µ
g/g
d.m
.
Methanol-watertreatment
Acid hydrolysis
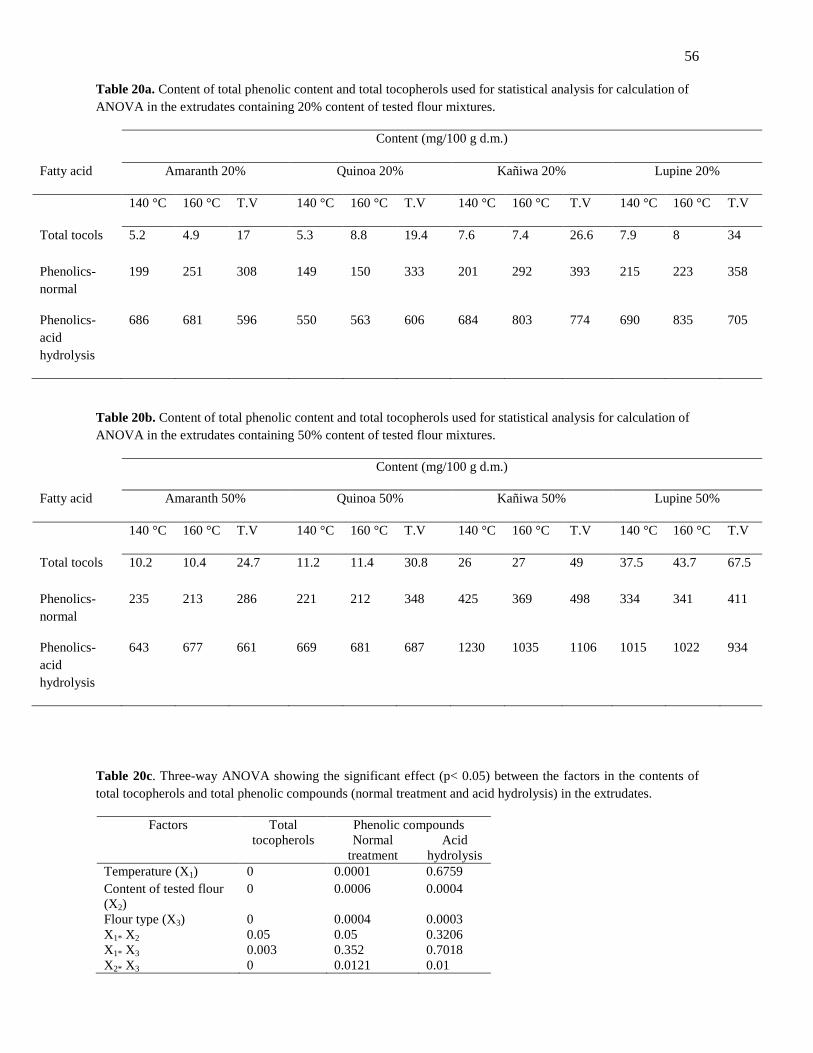
56
Table 20a. Content of total phenolic content and total tocopherols used for statistical analysis for calculation of
ANOVA in the extrudates containing 20% content of tested flour mixtures.
Content (mg/100 g d.m.)
Fatty acid Amaranth 20% Quinoa 20% Kañiwa 20% Lupine 20%
140 °C 160 °C T.V 140 °C 160 °C T.V 140 °C 160 °C T.V 140 °C 160 °C T.V
Total tocols 5.2 4.9 17 5.3 8.8 19.4 7.6 7.4 26.6 7.9 8 34
Phenolics-
normal
199 251 308 149 150 333 201 292 393 215 223 358
Phenolics-
acid
hydrolysis
686 681 596 550 563 606 684 803 774 690 835 705
Table 20b. Content of total phenolic content and total tocopherols used for statistical analysis for calculation of
ANOVA in the extrudates containing 50% content of tested flour mixtures.
Content (mg/100 g d.m.)
Fatty acid Amaranth 50% Quinoa 50% Kañiwa 50% Lupine 50%
140 °C 160 °C T.V 140 °C 160 °C T.V 140 °C 160 °C T.V 140 °C 160 °C T.V
Total tocols 10.2 10.4 24.7 11.2 11.4 30.8 26 27 49 37.5 43.7 67.5
Phenolics-
normal
235 213 286 221 212 348 425 369 498 334 341 411
Phenolics-
acid
hydrolysis
643 677 661 669 681 687 1230 1035 1106 1015 1022 934
Table 20c. Three-way ANOVA showing the significant effect (p< 0.05) between the factors in the contents of
total tocopherols and total phenolic compounds (normal treatment and acid hydrolysis) in the extrudates.
Factors Total
tocopherols
Phenolic compounds
Normal
treatment
Acid
hydrolysis
Temperature (X1) 0 0.0001 0.6759
Content of tested flour
(X2)
0 0.0006 0.0004
Flour type (X3) 0 0.0004 0.0003
X1* X2 0.05 0.05 0.3206
X1* X3 0.003 0.352 0.7018
X2* X3 0 0.0121 0.01
57
3.4.3 PCA and PLS data analysis of extrudates
The PCA analyses on the individual extrudates containing 20% content of tested flour are
presented (Figure 13a). Three principal components were scaled with respect to validations
and calibrations in the PCA data analysis in the extrudates containing 20% content of tested
flour. The explained variances of calibration (R2Y) and validation (Q
2Y) in PCA data model
of the extrudates containing 20% content of tested flour were found to be high (99.7%, 77.6%)
suggesting for the model a good fit to the data. The calibration variances for the first principal
component (35%) and the difference between the first and second principal component (33%)
in PCA data analysis for 20% content of tested flours were calculated.
Pressure and WCE (water content of extrudates) had a positive correlation with total
phenolics in the extrudates containing 20% content of tested flour (Figure 13b). With respect
to the fatty acid content of the extrudates, linolenic and linoleic acids had a negative
correlation towards pressure while stearic acid had a positive correlation with pressure and
WCE. Pressure was also observed to be negatively correlated with torque during the
processing of extrudates. Total phenolic contents and γ-tocopherol had a negative correlation
with hardness and torque. Torque had a positive correlation with linoleic, oleic acid, α-
tocopherol, β-tocopherol and a negative correlation with linolenic, total phenolic contents, γ-
tocopherol and stearic acid. The expansion of extrudates during the extrusion processing had a
positive correlation with the β-tocopherol, linoleic and oleic acids and negative correlation
with linolenic, and α-tocopherol.
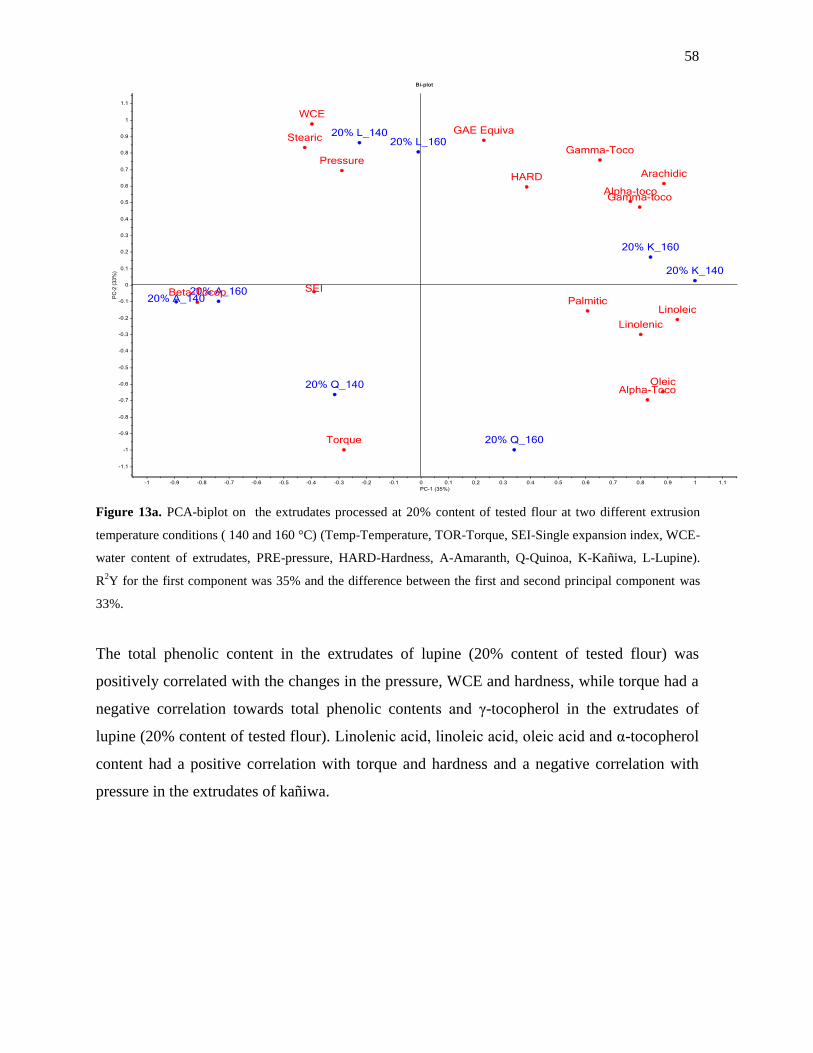
58
Figure 13a. PCA-biplot on the extrudates processed at 20% content of tested flour at two different extrusion
temperature conditions ( 140 and 160 °C) (Temp-Temperature, TOR-Torque, SEI-Single expansion index, WCE-
water content of extrudates, PRE-pressure, HARD-Hardness, A-Amaranth, Q-Quinoa, K-Kañiwa, L-Lupine).
R2Y for the first component was 35% and the difference between the first and second principal component was
33%.
The total phenolic content in the extrudates of lupine (20% content of tested flour) was
positively correlated with the changes in the pressure, WCE and hardness, while torque had a
negative correlation towards total phenolic contents and γ-tocopherol in the extrudates of
lupine (20% content of tested flour). Linolenic acid, linoleic acid, oleic acid and α-tocopherol
content had a positive correlation with torque and hardness and a negative correlation with
pressure in the extrudates of kañiwa.

59
Figure 13b. PCA plot explaining the correlation of extrudates containing 20% content of tested flour against
different extrusión parameters.
Extrudates of kañiwa (20% content of tested flour) were associated with γ-tocopherol, α-
tocotrienol and γ-tocotrienol involving important changes in pressure and hardness during the
extrusion processing. The changes in the torque during the extrusion processing of kañiwa
had a negative correlation with total phenolic content and γ-tocopherol in the extrudates of
kañiwa (20% content of tested flour).
WCE and hardness had a positive correlation towards linolenic acid, oleic acid and linoleic
acid in the extrudates containing 50% content of tested flour (Figure 14a). With respect to
fatty acids, linolenic acid, oleic acid and linoleic acid also resulted in negative correlation
with torque, pressure and SEI of the extrudates. The α-tocopherol, γ-tocopherol and total
phenolic contents in the extrudates showed a positive correlation with WCE and hardness.
Pressure, torque and SEI of the extrudates resulted in a negative correlation with α-tocopherol,
γ-tocopherol and total phenolic contents. With respect to β-tocopherol, there was a strong
positive correlation with pressure and torque and also was reported to have a negative
correlation with WCE and hardness of the extrudates.
According to PCA data analysis, the total phenolic contents and γ-tocopherol in the extrudates
of kañiwa (50% content of tested flour) showed a positive correlation with pressure (Figure
14b). Three principal components were included in the PCA model for the extrudates
containing 50% content of tested flour. The explained variances of calibration and validation
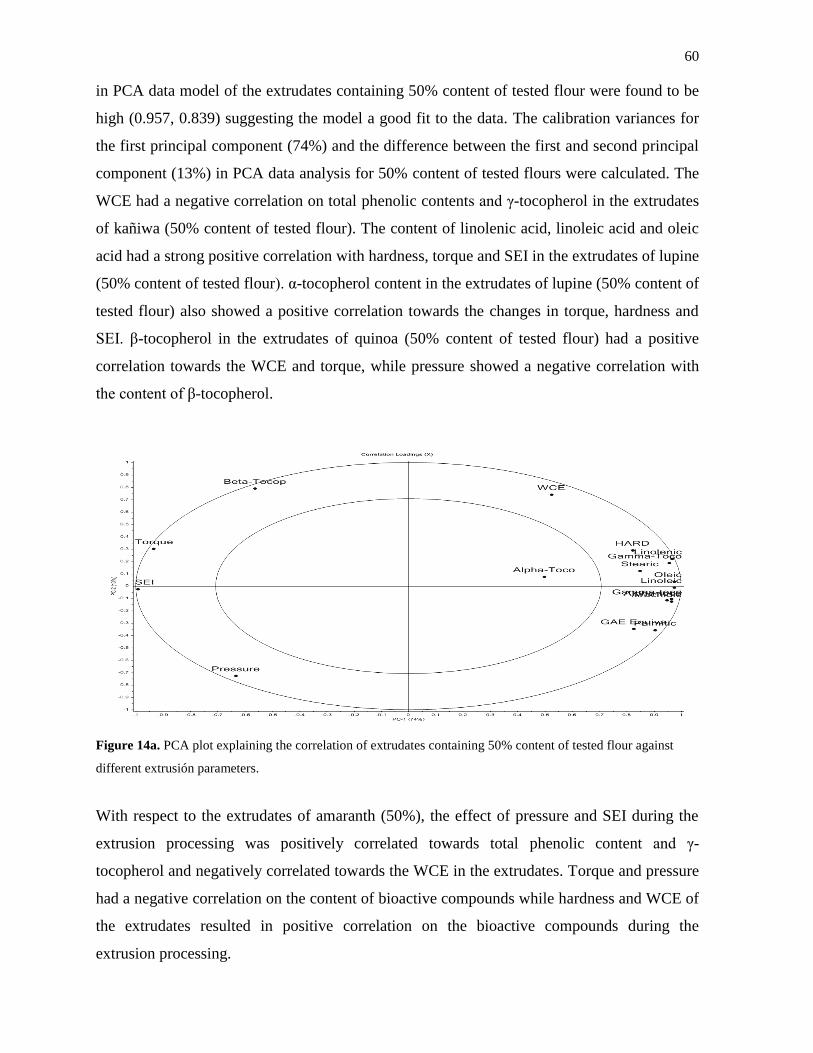
60
in PCA data model of the extrudates containing 50% content of tested flour were found to be
high (0.957, 0.839) suggesting the model a good fit to the data. The calibration variances for
the first principal component (74%) and the difference between the first and second principal
component (13%) in PCA data analysis for 50% content of tested flours were calculated. The
WCE had a negative correlation on total phenolic contents and γ-tocopherol in the extrudates
of kañiwa (50% content of tested flour). The content of linolenic acid, linoleic acid and oleic
acid had a strong positive correlation with hardness, torque and SEI in the extrudates of lupine
(50% content of tested flour). α-tocopherol content in the extrudates of lupine (50% content of
tested flour) also showed a positive correlation towards the changes in torque, hardness and
SEI. β-tocopherol in the extrudates of quinoa (50% content of tested flour) had a positive
correlation towards the WCE and torque, while pressure showed a negative correlation with
the content of β-tocopherol.
Figure 14a. PCA plot explaining the correlation of extrudates containing 50% content of tested flour against
different extrusión parameters.
With respect to the extrudates of amaranth (50%), the effect of pressure and SEI during the
extrusion processing was positively correlated towards total phenolic content and γ-
tocopherol and negatively correlated towards the WCE in the extrudates. Torque and pressure
had a negative correlation on the content of bioactive compounds while hardness and WCE of
the extrudates resulted in positive correlation on the bioactive compounds during the
extrusion processing.
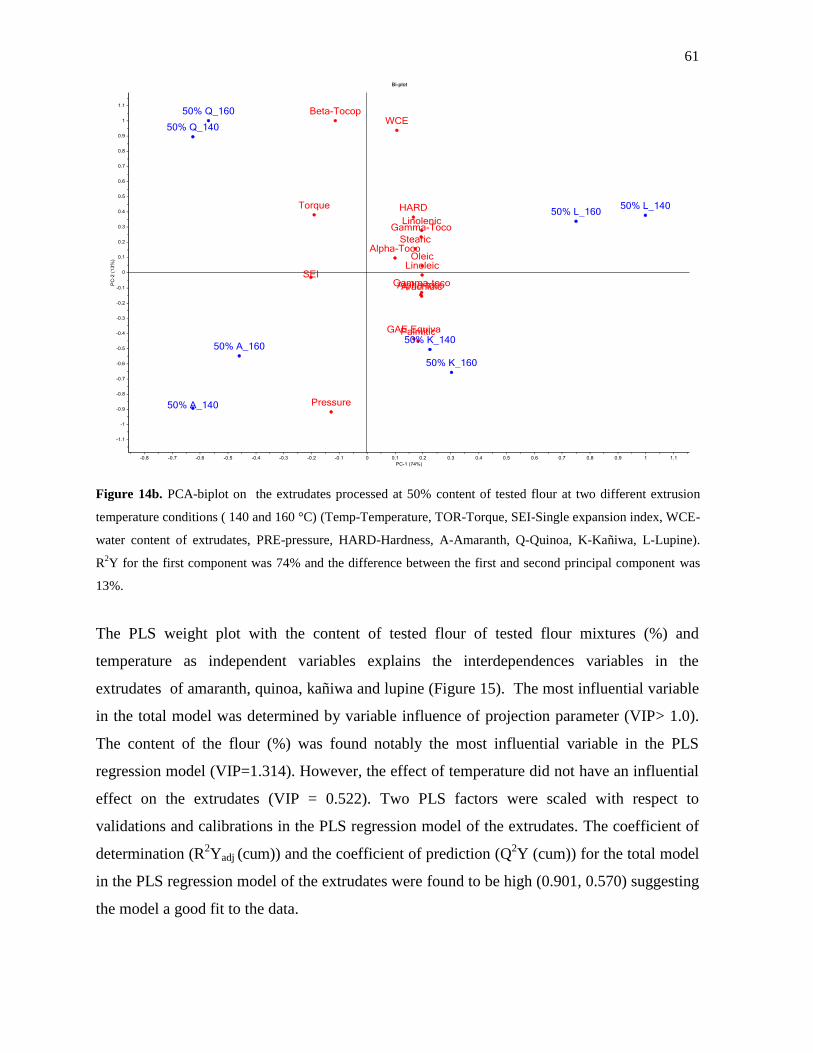
61
Figure 14b. PCA-biplot on the extrudates processed at 50% content of tested flour at two different extrusion
temperature conditions ( 140 and 160 °C) (Temp-Temperature, TOR-Torque, SEI-Single expansion index, WCE-
water content of extrudates, PRE-pressure, HARD-Hardness, A-Amaranth, Q-Quinoa, K-Kañiwa, L-Lupine).
R2Y for the first component was 74% and the difference between the first and second principal component was
13%.
The PLS weight plot with the content of tested flour of tested flour mixtures (%) and
temperature as independent variables explains the interdependences variables in the
extrudates of amaranth, quinoa, kañiwa and lupine (Figure 15). The most influential variable
in the total model was determined by variable influence of projection parameter (VIP> 1.0).
The content of the flour (%) was found notably the most influential variable in the PLS
regression model (VIP=1.314). However, the effect of temperature did not have an influential
effect on the extrudates (VIP = 0.522). Two PLS factors were scaled with respect to
validations and calibrations in the PLS regression model of the extrudates. The coefficient of
determination (R2Yadj (cum)) and the coefficient of prediction (Q
2Y (cum)) for the total model
in the PLS regression model of the extrudates were found to be high (0.901, 0.570) suggesting
the model a good fit to the data.
62
The PLS regression model suggested that temperature had a negative effect on pressure
during the extrusion processing. Temperature and content of tested flour (%) of tested flours
had a strong positive effect on the content of linolenic acid, linoleic acid and oleic acid in all
the extrudates. The content of linolenic, oleic and linoleic acid was reported to have a strong
positive effect with pressure, WCE and hardness and a negative effect on the torque and SEI
in the extrudates of lupine. Higher the pressure or water content in the extrudates of lupine
resulted in better content of unsaturated fatty acids.
The extrudates of amaranth had a positive association on WCE and pressure in the content of
linolenic, oleic and linoleic acid and a negative association on torque, SEI and pressure.
Pressure, content of tested flour (%) and hardness had a strong positive effect on the content
of α-tocopherol and γ-tocopherol, while torque, WCE and SEI had a negative effect on the
content α-tocopherol and γ-tocopherol in the extrudates of amaranth. Pressure, SEI and torque
resulted in positive correlation on the content of β-tocopherol in the extrudates of amaranth
while there was a strong negative correlation with the changes in temperature and WCE
towards the content of β-tocopherol. The coefficient of determination and the coefficient of
prediction for the submodels in the extrudates of amaranth were observed to be high expect in
case of total phenolic content (pressure (0.907, 0.914), oleic acid (0.957, 0.692), linolenic
(0.980, 0.974), β-tocopherol (0.994, 0.712), α-tocopherol (0.993, 0.712) and torque (0.968,
0.917)) (Appendix 5).
In the extrudates of quinoa, the content of linolenic, oleic and linoleic acid had a positive
correlation towards the changes in torque and a negative correlation towards pressure,
hardness, WCE and SEI. The effect of temperature and the content of tested flours had a
tremendous effect on the content of stearic and linolenic acid. With respect to the content of
α- tocopherol and γ-tocopherol, PLS regression model showed a strong positive correlation
towards the content of tested flours (%), pressure, hardness and SEI while there was a
negative correlation with the changes in SEI and torque. Influence of temperature on the
extrudates of quinoa had a less negative effect in the content of α- tocopherol and γ-
tocopherol. The coefficient of determination and the coefficient of prediction for the
submodels in the extrudates of quinoa were high (WCE (0.876, 0.722), oleic acid (1.000,
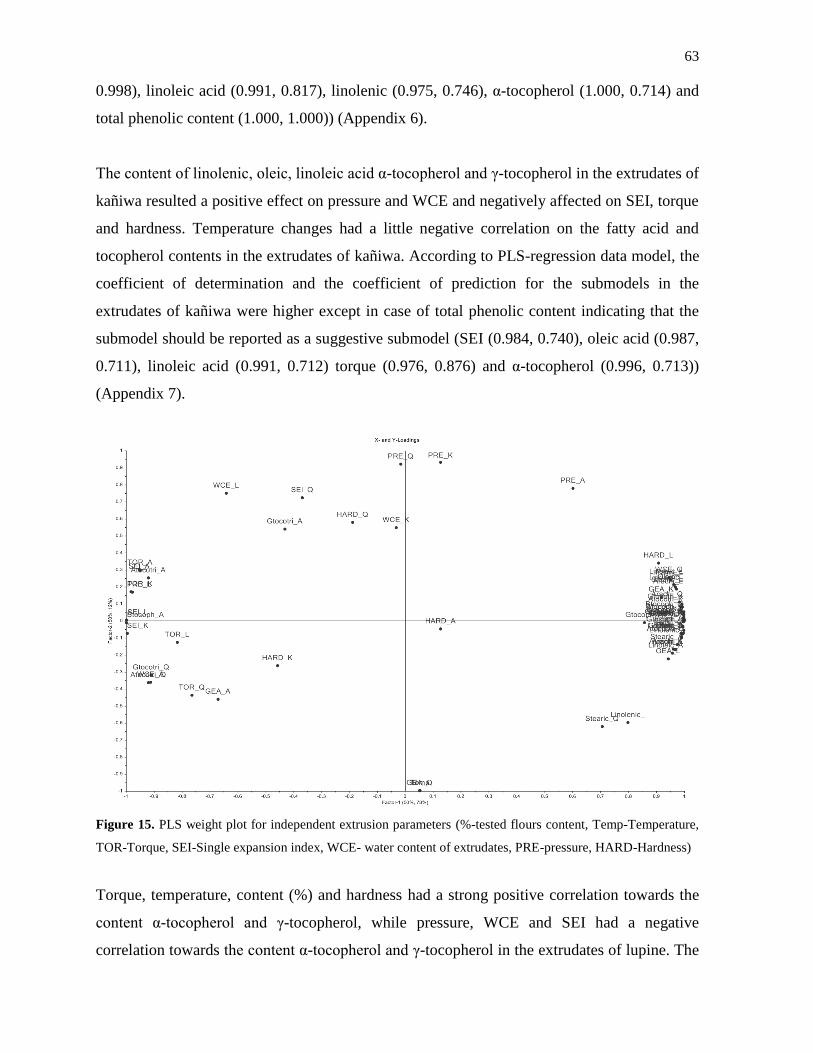
63
0.998), linoleic acid (0.991, 0.817), linolenic (0.975, 0.746), α-tocopherol (1.000, 0.714) and
total phenolic content (1.000, 1.000)) (Appendix 6).
The content of linolenic, oleic, linoleic acid α-tocopherol and γ-tocopherol in the extrudates of
kañiwa resulted a positive effect on pressure and WCE and negatively affected on SEI, torque
and hardness. Temperature changes had a little negative correlation on the fatty acid and
tocopherol contents in the extrudates of kañiwa. According to PLS-regression data model, the
coefficient of determination and the coefficient of prediction for the submodels in the
extrudates of kañiwa were higher except in case of total phenolic content indicating that the
submodel should be reported as a suggestive submodel (SEI (0.984, 0.740), oleic acid (0.987,
0.711), linoleic acid (0.991, 0.712) torque (0.976, 0.876) and α-tocopherol (0.996, 0.713))
(Appendix 7).
Figure 15. PLS weight plot for independent extrusion parameters (%-tested flours content, Temp-Temperature,
TOR-Torque, SEI-Single expansion index, WCE- water content of extrudates, PRE-pressure, HARD-Hardness)
Torque, temperature, content (%) and hardness had a strong positive correlation towards the
content α-tocopherol and γ-tocopherol, while pressure, WCE and SEI had a negative
correlation towards the content α-tocopherol and γ-tocopherol in the extrudates of lupine. The
64
coefficient of determination and the coefficient of prediction for the submodels in the
extrudates of lupine were high (pressure (0.949, 0.766), oleic acid (0.920, 0.760) hardness
(0.821, 0.704), linolenic acid (0.923, 0.764) α-tocopherol (0.970, 0.704) and total phenolic
content (0.812, 0.578)) (Appendix 8).
The total phenolic content in the extrudates of quinoa and lupine had a positive correlation
towards the extrusion temperature and torque and a negative correlation with pressure, SEI,
hardness and WCE. The phenolic content in the extrudates of amaranth had a positive
correlation with temperature, hardness, WCE and negative correlation with pressure while the
phenolic content in the extrudates of kañiwa had a positive correlation towards the pressure,
WCE and torque and a negative correlation on the SEI and hardness of the extrudates.
3.5 Discussion
3.5.1 Chemical composition of raw materials of amaranth, quinoa, kañiwa and lupine
The flours of amaranth, quinoa, kañiwa and lupine resulted in similar chemical composition
with considerable differences in present study when compared to previous results (Sujak et al.
2006; Repo-Carrasco et al. 2009a, b, 2010b). Lupine flours had a good content of protein
ranging around 28-30 g/100 g d.m. and a similar study revealed that the blue lupine
(L.angustifolius), contained higher content of protein (33g/100 g d.m) (Sujak et al. 2006). The
protein content of kañiwa, quinoa and amaranth in present study was found to be higher than
the protein content obtained by Repo-Carrasco et al. (2009a, b, 2010b). Manual titration
(AOAC 1995) was carried out by Repo-Carrasco et al. (2009a, b, 2010b) while an automated
Kjeldahl titration method was carried out during present study which might be the reason for
the slight increase in the protein concentration in kañiwa and amaranth flours due to the
sensitivity of the automated analysis performed in the present study.
The fat content determined in the flours of kañiwa and quinoa in the present study were
comparatively similar to the results obtained by Repo-Carrasco et al. (2009a, 2010b).
However, the fat content in amaranth and lupine flours were lower when compared to the
results determined by Repo-Carrasco et al. (2009b) and Lqari et al. (2002). Accelerated
65
solvent extraction (ASE) was used in the present study which involved the interaction of the
lipid samples with high pressure and increased temperature conditions in order to liberate
faster lipid extraction using acetone as extraction solvent. ASE is considered to be more
effective and quantitative technique in performing lipid extraction (Shen and Shao 2005).
Whereas Lqari et al. (2002) and Repo-Carrasco et al. (2009b) used soxhlet extraction method
(AOAC 1995) in order to determine the fat content as crude fat. Determination of crude fat by
soxhlet extraction has certain limitations as the determination of crude fat depends on the
extraction solvent used, type of sample and more importantly the extraction method used
(Kumoro et al. 2009). Total crude fat determined during the soxhlet extraction method
contains fat-soluble compounds in the lipid samples which consist of free fatty acids, urea,
phospholipids, sterols and triacylglycerols (Anderson 2004). This might explain the reason for
the lower content of fat in amaranth and lupine in the present study when compared to the
previous results determined by Lqari et al. (2002) and Repo-Carrasco et al. (2009b).
The content of dietary fiber in amaranth and kañiwa flours in the present study were lower
when compared to the results obtained by Repo-Carrasco et al. (2009a, b) while the dietary
content of the quinoa flours (9.1±2.6 g/100 g d.m) were similar to the previous results
obtained by Repo-Carrasco et al. (2010a). Enzymatic-gravimetric measurement was used in
the present study and in the previous study conducted by Repo-Carrasco et al. (2009a, b,
2010a). The outer covering of the seed called the perigonium layer greatly influences on the
content of dietary fiber especially in the seeds of kañiwa (Repo-Carrasco et al. 2010a). This
might be the reason for the increased dietary fiber content during the study performed by
Repo-Carrasco et al. (2009a, b) when compared with the present study. With respect to the
dietary fiber content in the seeds of lupine, present study revealed (50±3 g/100 g d.m) similar
results determined by Lqari et al. (2002). Johnson and Gray (1993) reported that lupine
varieties contain high content of dietary fiber amongst the other legumes. The high content of
dietary fiber is attributed towards the seed coat of the leguminous cotyledons which contains
high dietary fiber content in the form of cellulose, hemicelluloses and pectin thereby
explaining the reason for the high dietary content in the seeds of different lupine varieties
when compared to pseudo-cereals and cereals (Písaříková and Zralý 2010).
66
Fatty acid composition of amaranth, quinoa, kañiwa and lupine flours had considerable
differences in the present study in contrast to the previous results (Espinoza 2002; Palombini
et al. 2013; Sbihi et al. 2013). Fatty acid composition in the flours of amaranth, quinoa and
kañiwa had major portion of linoleic acids, oleic acids and palmitic acid (C16:0) which were
similar to the results obtained by Palombini et al. (2013) and Espinoza (2002). Content of
linoleic acid, oleic acids and palmitic acid resulted in greater proportion in the results
determined by Espinoza 2002 and Palombini et al. (2013) when compared to flours of
amaranth, quinoa and kañiwa in our present study. Fatty acid composition in the flours of
lupine (L.angustifolius) in the present study were similar to that of the previous results
determined by Trugo et al. (2004) and Sbihi et al. (2013) in the species of L.angustifolius and
L.albus respectively. There were also slight deviations in the content of tocopherol (α,β,γ,δ) in
the flours of amaranth, quinoa and lupine flours when compared to previous results (Torres et
al. 2005; Alvarez et al. 2009). Several studies reveal that the differences in the content of fatty
acid and tocopherol composition especially in the seeds of quinoa and amaranth varieties
might be due to genotype selection, year of cultivation and temperature conditions (Alvarez et
al. 2009; Peiretti et al. 2013; Hlinková et al. 2013). These factors might be the reason for the
differences in the content of fatty acid and tocopherol composition in the present study to the
previous results.
The total phenolic content in quinoa was similar to the previous results obtained by Repo-
Carrasco et al. (2010a) while the total phenolic content in the flours of amaranth, kañiwa and
lupine were higher in the present study when compared to the previous results obtained by
Repo-Carrasco et al. (2010a) and Siger et al. (2012). Nsimba et al. (2008) reported that the
changes in the total phenolic content in the species of quinoa and amaranth varieties were due
to genetic differences, environmental factors such as temperature differences, infections
which play an important role in affecting the biosynthesis of phenolic compounds thereby
explaining the reason for a considerable effect on the total phenolic content in present study.
Also, cell wall bound phenolic compounds are subjected to be released by acid hydrolysis
treatment (Rommel and Wrolstad 1993). The effect of acid hydrolysis liberates the release of
esterified phenolic aglycones thereby yielding higher content of generic phenols which exhibit
antioxidant properties (Krygier et al. 1982; Bonoli et al. 2004). The release of cell bound
67
phenolics might be the reason for the increase in the content of total phenolic content between
the methanol-water treatment and acid hydrolysis in present study.
3.5.2 Effect of extrusion on fatty acid composition of amaranth, quinoa, kañiwa and
lupine
The percentage of retention of total fatty acids after extrusion ranged from 16-45% in
pseudocereals depending on process conditions. On the other hand, lupine extrudates showed
a no reduction of fatty acids at 50% content of tested flour processed at 140 °C and a 70%
retention of extrudates processed at 160 °C, but at 20% content of tested flour the retention
was 19-20% processed at both extrusion temperatures. Similar study on the effect of extrusion
cooking on the content of total fatty acids was reported by Nierle et al. (1980). They reported
that the effect of extrusion cooking retained 40% in the extrudates of maize. Also Camire
(2000) reported that loss of fatty acid content in the extrudates can be attributed towards the
formation of complexes between lipid and protein during extrusion processing.
The effect of extrusion temperature towards the retention of unsaturated fatty acids (oleic,
linoleic and linolenic acids) depended on the content of tested flour and the flour type during
extrusion processing. The percentage of retention in content of unsaturated fatty acids was
lower at lower content of tested flours in all the extrudates. At 20% addition level the
retention was much lower for all extrudates. The content of unsaturated fatty acids the
retention was lower in the extrudates of amaranth, quinoa and kañiwa. The retention of
unsaturated fatty acids was 23-41% for amaranth, 26-32% for quinoa and 16-49% for kañiwa.
However in the case of lupine extrudates, lower content of tested flour had less retention of
unsaturated fatty acids around 19%, while there was no reduction in the retention of
unsaturated fatty acids at higher content of tested flour processed at higher extrusion
temperatures. Grela et al. (1999) studied the effect of high extrusion temperature on the
content unsaturated fatty acids in extrudates of green peas. From the study, he reported that
increase in the temperature from 100 to 160 °C caused an increase in the content of linoleic
and linolenic acid while there was slight difference in content of oleic acid towards high
temperature extrusion temperature. This might explain the increase in the retention of
unsaturated fatty acids in the extrudates of lupine processed at 140 and 160 °C. However there
68
were no previous studies on the content of unsaturated fatty acids towards the changes in
contents of tested flour and flour type in the extrudates of amaranth, quinoa, lupine and
kañiwa.
Higher extrusion temperatures resulted in higher retention of unsaturated fatty acids in the
extrudates of amaranth and kañiwa. However with the increase in extrusion temperature in the
extrudates of lupine at higher content of tested flour reduced the retention of unsaturated fatty
acids by 25%. Tumuluru et al. (2013) also reported decrease in the lipid content in the
extrudates of fish and rice flour. From his study, he reported that increase in the processing
temperature from 100 to 200 °C, decreased the content of the lipids by 15% due to the
formation of lipid-protein complexes in the extrudates. High processing temperature during
extrusion also resulted in oxidation of unsaturated fatty acids leading to formation of lipid
hydroperoxides thereby lowering content of lipid in the fish and rice flour coextrudates (Funes
and Karel 1981; Van Hoan et al. 2010). This might explain the reason for the decrease in the
content of the unsaturated fatty acids in the present study.
The retention of unsaturated fatty acids especially polyunsaturated fatty acids (PUFA) also
was dependent on the content of moisture in the extrudates maintained during extrusion
processing (Grela et al. 1999). The decrease in the retention of PUFA decreased in all the
extrudates (except for the lupine extrudates with 50% content of tested flour processed at
140 °C) in the present study due to water content of the feed (14%) maintained during
extrusion processing of raw materials. Grela et al. (1999) reported that the high moisture
content (14-30%) decreased the content of PUFA in the extrudates of grass peas. From his
study, the presence of high moisture content might have caused an inhibition in the transfer of
PUFA into monoenoic forms of fatty acids in the lipid complexes thereby resulting in
increased retention of PUFA in the extrudates of grass peas. This might explain the reason for
the decrease in the content of PUFA at lower moisture content in the extrudates of amaranth,
quinoa and kañiwa in the present study.
69
3.5.3 Effect of extrusion on tocopherol content of amaranth, quinoa, kañiwa and lupine
Extrusion cooking resulted in lower retention of total tocopherols and α-tocopherol in the
extrudates of amaranth, quinoa, kañiwa and lupine. The percentage loss in the extrudates was
about 40-77%. Zielinksi et al. (2001) reported that the percentage loss due to the effect of
extrusion cooking of cereal grains processed at 120-200 °C ranged between 63-94%. Mensa-
Wilmot et al. (2003) also reported that the percentage loss towards the content of total
tocopherols (25%) during the extrusion processing of cereal/legume blends at 150 °C. From
the above two studies it was explained that the losses of tocopherol content resulted due to the
effect of high temperature maintained during extrusion processing wherein the content of total
tocopherols were less stable towards high temperature processing. Killeit 1994 also
summarized that the percentage losses of total tocopherols were reported higher during high
heat processing of the raw materials as the tocopherols were sensitive towards high
temperature processing. Higher temperature extrusion processing of the extrudates might
explain the reason for the higher percentage losses of total tocopherols and α-tocopherol
content.
The extrudates of amaranth and quinoa content of tested flour resulted in higher percentage
losses in the content of α, β, γ, δ tocopherols when compared to the extrudates of lupine and
kañiwa in the present study. Similar study was determined by Suknark et al. (2001) towards
the stability of tocopherols in the fish and peanut extrudates processed at 97-100 °C. From the
above study, the percentage of losses in α, β, γ, δ tocopherol content in the extrudates of fish
extrudates were higher when compared to the peanut extrudates. The higher losses in the fish
extrudates were reported due to the presence of predominant content of fatty acids mainly
comprising of oleic acid and linoleic acid when compared to peanut extrudates (Erickson
1992). The higher content of oleic and linoleic acids in the fish extrudates might have led to
lipid oxidation thereby reducing the level of the tocopherols in extrudates (Hakannson and
Jagerstad 1990; Li et al. 1996). This might explain the reason for the higher loss of α, β, γ, δ
tocopherol content where the oxidation of unsaturated fatty acids were higher in the
extrudates of amaranth and quinoa when compared to lupine and kañiwa.
70
It was observed that the content of the γ-tocotrienol increased in all extrudates while there was
an increase in the content of α-tocotrienol in the extrudates containing 20% content of tested
flour. This increase might be due to better extractability of these compounds due to high
temperature processing. Quereshi et al. (2000) have reported a similar increase in the content
of tocotrienols in heat treated (130 °C) rice bran. This might be the reason for the increase in
the content of α and γ-tocotrienols in the extrudates during the present study.
3.5.4 Effect of extrusion on total phenolic content of amaranth, quinoa, kañiwa and
lupine
Quinoa was most sensitive towards extrusion processing with respect to total free phenolic
content where the percentage of retention was 40-60% in the extrudates processed at two
different contents of tested flours at two different extrusion temperatures. However, the
retention was 51-85% for kañiwa, 65-83% for amaranth and 60-82% for lupine. Repo-
Carrasco et al. (2009b) reported that the percentage of retention in the content of the total free
phenolics in the extrudates of amaranth varieties (Centenario and Oscar Blanco) were about
20 and 35% processed at 180 °C. However, there are no previous studies that report the effect
of extrusion on the phenolic content of quinoa, kañiwa and lupine. The variations between the
total phenolic compounds in the present study and the previous results could be due to the raw
materials, extrusion processing and formulation used between the two studies. Repo-Carrasco
et al. (2009b) explained that the decrease in the content of total free phenolic compounds
might be due to the process of decarboxylation of phenolic compounds during high
temperature extrusion processing. Sharma et al. (2009) summarized that the decomposition of
total phenolic compounds was higher at higher extrusion temperatures (≥ 180 °C) which
might be the reason in the higher loss of total phenolics in the study determined by Repo-
Carrasco et al. (2009b) when compared to the present study.
The effect of temperature on total free phenolic content varied depending on the contents of
tested flour and flour type. The percentage of retention was higher at high extrusion
temperature in all the extrudates containing 20% contents of tested flour. Zielinski et al. (2001)
reported that the effect of extrusion processing at high temperature might increase the content
of some bioactive compounds especially phenolic compounds due to the high thermal and
71
mechanical shear stress caused during the processing of the extrudates. The retention of total
free phenolic content was higher at lower temperature for extrudates containing 50% tested
flours. However for lupine extrudates containing 50% contents of tested flour, more retention
of total free phenolics was observed at high temperature extrusion cooking. The decrease in
the content of total free phenolic compounds towards high processing extrusion temperature
was also previously studied in other raw materials (Altan et al. 2009; Brennan et al. 2011;
Nayak et al. 2011; Sharma et al. 2012). The studies revealed that due the high temperature
extrusion processing, degree of polymerization causes the decomposition or changes in the
molecular structure of phenolic compounds leading to reduction in the chemical reactivity and
extractability of the phenolic compounds thereby resulting in decrease in the content of free
phenolics in the extrudates. This might explain the reason for the decreased content of total
free phenolic content at higher extrusion temperatures in the extrudates containing 50%
contents of tested flour.
It was also noted that the percentage of retention in the content of total free phenolic content
increased at higher contents of tested flour irrespective of extrusion temperature in all the
extrudates which were in contrast to the previous results determined by Nayak et al. (2011).
The percentage of retention in the content of total phenolic compounds in extrudates of
amaranth, quinoa, kañiwa and lupine increased between 5-21% with respect to increase in the
content of tested flour of the raw materials from 20 to 50%. Nayak et al. (2011) also reported
that the percentage of retention in the content of total phenolics increased between 5-10%
with the increase in the content of potato from 35 to 50% in the extrudates of potato-pea
blends. Thus the increase in the content of tested flour from 20 to 50% in the raw materials
could be the reason for the increased content of total phenolics during the extrusion
processing of amaranth, quinoa, kañiwa and lupine.
The content of total free and bound phenolic compounds slightly increased in extrudates of
amaranth, quinoa, kañiwa and lupine processed at two contents of tested flours and extrusion
temperatures when compared to T.V. The results obtained in the present study were in
contrast to the previous results determined by Sarawong et al. (2014) in the extrudates of
green banana flour. Sarawong et al. (2014) reported that the disruption of the bound phenolics
in the cell wall matrix by the effect of high temperature extrusion processing resulted in the
72
increased release of bound phenolics. The increased release of cell bound phenolics from the
cell wall matrix might explain the reason for the higher content of total free and bound
phenolics in the extrudates of amaranth, quinoa, kañiwa and lupine when compared to
calculated values for the flour mixture in the present study. Zielinski et al. (2001) reported
that phenolics released from the cell wall matrix during the extrusion processing contribute
towards high antioxidant property when considered as a dietary antioxidant source.
73
4 Conclusions
The present study provided information on (1) nutritional properties and the bioactive
compounds of the flours of amaranth, quinoa, kañiwa and lupine and (2) the effect of extrusion
processing towards the nutritional properties and the stability of bioactive compounds in the
extrudates of amaranth, quinoa, kañiwa and lupine.
The seeds of amaranth, quinoa, kañiwa and lupine possessed desirable nutritional composition
in addition to its rich source of bioactive compounds especially phenolic compounds. Lupine
flours resulted in higher content of protein and dietary fiber content when compared to the
flours of amaranth, kañiwa and quinoa. The content of oleic and linoleic acid were higher in
the flours of kañiwa followed by quinoa, lupine and amaranth. The content of α-tocopherol, γ-
tocopherol and total phenolic content were higher in the flours of kañiwa and lupine when
compared to quinoa and amaranth. Further studies are required to determine on the content of
individual phenolics and the antioxidant activity in the seeds of amaranth, quinoa, kañiwa and
lupine.
Extrusion processing considerably increased the composition of fatty acids in in the
extrudates of lupine containing 50% content of tested flour processed at 140 °C. In contrast,
higher extrusion temperatures in the extrudates containing amaranth, quinoa and kañiwa
caused oxidation of unsaturated fatty acids resulting in decreased content of unsaturated fatty
acids. The retention of unsaturated fatty acids was higher in the lupine extrudates when
compared to the extrudates of amaranth, quinoa and kañiwa. A detailed study on the effect of
extrusion cooking on the content of dietary fiber, protein and carbohydrates might help in
producing snacks rich in high protein and dietary fiber.
The content of total tocopherols decreased due to the effect of high temperature extrusion
processing in all the extrudates. The content of tocotrienols was observed to possess better
stability towards extrusion processing when compared to tocopherols. Indeed, more extrusion
studies on the retention of tocopherols and tocotrienols towards lower extrusion temperatures
might be helpful in obtaining higher retention of tocopherol content in the extrudate samples.
74
Higher temperature extrusion processing might have resulted in decrease in the content of
total free phenolic content due to decomposition and decarboxylation of phenolics. More
retention of total free phenolics was observed at higher temperatures in the extrudates of
lupine containing higher contents of tested flours. Further explanatory studies are needed
determine the effect of extrusion cooking on the content of antioxidant activity in the
extrudates of amaranth, quinoa, kañiwa and lupine which might help in producing snacks
possessing dietary antioxidant source.
Very few studies on the quantification of bioactive compounds and their effect of extrusion on
the flours of amaranth, quinoa, kañiwa and lupine have been studied. With this research, it is
possible to modify the extrusion conditions in obtaining milder effects to result in high
retention of nutritional compounds in the extrudates. This research might provide supportive
information for deriving gluten-free cereal snacks with low glycemic index. Even though this
research is not much researched at present, it has the potential to be the one for the future.
75
References
[AACC] American Association of Cereal Chemists. 2001. The Definition of Dietary Fiber - Report of the
Dietary Fiber Definition Committee, Cereal Foods World 46: 112-26.
[AOAC]Association of Official Analytical Chemists. 1995. Official methods of analysis . 15. P. Washington,
DC.: AOAC.
Abugoch James LE. 2009. Quinoa (Chenopodium quinoa Willd.): Composition, chemistry, nutritional, and
functional properties. Adv Food Nutr Res 581-31.
Ahamed N, Singhai RS, Kulkarni PR, Pal M. 1998. A lesser-known grain, Chenopodium quinoa: Review of the
chemical composition of its edible parts. Food Nutr Bull 19(1):61-70.
Alonso R, Rubio LA, Muzquiz M, Marzo F. 2001. The effect of extrusion cooking on mineral bioavailability in
pea and kidney bean seed meals. Anim Feed Sci Technol 94(1-2):1-13.
Altan A, McCarthy KL, Maskan M. 2008. Extrusion cooking of barley flour and process parameter optimization
by using response surface methodology. J Sci Food Agric 88(9):1648-59.
Altan A, McCarthy KL, Maskan M. 2009. Effect of extrusion process on antioxidant activity, total phenolics and
ß-glucan content of extrudates developed from barley-fruit and vegetable by-products. Int J Food Sci Technol
44(6):1263-71.
Anderson. 2004. Soxtec. In: Luthria DL, Ed. Oil Extraction and Analysis Critical Issues and Competitive Studies.
AOCS Publishing. p 10.
Athar N, Hardacre A, Taylor G, Clark S, Harding R, McLaughlin J. 2006. Vitamin retention in extruded food
products. J Food Compos Anal 19(4):379-83.
Alvarez-Jubete L, Arendt EK, Gallagher E. 2010. Nutritive value of pseudocereals and their increasing use as
functional gluten-free ingredients. Trends Food Sci Technol 21(2):106-13.
Alvarez-Jubete L, Holse M, Hansen Å, Arendt EK, Gallagher E. 2009. Impact of baking on vitamin E content of
pseudocereals amaranth, quinoa, and buckwheat. Cereal Chem 86(5):511-5.
Anuonye JC, Onuh JO, Egwim E, Adeyemo SO. 2010. Nutrient and antinutrient composition of extruded
acha/Soybean blends. J Food Process Preserv 34(SUPPL. 2):680-91.
Anton AA, Gary Fulcher R, Arntfield SD. 2009. Physical and nutritional impact of fortification of corn starch-
based extruded snacks with common bean (Phaseolus vulgaris L.) flour: Effects of bean addition and extrusion
cooking. Food Chem 113(4):989-96.
Arêas JA. 1992. Extrusion of food proteins. Crit Rev Food Sci Nutr 32(4):365-92.
Azzi A, Stocker A. 2000. Vitamin E: Non-antioxidant roles. Prog Lipid Res 39(3):231-55.
Bailey LN, Hauck BW, Sevatson ES, Singer RE. 1995. Ready-to-eat breakfast cereal production, in (A. Turner,
Ed.), Food Technology International Europe, Sterling Publications International, London, pp. 127-32.
Becker R., Wheeler K, Lorenz A, Stafford O, Grosjean A, Betschart A, Saunders R. 1981. A compositional
study of amaranth seed. J. Food Sci. 46:1175–80.
76
Bejosano FP, Corke H. 1998. Protein quality evaluation of Amaranthus wholemeal flours and protein
concentrates. J Sci Food Agric 76(1):100-6.
Block G, Patterson B, Subar A. 1992. Fruit, vegetables, and cancer prevention: A review of the epidemiological
evidence. Nutr Cancer 18(1):1-29.
Bodí V, Sanchis J, Lopez-Lereu MP, Nunez J, Mainar L, Pellicer M, Sanz R, Gomez C, Bosch MJ, Husser O,
Chorro FJ, Llacer A. 2007. Evolution of 5 cardiovascular magnetic resonance-derived viability indexes after
reperfused myocardial infarction. Am Heart J 153(4):649-55.
Bonoli M, Marconi E, Caboni MF. 2004. Free and bound phenolic compounds in barley (Hordeum vulgare L.)
flours: Evaluation of the extraction capability of different solvent mixtures and pressurized liquid methods by
micellar electrokinetic chromatography and spectrophotometry. J Chromatogr A 1057(1-2):1-12.
Boschin G, Arnoldi A. 2011. Legumes are valuable sources of tocopherols. Food Chem 127(3):1199-203.
Brennan C, Brennan M, Derbyshire E, Tiwari BK. 2011. Effects of extrusion on the polyphenols, vitamins and
antioxidant activity of foods. Trends Food Sci Technol 22(10):570-5.
Bressani R, De Martell ECM, De Godínez CM. 1993. Protein quality evaluation of amaranth in adult humans.
Plant Food Hum Nutr 43(2):123-43.
Bramley PM, Elmadfa I, Kafatos A, Kelly FJ, Manios Y, Roxborough HE, Schuch W, Sheehy PJA, Wagner KH.
2000. Vitamin E. J. Sci. Food Agric. 80:913-38.
Björck I, Asp N. 1983. The effects of extrusion cooking on nutritional value - A literature review. J Food Eng
2(4):281-308.
Brigelius-Flohé R. 2006. Bioactivity of vitamin E. Nut Res Rev 19(2):174-86.
Cai YZ, Corke H, Wu HX. 2004. Amaranth. In: Encyclopedia of Seed Science, Elsevier, Colin Wrigley, Oxford:
1-10.
Cai Y, Sun M, Corke H. 2003. Antioxidant activity of betalains from plants of the Amaranthaceae. J Agric Food
Chem 51(8):2288-94.
Camire ME, Camire A, Krumhar K. 1990. Chemical and nutritional changes in foods during extrusion. Crit Rev
Food Sci Nutr 29(1):35-57.
Camire ME, Dougherty MP, Briggs JL. 2005. Antioxidant-rich foods retard lipid oxidation in extruded corn.
Cereal Chem 82(6):666-70.Calhoun WK., Hepburn F.N Bradley WB. 1960. The distribution of the vitamins of
wheat in commercial mill products. Cereal Chemistry 37: 755–761.
Camire ME. 2000. Chemical and nutritional changes in food during extrusion, In: Extruders in food applications,
edited by M. N. Riaz, CRC Press: 127-47.
Camire ME. 2001. Extrusion and nutritional quality, In: Extrusion cooking-Technologies and applications,
edited by Guy R, Woodhead publishing Ltd, Cambridge, UK: 108-29.
Chávez-Jáuregui RN, Silva MEMP, Areas JAG. 2000. Extrusion cooking process for amaranth (Amaranthus
caudatus L.). J Food Sci 65(6):1009-15.
Chessari CJ, Sellahewa JN. 2001. Effective process control, In: Extrusion Cooking -Technologies and
Applications edited by Guy R, Woodhead Publishing, Cambridge, 83-107.
77
Cheftel C. 1989. Extrusion cooking and food safety. In: Mercier, C., Linko, P., Harper, J.M. (Eds.), Extrusion
Cooking. Am. Assoc. Cereal Chem., St. Paul, MN: 435–461.
Cheftel, JC, Kitagawa M., Queguiner C. 1992. New protein texturization processes by extrusion cooking at high
moisture levels. Food Reviews International 8(2):235-75.
Chaovanalikit A. (1999). Anthocyanin stability during extrusion cooking. [M.Sc. Thesis, in English]. Orono, ME,
University of Maine. Referenced from: Singh S, Gamlath S, Wakeling L. 2007. Nutritional aspects of food
extrusion: A review. Int J Food Sci Technol 42(8):916-29.
Cintra DEC, Costa AV, Peluzio MDCG, Matta SLP, Silva MTC, Costa NMB. 2006. Lipid profile of rats fed
high-fat diets based on flaxseed, peanut, trout, or chicken skin. Nutrition 22(2):197-205.
Conway HF. 1971. Extrusion cooking of cereals and soybeans- part I, Food product Dev 5 27-31.
Collazos C, White P, White H,Viñas E, Alvistur E, Urqueta R, Vasquez J, Dias C, Quiroz A, Roca A, Hegsted
M, Bradfield R, Herrera N, Faching A, Robles N, Hernandez E, Arias M. 1993. La Composición de Alimentos
de Mayor Consumo en el Perú. Minsterio de Salud. Insituto Nacional de Nutrición. Lima, Perú. Referenced
from: Repo-Carrasco R, Espinoza C, Jacobsen S-. 2003. Nutritional value and use of the andean crops quinoa
(Chenopodium quinoa) and kañiwa (Chenopodium pallidicaule). Food Rev Int 19(1-2):179-89.
Colonna P, Tayeb J, Mercier C. 1989. Extrusion cooking of starch and starchy products. In: C. Mercier P, Linko
JM, Harper. Extrusion Cooking :247–319.
Costea (2003). Notes on Economic Plants. Economic Botany 57(4): 646-649.
Dini I, Schettino O, Dini A. 1998. Studies on the Constituents of Lupinus mutabilis (Fabaceae). Isolation and
Characterization of Two New Isoflavonoid Derivatives. J Agric Food Chem 46(12):5089-92.
Dlamini NR, Taylor JRN, Rooney LW. 2007. The effect of sorghum type and processing on the antioxidant
properties of African sorghum-based foods. Food Chem 105(4):1412-9.
Durge AV, Sarkar S, Survase SA, Singhal RS. 2013. Impact of Extrusion on Red Beetroot Colour Used as Pre-
extrusion Colouring of Rice Flour. Food Bioprocess Technol 6(2):570-5.
Duranti M, Consonni A, Magni C, Sessa F, Scarafoni A. 2008. The major proteins of lupin seed:
Characterisation and molecular properties for use as functional and nutraceutical ingredients. Trends in Food
Science and Technology 19(12):624-33.
Drzewiecki J, Delgado-Licon E, Haruenkit R, Pawelzik E, Martin-Belloso O, Park Y-, Jung S-, Trakhtenberg S,
Gorinstein S. 2003. Identification and Differences of Total Proteins and their Soluble Fractions in some
Pseudocereals Based on Electrophoretic Patterns. J Agric Food Chem 51(26):7798-804.
El-Hady EAA, Habiba RA. 2003. Effect of soaking and extrusion conditions on antinutrients and protein
digestibility of legume seeds. LWT - Food Sci Technol 36(3):285-93.
Embaby HE. 2010. Effect of soaking, dehulling, and cooking methods on certain antinutrients and in vitro
protein digestibility of bitter and sweet lupin seeds. Food Sci Biotechnol 19(4):1055-62.
Englyst KN, Liu S, Englyst HN. 2007. Nutritional characterization and measurement of dietary carbohydrates.
Eur J Clin Nutr 61(SUPPL. 1):S19-39.
78
Erickson MC. 1992. Variation of lipid and tocopherol composition in three strains of channel catfish (Ictalurus
punctatus). J Sci Food Agric 59(4):529-36.
Escudero NL, Albarracín G, Fernández S, De Arellano LM, Mucciarelli S. 1999. Nutrient and antinutrient
composition of Amaranthus muricatus. Plant Foods Hum Nutr 54(4):327-36.
Espinoza Silva C. (2002). Caracterización de la fracción lipídicade quinoa (Chenopodium quinoaWilld) y
kañiwa Chenopodium pallidicaule Aellen). Tesis para optar el grado de Magister Scientiae.Universidad Nacional
Agraria La Molina. Lima, Peru. Referenced from: Repo-Carrasco-Valencia. 2011 Andean indigenous food crops:
nutritional value and bioactive compounds [M.Sc. Thesis, in English]: University of Turku. 23 p. Available at:
https://www.doFria.fi/bitstream/handle/10024/74762/Repo-Carrasco-Valencia- Diss2011.pdf?sequence=1:
ISBN : 978-951-29-4605-1.
Fellows PJ. 2009. Food Processing Technology - Principles and Practice (3rd Edition) Woodhead Publishing
457-75.
Ferrazzano GF, Amato I, Ingenito A, Zarrelli A, Pinto G, Pollio A. 2011. Plant polyphenols and their anti-
cariogenic properties: A review. Molecules 16(2):1486-507.
Franc Bavec and Martina Bavec, 2006. Organic Production and Use of Alternative Crops, CRC Press 2006: 65-
107.
Fuentes-Zaragoza E, Sánchez-Zapata E, Sendra E, Sayas E, Navarro C, Fernández-Lõpez J, Pérez-Alvarez JA.
2011. Resistant starch as prebiotic: A review. starch 63(7):406-15.
Funes J, Karel M. 1981. Free radical polymerization and lipid binding of lysozyme reacted with peroxidizing
linoleic acid. Lipids 16(5):347-50.
Gamel TH, Linssen JP, Mesallam AS, Damir AA, Shekib LA. 2006. Effect of seed treatments on the chemical
composition of two amaranth species: Oil, sugars, fibres, minerals and vitamins. J Sci Food Agric 86(1):82-9.
Gamel, T.H., Linssen, J.P., Mesallan, A.S., Damir, A.A. & Shekib, L.A. 2006. Effect of seed treatments on the
chemical composition of two amaranth species: oil, sugars, fibres, minerals and vitamins. Journal of the Science
of Food and Agriculture 86: 82–89.
Gee JM, Price KR, Ridout CL, Wortley GM, Hurrel RF and Johnson IT. 1993. Saponins of quinoa
(Chenopodium quinoa): effect of processing on their abundance in quinoa products and their biological effects
on intestinal mucosal tissue. J Sci Food Agric 63:201–09.
Geleijnse JM, Launer LJ, Van Der Kuip DAM, Hofman A, Witteman JCM. 2002. Inverse association of tea and
flavonoid intakes with incident myocardial infarction: The Rotterdam Study. Am J Clin Nutr 75(5):880-6.
Gélinas P, McKinnon C. 2013. Dietary fibre and β-glucan in strong bread wheat cultivars: Does it matter? Int J
Food Sci Technol 48(3):670-2.
González JA, Roldán A, Gallardo M, Escudero T, Prado FE. 1989. Quantitative determinations of chemical
compounds with nutritional value from inca crops: Chenopodium quinoa ('quinoa'). Plant Food Hum Nutr
39(4):331-7.
Gorinstein S, Pawelzik E, Delgado-Licon E, Haruenkit R, Weisz M, Trakhtenberg S. 2002. Characterisation of
pseudocereal and cereal proteins by protein and amino acid analyses. J Sci Food Agric 82(8):886-91.
Grela ER, Jensen SK, Jakobsen K. 1999. Fatty acid composition and content of tocopherols and carotenoids in
raw and extruded grass pea (Lathyrus sativus L). J Sci Food Agric 79(15):2075-8.
79
Gross R, von Baer E, Koch F, Marquard R, Trugo L, Wink M. 1988. Chemical composition of a new variety of
the Andean lupin (Lupinus mutabilis cv. Inti) with low-alkaloid content. J Food Compos Anal 1(4):353-61.
Gualberto DG, Bergman CJ, Kazemzadeh M, Weber CW. 1997. Effect of extrusion processing on the soluble
and insoluble fiber, and phytic acid contents of cereal brans. Plant Foods Hum Nutr 51(3):187-98.
Guerrieri N. 2004. Cereal proteins In: Yada RY, Ed. Proteins in food processing. Woodhead publishing : 176-96.
Gulewicz P, Martínez-Villaluenga C, Frias J, Ciesiolka D, Gulewicz K, Vidal-Valverde C. 2008. Effect of
germination on the protein fraction composition of different lupin seeds. Food Chem 107(2):830-44.
Guy R. (2001a). Extrusion cooking technologies and applications, Woodhead publishing Ltd, Cambridge, UK:
1-2.
Guy R. (2001b). Snack foods. In: Extrusion cooking technologies and applications, Woodhead publishing Ltd,
Cambridge, UK : 161-81.
Guy R. (2001c). Raw materials in extrusion cooking. In: Extrusion cooking technologies and applications,
Woodhead publishing Ltd, Cambridge, UK :5-28.
Guzman-Maldonado S, Paredes-Lopez O. 1998. Functional Products of Plant Indigenous to Latin America.
Amaranth and Quinoa, Common Beans and Botanicals. In: Mazza, G, Functional Foods. Biochemical and
Processing Aspects, Technomic Publishing Company. Pennsylvania, USA.
Hakannson, B., & Jagerstad, M. 1990. The effect of thermal inactivation of lipoxygenase on the stability of
vitamin E in wheat. Journal of Cereal Science 12: 177-85.
Hakansson B, Jagerstad M, Oste R, Akesson B, Jonssson L. (1987). The effects of various thermal processes on
protein quality, vitamins and selenium content in whole-seed wheat and white flour. Journal of Cereal Science, 6:
269–82.
Han X, Shen T, Lou H. 2007. Dietary polyphenols and their biological significance. Int J Mol Sci 8(9):950-88.
Harper JM. 1988. Effects of extrusion processing on nutrients. In: Karmas E, Harris RS Nutritional evaluation of
food proscessing (3rd edition): 360-65.
Harris PJ, Trethewey JAK. 2010. The distribution of ester-linked ferulic acid in the cell walls of angiosperms.
Phytochem Rev 9(1):19-33.
Hemery Y, Rouau X, Lullien-Pellerin V, Barron C, Abecassis J. 2007. Dry processes to develop wheat fractions
and products with enhanced nutritional quality. J Cereal Sci 46(3):327-47.
Hlinková A, Bednárová A, Havrlentová M, Šupová J, Cicová I. 2013. Evaluation of fatty acid composition
among selected amaranth grains grown in two consecutive years. Biologia 68(4):641-50.
Hoan N, Mouquet-Rivier C, Treche S. 2010. Effects of starch, lipid and moisture contents on extrusion behavior
and extrudate characteristics of rice-based blends prepared with a very-low-cost extruder. J Food Process Eng
33(3):519-39.
Ho Chi-Tang, Mohamed MR, Geetha G. 2007. Bioactive substances: Nutraceuticals and Toxicants. In:
Damodaran S, Parkin K, Fennema RO, Ed. Fennema’s Food Chemistry fourth edition. CRC press. p 751.
Honig DH, Rackis JJ. 1979. Determination of the total pepsin-pancreatin indigestible content (dietary fiber) of
soybean products, wheat bran, and corn bran. J Agric Food Chem 27(6):1262-6.
80
Improta F, Kellems RO. 2001. Comparison of raw, washed and polished quinoa (Chenopodium quinoa Willd.) to
wheat, sorghum or maize based diets on growth and survival of broiler chicks. Livest Res Rural Dev 13(1) : p
10.
Iwe MO, Van Zuilichem DJ, Stolp W, Ngoddy PO. 2004. Effect of extrusion cooking of soy-sweet potato
mixtures on available lysine content and browning index of extrudates. J Food Eng 62(2):143-50.
Jacobsen S. 2011. The Situation for Quinoa and Its Production in Southern Bolivia: From Economic Success to
Environmental Disaster. J Agron Crop Sci 197(5):390-9.
Jacobsen S. 2003. The worldwide potential for quinoa (Chenopodium quinoa Willd.). Food Rev Int 19(1-2):167-
77.
Jacobsen S-, Monteros C, Christiansen JL, Bravo LA, Corcuera LJ, Mujica A. 2005. Plant responses of quinoa
(Chenopodium quinoa Willd.) to frost at various phenological stages. Eur J Agron 22(2):131-9.
Johnson SK, Gray DM 1993: Ingredients derived from lupin. Strong potential for a range of dietary fiber
applications. Int Food Ingred 5: 18-23 Referenced from: Písaríková B, Zralý Z. 2010. Dietary fibre content in
lupine (Lupinus albus L.) and soya (Glycine max L.) seeds. Acta Vet Brno 79(2):211-6.
Kalogeropoulos N, Chiou A, Ioannou M, Karathanos VT, Hassapidou M, Andrikopoulos NK. 2010. Nutritional
evaluation and bioactive microconstituents (phytosterols, tocopherols, polyphenols, triterpenic acids) in cooked
dry legumes usually consumed in the Mediterranean countries. Food Chem 121(3):682-90.
Kamal-Eldin A, Lærke HN, Knudsen K-B, Lampi A-, Piironen V, Adlercreutz H, Katina K, Poutanen K, Åman
P. 2009. Physical, microscopic and chemical characterisation of industrial rye and wheat brans from the Nordic
countries. Food Nutri Res 53
Kanner J, Harel S, Granit R. 2001. Betalains - A new class of dietary cationized antioxidants. J Agric Food
Chem 49(11):5178-85.
Kaur S, Sharma S, Singh B, Dar BN. 2013. Effect of extrusion variables (temperature, moisture) on the
antinutrient components of cereal brans. J Food Sci Technol 1-7.
Kent, N. 1983. Technology of cereals. New York. USA. Pergamon Press. Referenced from : Repo-Carrasco R,
Espinoza C, Jacobsen S-. 2003. Nutritional value and use of the andean crops quinoa (Chenopodium quinoa) and
kañiwa (Chenopodium pallidicaule). Food Rev Int 19(1-2):179-89.
Khanal RC, Howard LR, Brownmiller CR, Prior RL. 2009. Influence of extrusion processing on procyanidin
composition and total anthocyanin contents of blueberry pomace. J Food Sci 74(2): 52-8.
Khattak AB, Zeb A, Bibi N, Khalil SA, Khattak MS. 2007. Influence of germination techniques on phytic acid
and polyphenols content of chickpea (Cicer arietinum L.) sprouts. Food Chem 104(3):1074-9.
Killeit U, Wiedmann WA. 1984. Einfluss der kochextrusion auf die stabitat von B-vitaminen. Getreide Mehl und
Brot, 38, 299–302. Referenced from: Singh S, Gamlath S, Wakeling L. 2007. Nutritional aspects of food
extrusion: A review. Int J Food Sci Technol 42(8):916-29.
Kitabatake N, Doi E. (1992). Denaturation and texturization of food protein by extrusion cooking. In: Kokini JL,
Ho CT, Karwe MV, Marcel Dekker. Food extrusion: science and technology. 361-71.
Kozioł MJ. 1992. Chemical composition and nutritional evaluation of quinoa (Chenopodium quinoa Willd.). J
Food Compos Anal 5(1):35-68.
81
Krygier K, Sosulski F, Hogge L. 1982. Free, esterified, and insoluble-bound phenolic acids. 1. Extraction and
purification procedure. J Agric Food Chem 30(2):330-4.
Kumoro AC, Hasan M, Singh H. 2009. Effects of solvent properties on the Soxhlet extraction of diterpenoid
lactones from Andrographis paniculata leaves. ScienceAsia 35(3):306-9.
Kunz C, Rudloff S. 2006. Health promoting aspects of milk oligosaccharides. Int Dairy J 16(11):1341-6.
Lampi AM, Ollilainen V. 2012. EK 125 Basic Food analysis- Laboratory Course Manual. p 1-88.
Lásztity R. 1984. The Chemistry of Cereal Proteins. 216 Seiten. CRC Press Inc. Boca Raton, USA. Food
Nahrung, 29 (7): 710.
Latinreco. (1990). Quinua-Hacia su cultivo comercial. Latinreco S.A. Quito, Ecuador. Referenced from : Repo-
Carrasco R, Espinoza C, Jacobsen S-. 2003. Nutritional value and use of the andean crops quinoa (Chenopodium
quinoa) and kañiwa (Chenopodium pallidicaule). Food Rev Int 19(1-2):179-89.
Li SX, Cherian G, Ahn DU, Hardin RT, Sim JS. 1996. Storage, Heating, and Tocopherols Affect Cholesterol
Oxide Formation in Food Oils. J Agric Food Chem 44(12):3830-4Li S-, Howard Zhang Q. 2001. Advances in
the development of functional foods from buckwheat. Crit Rev Food Sci Nutr 41(6):451-64.
Liu S, Stampfer MJ, Hu FB, Giovannucci E, Rimm E, Manson JE, Hennekens CH, Willett WC. 1999. Whole-
seed consumption and risk of coronary heart disease: Results from the Nurses' Health Study. Am J Clin Nutr
70(3):412-9.
Lqari H, Vioque J, Pedroche J, Millán F. 2002. Lupinus angustifolius protein isolates: Chemical composition,
functional properties and protein characterization. Food Chem 76(3):349-56.
Maes C, Delcour JA. 2002. Structural characterisation of water-extractable and water-unextractable
arabinoxylans in wheat bran. J Cereal Sci 35(3):315-26.
Martin D, Godber JS, Setlhako G, Verma L, Wells JH. 1993. Optimizing rice bran stabilization by extrusion
cooking. Lousiana Agriculture, 36, 13-15.
Martínez-Villaluenga C, Frías J, Vidal-Valverde C. 2006. Functional lupin seeds (Lupinus albus L. and Lupinus
luteus L.) after extraction of a-galactosides. Food Chem 98(2):291-9.
Macedo GA. 2003. Consumption of quinoa in Peru. Food Rev Int 19(1-2):221-7.
Martins JM, Riottot M, De Abreu MC, Viegas-Crespo AM, Lança MJ, Almeida JA, Freire JB, Bento OP. 2005.
Cholesterol-lowering effects of dietary blue lupin (Lupinus angustifolius L.) in intact and ileorectal anastomosed
pigs. J Lipid Res 46(7):1539-47.
Mensa-Wilmot Y, Phillips RD, Lee J, Eitenmiller RR. 2003. Formulation and evaluation of cereal/legume-based
weaning food supplements. Plant Foods Hum Nutr 58(3):1-14.
Moghadasian MH, Frohlich JJ. 1999. Effects of dietary phytosterols on cholesterol metabolism and
atherosclerosis: Clinical and experimental evidence. Am J Med 107(6):588-94.
Mohamed AA, Rayas-Duarte P. 1995. Composition of Lupinus albus. Cereal Chem 72(6):643-7.
Morris C (editor) (1992). Academic Press Dictionary of Science and Technology, SanDiego, Academic, 1742.
82
Mujica A, Marca S, Jacobsen S-. 2003. Current production and potential of quinoa (Chenopodium quinoa Willd.)
in Peru. Food Rev Int 19(1-2):149-54.
Mujica A 1994. Andean Seeds and Legumes. In: Hernando J.E. and Leon J. Neglected Crops (Plant production and
Protection 26). Rome, Italy. FAO: 131–148. Referenced from : Vega-Gálvez A, Miranda M, Vergara J, Uribe E, Puente L,
Martínez EA. 2010. Nutrition facts and functional potential of quinoa (Chenopodium quinoa willd.), an ancient Andean
seed: A review. J Sci Food Agric 90(15):2541-7.
Mujica A, Izquierdo J and Marathee JP (2001), Origen y descripci ´on de la quinua, in Quinua (Chenopodium quinoa
Willd.). Ancestral cultivo andino, alimento del presente y futuro, ed. by Mujica A, Jacobsen S-E, Izquierdo J, Marathee J.
FAO, UNA-Puno, CIP, Santiago, Chile: 9–29. Referenced from : Vega-Gálvez A, Miranda M, Vergara J, Uribe E, Puente
L, Martínez EA. 2010. Nutrition facts and functional potential of quinoa (Chenopodium quinoa willd.), an ancient Andean
seed: A review. J Sci Food Agric 90(15):2541-7.
Munné-Bosch S. 2007. α-Tocopherol: A Multifaceted Molecule in Plants. Vitam Horm 76375-92
Nalle CL, Ravindran V, Ravindran G. 2011. Nutritional value of narrow-leafed lupin (Lupinus angustifolius) for
broilers. Brit Poult Sci 52(6):775-81.
Nayak B, Berrios JDJ, Powers JR, Tang J. 2011. Effect of Extrusion on the Antioxidant Capacity and Color
Attributes of Expanded Extrudates Prepared from Purple Potato and Yellow Pea Flour Mixes. J Food Sci
76(6):C874-83.
Nenadis N, Zhang H-, Tsimidou MZ. 2003. Structure-antioxidant activity relationship of ferulic acid derivatives:
Effect of carbon side chain characteristic groups. J Agric Food Chem 51(7):1874-9.
Nesaretnam K, Wong WY, Wahid MB. 2007. Tocotrienols and cancer: Beyond antioxidant activity. Eur J Lipid
Sci Technol 109(4):445-52.
Nierle W, Elbaya AW, Seiler K, Fretzdorff B, Wolff, J. 1980.Veranderungen der getreideinhaltsstoffe wahrend
der extrusion miteinem doppelschneckenextruder. Getreide Mehl Brot, 34, 73–76. Referenced from: Singh S,
Gamlath S, Wakeling L. 2007. Nutritional aspects of food extrusion: A review. Int J Food Sci Technol
42(8):916-29.
Noguchi A, Mosso K., Aymanrd C, Jevnink J, Cheftel JC. 1982. Maillard reactions during extrusion cooking of
rote in enriched biscuits. Lebensmittel Wissenschaft and Technologie, 15, 105–110. Referenced from: Singh S,
Gamlath S, Wakeling L. 2007. Nutritional aspects of food extrusion: A review. Int J Food Sci Technol
42(8):916-29.
Nsimba YR, Kikuzaki H, Konishi Y. 2008. Antioxidant activity of various extracts and fractions of
Chenopodium quinoa and Amaranthus spp. seeds. Food Chem 106(2):760-6.
Palombini SV, Claus T, Maruyama SA, Gohara AK, Souza AHP, de Souza NE, Visentainer JV, Gomes STM,
Matsushita M. 2013. Evaluation of nutritional compounds in new amaranth and quinoa cultivars. Cienc Tecnol
Aliment 33(2):339-44.
Park SH, Morita N. 2004. Changes of bound lipids and composition of fatty acids in germination of quinoa
seeds. Food Sci Technol Res 10(3):303-6.
Pedersen B, Hallgren L, Hansen I, Eggum BO. 1987. The nutritive value of amaranth seed (Amaranthus
caudatus) - 2. As a supplement to cereals. Plant Food Hum Nutr 36(4):325-34.
Peñarrieta JM, Alvarado JA, Åkesson B, Bergenståhl B. 2008. Total antioxidant capacity and content of
flavonoids and other phenolic compounds in canihua (Chenopodium pallidicaule): An Andean pseudocereal.
Mol Nutr Food Res 52(6):708-17.
83
Petterson, D.S. (2004b), Lupine Overview In: Encyclopedia of Seed Science, Elsevier, Colin Wrigley, Oxford:
166-174.
Petterson, D.S. (2004a), Amaranth In: Encyclopedia of Seed Science, Elsevier, Colin Wrigley, Oxford: 1-10
Peiretti PG, Gai F, Tassone S. 2013. Fatty acid profile and nutritive value of quinoa (Chenopodium quinoa
Willd.) seeds and plants at different growth stages. Anim Feed Sci Technol 183(1-2):56-61.
Pham, CB, Del Rosario RR. 1984. Studies on the development of texturised vegetable products by the extrusion
process. Journal of Food Technology, 19:549–59.
Pham CB, Del Rosario RR. 1986. Studies on the development of texturized vegetable products by the extrusion
process. III. Effects of processing variables on thiamine retention. Journal of Food Technology. 21. 569–576.
Referenced from: Singh S, Gamlath S, Wakeling L. 2007. Nutritional aspects of food extrusion: A review. Int J
Food Sci Technol 42(8):916-29.
Pisarikova B, Kráčmar S, Herzig I. 2005. Amino acid contents and biological value of protein in various
amaranth species. Czech J Anim Sci 50(4):169-74.
Písaríková B, Zralý Z. 2010. Dietary fibre content in lupine (Lupinus albus L.) and soya (Glycine max L.) seeds.
Acta Vet Brno 79(2):211-6.
Qiang X, YongLie C, QianBing W. 2009. Health benefit application of functional oligosaccharides. Carbohydr
Polym 77(3):435-41.
Qureshi AA, Mo H, Packer L, Peterson DM. 2000. Isolation and identification of novel tocotrienols from rice
bran with hypocholesterolemic, antioxidant, and antitumor properties. J Agric Food Chem 48(8):3130-40.
Rao SK., Artz WE 1989. Effect of extrusion on lipid oxidation. Journal of Food Science 54: 1580-83.
Ramos Diaz JM, Kirjoranta S, Tenitz S, Penttilä PA, Serimaa R, Lampi AM, Jouppila K. 2013. Use of amaranth,
quinoa and kañiwa in extruded corn-based snacks. J Cereal Sci 58(1):59-67.
Reeds PJ. 2000. Dispensable and indispensable amino acids for humans. J Nutr 130(7):1835S-40S.
Repo-Carrasco-Valencia RAM, Encina CR, Binaghi MJ, Greco CB, de Ferrer PAR. (2010a). Effects of roasting
and boiling of quinoa, kiwicha and kañiwa on composition and availability of minerals in vitro. J Sci Food Agric
90(12):2068-73.
Repo-Carrasco R, Espinoza C, Jacobsen S-. 2003. Nutritional value and use of the andean crops quinoa
(Chenopodium quinoa) and kañiwa (Chenopodium pallidicaule). Food Rev Int 19(1-2):179-89.
Repo-Carrasco R. 1992. Andean Crops and Infant Nourishment., Report B 25 Finland: University of Helsinki.
Institute of Development Studies. Referenced from : Repo-Carrasco R, Espinoza C, Jacobsen S-. 2003.
Nutritional value and use of the andean crops quinoa (Chenopodium quinoa) and kañiwa (Chenopodium
pallidicaule). Food Rev Int 19(1-2):179-89.
Repo-Carrasco-Valencia R, de La Cruz AA, Alvarez JCI, Kallio H. 2009a. Chemical and functional
characterization of kañiwa (Chenopodium pallidicaule) seed, extrudate and bran. Plant Foods Hum Nutr
64(2):94-101.
Repo-Carrasco-Valencia R, Hellström JK, Pihlava J-, Mattila PH. 2010b. Flavonoids and other phenolic
compounds in Andean indigenous seeds: Quinoa (Chenopodium quinoa), kañiwa (Chenopodium pallidicaule)
and kiwicha (Amaranthus caudatus). Food Chem 120(1):128-33.
84
Repo-Carrasco-Valencia R, Peña J, Kallio H, Salminen S. 2009b. Dietary fiber and other functional components
in two varieties of crude and extruded kiwicha (Amaranthus caudatus). J Cereal Sci 49(2):219-24.
Riaz N M. 2005, Extruded snacks, In: Y. H. Hui. Handbook of Food Science Technology and Engineering, 4,
CRC Press :1-8.
Rinaldi VEA, Ng PKW, Bennink MR. 2000. Effects of extrusion on dietary fiber and isoflavone contents of
wheat extrudates enriched with wet okara. Cereal Chem 77(2):237-40.
Rommel A, Wrolstad RE. 1993. Influence of acid and base hydrolysis on the phenolic composition of red
raspberry juice. Journal of Agricultural and Food Chemistry. 41(8):1237-41Rosell CM, Cortez G, Repo-Carrasco
R. 2009. Breadmaking use of andean crops quinoa, kañiwa, kiwicha, and tarwi. Cereal Chem 86(4):386-92.
Ruales J, Nair BM. 1993. Saponins, phytic acid, tannins and protease inhibitors in quinoa (Chenopodium quinoa,
Willd) seeds. Food Chem 48(2):137-43.
Saalia FK, Phillips RD. 2011. Degradation of aflatoxins by extrusion cooking: Effects on nutritional quality of
extrudates. LWT - Food Sci Technol 44(6):1496-501.
Sarawong C, Schoenlechner R, Sekiguchi K, Berghofer E, Ng PKW. 2014. Effect of extrusion cooking on the
physicochemical properties, resistant starch, phenolic content and antioxidant capacities of green banana flour.
Food Chem 14333-9.
Saunders RM, Becker R. 1984. Amaranthus: a potential food and feed resource. Adv Cereal Sci Technol 6: 357-
96.
Schöeneberger H, Gross R, Cremer HD, Elmadfa I. 1982. Composition and protein quality of Lupinus mutabilis.
J Nutr 112(1):70-6.
Sbihi HM, Nehdi IA, Tan CP, Al-Resayes SI. 2013. Bitter and sweet lupin (Lupinus albus L.) seeds and seed
oils: A comparison study of their compositions and physicochemical properties. Ind Crops Prod 49573-9.
Scalbert A, Manach C, Morand C, Rémésy C, Jiménez L. 2005. Dietary polyphenols and the prevention of
diseases. Crit Rev Food Sci Nutr 45(4):287-306.
Scarpati De Briceño. (1979). Aislamiento y caracterizacion de almidón de quinua (Chenopodium quinoa) y
canihua (Chenopodium pallidicaule). Universidad Nacional Agaria, Lima Peru. Congreso Nacional en Ciencia y
Tecnologia de Alimentos, 30. Referenced from : Repo-Carrasco R, Espinoza C, Jacobsen S-. 2003. Nutritional
value and use of the andean crops quinoa (Chenopodium quinoa) and kañiwa (Chenopodium pallidicaule). Food
Rev Int 19(1-2):179-89.
Segura-Nieto M, Barba de la Rosa A.P, Paredes-Lopez O. 1994. Biochemistry of amaranth proteins. In: Pared-
Lopez, O. (Ed.), Amaranth: Biology, Chemistry and Technology. CRC Press, Boca Raton: 75–106.
Semwal, AD, Sharma AK, Arya, SS. 1994. Factors influencing lipid autoxidation in dehydrated precooked rice
and Bengal Gram dhal. Journal of Food Science and Technology, 31: 293–297.
Shahidi, F, Naczk, M. 1995. Food phenolics. Lancaster, USA: Technomic Publishing Co., Inc.. Referenced from:
Repo-Carrasco-Valencia R, Hellström JK, Pihlava J, Mattila PH. (2010). Flavonoids and other phenolic
compounds in Andean indigenous seeds: Quinoa (Chenopodium quinoa), kañiwa (Chenopodium pallidicaule)
and kiwicha (Amaranthus caudatus). Food Chem 120(1):128-33.
Sharma P, Gujral HS, Singh B. 2012. Antioxidant activity of barley as affected by extrusion cooking. Food
Chem 131(4):1406-13.
85
Shen J, Shao X. 2005. A comparison of accelerated solvent extraction, Soxhlet extraction, and ultrasonic-assisted
extraction for analysis of terpenoids and sterols in tobacco. Anal Bioanal Chem 383(6):1003-8.
Siger A, Czubinski J, Kachlicki P, Dwiecki K, Lampart-Szczapa E, Nogala-Kalucka M. 2012. Antioxidant
activity and phenolic content in three lupin species. J Food Compos Anal 25(2):190-7.
Singh S, Gamlath S, Wakeling L. 2007. Nutritional aspects of food extrusion: A review. Int J Food Sci Technol
42(8):916-29.
Spencer JPE. 2008. Food for thought: The role of dietary flavonoids in enhancing human memory, learning and
neuro-cognitive performance. Proc Nutr Soc 67(2):238-52.
Srihara P, Alexander JC. 1984. Effect of heat treatment on nutritive quality of plant protein blends. Canadian
Institute of Food Science and Technology Journal, 17:237–41.
Stangl V, Lorenz M, Stangl K. 2006. The role of tea and tea flavonoids in cardiovascular health. Mol Nutr Food
Res 50(2):218-28.
Stark KD. 2012. Omega 3 and Omega 6 Fatty Acids. In: Leo M . L . Nollet and Fidel Toldrá, Ed. Handbook of
Analysis of Active Compounds in Functional Foods. CRC press. P 725-46.
Stikic R, Glamoclija D, Demin M, Vucelic-Radovic B, Jovanovic Z, Milojkovic-Opsenica D, Jacobsen S-,
Milovanovic M. 2012. Agronomical and nutritional evaluation of quinoa seeds (Chenopodium quinoa Willd.) as
an ingredient in bread formulations. J Cereal Sci 55(2):132-8.
Stuardo M, San Martín R. 2008. Antifungal properties of quinoa (Chenopodium quinoa Willd) alkali treated
saponins against Botrytis cinerea. Ind Crops Prod 27(3):296-302.
Sujak A, Kotlarz A, Strobel W. 2006. Compositional and nutritional evaluation of several lupin seeds. Food
Chem 98(4):711-9.
Suknark K, Lee J, Eitenmiller RR, Phillips RD. 2001. Stability of tocopherols and retinyl palmitate in snack
extrudates. J Food Sci 66(6):897-902.
Tapia M, Gandarinas H, Alandia S, Cardozo A, Mujica A. 1979. Quinua y la kañiwa: cultivos andinos. Bogota,
Colombia. Instituto interamericano de Ciencias Agricolas. 11(80): 205–214.
Tapia-Blácido D, Mauri AN, Menegalli FC, Sobral PJA, Añón MC. 2007. Contribution of the starch, protein,
and lipid fractions to the physical, thermal, and structural properties of amaranth (Amaranthus caudatus) flour
films. J Food Sci 72(5):E293-300.
Tester RF, Karkalas J. 2002. Starch. In: Steinbuchel A, Vandamme EJ, De Baets S, Ed. Biopolymers. Volume 6.
Polysaccharides II: Polysaccharides from Eukaryotes. Wiley–VCH. Weinheim: p 381–438.
Tiwari U, Cummins E. 2009. Nutritional importance and effect of processing on tocols in cereals. Trends Food
Sci Technol 20(11-12):511-20.
Torres A, Frias J, Vidal-Valverde C. 2005. Changes in chemical composition of lupin seeds (Lupinus
angustifolius) after selective α-galactoside extraction. J Sci Food Agric 85(14):2468-74.
Torres A, Frias J, Granito M, Guerra M, Vidal-Valverde C. 2007. Chemical, biological and sensory evaluation of
pasta products supplemented with a-galactoside-free lupin flours. J Sci Food Agric 87(1):74-81.
86
Tosi EA, Ré E, Lucero H, Masciarelli R. 2001. Dietary fiber obtained from amaranth (Amaranthus cruentus)
seed by differential milling. Food Chem 73(4):441-3.
Trugo et al. 2004. Lupin breeding, Encyclopedia of Seed Science: 174-181.
Valencia SAC. 2004 Quinoa, Encyclopedia of Seed Science ed. Editor-in-Chief: Colin Wrigley, Elsevier: 1-8.
Walstra P. 2002. Physical Chemistry of Foods. CRCnetbase online version. Available at:
http://www.crcnetbase.com.libproxy.helsinki.fi/isbn/978-0-8247-9355-5.
Watkins SM and German BJ. 2008. Unsaturated Fatty acids. In. Casimir C, Akoh, Min BD, Ed. Food Lipids
Chemistry, Nutrition, and Biotechnology, Third Edition.CRC Press 2008.
White BL, Howard LR, Prior RL. 2010. Polyphenolic composition and antioxidant capacity of extruded
cranberry pomace. J Agric Food Chem 58(7):4037-42.
Woldemicheael, G, Wink M. 2001. Identification and biological activities of triterpenoid saponins from
Chenopodium quinoa. J. Agric. Food Chem. 49, 2327-2332.
Wright KH, Pike OA, Fairbanks DJ, Huber CS. 2002. Composition of Atriplex hortensis, sweet and bitter
Chenopodium quinoa seeds. J Food Sci 67(4):1383-5.
Yagci S, Gögus F. 2009. Effect of incorporation of various food by-products on some nutritional properties of
rice-based extruded foods. Food Sci Technol Int 15(6):571-81.
Zadernowski R, Nowak-Polakowska H, Wicklund T, Fornal L. 1997. Changes in oat lipids affected by
extrusion. Nahrung Food 41(4):224-7.
Zielinski H, Kozlowska H, Lewczuk B. 2001. Bioactive compounds in the cereal grains before and after
hydrothermal processing. Innovative Food Sci Emerg Technol 2(3):159-69.
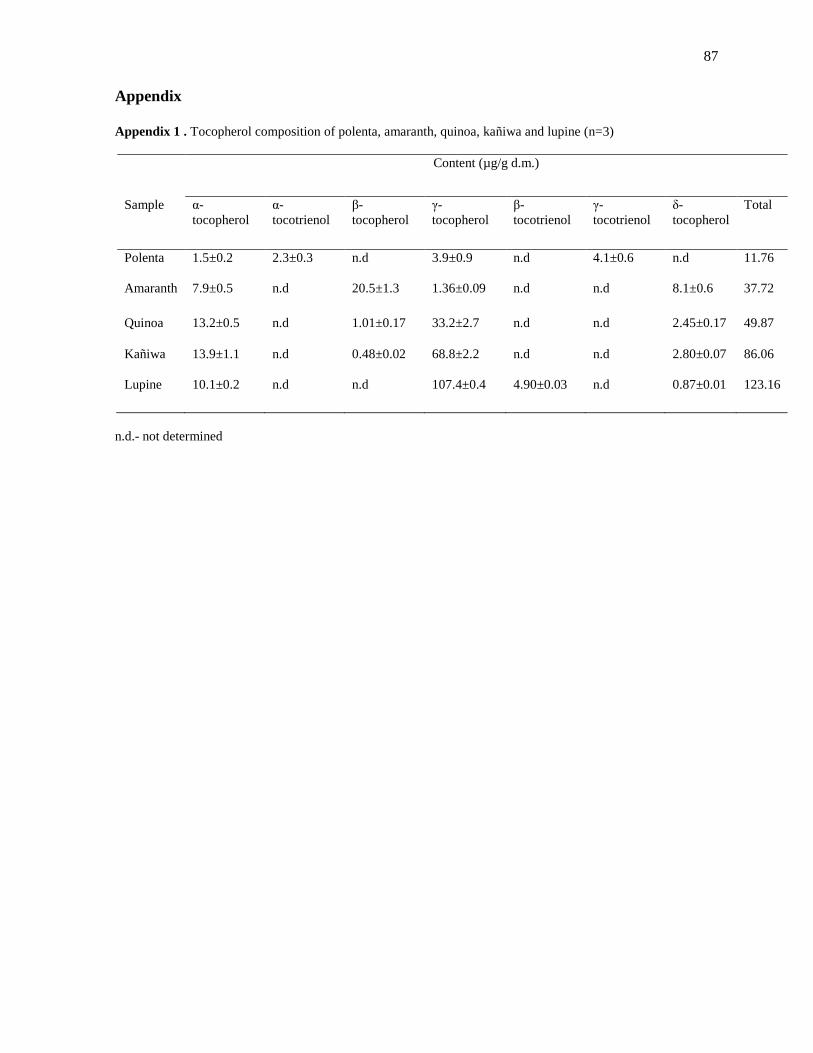
87
Appendix
Appendix 1 . Tocopherol composition of polenta, amaranth, quinoa, kañiwa and lupine (n=3)
Content (µg/g d.m.)
Sample α-
tocopherol
α-
tocotrienol
β-
tocopherol
γ-
tocopherol
β-
tocotrienol
γ-
tocotrienol
δ-
tocopherol
Total
Polenta
1.5±0.2 2.3±0.3 n.d 3.9±0.9 n.d 4.1±0.6 n.d 11.76
Amaranth
7.9±0.5 n.d 20.5±1.3 1.36±0.09 n.d n.d 8.1±0.6 37.72
Quinoa
13.2±0.5 n.d 1.01±0.17 33.2±2.7 n.d n.d 2.45±0.17 49.87
Kañiwa
13.9±1.1 n.d 0.48±0.02 68.8±2.2 n.d n.d 2.80±0.07 86.06
Lupine 10.1±0.2 n.d n.d 107.4±0.4 4.90±0.03 n.d 0.87±0.01 123.16
n.d.- not determined
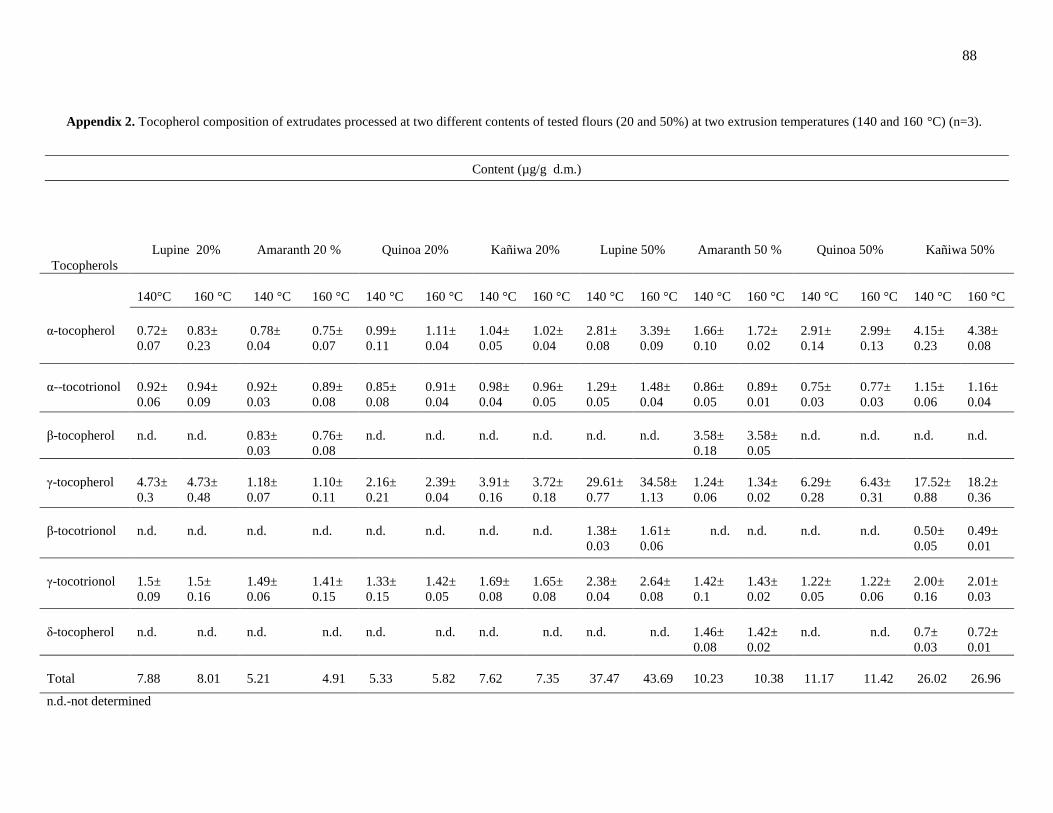
88
Content (µg/g d.m.)
Tocopherols
Lupine 20%
Amaranth 20 %
Quinoa 20%
Kañiwa 20%
Lupine 50%
Amaranth 50 %
Quinoa 50%
Kañiwa 50%
140°C
160 °C
140 °C
160 °C
140 °C
160 °C
140 °C
160 °C
140 °C
160 °C
140 °C
160 °C
140 °C
160 °C
140 °C
160 °C
α-tocopherol
0.72±
0.07
0.83±
0.23
0.78±
0.04
0.75±
0.07
0.99±
0.11
1.11±
0.04
1.04±
0.05
1.02±
0.04
2.81±
0.08
3.39±
0.09
1.66±
0.10
1.72±
0.02
2.91±
0.14
2.99±
0.13
4.15±
0.23
4.38±
0.08
α--tocotrionol
0.92±
0.06
0.94±
0.09
0.92±
0.03
0.89±
0.08
0.85±
0.08
0.91±
0.04
0.98±
0.04
0.96±
0.05
1.29±
0.05
1.48±
0.04
0.86±
0.05
0.89±
0.01
0.75±
0.03
0.77±
0.03
1.15±
0.06
1.16±
0.04
β-tocopherol
n.d.
n.d.
0.83±
0.03
0.76±
0.08
n.d.
n.d.
n.d.
n.d.
n.d.
n.d.
3.58±
0.18
3.58±
0.05
n.d.
n.d.
n.d.
n.d.
γ-tocopherol
4.73±
0.3
4.73±
0.48
1.18±
0.07
1.10±
0.11
2.16±
0.21
2.39±
0.04
3.91±
0.16
3.72±
0.18
29.61±
0.77
34.58±
1.13
1.24±
0.06
1.34±
0.02
6.29±
0.28
6.43±
0.31
17.52±
0.88
18.2±
0.36
β-tocotrionol
n.d.
n.d.
n.d.
n.d.
n.d.
n.d.
n.d.
n.d.
1.38±
0.03
1.61±
0.06
n.d.
n.d.
n.d.
n.d.
0.50±
0.05
0.49±
0.01
γ-tocotrionol
1.5±
0.09
1.5±
0.16
1.49±
0.06
1.41±
0.15
1.33±
0.15
1.42±
0.05
1.69±
0.08
1.65±
0.08
2.38±
0.04
2.64±
0.08
1.42±
0.1
1.43±
0.02
1.22±
0.05
1.22±
0.06
2.00±
0.16
2.01±
0.03
δ-tocopherol
n.d.
n.d.
n.d.
n.d.
n.d.
n.d.
n.d.
n.d.
n.d.
n.d.
1.46±
0.08
1.42±
0.02
n.d.
n.d.
0.7±
0.03
0.72±
0.01
Total
7.88
8.01
5.21
4.91
5.33
5.82
7.62
7.35
37.47
43.69
10.23
10.38
11.17
11.42
26.02
26.96
n.d.-not determined
Appendix 2. Tocopherol composition of extrudates processed at two different contents of tested flours (20 and 50%) at two extrusion temperatures (140 and 160 °C) (n=3).
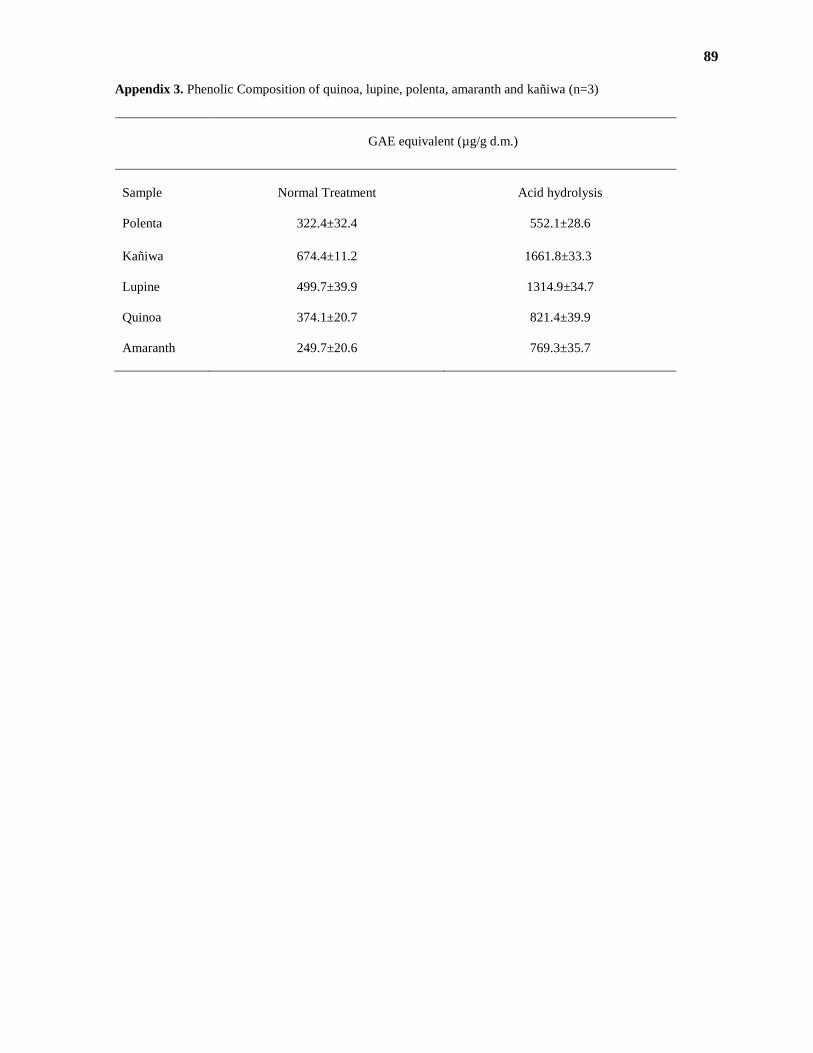
89
Appendix 3. Phenolic Composition of quinoa, lupine, polenta, amaranth and kañiwa (n=3)
GAE equivalent (µg/g d.m.)
Sample
Normal Treatment Acid hydrolysis
Polenta
322.4±32.4
552.1±28.6
Kañiwa
674.4±11.2
1661.8±33.3
Lupine
499.7±39.9
1314.9±34.7
Quinoa
374.1±20.7
821.4±39.9
Amaranth
249.7±20.6
769.3±35.7
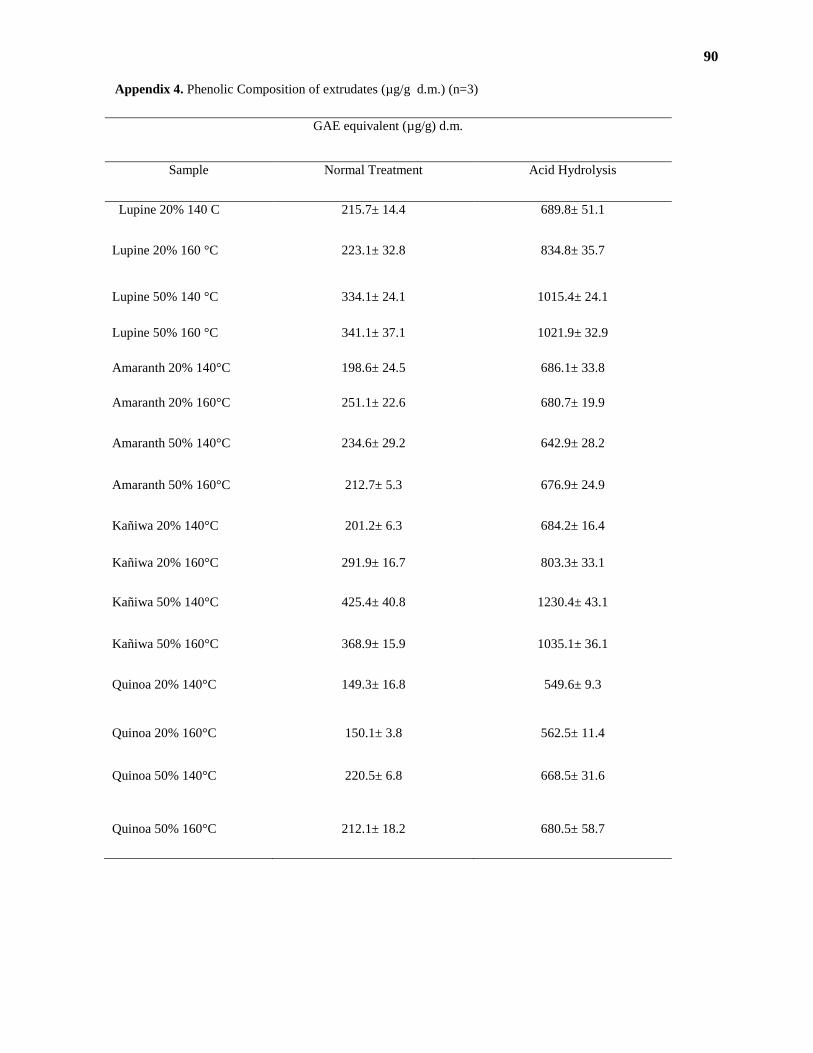
90
Appendix 4. Phenolic Composition of extrudates (µg/g d.m.) (n=3)
GAE equivalent (µg/g) d.m.
Sample Normal Treatment Acid Hydrolysis
Lupine 20% 140 C 215.7± 14.4 689.8± 51.1
Lupine 20% 160 °C 223.1± 32.8 834.8± 35.7
Lupine 50% 140 °C 334.1± 24.1 1015.4± 24.1
Lupine 50% 160 °C 341.1± 37.1 1021.9± 32.9
Amaranth 20% 140°C 198.6± 24.5 686.1± 33.8
Amaranth 20% 160°C 251.1± 22.6 680.7± 19.9
Amaranth 50% 140°C 234.6± 29.2 642.9± 28.2
Amaranth 50% 160°C 212.7± 5.3 676.9± 24.9
Kañiwa 20% 140°C 201.2± 6.3 684.2± 16.4
Kañiwa 20% 160°C 291.9± 16.7 803.3± 33.1
Kañiwa 50% 140°C 425.4± 40.8 1230.4± 43.1
Kañiwa 50% 160°C 368.9± 15.9 1035.1± 36.1
Quinoa 20% 140°C 149.3± 16.8 549.6± 9.3
Quinoa 20% 160°C 150.1± 3.8 562.5± 11.4
Quinoa 50% 140°C 220.5± 6.8 668.5± 31.6
Quinoa 50% 160°C 212.1± 18.2 680.5± 58.7
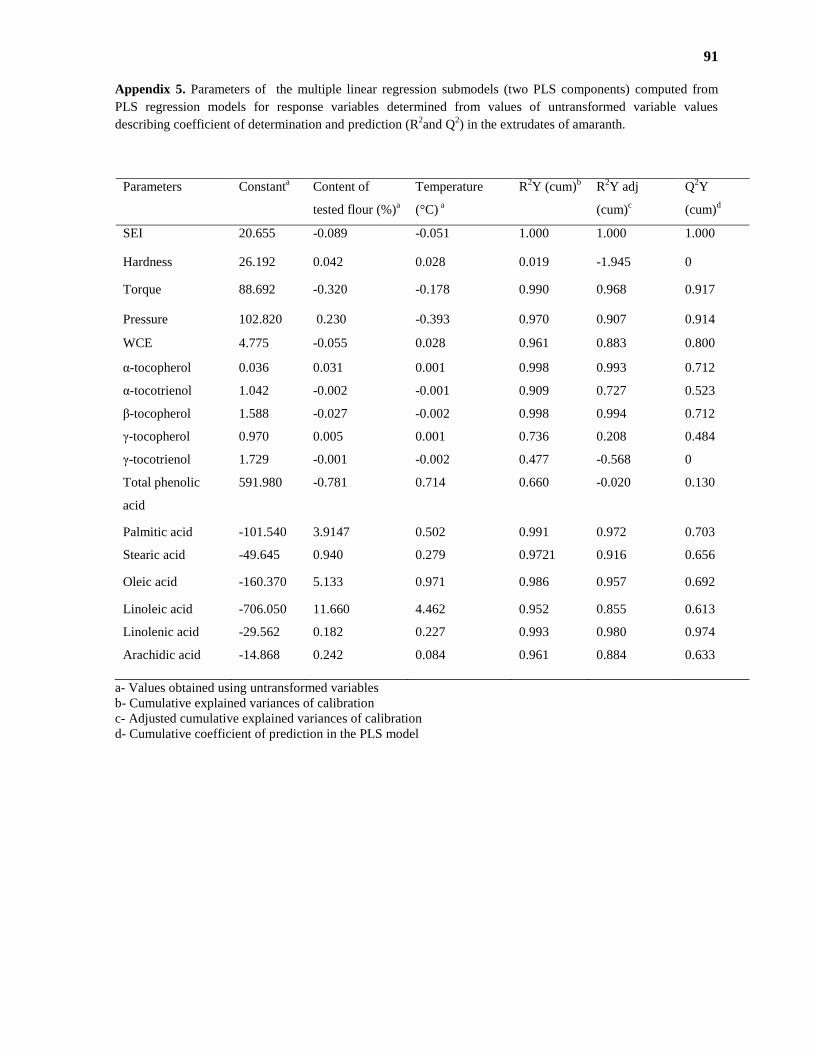
91
Appendix 5. Parameters of the multiple linear regression submodels (two PLS components) computed from
PLS regression models for response variables determined from values of untransformed variable values
describing coefficient of determination and prediction (R2and Q
2) in the extrudates of amaranth.
Parameters Constanta Content of
tested flour (%)a
Temperature
(°C) a
R2Y (cum)
b R
2Y adj
(cum)c
Q2Y
(cum)d
SEI 20.655 -0.089 -0.051 1.000 1.000 1.000
Hardness 26.192 0.042 0.028 0.019 -1.945 0
Torque 88.692 -0.320 -0.178 0.990 0.968 0.917
Pressure 102.820 0.230 -0.393 0.970 0.907 0.914
WCE 4.775 -0.055 0.028 0.961 0.883 0.800
α-tocopherol 0.036 0.031 0.001 0.998 0.993 0.712
α-tocotrienol 1.042 -0.002 -0.001 0.909 0.727 0.523
β-tocopherol 1.588 -0.027 -0.002 0.998 0.994 0.712
γ-tocopherol 0.970 0.005 0.001 0.736 0.208 0.484
γ-tocotrienol 1.729 -0.001 -0.002 0.477 -0.568 0
Total phenolic
acid
591.980 -0.781 0.714 0.660 -0.020 0.130
Palmitic acid -101.540 3.9147 0.502 0.991 0.972 0.703
Stearic acid -49.645 0.940 0.279 0.9721 0.916 0.656
Oleic acid -160.370 5.133 0.971 0.986 0.957 0.692
Linoleic acid -706.050 11.660 4.462 0.952 0.855 0.613
Linolenic acid -29.562 0.182 0.227 0.993 0.980 0.974
Arachidic acid -14.868 0.242 0.084 0.961 0.884 0.633
a- Values obtained using untransformed variables
b- Cumulative explained variances of calibration
c- Adjusted cumulative explained variances of calibration
d- Cumulative coefficient of prediction in the PLS model
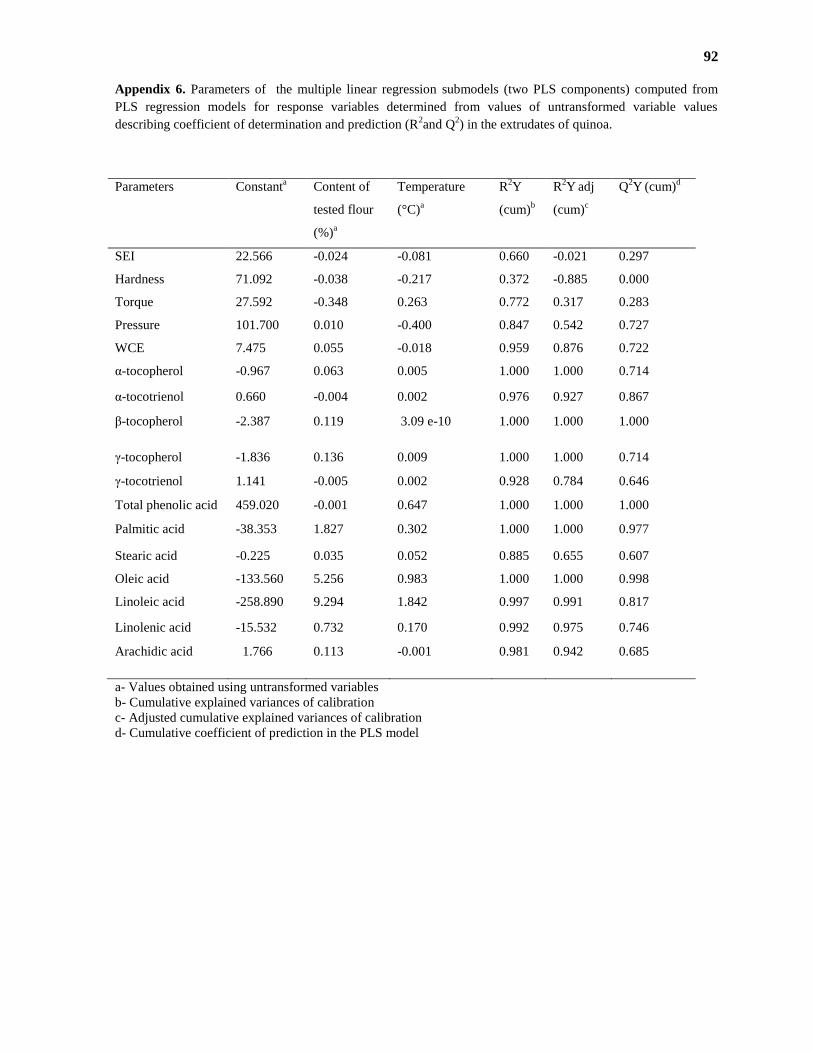
92
Appendix 6. Parameters of the multiple linear regression submodels (two PLS components) computed from
PLS regression models for response variables determined from values of untransformed variable values
describing coefficient of determination and prediction (R2and Q
2) in the extrudates of quinoa.
Parameters Constanta
Content of
tested flour
(%)a
Temperature
(°C)a
R2Y
(cum)b
R2Y
adj
(cum)c
Q2Y
(cum)
d
SEI 22.566 -0.024 -0.081 0.660 -0.021 0.297
Hardness 71.092 -0.038 -0.217 0.372 -0.885 0.000
Torque 27.592 -0.348 0.263 0.772 0.317 0.283
Pressure 101.700 0.010 -0.400 0.847 0.542 0.727
WCE 7.475 0.055 -0.018 0.959 0.876 0.722
α-tocopherol -0.967 0.063 0.005 1.000 1.000 0.714
α-tocotrienol 0.660 -0.004 0.002 0.976 0.927 0.867
β-tocopherol -2.387 0.119 3.09 e-10 1.000 1.000 1.000
γ-tocopherol -1.836 0.136 0.009 1.000 1.000 0.714
γ-tocotrienol 1.141 -0.005 0.002 0.928 0.784 0.646
Total phenolic acid 459.020 -0.001 0.647 1.000 1.000 1.000
Palmitic acid -38.353 1.827 0.302 1.000 1.000 0.977
Stearic acid -0.225 0.035 0.052 0.885 0.655 0.607
Oleic acid -133.560 5.256 0.983 1.000 1.000 0.998
Linoleic acid -258.890 9.294 1.842 0.997 0.991 0.817
Linolenic acid -15.532 0.732 0.170 0.992 0.975 0.746
Arachidic acid 1.766 0.113 -0.001 0.981 0.942 0.685
a- Values obtained using untransformed variables
b- Cumulative explained variances of calibration
c- Adjusted cumulative explained variances of calibration
d- Cumulative coefficient of prediction in the PLS model
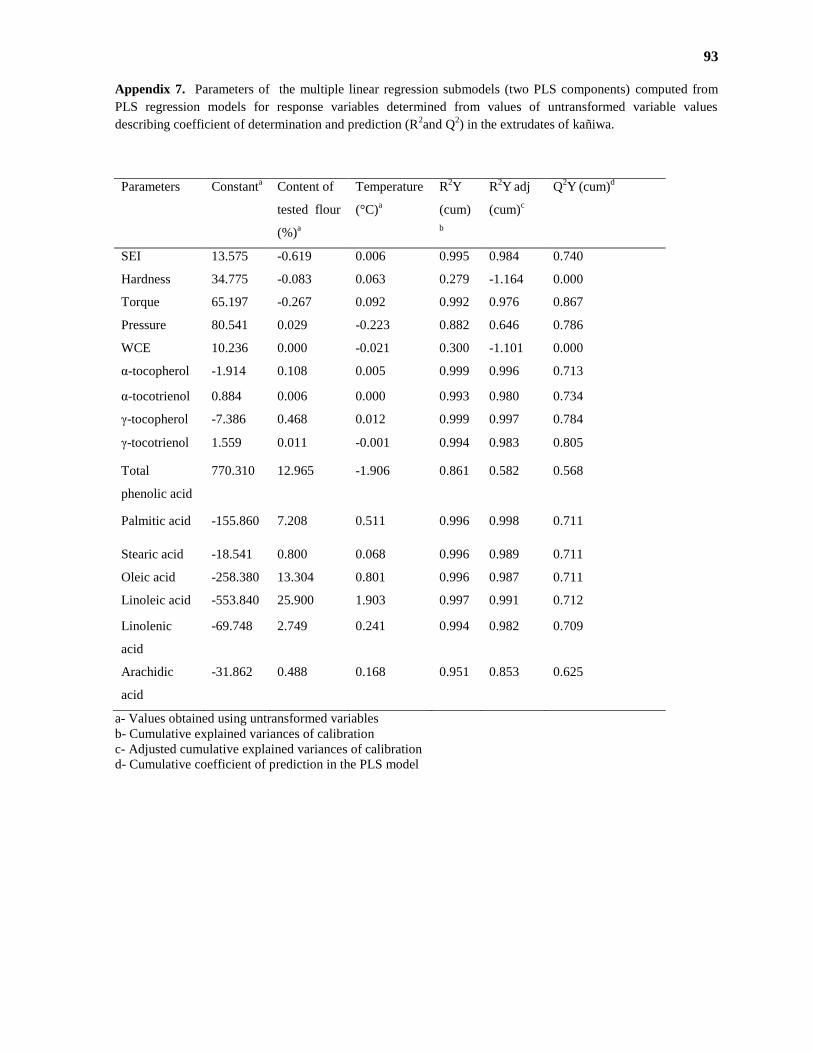
93
Appendix 7. Parameters of the multiple linear regression submodels (two PLS components) computed from
PLS regression models for response variables determined from values of untransformed variable values
describing coefficient of determination and prediction (R2and Q
2) in the extrudates of kañiwa.
Parameters Constanta
Content of
tested flour
(%)a
Temperature
(°C)a
R2Y
(cum)
b
R2Y
adj
(cum)c
Q2Y
(cum)
d
SEI 13.575 -0.619 0.006 0.995 0.984 0.740
Hardness 34.775 -0.083 0.063 0.279 -1.164 0.000
Torque 65.197 -0.267 0.092 0.992 0.976 0.867
Pressure 80.541 0.029 -0.223 0.882 0.646 0.786
WCE 10.236 0.000 -0.021 0.300 -1.101 0.000
α-tocopherol -1.914 0.108 0.005 0.999 0.996 0.713
α-tocotrienol 0.884 0.006 0.000 0.993 0.980 0.734
γ-tocopherol -7.386 0.468 0.012 0.999 0.997 0.784
γ-tocotrienol 1.559 0.011 -0.001 0.994 0.983 0.805
Total
phenolic acid
770.310 12.965 -1.906 0.861 0.582 0.568
Palmitic acid -155.860 7.208 0.511 0.996 0.998 0.711
Stearic acid -18.541 0.800 0.068 0.996 0.989 0.711
Oleic acid -258.380 13.304 0.801 0.996 0.987 0.711
Linoleic acid -553.840 25.900 1.903 0.997 0.991 0.712
Linolenic
acid
-69.748 2.749 0.241 0.994 0.982 0.709
Arachidic
acid
-31.862 0.488 0.168 0.951 0.853 0.625
a- Values obtained using untransformed variables
b- Cumulative explained variances of calibration
c- Adjusted cumulative explained variances of calibration
d- Cumulative coefficient of prediction in the PLS model
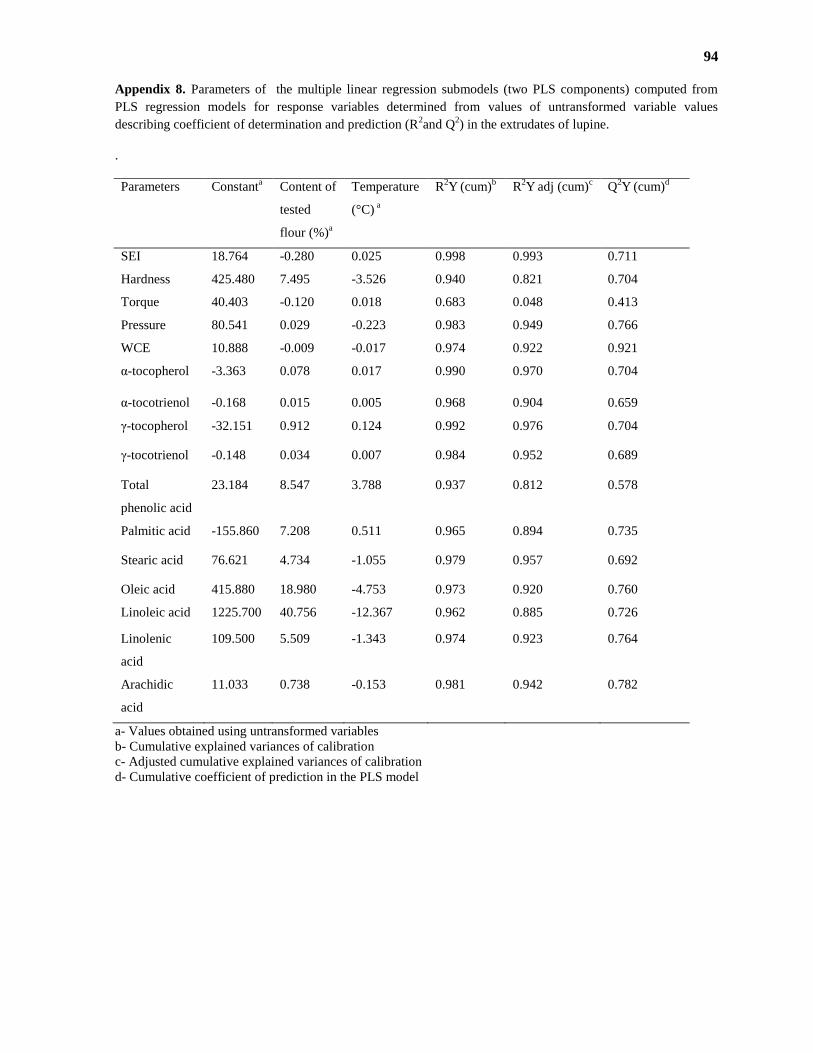
94
Appendix 8. Parameters of the multiple linear regression submodels (two PLS components) computed from
PLS regression models for response variables determined from values of untransformed variable values
describing coefficient of determination and prediction (R2and Q
2) in the extrudates of lupine.
.
Parameters Constanta Content of
tested
flour (%)a
Temperature
(°C) a
R2Y
(cum)
b R
2Y
adj (cum)
c Q
2Y
(cum)
d
SEI 18.764 -0.280 0.025 0.998 0.993 0.711
Hardness 425.480 7.495 -3.526 0.940 0.821 0.704
Torque 40.403 -0.120 0.018 0.683 0.048 0.413
Pressure 80.541 0.029 -0.223 0.983 0.949 0.766
WCE 10.888 -0.009 -0.017 0.974 0.922 0.921
α-tocopherol -3.363 0.078 0.017 0.990 0.970 0.704
α-tocotrienol -0.168 0.015 0.005 0.968 0.904 0.659
γ-tocopherol -32.151 0.912 0.124 0.992 0.976 0.704
γ-tocotrienol -0.148 0.034 0.007 0.984 0.952 0.689
Total
phenolic acid
23.184 8.547 3.788 0.937 0.812 0.578
Palmitic acid -155.860 7.208 0.511 0.965 0.894 0.735
Stearic acid 76.621 4.734 -1.055 0.979 0.957 0.692
Oleic acid 415.880 18.980 -4.753 0.973 0.920 0.760
Linoleic acid 1225.700 40.756 -12.367 0.962 0.885 0.726
Linolenic
acid
109.500 5.509 -1.343 0.974 0.923 0.764
Arachidic
acid
11.033 0.738 -0.153 0.981 0.942 0.782
a- Values obtained using untransformed variables
b- Cumulative explained variances of calibration
c- Adjusted cumulative explained variances of calibration
d- Cumulative coefficient of prediction in the PLS model
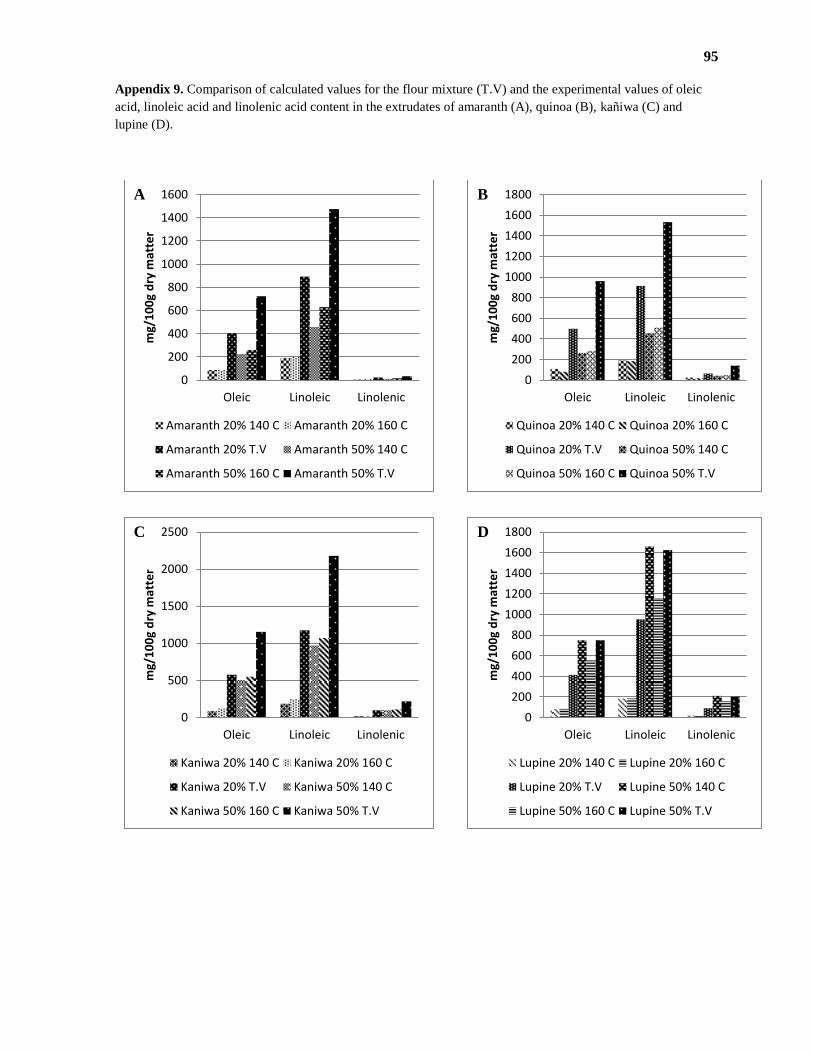
95
Appendix 9. Comparison of calculated values for the flour mixture (T.V) and the experimental values of oleic
acid, linoleic acid and linolenic acid content in the extrudates of amaranth (A), quinoa (B), kañiwa (C) and
lupine (D).
0
200
400
600
800
1000
1200
1400
1600
Oleic Linoleic Linolenic
mg/
10
0g
dry
mat
ter
Amaranth 20% 140 C Amaranth 20% 160 C
Amaranth 20% T.V Amaranth 50% 140 C
Amaranth 50% 160 C Amaranth 50% T.V
A
0
200
400
600
800
1000
1200
1400
1600
1800
Oleic Linoleic Linolenic
mg/
10
0g
dry
mat
ter
Quinoa 20% 140 C Quinoa 20% 160 C
Quinoa 20% T.V Quinoa 50% 140 C
Quinoa 50% 160 C Quinoa 50% T.V
B
0
500
1000
1500
2000
2500
Oleic Linoleic Linolenic
mg/
10
0g
dry
mat
ter
Kaniwa 20% 140 C Kaniwa 20% 160 C
Kaniwa 20% T.V Kaniwa 50% 140 C
Kaniwa 50% 160 C Kaniwa 50% T.V
C
0
200
400
600
800
1000
1200
1400
1600
1800
Oleic Linoleic Linolenic
mg/
10
0g
dry
mat
ter
Lupine 20% 140 C Lupine 20% 160 C
Lupine 20% T.V Lupine 50% 140 C
Lupine 50% 160 C Lupine 50% T.V
D
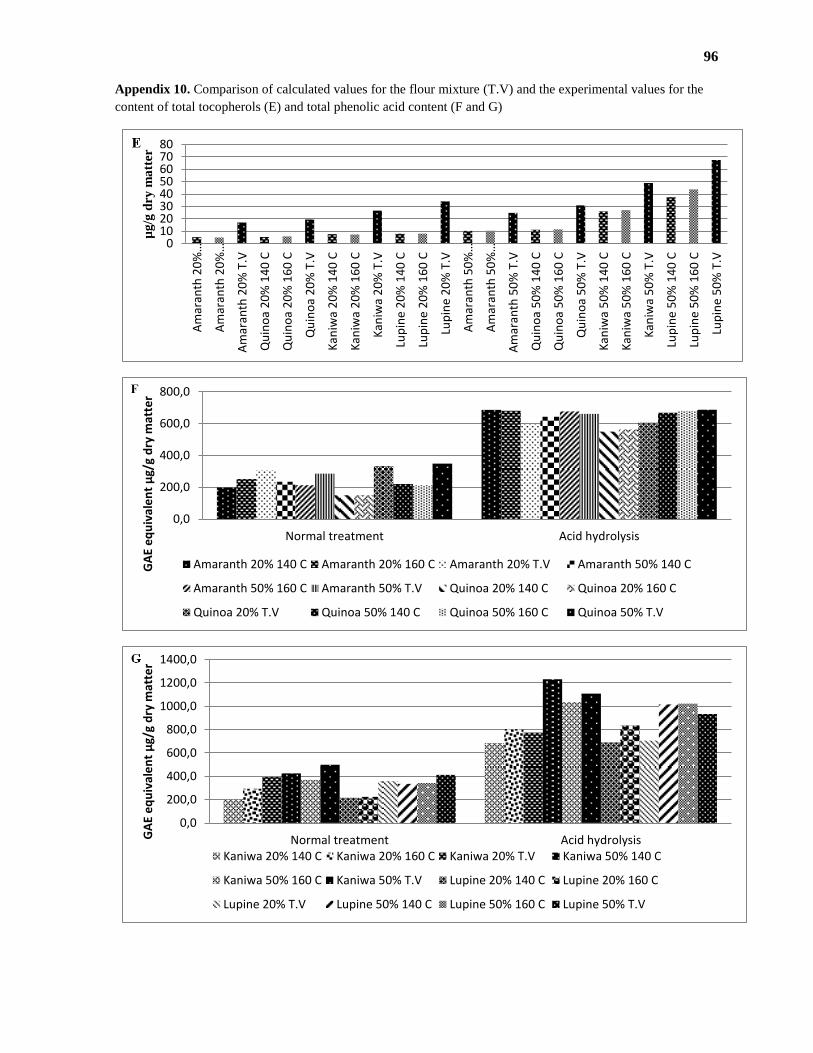
96
Appendix 10. Comparison of calculated values for the flour mixture (T.V) and the experimental values for the
content of total tocopherols (E) and total phenolic acid content (F and G)
01020304050607080
Am
aran
th 2
0%
…
Am
aran
th 2
0%
…
Am
aran
th 2
0%
T.V
Qu
ino
a 2
0%
14
0 C
Qu
ino
a 2
0%
16
0 C
Qu
ino
a 2
0%
T.V
Kan
iwa
20
% 1
40
C
Kan
iwa
20
% 1
60
C
Kan
iwa
20
% T
.V
Lup
ine
20
% 1
40
C
Lup
ine
20
% 1
60
C
Lup
ine
20
% T
.V
Am
aran
th 5
0%
…
Am
aran
th 5
0%
…
Am
aran
th 5
0%
T.V
Qu
ino
a 5
0%
14
0 C
Qu
ino
a 5
0%
16
0 C
Qu
ino
a 5
0%
T.V
Kan
iwa
50
% 1
40
C
Kan
iwa
50
% 1
60
C
Kan
iwa
50
% T
.V
Lup
ine
50
% 1
40
C
Lup
ine
50
% 1
60
C
Lup
ine
50
% T
.V
µg
/g d
ry m
att
er
0,0
200,0
400,0
600,0
800,0
Normal treatment Acid hydrolysis
GA
E e
qu
ival
en
t µ
g/g
dry
mat
ter
Amaranth 20% 140 C Amaranth 20% 160 C Amaranth 20% T.V Amaranth 50% 140 C
Amaranth 50% 160 C Amaranth 50% T.V Quinoa 20% 140 C Quinoa 20% 160 C
Quinoa 20% T.V Quinoa 50% 140 C Quinoa 50% 160 C Quinoa 50% T.V
0,0
200,0
400,0
600,0
800,0
1000,0
1200,0
1400,0
Normal treatment Acid hydrolysisGA
E e
qu
ival
en
t µ
g/g
dry
mat
ter
Kaniwa 20% 140 C Kaniwa 20% 160 C Kaniwa 20% T.V Kaniwa 50% 140 C
Kaniwa 50% 160 C Kaniwa 50% T.V Lupine 20% 140 C Lupine 20% 160 C
Lupine 20% T.V Lupine 50% 140 C Lupine 50% 160 C Lupine 50% T.V
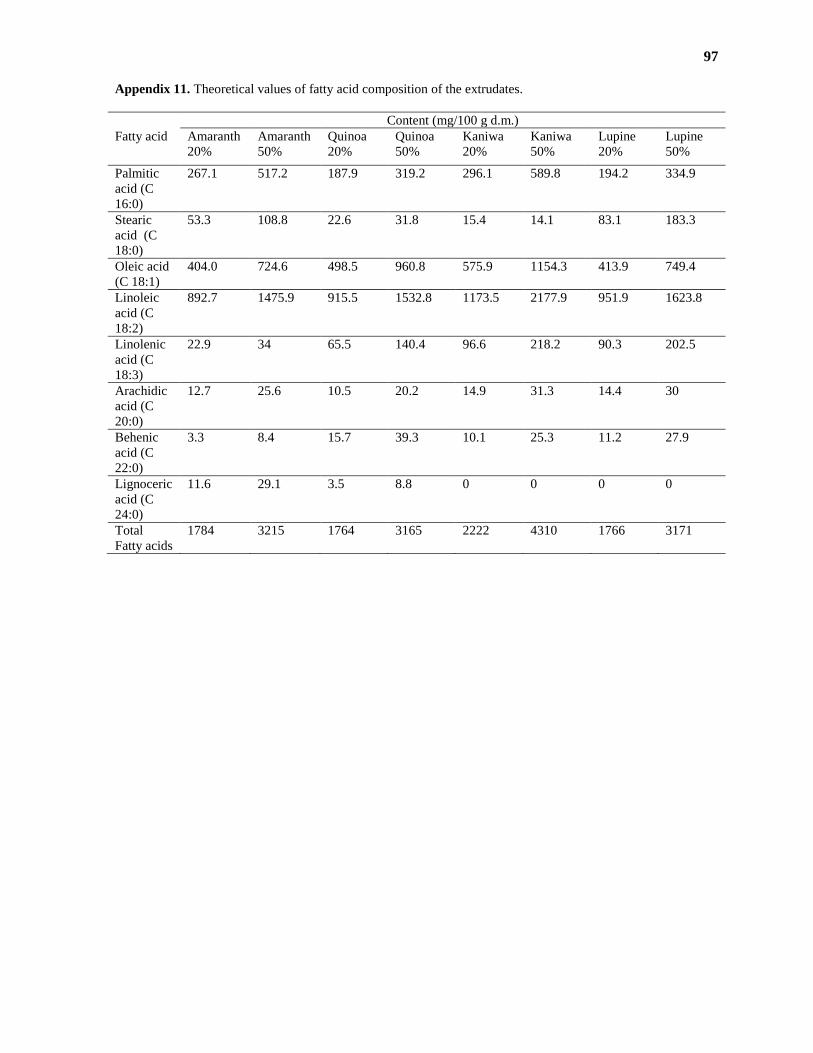
97
Appendix 11. Theoretical values of fatty acid composition of the extrudates.
Content (mg/100 g d.m.)
Fatty acid Amaranth
20%
Amaranth
50%
Quinoa
20%
Quinoa
50%
Kaniwa
20%
Kaniwa
50%
Lupine
20%
Lupine
50%
Palmitic
acid (C
16:0)
267.1 517.2 187.9 319.2 296.1 589.8 194.2 334.9
Stearic
acid (C
18:0)
53.3 108.8 22.6 31.8 15.4 14.1 83.1 183.3
Oleic acid
(C 18:1)
404.0 724.6 498.5 960.8 575.9 1154.3 413.9 749.4
Linoleic
acid (C
18:2)
892.7 1475.9 915.5 1532.8 1173.5 2177.9 951.9 1623.8
Linolenic
acid (C
18:3)
22.9 34 65.5 140.4 96.6 218.2 90.3 202.5
Arachidic
acid (C
20:0)
12.7 25.6 10.5 20.2 14.9 31.3 14.4 30
Behenic
acid (C
22:0)
3.3 8.4 15.7 39.3 10.1 25.3 11.2 27.9
Lignoceric
acid (C
24:0)
11.6 29.1 3.5 8.8 0 0 0 0
Total
Fatty acids
1784 3215 1764 3165 2222 4310 1766 3171
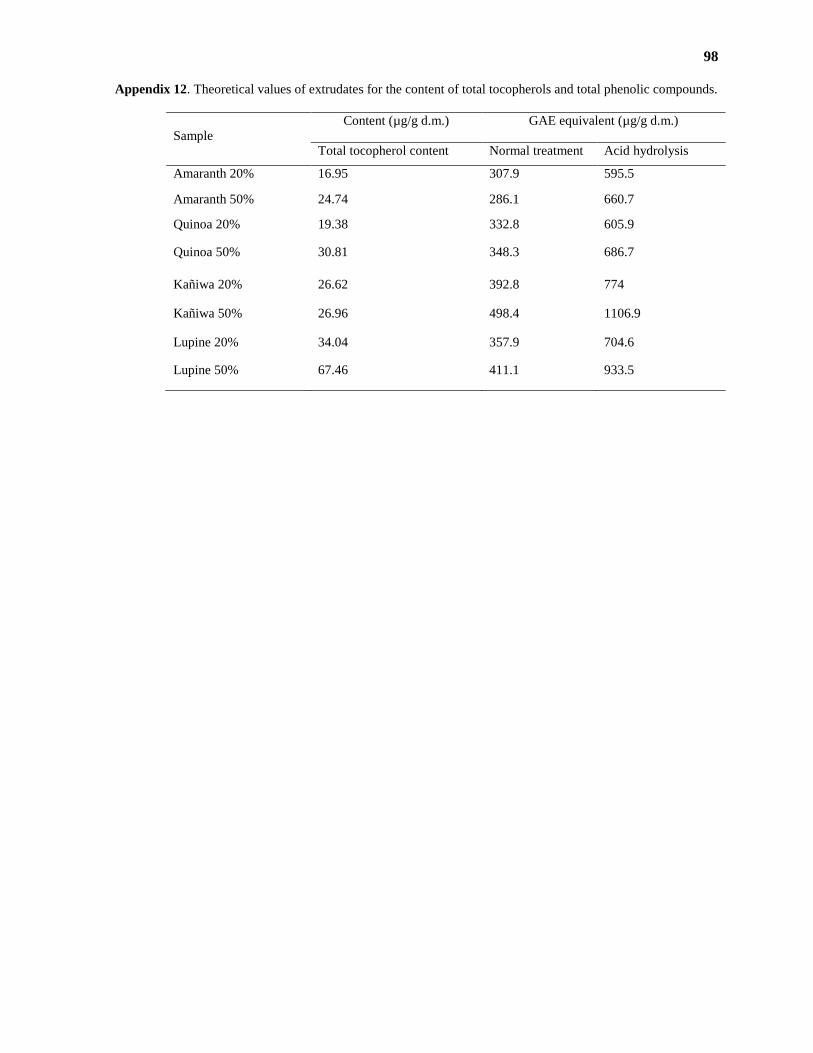
98
Appendix 12. Theoretical values of extrudates for the content of total tocopherols and total phenolic compounds.
Sample
Content (µg/g d.m.) GAE equivalent (µg/g d.m.)
Total tocopherol content Normal treatment Acid hydrolysis
Amaranth 20% 16.95 307.9 595.5
Amaranth 50% 24.74 286.1 660.7
Quinoa 20% 19.38 332.8 605.9
Quinoa 50% 30.81 348.3 686.7
Kañiwa 20% 26.62 392.8 774
Kañiwa 50% 26.96 498.4 1106.9
Lupine 20% 34.04 357.9 704.6
Lupine 50% 67.46 411.1 933.5