Effect of electrical muscle stimulation on upper and lower ...
29
1 Effect of electrical muscle stimulation on upper and lower limb muscles in critically ill patients: A two-center randomized controlled trial Short running title: Electrical muscle stimulation on upper and lower limb muscles in critically ill patients Nobuto Nakanishi 1 , Jun Oto 2 , Rie Tsutsumi 3 , Tomoko Yamamoto 3 , Yoshitoyo Ueno 1 , Emiko Nakataki 4 , Taiga Itagaki 1 , Hiroshi Sakaue 3 , Masaji Nishimura 4 1. Emergency and Critical Care Medicine, Tokushima University Hospital, 2-50-1 Kuramoto, Tokushima 770-8503, Japan 2. Emergency and Disaster Medicine, Tokushima University Hospital, 2-50-1 Kuramoto, Tokushima 770-8503, Japan 3. Department of Nutrition and Metabolism, Tokushima University Graduate School of Biomedical Sciences, 3-18-15 Kuramoto, Tokushima 770-8503, Japan 4. Intensive Care Medicine, Tokushima Prefectural Central Hospital, 1-10-3 Kuramoto, Tokushima 770-8539, Japan Authors email and 16-digit ORCID Nobuto Nakanishi, MD: [email protected], 0000-0002-2394-2688 Jun Oto, MD, PhD: [email protected], 0000-0003-3824-0977 Rie Tsutsumi: [email protected] Tomoko Yamamoto: [email protected] Yoshitoyo Ueno, MD: [email protected] Emiko Nakataki, MD, PhD: [email protected] Taiga Itagaki, MD, PhD: [email protected] The final authenticated version is available online at: https://doi.org/10.1097/CCM.0000000000004522
Transcript of Effect of electrical muscle stimulation on upper and lower ...

1
Effect of electrical muscle stimulation on upper and lower limb muscles in critically ill patients: A
two-center randomized controlled trial
Short running title: Electrical muscle stimulation on upper and lower limb muscles in critically ill
patients
Nobuto Nakanishi1, Jun Oto2, Rie Tsutsumi3, Tomoko Yamamoto3, Yoshitoyo Ueno1, Emiko Nakataki4,
Taiga Itagaki1, Hiroshi Sakaue3, Masaji Nishimura4
1. Emergency and Critical Care Medicine, Tokushima University Hospital, 2-50-1 Kuramoto,
Tokushima 770-8503, Japan
2. Emergency and Disaster Medicine, Tokushima University Hospital, 2-50-1 Kuramoto, Tokushima
770-8503, Japan
3. Department of Nutrition and Metabolism, Tokushima University Graduate School of Biomedical
Sciences, 3-18-15 Kuramoto, Tokushima 770-8503, Japan
4. Intensive Care Medicine, Tokushima Prefectural Central Hospital, 1-10-3 Kuramoto, Tokushima
770-8539, Japan
Authors email and 16-digit ORCID
Nobuto Nakanishi, MD: [email protected], 0000-0002-2394-2688
Jun Oto, MD, PhD: [email protected], 0000-0003-3824-0977
Rie Tsutsumi: [email protected]
Tomoko Yamamoto: [email protected]
Yoshitoyo Ueno, MD: [email protected]
Emiko Nakataki, MD, PhD: [email protected]
Taiga Itagaki, MD, PhD: [email protected]
The final authenticated version is available online at: https://doi.org/10.1097/CCM.0000000000004522

2
Hiroshi Sakaue, MD, PhD: [email protected]
Masaji Nishimura, MD, PhD: [email protected]
Correspondence to: Nobuto Nakanishi, MD
Emergency and Critical Care Medicine, Tokushima University Hospital, 2-50-1 Kuramoto, Tokushima
770-8503, Japan
TEL: 088-633-9347
FAX: 088-633-9339
email: [email protected]
Reprints: None
Conflict of interest: None
Funding: Departmental fund
ABSTRACT
Objectives: Electrical muscle stimulation (EMS) is widely used to enhance lower limb mobilization.
Although upper limb muscle atrophy is common in critically ill patients, EMS application for the upper
limbs has been rarely reported. The purpose of this study was to investigate whether EMS prevents
upper and lower limb muscle atrophy and improves physical function.
Design: Randomized controlled trial.
Setting: Two-center, mixed medical/surgical intensive care unit (ICU).
Patients: Adult patients who were expected to be mechanically ventilated for >48 h and stay in the ICU
for >5 days.
Interventions: Forty-two patients were randomly assigned to the EMS (n = 17) or control group (n =

3
19).
Measurements and Main Results: Primary outcomes were change in muscle thickness and cross-
sectional area of the biceps brachii and rectus femoris from day 1 to 5. Secondary outcomes included
incidence of ICU-acquired weakness (ICU-AW), ICU mobility scale (IMS), length of hospitalization,
and amino acid levels. The change in biceps brachii muscle thickness was −1.9% vs. −11.2% in the
EMS and control (p = 0.007) groups, and the change in cross-sectional area was −2.7% vs. −10.0% (p =
0.03). The change in rectus femoris muscle thickness was −0.9% vs. −14.7% (p = 0.003) and cross-
sectional area was −1.7% vs. −10.4% (p = 0.04). No significant difference was found in ICU-AW (13%
vs. 40%; p = 0.20) and IMS (3 vs. 2; p = 0.42) between the groups. The length of hospitalization was
shorter in the EMS group (23 [19–34] vs. 40 [26–64] days) (p = 0.04). On day 3, the change in the
branched-chain amino acid level was lower in the EMS group (40.5% vs. 71.5%; p = 0.04).
Conclusion: In critically ill patients, EMS prevented upper and lower limb muscle atrophy and
attenuated proteolysis and decreased the length of hospitalization.
Keywords: Electrical muscle stimulation, Muscle atrophy, Intensive care unit-acquired weakness,
Proteolysis, Critically ill patients

4
INTRODUCTION
Skeletal muscle atrophy and physical disability are common in critically ill patients. Muscle
atrophy rapidly occurs after admission to the intensive care unit (ICU), and muscle atrophy reaches
18.8%–20.7% in the lower limbs within 7 days (1). Although most studies have evaluated lower limb
muscle atrophy, our previous study revealed that upper limb muscle mass decreased by 13.2%–16.9%
within 7 days of ICU admission (2). Functional disability also occurs in both the upper and lower limbs
in ICU-acquired weakness (ICU-AW), which is found in nearly 50% of critically ill patients (1).
Early mobilization in the ICU is proven to be effective in preventing muscle atrophy and
physical disability. However, it is not necessarily applicable in all patients. Hence, electrical muscle
stimulation (EMS) has been used as an additional physical therapy for critically ill patients (3).
Previous studies showed that EMS prevented lower limb muscle atrophy in critically ill patients (4, 5)
but did not improve physical function and mobility at discharge from the ICU (6). Lower limb EMS did
not decrease the length of ICU and overall hospitalization (7, 8). EMS is usually used for lower limb
training to enhance mobilization; we believed that its application to only the lower limbs was the cause
of patients’ unchanged physical condition and morbidity level.
Upper limbs play an important role for maneuvers on the bed, rib cage movements, and
mobilization ability. However, investigations on the effects of upper limb rehabilitation on muscle
atrophy and physical function in critically ill patients are limited. To our knowledge, no randomized
controlled trial has investigated the effects of upper limb EMS on muscle atrophy in critically ill
patients. We hypothesized that early application of EMS on the bilateral upper and lower limbs prevents

5
upper and lower limb muscle atrophy and improves physical function and mobility level.
MATERIALS AND METHODS
Study design
This single-blind, randomized controlled trial conducted in the mixed medical/surgical ICUs of
Tokushima University Hospital and Tokushima Prefectural Central Hospital between July 2017 and
January 2020 was approved by both clinical research ethics committees (approval numbers 2849 and
1740, respectively). This study was registered as a clinical trial (UMIN Clinical Trials Registry:
000027054). At the time of enrollment, written informed consent was obtained from patients or their
authorized surrogate decision makers. Patients were randomly assigned to the EMS group (EMS
application in addition to mobilization protocol) or control group (mobilization protocol alone) using
sequentially numbered envelopes. Further details regarding the protocols are described in the
supplemental file.
Study population
We enrolled consecutive adult patients who were expected to be mechanically ventilated for
>48 h and to stay in the ICU for >5 days. Patients were prospectively recruited within 24 h following
ICU admission on weekdays. Patients who met the following criteria were excluded: age under 18
years, trauma or amputation of upper and lower limbs, diagnosis of primary neuromuscular disease,
systolic blood pressure <80 mmHg even with inotropic or vasopressor support, heart rate <40 or >140

6
beats/min, and peripheral oxygen saturation <88% with ventilatory support.
Mobilization program
Patients in both groups were mobilized using the same progressive mobilization protocol
described by Morris et al. (9). The same protocol was used by the two centers in this study. Within 5
days of intervention, the median ICU mobility scale (IMS) level of all patients was 1 (1–3) in both
groups.
Electrical muscle stimulation
EMS was applied in addition to the mobilization program in the EMS group. EMS was
performed using a stimulator (Solius, Minato Medical Science, Co., Ltd., Osaka, Japan). A square wave
on the positive side (650 μS) and an exponential decay wave on the negative side were applied. The
frequency was 20 Hz (200 Hz only at the start of energization). EMS was continuously applied for 30
min with the cycle 400 mS “on” and 600 mS “off.” The 4-channel EMS stimulated four muscle groups
simultaneously using eight electrodes. Rectangular electrodes (40 × 80 mm) were attached to the motor
points of the biceps brachii and rectus femoris muscles. The motor points were identified by scanning
the skin surface where current resulted in maximal muscle contraction. An image of the intervention
was shown in a previous report (1). The EMS group received daily EMS sessions for 30 min from day 1
to day 5. The output current was adjusted to ensure visible contraction of muscles. The EMS intensities
used were 30 mAp (23–37 mAp) for the biceps brachii and 41 mAp (33–50 mAp) for the rectus

7
femoris. Compliance of protocol was 80% (60%–100%) through stimulation sessions (EMS
sessions/study days). We did not use a sham control group because muscle contraction was apparent in
the EMS group.
Ultrasound measurement
Muscle mass of the biceps brachii and rectus femoris muscles was evaluated by measuring the
muscle thickness and cross-sectional area using ultrasound on day 1 and day 5. Two investigators (N.N.
and Y.U.) performed the measurements. Measurement was performed three times with the median value
used for evaluation. Intra-observer and inter-observer correlation coefficients ranged from 0.98 to 0.99
(Table S1). The investigators conducting the measurements were not blinded to patients’ assignment,
but image analyses were blinded by concealing patients’ status as previously reported (10, 11).
Physical assessment
In awake and attentive patients, the Medical Research Council (MRC) score and ICU-AW were
evaluated at day 5 by physical therapists blinded to the randomization group (12). ICU-AW was defined
as an MRC score of <48 on two separate occasions, and patients with preadmission MRC score of <48
were excluded (13). IMS is a scale of mobilization capabilities from 0 (lying in bed) to 10 (walking
independently) (14). IMS was also assessed at the time of discharge from the ICU.
Amino acid level
8
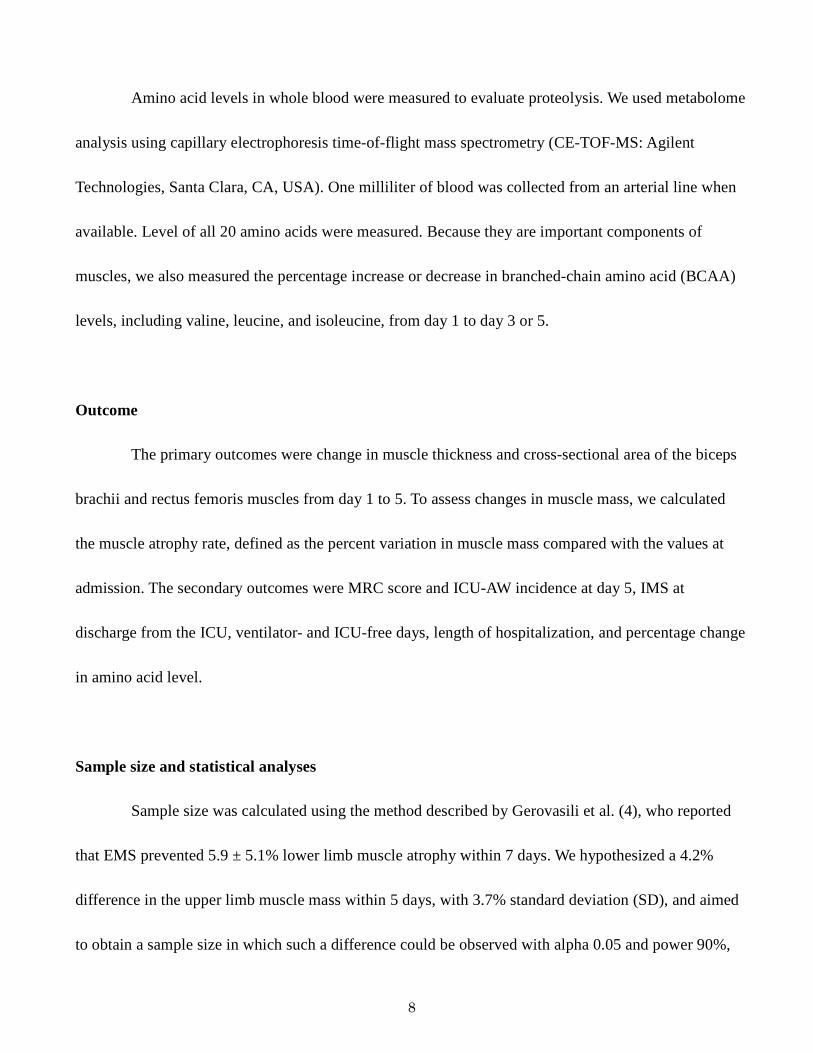
Amino acid levels in whole blood were measured to evaluate proteolysis. We used metabolome
analysis using capillary electrophoresis time-of-flight mass spectrometry (CE-TOF-MS: Agilent
Technologies, Santa Clara, CA, USA). One milliliter of blood was collected from an arterial line when
available. Level of all 20 amino acids were measured. Because they are important components of
muscles, we also measured the percentage increase or decrease in branched-chain amino acid (BCAA)
levels, including valine, leucine, and isoleucine, from day 1 to day 3 or 5.
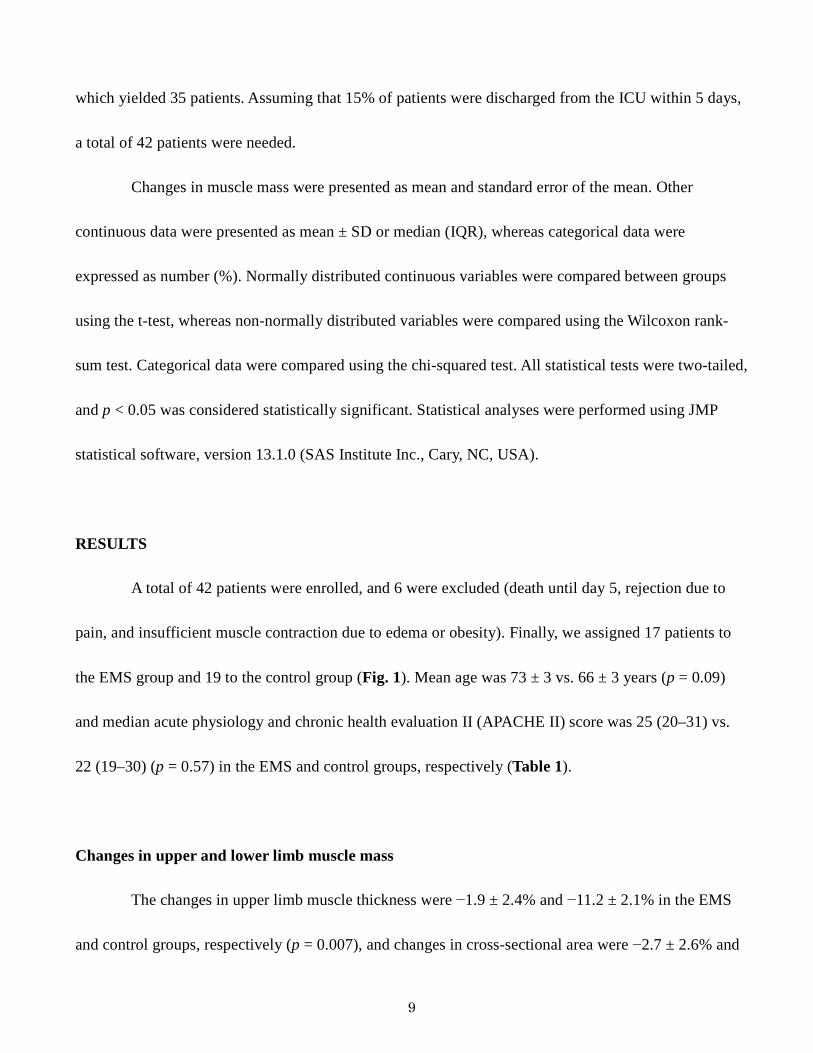
Outcome
The primary outcomes were change in muscle thickness and cross-sectional area of the biceps
brachii and rectus femoris muscles from day 1 to 5. To assess changes in muscle mass, we calculated
the muscle atrophy rate, defined as the percent variation in muscle mass compared with the values at
admission. The secondary outcomes were MRC score and ICU-AW incidence at day 5, IMS at
discharge from the ICU, ventilator- and ICU-free days, length of hospitalization, and percentage change
in amino acid level.
Sample size and statistical analyses
Sample size was calculated using the method described by Gerovasili et al. (4), who reported
that EMS prevented 5.9 ± 5.1% lower limb muscle atrophy within 7 days. We hypothesized a 4.2%
difference in the upper limb muscle mass within 5 days, with 3.7% standard deviation (SD), and aimed
to obtain a sample size in which such a difference could be observed with alpha 0.05 and power 90%,
9
which yielded 35 patients. Assuming that 15% of patients were discharged from the ICU within 5 days,
a total of 42 patients were needed.
Changes in muscle mass were presented as mean and standard error of the mean. Other
continuous data were presented as mean ± SD or median (IQR), whereas categorical data were
expressed as number (%). Normally distributed continuous variables were compared between groups
using the t-test, whereas non-normally distributed variables were compared using the Wilcoxon rank-
sum test. Categorical data were compared using the chi-squared test. All statistical tests were two-tailed,
and p < 0.05 was considered statistically significant. Statistical analyses were performed using JMP
statistical software, version 13.1.0 (SAS Institute Inc., Cary, NC, USA).
RESULTS
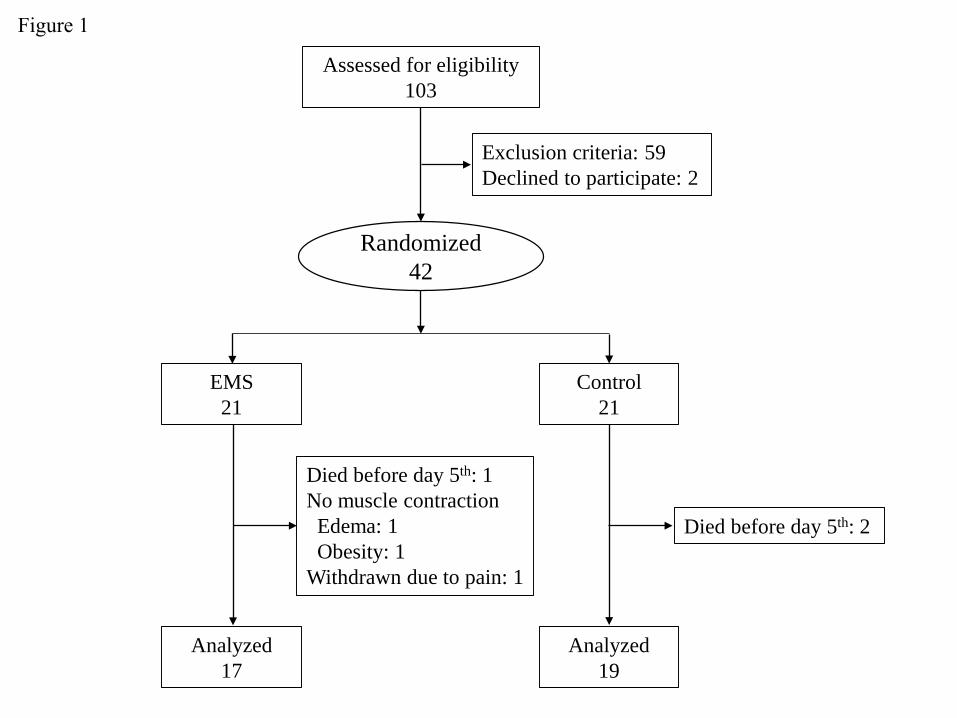
A total of 42 patients were enrolled, and 6 were excluded (death until day 5, rejection due to
pain, and insufficient muscle contraction due to edema or obesity). Finally, we assigned 17 patients to
the EMS group and 19 to the control group (Fig. 1). Mean age was 73 ± 3 vs. 66 ± 3 years (p = 0.09)
and median acute physiology and chronic health evaluation II (APACHE II) score was 25 (20–31) vs.
22 (19–30) (p = 0.57) in the EMS and control groups, respectively (Table 1).
Changes in upper and lower limb muscle mass
The changes in upper limb muscle thickness were −1.9 ± 2.4% and −11.2 ± 2.1% in the EMS
and control groups, respectively (p = 0.007), and changes in cross-sectional area were −2.7 ± 2.6% and

10
−10.0 ± 1.5% in the EMS and control groups, respectively (p = 0.03) (Fig. 2). Changes in lower limb
muscle thickness were −0.9 ± 3.1% and −14.7 ± 2.7% in the EMS and control groups, respectively (p =
0.003), and changes in cross-sectional area were −1.7 ± 2.9% and −10.4 ± 2.8% in the EMS and control
groups, respectively (p = 0.04).
Secondary outcomes
Physical function was assessed in 8 and 10 patients in the EMS and control groups,
respectively. No significant difference was found in MRC score, ICU-AW incidence, and IMS at
discharge from the ICU (Table 2). The EMS group had a shorter length of hospitalization. BCAA levels
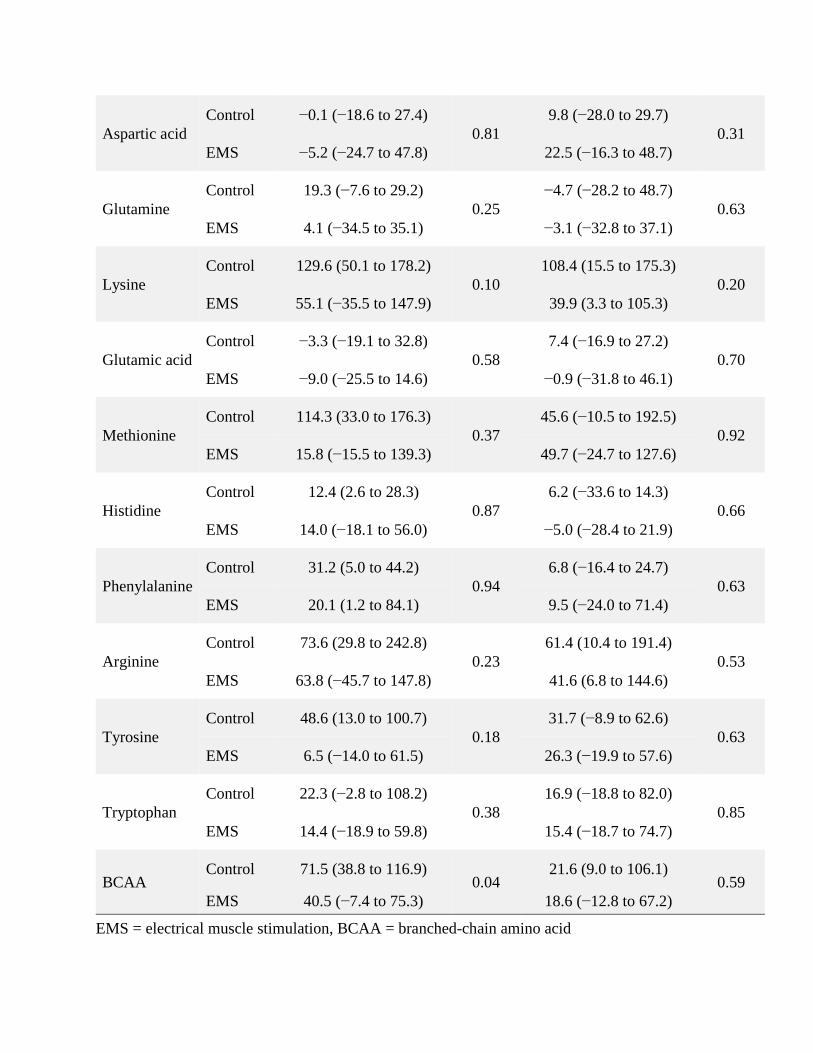
on day 3 were significantly lower in the EMS group than in the control group. Moreover, glycine levels
on days 3 and 5 and proline levels on day 3 were lower in the EMS than in the control group (Table
S2).
DISCUSSION
We found that EMS of the upper and lower limb muscles prevented muscle atrophy. To our
knowledge, this is the first study demonstrating that EMS prevented upper and lower limb muscle
atrophy simultaneously. This study did not reveal any differences in physical function. However, we
found that EMS attenuated proteolysis and reduced the length of hospitalization.
Most studies apply EMS to the lower limbs, and we found one study in which EMS was
applied to the hemilateral side of the upper and lower limbs in 14 patients (15). They reported unclear
11
results that patients exhibited significant muscle atrophy in the limb without EMS, but EMS
intervention did not show significant differences on the stimulated or unstimulated side. This muscle
mass measurement is based on arm circumference and muscle thickness measured by ultrasound, which
are easily affected by edema and the angle of the legs (16-18). In contrast, cross-sectional area is more
precise and accurate or at least less susceptible to measurement bias (19). Hence, in our study, we
assessed muscle atrophy using cross-sectional area and not muscle thickness.
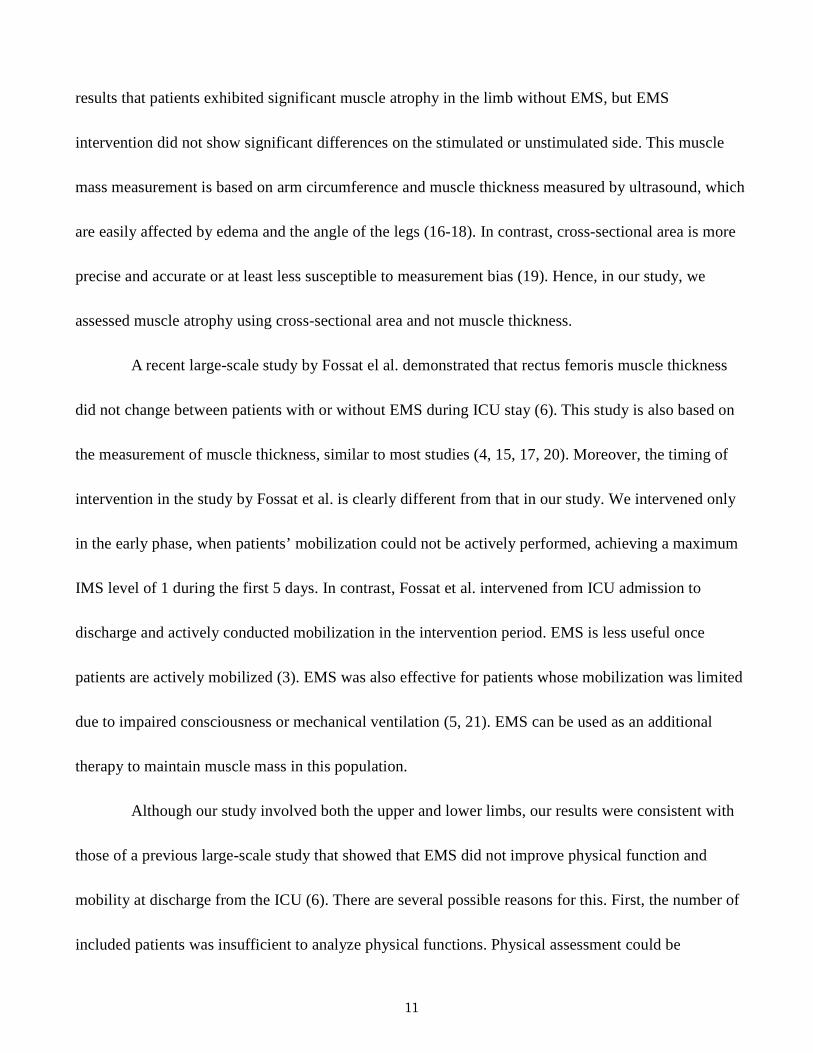
A recent large-scale study by Fossat el al. demonstrated that rectus femoris muscle thickness
did not change between patients with or without EMS during ICU stay (6). This study is also based on
the measurement of muscle thickness, similar to most studies (4, 15, 17, 20). Moreover, the timing of
intervention in the study by Fossat et al. is clearly different from that in our study. We intervened only
in the early phase, when patients’ mobilization could not be actively performed, achieving a maximum
IMS level of 1 during the first 5 days. In contrast, Fossat et al. intervened from ICU admission to
discharge and actively conducted mobilization in the intervention period. EMS is less useful once
patients are actively mobilized (3). EMS was also effective for patients whose mobilization was limited
due to impaired consciousness or mechanical ventilation (5, 21). EMS can be used as an additional
therapy to maintain muscle mass in this population.
Although our study involved both the upper and lower limbs, our results were consistent with
those of a previous large-scale study that showed that EMS did not improve physical function and
mobility at discharge from the ICU (6). There are several possible reasons for this. First, the number of
included patients was insufficient to analyze physical functions. Physical assessment could be

12
performed in only 50% of included patients because of impaired consciousness. Second, we did not
include patients requiring prolonged ICU stay. In a previous study, Silva et al. reported that 14 days
were needed to treat muscle weakness using EMS. Our study aimed at maintaining muscle mass during
the early phase of critical illness, and we did not include patients requiring prolonged ICU stay (21).
Therefore, our treatment duration may not have been long enough to improve clinical outcomes. Third,
although we applied EMS on both upper and lower limbs, the effect of muscle stimulation was limited
to the biceps brachii and rectus femoris muscles. It was better but not feasible to stimulate all muscles.
Our results indicate that maintaining muscle mass during the early phase of critical illness may
reduce the length of hospitalization. In a previous study, enhanced rehabilitation of mechanically
ventilated patients reduced the length of hospitalization (22). We believe that maintaining upper limb
muscle mass smoothly led to mobilization because the upper limbs contribute to the ability to transfer
from a bed to a wheelchair, to sit up, and to lie down. Furthermore, upper limbs are important for
writing, drinking, and eating. Sufficient upper limb function may prevent aspiration or other problems
in the ward and may reduce the length of hospitalization. Most studies applied EMS only to the lower
limbs and did not report reduced length of hospitalization (7, 8). The simultaneous application of EMS
to the upper limb may change the clinical outcomes of critically ill patients.
In critically ill patients, muscle atrophy occurs in the diaphragm and rib cage muscles as well
as limbs. We previously reported intercostal muscle atrophy in mechanically ventilated patients, which
was associated with weaning difficulties (10). In another study, the pectoralis major muscle was
associated with a high 6-month survival rate (23). Upper limbs play some role in respiration in terms of

13
rib cage expansion. Therefore, our results indicate that EMS application may enhance respiratory
muscle training. A recent study showed that EMS application to the diaphragm was feasible (24). A
pilot study applied EMS to the abdominal muscles to assist in weaning from mechanical ventilation and
found that the intervention decreased the duration of mechanical ventilation use (25). Moreover, upper
limb training indirectly improves pulmonary function (26). In patients with chronic obstructive
pulmonary disease, 8-week upper limb training improved lung function and functional capacity (27).
Additional clinical studies will be needed to prove if EMS application to the upper limbs reduces
mechanical ventilation time.
Interestingly, EMS not only prevented muscle atrophy but also attenuated proteolysis in
critically ill patients. A previous study showed that EMS attenuated protein degradation, as evidenced
by decreased 3-methylhistidine levels (28). In this study, we found lower BCAA levels in patients in the
EMS group. BCAA is an important component of muscles (29). Lower BCAA levels may reflect
decreased level of catabolism or increased consumption for protein synthesis in the muscles as
previously reported (30). Moreover, glycine and proline levels were lower in EMS group. Because it is
essential to prevent muscle atrophy (31), lower levels of glycine may indicate increased glycine
consumption for protecting muscles. In contrast, lower levels of proline may also indicate decreased
level of catabolism because muscle atrophy increases proline levels (32). Overall, in our study, the
levels of most amino acids were lower in the EMS group, with or without statistical significance,
suggesting an attenuated catabolic response. However, our experiments on amino acids are at a
preliminary stage of research and are less precise with a wide range of values.
14
Limitations
Our study has several limitations. First, this study included a small sample size, especially in
the analysis of physical function. Second, complete blinding could not be achieved. Investigators could
not completely avoid seeing the intervention, and patients could understand the intervention or control.
Thus, some bias may remain although the data analysis was blinded in a previously reported reliable
method (10, 11). Third, as our study compared the effect of EMS added to the mobilization protocol
with the mobilization protocol alone, the outcomes are associated with EMS application in combination
with the mobilization protocol and not EMS alone.
CONCLUSIONS
In this trial, early application of EMS prevented upper and lower limb muscle atrophy in
critical ill patients. EMS also attenuated proteolysis and decreased the length of hospitalization. Further
research is required to determine if EMS improves physical function and long-term outcomes of
critically ill patients.
ACKNOWLEDGEMENTS
The authors thank Yoshihiro Okayama (the Clinical Trial Center for Development
Therapeutics, Tokushima University Hospital) for support in the statistical analysis. The authors thank
the ICU staff of Tokushima University Hospital and Tokushima Prefectural Central Hospital, who made
this study possible.
15
REFERENCES
1. Nakanishi N, Takashima T, Oto J: Muscle atrophy in critically ill patients: a review of its cause,
evaluation, and prevention. J Med Invest 2020; 67:1-10
2. Nakanishi N, Oto J, Tsutsumi R, et al: Upper and lower limb muscle atrophy in critically ill
patients: an observational ultrasonography study. Intensive Care Med 2018; 44:263-264
3. Parry SM, Berney S, Granger CL, et al: Electrical muscle stimulation in the intensive care
setting: a systematic review. Crit Care Med 2013; 41:2406-2418
4. Gerovasili V, Stefanidis K, Vitzilaios K, et al: Electrical muscle stimulation preserves the muscle
mass of critically ill patients: a randomized study. Crit Care 2009; 13:R161
5. Chen YH, Hsiao HF, Li LF, et al: Effects of electrical muscle stimulation in subjects undergoing
prolonged mechanical ventilation. Respir Care 2019; 64:262-271
6. Fossat G, Baudin F, Courtes L, et al: Effect of in-bed leg cycling and electrical stimulation of the
quadriceps on global muscle strength in critically ill adults: a randomized clinical trial. JAMA 2018;
320:368-378
7. Kho ME, Truong AD, Zanni JM, et al: Neuromuscular electrical stimulation in mechanically
ventilated patients: a randomized, sham-controlled pilot trial with blinded outcome assessment. J Crit
Care 2015; 30:32-39
8. Patsaki I, Gerovasili V, Sidiras G, et al: Effect of neuromuscular stimulation and individualized
rehabilitation on muscle strength in intensive care unit survivors: a randomized trial. J Crit Care 2017;
40:76-82
9. Morris PE, Goad A, Thompson C, et al: Early intensive care unit mobility therapy in the
treatment of acute respiratory failure. Crit Care Med 2008; 36:2238-2243
10. Nakanishi N, Oto J, Ueno Y, et al: Change in diaphragm and intercostal muscle thickness in
mechanically ventilated patients: a prospective observational ultrasonography study. J Intensive Care
2019; 7:56
11. Nakanishi N, Tsutsumi R, Okayama Y, et al: Monitoring of muscle mass in critically ill patients:
comparison of ultrasound and two bioelectrical impedance analysis devices. J Intensive Care 2019; 7:61

16
12. De Jonghe B, Bastuji-Garin S, Durand MC, et al: Respiratory weakness is associated with limb
weakness and delayed weaning in critical illness. Crit Care Med 2007; 35:2007-2015
13. Stevens RD, Marshall SA, Cornblath DR, et al: A framework for diagnosing and classifying
intensive care unit-acquired weakness. Crit Care Med 2009; 37:S299-308
14. Hodgson C, Needham D, Haines K, et al: Feasibility and inter-rater reliability of the ICU
mobility scale. Heart Lung 2014; 43:19-24
15. Rodriguez PO, Setten M, Maskin LP, et al: Muscle weakness in septic patients requiring
mechanical ventilation: protective effect of transcutaneous neuromuscular electrical stimulation. J Crit
Care 2012; 27:319
16. Palakshappa JA, Reilly JP, Schweickert WD, et al: Quantitative peripheral muscle ultrasound in
sepsis: muscle area superior to thickness. J Crit Care 2018; 47:324-330
17. Fischer A, Spiegl M, Altmann K, et al: Muscle mass, strength and functional outcomes in
critically ill patients after cardiothoracic surgery: does neuromuscular electrical stimulation help? The
Catastim 2 randomized controlled trial. Crit Care 2016; 20:30
18. Reid CL, Campbell IT, Little RA: Muscle wasting and energy balance in critical illness. Clin
Nutr 2004; 23:273-280
19. Puthucheary ZA, McNelly AS, Rawal J, et al: Rectus femoris cross-sectional area and muscle
layer thickness: comparative markers of muscle wasting and weakness. Am J Respir Crit Care Med 2017;
195:136-138
20. Silva PE, Maldaner V, Vieira L, et al: Neuromuscular electrophysiological disorders and muscle
atrophy in mechanically-ventilated traumatic brain injury patients: new insights from a prospective
observational study. J Crit Care 2018; 44:87-94
21. Silva PE, de Cássia Marqueti R, Livino-de-Carvalho K, et al: Neuromuscular electrical
stimulation in critically ill traumatic brain injury patients attenuates muscle atrophy, neurophysiological
disorders, and weakness: a randomized controlled trial. J Intensive Care 2019; 7:59
22. McWilliams D, Weblin J, Atkins G, et al: Enhancing rehabilitation of mechanically ventilated
patients in the intensive care unit: a quality improvement project. J Crit Care 2015; 30:13-18
23. Jaitovich A, Khan M, Itty R, et al: ICU admission muscle and fat mass, survival, and disability
17
at discharge: a prospective cohort study. Chest 2019; 155:322-330
24. O'Rourke J, Soták M, Curley GF, et al: Initial assessment of the percutaneous electrical phrenic
nerve stimulation system in patients on mechanical ventilation. Crit Care Med 2020; 48:e362-e370
25. McCaughey EJ, Jonkman AH, Boswell-Ruys CL, et al: Abdominal functional electrical
stimulation to assist ventilator weaning in critical illness: a double-blinded, randomised, sham-controlled
pilot study. Crit Care 2019; 23:261
26. Ries AL, Bauldoff GS, Carlin BW, et al: Pulmonary rehabilitation: joint ACCP/AACVPR
evidence-based clinical practice guidelines. Chest 2007; 131:4s-42s
27. Tarigan AP, Ananda FR, Pandia P, et al: The impact of upper limb training with breathing
maneuver in lung function, functional capacity, dyspnea scale, and quality of life in patient with stable
chronic obstructive of lung disease. Open Access Maced J Med Sci 2019; 7:567-572
28. Iwatsu K, Iida Y, Kono Y, et al: Neuromuscular electrical stimulation may attenuate muscle
proteolysis after cardiovascular surgery: a preliminary study. J Thorac Cardiovasc Surg 2017; 153:373-
379
29. Holeček M: Branched-chain amino acids in health and disease: metabolism, alterations in blood
plasma, and as supplements. Nutr Metab 2018; 15:33
30. Fukai K, Harada S, Iida M, et al: Metabolic profiling of total physical activity and sedentary
behavior in community-dwelling men. PLoS One 2016; 11:e0164877
31. Caldow MK, Ham DJ, Trieu J, et al: Glycine protects muscle cells from wasting in vitro via
mTORC1 signaling. Front Nutr 2019; 6:172
32. Ilaiwy A, Quintana MT, Bain JR, et al: Cessation of biomechanical stretch model of C2C12 cells
models myocyte atrophy and anaplerotic changes in metabolism using non-targeted metabolomics
analysis. Int J Biochem Cell Biol 2016; 79:80-92
FIGURE LEGENDS
Figure 1. Flowchart of patients included in this study
EMS = electrical muscle stimulation

18
Figure 2. Change in biceps brachii and rectus femoris muscle mass
a. EMS prevented reduction of biceps brachii muscle thickness (p = 0.007) and cross-sectional area (p =
0.03). b. EMS prevented reduction of rectus femoris muscle thickness (p = 0.003) and cross-sectional
area (p = 0.04). Data are presented as means and standard error. P values were derived from t-test.
EMS = electrical muscle stimulation, CSA = cross-sectional area
Control21
Assessed for eligibility103
Exclusion criteria: 59Declined to participate: 2
Analyzed17
Died before day 5th: 1No muscle contraction
Edema: 1Obesity: 1
Withdrawn due to pain: 1
Analyzed19
Randomized42
EMS21
Died before day 5th: 2
Figure 1

-25
-20
-15
-10
-5
0Thickness CSA
Cha
nge
in m
uscl
e m
ass (
%)
Biceps brachii muscle
ControlEMS
a
-25
-20
-15
-10
-5
0Thickness CSA
Cha
nge
in m
uscl
e m
ass (
%)
Rectus femoris muscle
ControlEMS
b
Figure 2
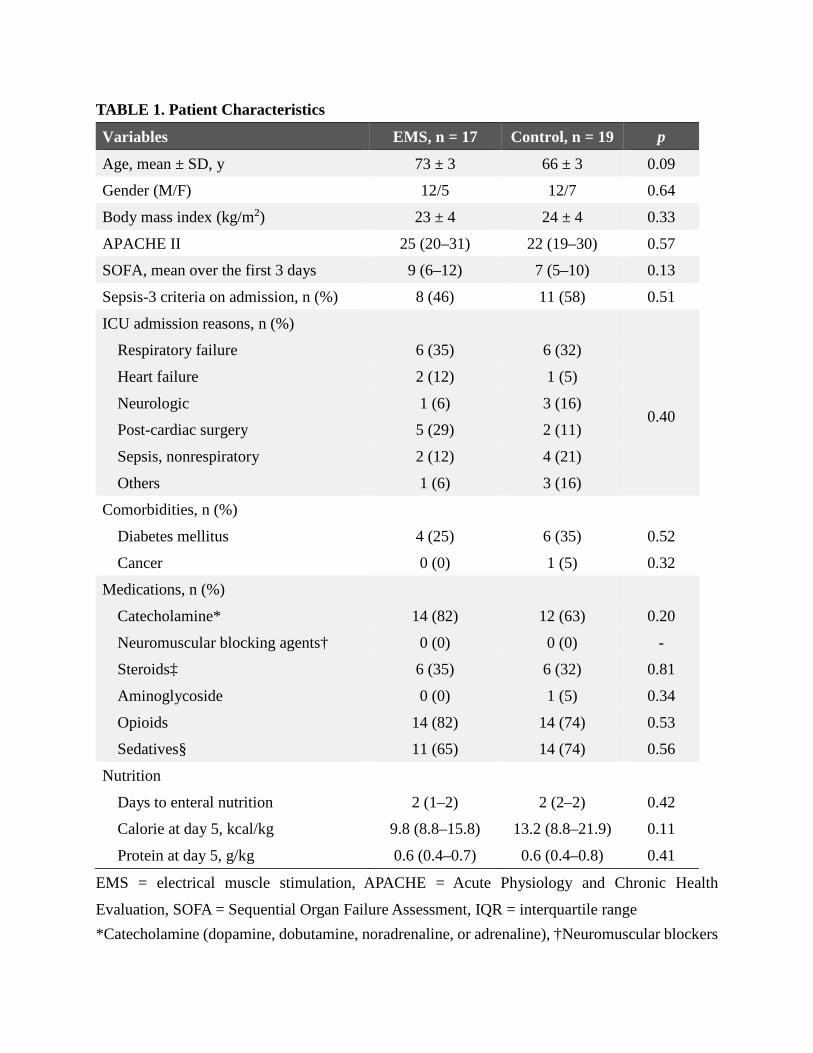
TABLE 1. Patient Characteristics
Variables EMS, n = 17 Control, n = 19 p
Age, mean ± SD, y 73 ± 3 66 ± 3 0.09
Gender (M/F) 12/5 12/7 0.64
Body mass index (kg/m2) 23 ± 4 24 ± 4 0.33
APACHE II 25 (20–31) 22 (19–30) 0.57
SOFA, mean over the first 3 days 9 (6–12) 7 (5–10) 0.13
Sepsis-3 criteria on admission, n (%) 8 (46) 11 (58) 0.51
ICU admission reasons, n (%)
Respiratory failure 6 (35) 6 (32)
0.40
Heart failure 2 (12) 1 (5)
Neurologic 1 (6) 3 (16)
Post-cardiac surgery 5 (29) 2 (11)
Sepsis, nonrespiratory 2 (12) 4 (21)
Others 1 (6) 3 (16)
Comorbidities, n (%)
Diabetes mellitus 4 (25) 6 (35) 0.52
Cancer 0 (0) 1 (5) 0.32
Medications, n (%)
Catecholamine* 14 (82) 12 (63) 0.20
Neuromuscular blocking agents† 0 (0) 0 (0) -
Steroids‡ 6 (35) 6 (32) 0.81
Aminoglycoside 0 (0) 1 (5) 0.34
Opioids 14 (82) 14 (74) 0.53
Sedatives§ 11 (65) 14 (74) 0.56
Nutrition
Days to enteral nutrition 2 (1–2) 2 (2–2) 0.42
Calorie at day 5, kcal/kg 9.8 (8.8–15.8) 13.2 (8.8–21.9) 0.11
Protein at day 5, g/kg 0.6 (0.4–0.7) 0.6 (0.4–0.8) 0.41
EMS = electrical muscle stimulation, APACHE = Acute Physiology and Chronic Health
Evaluation, SOFA = Sequential Organ Failure Assessment, IQR = interquartile range *Catecholamine (dopamine, dobutamine, noradrenaline, or adrenaline), †Neuromuscular blockers
with continuous use, ‡Steroids with intravenous or peroral use, §Sedatives (midazolam, propofol) Data were presented as median (IQR) unless otherwise indicated.

TABLE 2. Secondary Outcomes
Variables EMS, n = 17 Control, n = 19 p
Functional outcomes (n = 8, 10)
MRC score at day 5 55 (50–58) 52 (35–59) 0.53
ICU-AW (%) at day 5 13% 40% 0.20
IMS at discharge from the ICU 3 (1–4) 2 (1–3) 0.42
Ventilator-free days, d 23 (19–25) 22 (10–24) 0.45
ICU-free days, d 21 (12–23) 20 (9–23) 0.97
length of hospitalization, d 23 (19–34) 40 (26–64) 0.04
length of hospitalization (survivor), d 24 (20–32) 40 (29–55) 0.03
After hospital discharge
Home 3 4
0.42 Transfer 11 11
Death 3 4
Amino acid level
Day 1 to day 3 (n = 14, 17)
BCAA, % 40.5 (−7.4 to 75.3) 71.5 (38.8 to 116.9) 0.04
Glycine, % −23.4 (−54.5 to −0.6) 12.3 (−1.8 to 39.7) < 0.01
Proline, % 2.6 (−43.4 to 48.3) 54.3 (−11.4 to 147.9) 0.04
Day 1 to day 5 (n = 12, 15)
BCAA, % 18.6 (−12.8 to 67.2) 21.6 (9.0 to 106.1) 0.59
Glycine, % −37.3 (−40.8 to −16.1) 4.0 (−5.5 to 37.4) < 0.01
Proline, % −11.0 (−28.6 to 25.4) 37.9 (−27.6 to 95.1) 0.26
MRC = medical research council, ICU-AW = intensive care unit-acquired weakness, IMS =
intensive care unit mobility scale, ICU = intensive care unit, BCAA = branched-chain amino acid,
IQR = interquartile range
Data were presented as median (IQR) unless otherwise indicated.

Supplemental File
Electrical muscle stimulation on upper and lower limb muscles in critically ill patients
METHODS
Mobilization program
Mobilization level was decided according to patients’ neurological function (conscious or
unconscious) and muscle strength. Passive range of motion was carried out for unconscious
patients, whereas in conscious patients, the intensity was gradually increased to active resistance,
sitting on the edge of bed, and ambulation. Mobilization level was limited in patients with
hemodynamic or respiratory instability.
Ultrasound measurement
All scanning was done with patients supine and elbows and knees in passive extension. Generous
amounts of contact gel were applied to avoid compression of the muscles by the transducer, and
the transducer was placed perpendicular relative to the long axis of the limbs. A B-mode ultrasound
with a linear transducer was used. Biceps brachii muscle was measured at two-thirds of the way
between the acromion and the antecubital crease. Rectus femoris muscle was measured at midway
between the anterior superior iliac spine and the proximal end of the patella. Biceps brachii muscle
thickness (including the underlying brachialis muscle) was defined as the depth between the
superficial fascia of the biceps brachii muscle and the uppermost part of the humerus, and cross-
sectional area of the biceps brachii muscle was measured by tracking the area in the transverse
plane. Rectus femoris muscle thickness (including the underlying vastus intermedius muscle) was
defined as the depth between the superficial fascia of the rectus femoris muscle and the uppermost
part of the femur, and cross-sectional area of rectus femoris muscle was measured by tracking the
area in the transverse plane.
Physical assessment
Consciousness was evaluated as adequate when patients respond to at least three of the five orders
(“open/close your eyes,” “look at me,” “open your mouth and put out your tongue,” “nod your
head,” and “raise your eyebrows”). In responsive patients, we evaluated MRC score including
bilateral shoulder abductors, elbow flexors, wrist extensors, hip flexors, knee extensors, and ankle
dorsiflexors.
Amino acid level
The collected blood was immediately mixed with methanol with internal standard solution. High
performance liquid chromatography and Milli-Q water (Millipore, Bedford, MA, USA) were
added to the sample. The tube was centrifuged at 4°C for 5 minutes at 3150 rotations per minute.
After the water layer was transferred into centrifuge filter tubes, the filtered sample was
centrifuged again at 4°C for 4 hours at 9100 rotations per minute. Next, it was dried with vacuum
centrifugal dryer for 2 hours and stored at −80°C. Finally, it was added to 50 μL of Milli-Q water
with internal standard solution and analyzed by CE-TOF-MS.

TABLE S1. Reproducibility of Measurements
CI = confidence interval
Reproducibility was assessed for 36 patients at 72 measurements in rectus femoris muscle. The
Pearson correlation coefficient and Bland-Altman plot were determined by using JMP statistical
software version 13.1.0 (SAS Institute Inc., Cary, NC, USA).
Correlation coefficient Bland-Altman 95% CI
Variables r p Bias 95% CI
Intra-observer reproducibility
Thickness
Biceps brachii muscle 0.99 < 0.01 0.025 ± 0.081 −0.137 to 0.187
Rectus femoris muscle 0.99 < 0.01 −0.024 ± 0.100 −0.223 to 0.175
Cross-sectional area
Biceps brachii muscle 0.99 < 0.01 −0.001 ± 0.046 −0.093 to 0.090
Rectus femoris muscle 0.98 < 0.01 −0.086 ± 0.045 −0.177 to 0.004
Inter-observer reproducibility
Thickness
Biceps brachii muscle 0.99 < 0.01 0.140 ± 0.105 −0.069 to 0.349
Rectus femoris muscle 0.99 < 0.01 −0.058 ± 0.125 −0.307 to 0.191
Cross-sectional area
Biceps brachii muscle 0.99 < 0.01 −0.015 ± 0.055 −0.126 to 0.095
Rectus femoris muscle 0.98 < 0.01 −0.103 ± 0.054 −0.211 to 0.005

TABLE S2. Amino Acid Level
Variables Group
Percentage change from Day 1 to Day 3 or 5
Day 3 p Day 5 p
Glycine Control 12.3 (−1.8 to 39.7)
< 0.01 4.0 (−5.5 to 37.4)
< 0.01 EMS −23.4 (−54.5 to −0.6) −37.3 (−40.8 to −16.1)
Alanine Control 6.5 (−26.7 to 71.3)
0.36 −3.6 (−37.1 to 70.3)
0.53 EMS −7.6 (−26.2 to 36.8) 0.8 (−38.1 to 22.2)
Serine Control 46.3 (14.8 to 85.0)
0.21 29.8 (−8.4 to 57.9)
0.86 EMS 29.3 (−6.2 to 60.5) 22.3 (−6.8 to 57.4)
Proline Control 54.3 (−11.4 to 147.9)
0.04 37.9 (−27.6 to 95.1)
0.26 EMS 2.6 (−43.4 to 48.3) −11.0 (−28.6 to 25.4)
Valine Control 59.5 (30.9 to 98.0)
0.07 27.2 (14.7 to 68.0)
0.53 EMS 31.5 (−21.5 to 65.7) 20.5 (−13.7 to 60.3)
Threonine Control 97.4 (2.4 to 206.7)
0.18 92.8 (−17.7 to 209.1)
0.31 EMS 32.7 (−15.7 to 108.9) 26.4 (−9.8 to 95.2)
Cysteine Control 74.7 (7.1 to 143.8)
0.07 59.4 (−15.3 to 128.9)
0.70 EMS −12.7 (−26.4 to 29.9) 17.1 (−19.6 to 115.6)
Isoleucine Control 125.4 (55.6 to 235.1)
0.10 50.5 (5.0 to 340.2)
0.81 EMS 65.4 (−16.3 to 147.9) 33.2 (1.9 to 174.8)
Leucine Control 61.8 (46.3 to 144.4)
0.14 16.9 (−3.5 to 152.6)
0.81 EMS 59.8 (15.0 to 81.0) 8.1 (−12.1 to 66.9)
Asparagine Control 38.4 (7.8 to 62.5)
0.08 25.9 (−3.2 to 39.9)
0.77 EMS 16.9 (−15.2 to 34.2) 11.8 (−13.4 to 44.0)
Aspartic acid Control −0.1 (−18.6 to 27.4)
0.81 9.8 (−28.0 to 29.7)
0.31 EMS −5.2 (−24.7 to 47.8) 22.5 (−16.3 to 48.7)
Glutamine Control 19.3 (−7.6 to 29.2)
0.25 −4.7 (−28.2 to 48.7)
0.63 EMS 4.1 (−34.5 to 35.1) −3.1 (−32.8 to 37.1)
Lysine Control 129.6 (50.1 to 178.2)
0.10 108.4 (15.5 to 175.3)
0.20 EMS 55.1 (−35.5 to 147.9) 39.9 (3.3 to 105.3)
Glutamic acid Control −3.3 (−19.1 to 32.8)
0.58 7.4 (−16.9 to 27.2)
0.70 EMS −9.0 (−25.5 to 14.6) −0.9 (−31.8 to 46.1)
Methionine Control 114.3 (33.0 to 176.3)
0.37 45.6 (−10.5 to 192.5)
0.92 EMS 15.8 (−15.5 to 139.3) 49.7 (−24.7 to 127.6)
Histidine Control 12.4 (2.6 to 28.3)
0.87 6.2 (−33.6 to 14.3)
0.66 EMS 14.0 (−18.1 to 56.0) −5.0 (−28.4 to 21.9)
Phenylalanine Control 31.2 (5.0 to 44.2)
0.94 6.8 (−16.4 to 24.7)
0.63 EMS 20.1 (1.2 to 84.1) 9.5 (−24.0 to 71.4)
Arginine Control 73.6 (29.8 to 242.8)
0.23 61.4 (10.4 to 191.4)
0.53 EMS 63.8 (−45.7 to 147.8) 41.6 (6.8 to 144.6)
Tyrosine Control 48.6 (13.0 to 100.7)
0.18 31.7 (−8.9 to 62.6)
0.63 EMS 6.5 (−14.0 to 61.5) 26.3 (−19.9 to 57.6)
Tryptophan Control 22.3 (−2.8 to 108.2)
0.38 16.9 (−18.8 to 82.0)
0.85 EMS 14.4 (−18.9 to 59.8) 15.4 (−18.7 to 74.7)
BCAA Control 71.5 (38.8 to 116.9)
0.04 21.6 (9.0 to 106.1)
0.59 EMS 40.5 (−7.4 to 75.3) 18.6 (−12.8 to 67.2)
EMS = electrical muscle stimulation, BCAA = branched-chain amino acid

Amino acid level was assessed in EMS and control (14 and 17 on day 3, 12 and 15 on day 5). The
Mann-Whitney test was used for the comparison.