Effect of DryFineTM Low Temperature Coal Drying Process … Drying_Paper 2.pdf · Effect of...
12
Effect of DryFine TM Low Temperature Coal Drying Process on Emissions from a Coal-Fired Power Plant Paper #25 Charles W. Bullinger Great River Energy, 1611 E. Century Avenue Bismarck, ND 58503 Mark Ness Coal Creek, 2875 3rd St. SW, Underwood, ND 58576 Katherine Dombrowski URS Corporation, 9400 Amberglen Boulevard, Austin, TX 78729 Nenad Sarunac Energy Research Center, 117 ATLSS Drive, Imbt Labs Lehigh University, Bethlehem, PA 18015 Greg Archer Great River Energy, 12300 Elm Creek Blvd, Maple Grove, MN 55369 Sai Gollakota U.S. DOE-NETL, P.O. Box 880, Morgantown, WV 26508 Ramsay Chang EPRI, 3412 Hillview Avenue, Palo Alto, CA 94304 ABSTRACT Great River Energy has developed and installed at Coal Creek Station a patented low temperature waste stream coal drying and segregation process (DryFine TM ) for North Dakota lignite. The process improves the heating value of the coal while reducing coal mercury, sulfur, and ash content. In addition to improvements in boiler efficiency and unit heat rate, the process results in lower SO 2 , NO X, Hg, and CO 2 emissions. Theoretical calculations predict other potential air pollution benefits such as an increase in mercury oxidation and subsequent removal by the wet FGD. This paper presents stack SO 2 , NO X, Hg, and CO 2 emissions for a coal-fired unit operating pre- and post-DryFine TM installation. INTRODUCTION U.S. low-rank coals have moisture contents ranging from 15 to 30 percent for sub-bituminous coals and from 25 to 40 percent for lignite. When high-moisture lignite coals are burned in utility boilers, about seven percent of the fuel heat input is used to evaporate fuel moisture. The use of high-moisture coals results in higher fuel flow rate, higher stack flue gas flow rate, higher station service power, lower plant efficiency, and higher mill, coal pipe and burner maintenance requirements compared to that of low-moisture coals such as Eastern bituminous coals. Despite problems associated with their high-moisture content, lignite and sub-bituminous coals from the Western U.S. are attractive due to their low cost and SO 2 emissions. Although existing lignite
Transcript of Effect of DryFineTM Low Temperature Coal Drying Process … Drying_Paper 2.pdf · Effect of...

Effect of DryFineTM
Low Temperature Coal Drying Process
on Emissions from a Coal-Fired Power Plant
Paper #25
Charles W. Bullinger
Great River Energy, 1611 E. Century Avenue Bismarck, ND 58503
Mark Ness
Coal Creek, 2875 3rd St. SW, Underwood, ND 58576
Katherine Dombrowski
URS Corporation, 9400 Amberglen Boulevard, Austin, TX 78729
Nenad Sarunac
Energy Research Center, 117 ATLSS Drive, Imbt Labs Lehigh University, Bethlehem, PA
18015
Greg Archer
Great River Energy, 12300 Elm Creek Blvd, Maple Grove, MN 55369
Sai Gollakota
U.S. DOE-NETL, P.O. Box 880, Morgantown, WV 26508
Ramsay Chang
EPRI, 3412 Hillview Avenue, Palo Alto, CA 94304
ABSTRACT
Great River Energy has developed and installed at Coal Creek Station a patented low
temperature waste stream coal drying and segregation process (DryFineTM
) for North Dakota
lignite. The process improves the heating value of the coal while reducing coal mercury, sulfur,
and ash content. In addition to improvements in boiler efficiency and unit heat rate, the process
results in lower SO2, NOX, Hg, and CO2 emissions. Theoretical calculations predict other
potential air pollution benefits such as an increase in mercury oxidation and subsequent removal
by the wet FGD. This paper presents stack SO2, NOX, Hg, and CO2 emissions for a coal-fired
unit operating pre- and post-DryFineTM
installation.
INTRODUCTION
U.S. low-rank coals have moisture contents ranging from 15 to 30 percent for sub-bituminous
coals and from 25 to 40 percent for lignite. When high-moisture lignite coals are burned in
utility boilers, about seven percent of the fuel heat input is used to evaporate fuel moisture. The
use of high-moisture coals results in higher fuel flow rate, higher stack flue gas flow rate, higher
station service power, lower plant efficiency, and higher mill, coal pipe and burner maintenance
requirements compared to that of low-moisture coals such as Eastern bituminous coals. Despite
problems associated with their high-moisture content, lignite and sub-bituminous coals from the
Western U.S. are attractive due to their low cost and SO2 emissions. Although existing lignite

2
power plants are designed to burn wet lignite, a reduction in coal moisture content would
increase efficiency, reduce pollution and reduce CO2 emissions. Furthermore, the efficiency of
ultra supercritical units burning high-moisture coals would be improved significantly by using
dried coal as a fuel.
Most of the coal drying processes that have been developed to date depend on high-grade or
process heat to reduce coal moisture content or employ complex equipment layouts using
expensive materials to recover the latent heat of vaporization. This significantly increases the
cost of thermal drying, which is the main barrier to large-scale industry acceptance of this
technology.1
Great River Energy (GRE) led a team to develop a process that uses low-grade heat to evaporate
a portion of fuel moisture from the lignite feedstock in a fluidized bed dryer (FBD). A moving
fluidized bed coal dryer was selected for this project due to (1) its good heat and mass transfer
characteristics which result in a much smaller dryer compared to a fixed bed design and (2) its
high throughput which reduces number of required dryers. The process improves the heating
value of the coal while reducing coal mercury, sulfur, and ash content. In addition to
improvements in boiler efficiency and unit heat rate, the process results in lower SO2, NOX, CO2,
and Hg emissions. Theoretical calculations predict other potential air pollution benefits such as
an increase in mercury oxidation and subsequent removal of oxidized mercury by the wet FGD.
GRE developed and installed this patented low temperature waste stream coal drying and
segregation process (DryFineTM
) for North Dakota lignite at Coal Creek Station. Following
system commissioning in December 2009, tests were performed in January and March 2010 to
collect preliminary data on dryer operation, system performance, and effect of dried coal on unit
performance and emissions. Controlled performance and emissions tests were completed in the
spring of 2010. A final performance test is planned for the fall of 2010 after system
optimization. The demonstration was conducted with the Department of Energy (DOE) under
DOE Award Number DE-FC26-04NT41763.2
This paper reports on the impact and potential benefit of DryFineTM
at GRE’s Coal Creek Station
on SO2, NOX, CO2, and mercury emissions. The test program was divided into two distinct
measurement periods:
(1) Pre-DryFineTM
(i.e., baseline)
(2) Post-DryFineTM
To determine the benefits of waste heat coal drying on power plant efficiency improvements and
air pollution reductions, data collected by EPRI/URS from this project were combined with data
collected by GRE. This report summarizes the following data from the pre- and post-DryFineTM
measurement periods:
Plant Effects
Flue Gas Emission Effects (SO2, NOX, CO2, Hg)
Byproduct Emission Effects (Coal, Ash, FGD)

3
EXPERIMENTAL
Description of Coal Creek Unit 1
Coal Creek Station (CCS) is a 1,200 MW lignite-fired power plant located in Underwood, North
Dakota. Two natural circulation dual furnace tangentially-fired CE boilers supply steam to two
single reheat GE G-2 turbines rated at 600 MW each. The units are designed for 1,005F main
steam and reheat steam temperature at a throttle pressure of 2,520 psia. Three mechanical draft
cooling towers are used to reject heat to the environment. The unit is equipped with a cold-side
electrostatic precipitator (ESP) and a lime-based flue gas desulfurization (FGD) system.
DryFineTM
Process Background
A theoretical analysis, performed by Lehigh University’s Energy Research Center (ERC) in
1997-98 confirmed that a decrease in fuel moisture would have a significant positive effect on
unit performance.3 Based on these theoretical results, CCS personnel performed test burns with
partially dried lignite in 2001 to assess whether the boiler and coal handling system could handle
the partially dried lignite and to confirm theoretical performance improvement predictions.3
Based on these results, an approach was selected that employed waste heat sources available in
the plant for thermal drying of the incoming raw lignite stream using a fluidized bed dryer
(FBD).4
The full-size commercial FBD was designed and constructed with three stages. Figure 1 provides
a diagram of an FBD system. Multi-stage design allows maximum utilization of fluidized bed
mixing, segregation and drying characteristics. All stages of the FBD are fluidized by air. Coal
fines, elutriated from the FBD and collected by the dust collector (baghouse), are returned to the
dryer. Each FBD is equipped with its own baghouse. De-dusted fluidizing air streams leaving
the baghouses of two adjacent FBDs are combined and discharged through a common dryer
stack into the atmosphere. The process operates below 300°F.

4
Figure 1: FBD Schematic
In-Bed HXE In-Bed HXE In-Bed HXE
1st
Stage 2nd
Stage
Feed
Stream
Product
Stream
Segregated
Stream
Fluidization Air and
Evaporated Coal Moisture
2nd
Stage Fluidizing Air
In-Bed HXE In-Bed HXE
1st
Stage Fluidizing Air
Bed Surface
The design throughput of the full-scale system is 3.75 million tons per year of coal, sufficient to
meet 100 percent of Unit 2’s needs. Four full-scale dryers provide the necessary throughput with
conservative redundancy. At the nominal coal feed rate, the four dryers supply 450 t/hr of dried
coal to one unit, assuming an elutriation rate of 10 percent. At the nominal coal feed rate, target
product moisture content is 29.5% for an inlet coal moisture of 38%. At the maximum coal feed
rate, product moisture content is 30.6%.
Test Matrix
Two series of controlled tests were performed at Coal Creek Unit 1 with wet and dried lignite to
determine the effect of the DryFineTM
process on unit performance, emissions and operation.
Wet lignite was fired during the pre-DryFineTM
(i.e., baseline) test series, which was conducted
September 15-18, 2009. The post-DryFineTM
test series was performed on March 31 and April
1, 2010, after the commercial coal drying system was commissioned. The unit fired dried and
cleaned lignite with the segregation stream cleaned by air jigs before being mixed with the
product stream.
The unit was kept at steady state operating conditions during the pre- and post-DryFineTM
test
runs. Individual test runs were typically 2-3 hours long. Results from individual runs were
averaged together and reported. For the tests, the turbine throttle pressure was set at 2,520 psig
with control valves 100% open; the main steam temperature was set at 1,000F, and reheat steam
temperature was set at 1,005F. Boiler excess O2 was maintained at 2.6%. During the pre-
DryFineTM
test, the turbine cycle was isolated by switching building heat and auxiliary loads to
Unit 2 while testing was performed on Unit 1. During the post-DryFineTM
performance test, Unit
2 was in outage, so the Unit 1 steam turbine cycle could not be isolated; auxiliary extractions
were taken from Unit 1. These extractions do not affect the emissions profile of the plant, but
they must be accounted for in the calculation of unit performance.

5
Sootblowing was out of service during the multi-hour tests. Boiler sootblowing was performed
before and between the performance tests. Samples of bottom ash, economizer ash, mill rejects,
and fly ash were taken once per day. Economizer ash flow rate was determined from load cells.
Fly ash was assumed to be 60 percent of the total ash flow, based on historic data. For the
baseline tests, pressure differential in the scrubber was maintained at 6.5”wg for Unit 1.
Monitored and calculated unit performance parameters included gross power output, gross
turbine cycle heat rate, boiler efficiency, auxiliary power use, net unit heat rate, coal feed, fuel
heat input to the boiler and other parameters.
Additional flue gas measurements were made during these periods. Figure 2 provides a diagram
of Coal Creek Unit 1 and all gas and solid or liquid sample locations. NOx, SO2, Hg and CO2
were measured at the stack. Although Method 29 trace metals measurements were performed at
the stack during the pre-DryFineTM
test period, the results are not reported in this paper. Method
29 measurements were not performed during the post-DryFineTM
test period due to
complications arising from an unplanned outage on Unit 1.
Two mercury (Hg) semi-continuous mercury monitors (CMMs) were operated by URS during
the tests: one located at the air heater inlet (AH inlet) and a second that rotated measurements
between the FGD bypass, FGD outlet, and FGD inlet locations. A third CMM was operated by
GRE at the stack during the post-DryFineTM
test period, but it was unavailable during the pre-
DryFineTM
test period. The CMMs were used to measure total and elemental flue gas mercury
concentrations.
Additional solid and liquid samples were collected and analyzed during the test periods. Raw
coal samples collected during pre-DryFineTM
were analyzed for ultimate/proximate parameters,
major ash minerals, mercury, chlorine, and trace metals. Post-DryFineTM
coal underwent the
same measurements but, in addition, samples were also collected from the feeder inlet, the
segregated coal stream, the clean coal stream, and the pulverizer rejects stream. FGD samples
for both the pre- and post- DryFineTM
were collected from the absorber blowdown, Missouri
river water, service water, and lime slaker. All streams were analyzed for mercury, and the
absorber blowdown was also analyzed for SO3, Cl, and weight percent.
RESULTS
This section is organized in the following manner:
Unit 1 Plant Effects
o Unit Load
o Coal Flow
o Flue Gas Flow
Flue Gas Emission Effects
o SO2 & NOX Flue Gas Emissions
o CO2 Flue Gas Emissions
o Hg Flue Gas Emissions
ByProduct Emission Effects
o Coal and Ash Analysis
o FGD Analysis

6
Figure 2: Diagram of Coal Creek Unit 1 and Sampling Locations
FF
ESP
WFGD
FD
ID
PAFly Ash
Stack
Boiler
Drains
Lime
Economizer Ash
Blowdown
Make-up
Bottom Ash
Pulverized
Coal
Rejects
Cleaned
Coal
Segregated
Coal
Raw Coal
Air Jig
Feeder
Pulverizer
Coal Dryer
Air
Heater Reaction
Tank
Fluidizing
AirFines
Dry
Coal
Exhaust Solid-liquid sample points
Gas sample points
Bypass
FFFF
ESPESP
WFGD
FDFD
IDID
PAPAFly Ash
Stack
BoilerBoilerBoiler
Drains
Lime
Economizer Ash
Blowdown
Make-up
Bottom Ash
Pulverized
Coal
Rejects
Cleaned
Coal
Segregated
Coal
Raw Coal
Air JigAir Jig
FeederFeeder
PulverizerPulverizer
Coal DryerCoal Dryer
Air
Heater
Air
Heater Reaction
Tank
Fluidizing
AirFines
Dry
Coal
Exhaust Solid-liquid sample points
Gas sample points
Bypass
Unit 1 Plant Effects
Table 1 provides an overall picture of pre- and post-DryFineTM
SO2, NOX, and CO2 emissions at
the stack.
Heat Input
The unit operated at nominally the same load of 600 MW for the pre-DryFineTM
and post-
DryFineTM
test periods. The heat input required to achieve this load during post-DryFineTM
was
3.0% lower than pre-DryFineTM
.
Coal Flow
As a portion of coal moisture is evaporated by thermal drying, the coal higher heating value
(HHV) increases and the required coal feed flow rate to the boiler decreases. This decrease is
mostly due to removal of coal moisture and partially due to improvement in unit efficiency. The
coal feed rate for the post-DryFineTM
period was 10.3% less than the coal feed rate during the
pre-DryFineTM
period.
Flue Gas Flow
When firing post-DryFineTM
coal, the flue gas flow rate as measured on a mass basis by the plant
CEM was lowered on average 2.9% as compared to pre-DryFineTM
wet coal.

7
Table 1: Pre-DryFineTM
and Post-DryFineTM
Emissions
Parameter
(Measured or
Calculated at Stack)
Units Pre-DryFineTM
(Wet Coal)
Baseline
Preliminary
Post-DryFine
(Dry Coal)
Results
% Change
Relative to Pre-
DryFine
Calculated CEM Heat
Input
MBtu/hr 5,694 5,525 -3.0
Flue Gas Flow Rate kacfm 2,016 1,860 -7.7
Flue Gas Flow Rate klb/hr 6781 6582 -2.9
Measured NOX
Concentration
ppmv
(actual)
148 105 -29.0
NOX Emissions Rate lb/MBtu 0.284 0.194 -31.8
NOX Emissions Rate lb/hr 1617 1071 -33.8
SO2 Removal % 73.3 85.6
Measured SO2
Concentration
ppmv
(actual)
216 103 -52.3
SO2 Emissions Rate lb/MBtu 0.577 0.265 -54.1
SO2 Emissions Rate lb/hr 3,285 1,464 -55.4
Measured CO2
Concentration
% vol 11.88 12.35 4.0
CO2 Emissions Rate klb/MBtu 0.216 0.223 3.2
CO2 Emissions Rate klb/hr 1,230 1,232 0.2
Flue Gas Emission Effects
SO2 Flue Gas Emissions
SO2 removal was calculated from SO2 concentrations measured at the scrubber inlet and the
stack. The SO2 removal across the unit increased from 73.3% during pre-DryFine to 85.6%
during post-DryFine. This increase in SO2 removal was attributable to a higher percentage of
total flue gas flow being scrubbed, which was possible due to 3.4% lower total mass flow rate of
flue gas and 50F lower flue gas temperature at the scrubber inlet, which resulted in 7.7% lower
volumetric flow of flue gas. For pre-DryFine tests with wet coal, the pressure differential in
each Unit 1 scrubber was set to 6.5”wg. During post-DryFine tests it was possible to increase
scrubber pressure differential to 8.5”wg.
With Dry-Fine, the SO2 concentration in the stack flue gas was reduced by 52% compared to the
pre-DryFine wet coal baseline, and SO2 mass emission rate was reduced by 55%. The
reduction in SO2 emissions was attributable to more efficient SO2 scrubbing, removal of sulfur
from the coal by the dense particle segregation process, and lower coal flow.
8
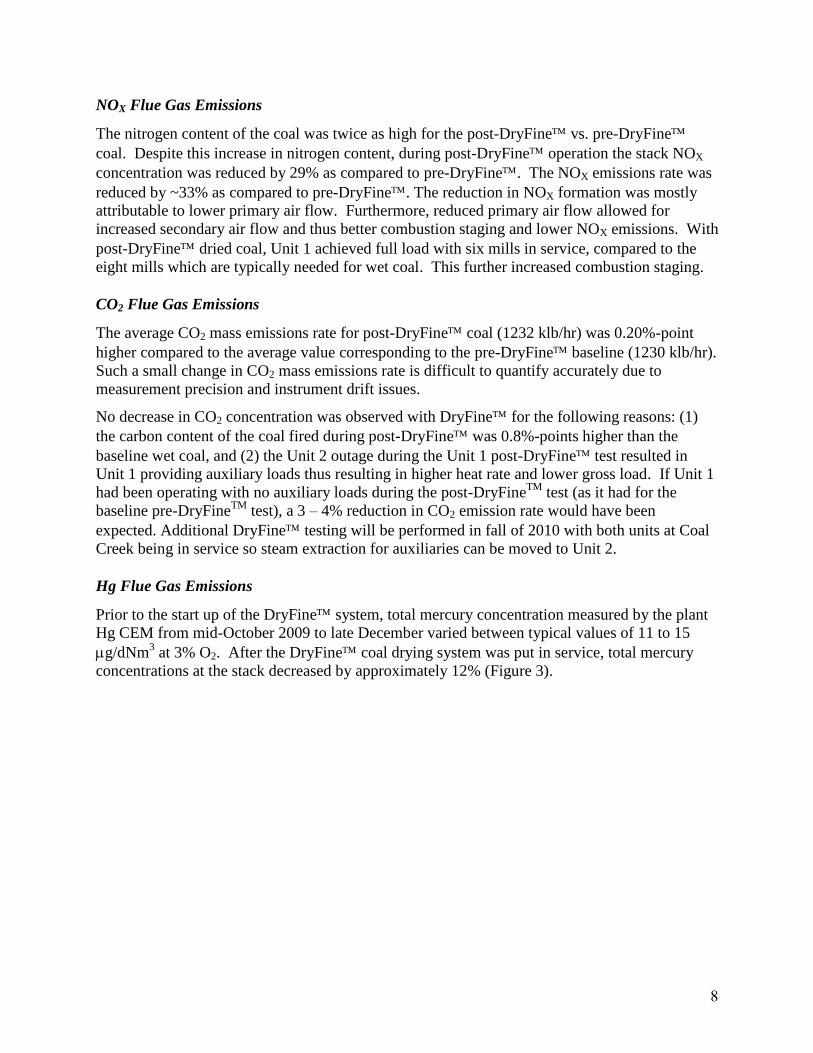
NOX Flue Gas Emissions
The nitrogen content of the coal was twice as high for the post-DryFine vs. pre-DryFine
coal. Despite this increase in nitrogen content, during post-DryFine operation the stack NOX
concentration was reduced by 29% as compared to pre-DryFine. The NOX emissions rate was
reduced by ~33% as compared to pre-DryFine. The reduction in NOX formation was mostly
attributable to lower primary air flow. Furthermore, reduced primary air flow allowed for
increased secondary air flow and thus better combustion staging and lower NOX emissions. With
post-DryFine dried coal, Unit 1 achieved full load with six mills in service, compared to the
eight mills which are typically needed for wet coal. This further increased combustion staging.
CO2 Flue Gas Emissions
The average CO2 mass emissions rate for post-DryFine coal (1232 klb/hr) was 0.20%-point
higher compared to the average value corresponding to the pre-DryFine baseline (1230 klb/hr).
Such a small change in CO2 mass emissions rate is difficult to quantify accurately due to
measurement precision and instrument drift issues.
No decrease in CO2 concentration was observed with DryFine for the following reasons: (1)
the carbon content of the coal fired during post-DryFine was 0.8%-points higher than the
baseline wet coal, and (2) the Unit 2 outage during the Unit 1 post-DryFine test resulted in
Unit 1 providing auxiliary loads thus resulting in higher heat rate and lower gross load. If Unit 1
had been operating with no auxiliary loads during the post-DryFineTM
test (as it had for the
baseline pre-DryFineTM
test), a 3 – 4% reduction in CO2 emission rate would have been
expected. Additional DryFine testing will be performed in fall of 2010 with both units at Coal
Creek being in service so steam extraction for auxiliaries can be moved to Unit 2.
Hg Flue Gas Emissions
Prior to the start up of the DryFine system, total mercury concentration measured by the plant
Hg CEM from mid-October 2009 to late December varied between typical values of 11 to 15
g/dNm3 at 3% O2. After the DryFine coal drying system was put in service, total mercury
concentrations at the stack decreased by approximately 12% (Figure 3).

9
Figure 3: Stack Total Hg Concentrations as Measured by Plant Hg CEM
9
10
11
12
13
14
15
16
17
10/1/2009 10/21/2009 11/10/2009 11/30/2009 12/20/2009 1/9/2010 1/29/2010 2/18/2010 3/10/2010 3/30/2010
Time
Tota
l Mer
cury
, Hg
T [
g/d
Nm
3 at
3%
O2]
DryFine put in service on Unit 1
on 12/18/2009; air jig
intermittently in operation
Table 2 compares the pre- and post-DryFine mercury emissions at each flue gas measurement
location. It also provides percent mercury removal and re-emissions information. System
mercury removals were not calculated as coal Hg data were not available at the time this paper
was written. System mercury removals must be calculated with respect to the raw coal, since the
dense particle segregation in the DryFineTM
process reduces the mercury content of the coal
fired. With the DryFine process, total mercury concentration at the air heater inlet decreased
from an average of 18.7 µg/ dNm
3 to 15.5 µg/
dNm
3. Mercury oxidation at the FGD inlet
increased from 28% to 41% with the DryFine process; likewise, mercury oxidation at the
bypass increased from 22% to 36%. The FGD outlet Hg concentration decreased from 13.0 to
9.6 µg/ dNm
3 with the DryFine process.
Flue gas mercury concentration data across the FGD were used as the basis for calculating the
percent of oxidized mercury at the FGD inlet re-emitted as elemental mercury at the FGD outlet.
Mercury re-emissions from FGD systems occur when soluble oxidized mercury is captured in a
wet FGD system and then reduced to the insoluble elemental form of mercury. The chemistry
governing re-emissions is not fully understood; laboratory studies have shown that factors such
as pH, oxidation-reduction potential (ORP), SO32-
, and Cl-concentrations affect the tendency for
re-emissions. During pre-DryFine tests, the percent of oxidized mercury removed across the
FGD averaged 85%, and the percent of oxidized mercury re-emitted as elemental mercury
averaged 12%. During post-DryFine tests, the percent oxidized mercury removed across the
FGD averaged 89%, and the percent oxidized mercury re-emitted as elemental mercury averaged
16%. Within the level of accuracy of the mercury measurements, the mercury removal profile of
the FGD did not change from baseline to post-DryFineTM
.

10
Table 2. Comparison of Pre- to Post-DryFine Hg Emissions Profile
(all concentrations expressed as µg/dNm3 at 3% O2).
Location Parameter
Pre-
DryFine
Average
Post-
DryFine
Average
AH Inlet Total Hg 18.7 15.5
Elemental Hg 18.1 15.4
% Oxidized Hg 8% 2%
FGD Inlet Total Hg 16.0 14.1
Elemental Hg 11.6 7.9
% Oxidized Hg 28% 41%
FGD Outlet Total Hg 13.0 9.6
Elemental Hg 12.2 8.9
% Oxidized Hg 5% 6%
Bypass Total Hg 14.8 14.4
Elemental Hg 11.6 9.7
% Oxidized Hg 22% 36%
Stack Total Hg N/A 8.7
Elemental Hg N/A 8.3
% Oxidized Hg N/A 5%
Other
Calculations % Hgox
Removal Across FGD 85% 89%
% Hgox
Re-emitted as Hg0 22% 16%
Expected Stack Hg Conc.,
assuming 20% bypass for BL,
12% bypass for DryFine 13.6 10.0
Byproduct Emission Effects
Coal & Ash Analysis
Solid samples were taken from the raw (wet) coal stream entering the unit, mill (pulverizer)
rejects (manual sample), economizer ash (manual sample), bottom ash (manual sample), and fly
ash (manual sample). With the coal drying system in operation, coal samples were also taken
from the segregated coal stream (air jig inlet), cleaned coal (air jig outlet), and dried coal (coal
dryer) feeders (product stream), and scrubber limestone feed. Coal mercury analyses were not
available at the time this paper was written.

11
Mercury content in the ash was < 0.01 µg/g (0.01 ppm). Pulverizer rejects were high in sulfur
(average 13%) and mercury (average 5 µg/g), where mercury was most likely included in pyrite.
Although concentration of mercury in pulverizer rejects was more than two orders of magnitude
higher than in the coal, pulverizer rejects represented only 0.02 – 0.03% of raw coal flow.
Chlorine in raw coal and product streams was low at 24 and 19 ppm, respectively.
FGD Analysis
FGD absorber mercury concentrations are reported in for pre-and post-DryFine test periods in
Table 3. Missouri river water, service water, and lime slaker were all tested for mercury. During
pre- and post-DryFine, these streams all measured below the detection limit of 0.31g/L.
Several additional parameters were measured in the FGD unit during pre- and post-DryFine
and are reported in Table 4. These parameters are presented to characterize the chemistry of the
scrubber during the tests. The effect of the DryFineTM
process on FGD chemistry should not be
assessed from this limited set of data.
Table 3. Average FGD Absorber Mercury Concentrations for Test Periods
Sample Location Period
Hg in
Liquor
(µg/L)
Hg in
Solids
(µg/g)
Wt%
Solids
% Hg
in
Liquor
% Hg
in
Solids
Absorber
Blowdown
Pre-
DryFine 3.2 0.50 12.94 4.1% 95.9%
Absorber
Blowdown
Post-
DryFine 0.8 0.93 9.70 0.8% 99.2%
Table 4. FGD Absorber Chemistry during Test Periods
Period
Pre-DryFine
Average
Post-DryFine
Average
wt% 12.94 9.70
pH 6.37 5.80
Temp [C] 60.3 56.0
ORP 29.0 33.5
Liquid Phase
Cl [mM] 24.82 15.78
Liquid Phase
Br [mM] 0.19 -
Liquid Phase
SO3 [mM] 19.86 12.19
Solid Phase
Fe [ppm] <0.3 <0.3

12
CONCLUSION
GRE installed a patented low-temperature coal drying and density segregation process
(DryFineTM
) at Coal Creek Station Units 1 and 2. This process reduces coal moisture, sulfur,
mercury, and ash content and thereby should increase unit efficiency, reduce pollution and
reduce CO2 emissions. Performance tests were conducted pre and post-DryFineTM
installation to
quantify the effect on unit operation and gas phase emissions. Operation of the DryFine
process resulted in lower coal feed rates and lower flue gas volumes. The lower flue gas volume
allowed the scrubbers to be operated at higher pressure drop and for more flue gas to be
scrubbed. SO2 removal efficiency increased from 73.3% to 85.6%, and SO2 emissions decreased
by 54%. Despite an increase in coal nitrogen content during post-DryFine operation, the stack
NOX concentration was reduced by 29% as compared to pre-DryFine. The NOX emissions rate
was reduced by ~32% as compared to pre-DryFine. The reduction in NOX was primarily
attributable to a decrease in primary air flow. No decrease in CO2 concentration was observed
with DryFine, likely because of an increase in coal carbon content during the post-DryFine
test and because the Unit 1 turbine could not be isolated from auxiliary loads (due to Unit 2
outage). A decrease in stack Hg emissions was observed upon commencement of DryFine
operation; this decrease is attributable to the segregation of dense particles from the coal and an
increase in mercury oxidation in the flue gas upstream of the FGD.
REFERENCES
1. Katalambula, H., et al, “Low-grade Coals: A Review of Some Prospective Upgrading
Technologies,” Energy & Fuels 2009, 23, (7), 3392-3405.
2. Bullinger, C.W. and N. Sarunac, “Lignite Fuel Enhancement,” Draft Final Technical Report
for DOE-NETL Project DE-FC26-04NT41763, 29 June 2010.
3. Sarunac, N., “Effect of Coal Drying on Unit Performance and Operation,” Prepared for the
Cooperative Power, Energy Research Center Report, October 1997.
4. Bullinger, C.E. et al, “Lignite Fuel Enhancement Final Technical Report: Phase 1,” Site
Report to U.S. DOE-NETL as part of Cooperative Agreement DE-CF26-04NT41763, November
2006.
DISCLAIMER
This report was prepared as an account of work sponsored by an agency of the United States
Government. Neither the United States Government nor any agency thereof, nor any of their
employees, makes any warranty, express or implied, or assumes any legal liability or
responsibility for the accuracy, completeness, or usefulness of any information, apparatus,
product, or process disclosed, or represents that its use would not infringe privately owned rights.
Reference herein to any specific commercial product, process, or service by trade name,
trademark, manufacturer, or otherwise does not necessarily constitute or imply its endorsement,
recommendation, or favoring by the United States Government or any agency thereof. The
views and opinions of authors expressed herein do not necessarily state or reflect those of the
United States Government or any agency thereof.