EFFECT OF COMPETITIVE STRATEGIES ON GROWTH OF …
215
EFFECT OF COMPETITIVE STRATEGIES ON GROWTH OF SMALL AND MEDIUM ENTERPRISES IN KENYA FUNDED BY WOMEN ENTERPRISE FUND ATIENO OUKO ONYONYI DOCTOR OF PHILOSOPHY (Business Administration) JOMO KENYATTA UNIVERSITY OF AGRICULTURE AND TECHNOLOGY 2018
Transcript of EFFECT OF COMPETITIVE STRATEGIES ON GROWTH OF …

EFFECT OF COMPETITIVE STRATEGIES ON
GROWTH OF SMALL AND MEDIUM ENTERPRISES
IN KENYA FUNDED BY WOMEN ENTERPRISE FUND
ATIENO OUKO ONYONYI
DOCTOR OF PHILOSOPHY
(Business Administration)
JOMO KENYATTA UNIVERSITY OF
AGRICULTURE AND TECHNOLOGY
2018

Effect of Competitive Strategies on Growth of Small and Medium
Enterprises in Kenya Funded by Women Enterprise Fund
Atieno Ouko Onyonyi
A Thesis Submitted in Partial Fulfillment for the Degree of Doctor
of philosophy in Business Administration (Strategic Management) in
the Jomo Kenyatta University of Agriculture and Technology
2018

ii
DECLARATION
This thesis is my original work and has not been presented for a degree in any other
university.
Signature………………………………………… Date…………………….
Atieno Ouko Onyonyi
This thesis has been submitted for examination with our approval as University
Supervisors
Signature……………………………………… Date……………………
Dr. Esther Waiganjo
JKUAT, Kenya
Signature……………………………………… Date……………………
Dr Agnes Njeru
JKUAT, Kenya

iii
DEDICATION
This thesis is dedicated to my husband Leonard, my son Andrew and my father John
Ouko. They have been very supportive and cheered me on even when I felt like
giving up. May God bless them all.

iv
ACKNOWLEDGMENT
First and foremost, I give all the glory to God, the giver of wisdom and knowledge
and the source of my strength for granting me the mental and physical endurance to
prepare this thesis .Secondly, my profound appreciation goes to Dr. Esther Waiganjo
and Dr. Agnes Njeru who being my supervisors, provided guidance for my thesis.
Their insightful suggestions, timely comments and encouragement throughout the
entire thesis process was invaluable. Special gratitude goes to my dear husband,
Leonard, my son Andrew for the support and encouragement you gave me during my
entire PhD studies. Your understanding, support and encouragement gave me the
zeal to complete this thesis. This thesis could not have been accomplished without
the contribution of many other people whom I have not mentioned here.
Last but not least, I highly recognize the WEF volunteers in Kasipul office who
were the research supervisors in this study for their contribution and timely filling of
the questionniares. Without their contribution and cooperation, data collection would
not have been possible.
God bless you all

v
TABLE OF CONTENT
DECLARATION ........................................................................................................ ii
DEDICATION ........................................................................................................... iii
ACKNOWLEDGMENT........................................................................................... iv
TABLE OF CONTENT ............................................................................................. v
LIST OF TABLES ..................................................................................................... x
LIST OF FIGURES ................................................................................................. xii
LIST OF APPENDICES......................................................................................... xiii
ACRONYMS AND ABBREVIATIONS ............................................................... xiv
DEFINITION OF TERM ........................................................................................ xv
ABSTRACT ............................................................................................................ xvii
CHAPTER ONE......................................................................................................... 1
INTRODUCTION ...................................................................................................... 1
1.1 Background of the Study .................................................................................... 1
1.2 Statement of the Problem ................................................................................. 6
1.3 Research Objectives ........................................................................................... 7
1.3.1 General Objective ........................................................................................ 7
1.3.2 Specific Objectives ...................................................................................... 7
1.4 Research Questions ............................................................................................ 8
1.5 Research Hypotheses .......................................................................................... 8
1.6 Significance of the Study.................................................................................... 8

vi
1.6.1 SME Managers ............................................................................................ 9
1.6.2 Women Enterprise Fund ............................................................................ 10
1.6.3 The Local Community ............................................................................... 10
1.6.4 Business and Academic Researchers ......................................................... 10
1.6.4 Policy Makers ............................................................................................ 11
1.7 Scope of the Study ............................................................................................ 11
1.8 Limitation of the Study ..................................................................................... 12
CHAPTER TWO ..................................................................................................... 14
LITERATURE REVIEW ........................................................................................ 14
2.1 Introduction ...................................................................................................... 14
2.2 Theoretical Framework .................................................................................... 14
2.2.1 Porter’s Competitive strategies .................................................................. 14
2.2.2 Micro Small Medium Enterprises Cooperative Strategies ........................ 21
2.2.3 Resource-based View Theory .................................................................... 24
2.2.4 Ansoff’s Marketing Matrix ........................................................................ 25
2.2.5 Theory of Growth ...................................................................................... 30
2.3 Small and Medium Enterprises Growth ........................................................... 33
2.4 Conceptual Framework .................................................................................... 40
2.3.1 Market Penetration Strategy ...................................................................... 42
2.3.2 Market Development Strategy ................................................................... 45
2.3.3 Product Development Strategy .................................................................. 49
2.3.4 Diversification Strategy ............................................................................. 53

vii
2.3.5 Small and Medium Enterprises Growth..................................................... 56
2.5 Empirical Literature.......................................................................................... 60
2.6 Research Gaps .................................................................................................. 76
2.7 Summary........................................................................................................... 79
CHAPTER THREE ................................................................................................. 81
RESEARCH METHODOLOGY ........................................................................... 81
3.1 Introduction ...................................................................................................... 81
3.2 Research Philosophy ........................................................................................ 81
3.3 Research Design ............................................................................................... 82
3.4 Population ......................................................................................................... 83
3.6 Sample and Sampling Technique ..................................................................... 83
3.6 Data Collection Instruments ............................................................................. 87
3.7 Data Collection Procedure ................................................................................ 88
3.8 Pilot Test ........................................................................................................... 89
3.8.1 Validity ...................................................................................................... 89
3.8.2 Reliability................................................................................................... 89
3.9 Data Analysis and Presentation ........................................................................ 90
3.9.1 Statistical Model ........................................................................................ 92
3.10 Operational Definition of the Variables ......................................................... 95
CHAPTER FOUR .................................................................................................... 99
RESULTS AND DISCUSSION .............................................................................. 99
4.1 Introduction ...................................................................................................... 99

viii
4.2 Response Rate .................................................................................................. 99
4.3 Normality Test ................................................................................................ 100
4.4 Descriptive Results ......................................................................................... 101
4.4.1 Education level ........................................................................................ 101
4.4.2 Business Training Undertaken ................................................................. 102
4.4.3 Type of Business ...................................................................................... 103
4.4.4 Reason for Getting into Business............................................................. 104
4.4.5 Market Penetration Strategy .................................................................... 105
4.4.6 Market Development Strategy ................................................................. 106
4.4.7 Product Development Strategy ................................................................ 108
4.4.8 Diversification Strategy ........................................................................... 110
4.4.9 SME Growth in Number of Employees ................................................... 111
4.4.10 SME Growth in Monthly Turnover ....................................................... 112
4.4.11 SME Growth on Business Worth........................................................... 114
4.5 Discussion of Findings ................................................................................... 115
4.5.1 Effect of Market Penetration on SME Growth ........................................ 115
4.5.2 Effect of Product Development on SME Growth .................................... 126
4.5.3 Effect of Market Development on SME growth ...................................... 130
4.5.4 Effect of Diversification Strategy on SME Growth................................. 136
4.5.5 Hypothesis Testing ............................................................................. 137

ix
CHAPTER FIVE .................................................................................................... 143
SUMMARY, CONCLUSIONS AND RECOMMENDATIONS........................ 143
5.1 Introduction .................................................................................................... 143
5.2 Summary of Major Findings .......................................................................... 143
5.2.1 Effect of Market Penetration Strategy on the Growth of SMEs .............. 144
5.2.2 Effect of Market Development Strategy on the Growth of SMEs ........... 144
5.2.3 Effect of Product Development Strategy on the Growth of SMEs .......... 145
5.2.4 Effect of Diversification Strategy on the Growth of SMEs ..................... 145
5.3 Conclusions .................................................................................................... 146
5.4 Recommendations .......................................................................................... 146
5.4.1 Recommendation in Practice ................................................................... 146
5.4.2 Recommendation for Policy .................................................................... 148
5.5 Areas for Further Research ............................................................................. 149
REFERENCES ....................................................................................................... 150
APPENDICES ........................................................................................................ 177

x
LIST OF TABLES
Table 3.1: Sampling Frame ....................................................................................... 87
Table 3.2: Operationalization of Variables ............................................................... 96
Figure 4.1: Response Rate ........................................................................................ 99
Table 4.2: Normality test ......................................................................................... 100
Table 4.3: Level of Education ................................................................................. 101
Table 4.4: Business Training Undertaken ............................................................... 102
Table 4.5: Type of Business .................................................................................... 103
Table 4.6: Reason for Getting into Business ........................................................... 104
Table 4.7: Market Penetration Strategy................................................................... 105
Table 4.8: Market Development Strategy ............................................................... 107
Table 4.9: Product Development Strategy .............................................................. 109
Table 4.10: Diversification Strategy ....................................................................... 110
Table 4.11: SME Growth Number of Employees ................................................... 111
Table 4.12: SME Growth of Monthly Turnover ..................................................... 113
Table 4.13: SME Growth Business Worth .............................................................. 114
Table 4.14: Model Summary Market Penetration on Turnover Growth ................. 116
Table 4.15: Market Penetration on Turnover Growth ............................................ 117
Table 4.16: Parameter Estimation of Market Penetration on Turnover Growth ..... 117

xi
Table 4.17: Model Summary on Effect of Market Penetration on SME Business
Worth ..................................................................................................... 120
Table 4.18: Effect of Market Penetration on SME Business Worth ....................... 121
Table 4.19: Effect of Market Penetration on SME Business Worth ....................... 121
Table 4.20: Effect of Market Penetration on SME Number of Employees Growth 123
Table 4.21: Effect of Market Penetration on SME Number of Employees Growth 123
Table 4.22: Effect of Market Penetration on Employee Growth ............................ 124
Table 4.23: Effect of Product Development on SME Turnover Growth ................ 126
Table 4.24: Effect of Product Development on SME Business Worth ................... 128
Table 4.25: Effect of Product Development on SME Number of Employees Growth
............................................................................................................... 129
Table 4.26: Effect of Market Development on SME Turnover Growth ................. 131
Table 4.27: Effect of Market Development on SME Business worth Growth ....... 132
Table 4.28: Effect of Market Development on Number of Employees Growth ..... 135
Table 4.29: Parameter Estimation on Growth Variables......................................... 139

xii
LIST OF FIGURES
Figure 2.1: Porters Competitive Strategies ............................................................... 17
Figure 2.2: Conceptual Framework .......................................................................... 41
Figure 2.3: Ansoff’s Product/Growth Matrix ........................................................... 42

xiii
LIST OF APPENDICES
Appendix1: Letter of Introduction .......................................................................... 177
Appendix 2: Questionnaire ..................................................................................... 178
Appendix 3: Growth on Business Worth Model summary, F-test and parameter
estimation .............................................................................................. 186
Appendix 4: Growth on Turnover Model summary, F-test and parameter estimation
............................................................................................................... 187
Appendix 5: Growth on Number of Employees Model summary, F-test and
parameter estimation ............................................................................. 188
Appendix 6: Normality test ..................................................................................... 189
Appendix 7: University Research Approval ........................................................... 190
Appendix 8: Research Permit Letter ....................................................................... 191
Appendix 9: ............................................................................................................. 192

xiv
ACRONYMS AND ABBREVIATIONS
AMFI Association of Microfinance Institutions
CWES Constituency Women Enterprise Scheme
FI Financial Intermediary
FMCGs Fast Moving Consumer Goods
GDP Gross Domestic Product
GOK Government of Kenya
ILO International LabourOrganisation
MSMEs Micro, Small and Medium Enterprises
NPD New-product development
OECD Organization for Economic Cooperation and Development
PIMS Product Impact Market Strategies
SME Small and Medium Enterprises
SMEDF Micro and Small Enterprises Development Fund
SPSS Statistical Package for Social Sciences
WEF Women Enterprise Fund

xv
DEFINITION OF TERM
Business growth: SME growth can be listed as increase in sales, increase in the
number of employees, increase in profit, increase in assets,
increase in the firm´s value and internal development.
Internal development comprises development of
competences, organizational practices in efficiency and the
establishment of professional sales process (Achtenhagen
et al., 2010).
Brush et al. (2009) define growth as geographical
expansion, increase in the number of branches, inclusion
of new markets and clients, increase in the number of
products and services, fusions and acquisitions.
Competitive Strategy: Plan formulated and developed with the purpose of
assisting a firm in performing various activities differently
from its rivals (Zott, 2003).
Competition: Rivalry in which every seller tries to get what other sellers
are seeking at the same time: sales, profit, and market
share by offering the best practicable combination of
price, quality, and service (Allen & Gale, 2000).
Competitive advantage: Competitive advantages are composed of a firm’s relative
value that was produced by its resources and relative
resource costs for producing such value (Hunt, 2000).
Competitiveness: Competitiveness of a firm can be taken as its ability to do
better than comparable firms in sales, market shares, or
profitability (Lall, 2001).

xvi
Cost leadership strategy: Is an integrated set of action taken to produce goods or
services with features that are acceptable to customers at
the lowest cost, relative to that of competitors (Ireland
&Hitt, 2011).
Differentiation: Is the ability of a firm to achieve competitive advantage
over its rivals because of the perceived uniqueness of their
products and services (Acquaah &Ardekani, 2006).
Focus: Implies pursuing specific market segments through overall
cost leadership and or differentiation as opposed to
engaging in the whole market (Porter, 2001)
Firm Performance: Is the sum of accomplishments attained by all
businesses/departments involved with an organizational
goal during a given period of time with the goal either
meant for a specific use or on the overall extent (Ling Ya-
Hui & Hong Ling, 2010)
SMEs: Mugwara (2000) defines small and micro enterprises as
businesses owned by individual entrepreneur who employs
oneperson to twenty people as the business grows.
Women Entrepreneur: Women entrepreneur as a woman who have initiated a
business, is actively involved in managing it, and owns at
least 50% of the firm and have been in operation one year
or longer (Ahmad, Xarier, Perumal & Nor, 2011).
xvii
ABSTRACT
Many women-owned small and medium enterprises (SMEs) are being created every
year but the sizes in terms of sales, profits and capitalization remain small majority
employing one to two employees. In 2007 the Government of Kenya set up the
Women Enterprise Fund (WEF) as part of an integrated strategy on the promotion of
women owned enterprises to provide accessible and affordable credit to support
women start or expand business for wealth and employment creation. This paper
examined the effect of competitive strategies on growth of WEF funded SMES in
Kasipul and Kabondo Kasipul Constituencies of Homa Bay County as a
representation of rural SMEs with strong agribusiness regions. This study was
intended to extend the generalization ability of Ansoff’s growth strategies as well as
provide sufficient ground for the government to formulating relevant policy
frameworks for guiding the formation, incubation and growth of SMEs in Kenya The
study used cross sectional survey as the research design targeted a population of
3768 women owned SMEs funded by WEF in the two Constituencies. Proportionate
stratified sampling was used to form a sample of 304 women entrepreneurs. Simple
random sampling was applied on the sample to select the respondents from each
constituency. Questionnaires were used to collect data which were analysed using
descriptive and inferential statistics. The results showed that 85.8% variation on the
growth of SMEs was due to the competitive strategies that SMEs applied. Moreover,
the data fitted with the ANOVA model very well (P = 0.000). The market penetration
strategy had statistically a positive significant effect on growth of the business (P =
0.000). Likewise, product development strategy had statistically significant effect on
growth (P = 0.032). However, the market development strategy had insignificant
effect on growth of SMES (P = .460). The mean impact of market penetration on
growth was 11994.595. The mean influence of product development and market
development on growth was less from the reference group by 3680.869 and 996.615,
respectively. Hence, the SMES that emphasized on market penetration strategy
performed better than those SMES which emphasized on market development and
product development strategies. However, the diversification strategy was not

xviii
included in the ANOVA model in this study. This was because only 8 SMEs applied
diversification strategy. The results of the study provided recommendations on
competitive strategies to empower women to grow their businesses.

1
CHAPTER ONE
INTRODUCTION
1.1 Background of the Study
Small and Medium Enterprises (SMEs) are known to contribute to over 55% of GPD
and over 65% of total employment in high income countries. They also account for
over 60% of GPD and over 70% of total employment in low in income countries
(OECD, 2014). SMEs in Kenya cut across all sectors of the economy and are a major
source of employment, income and is key in poverty reduction (Government of
Kenya [GOK], 2005). Ninety eight percent (98 %) of all businesses in the country
are SMEs which contribute about 25 % of GDP and 50% of formal employment
(MOIED, 2015; KNBS, 2016). SMEs also play a critical role in the penetration of
new markets and stimulate growth and development of economies (United Nations
Industrial Development Organization [UNIDO], 2015).
Informal sector covers all small-scale activities that are semi organized and
unregulated, use low and simple technologies. Majority of the small businesses such
as retailers, hawkers, boda boda riders and other service providers fall in this sector.
The ease of entry and exit into the sector coupled with the use of low level or no
technology makes it an easy avenue for employment creation (GoK, 2017).
According to 1999 National SME Survey, there were a total 13Millions SMEs in
Kenya. There were 612,848 women in MSEs in Kenya, accounting for 47.4 per cent
of all those in MSEs. The results showed that women tended to operate enterprises
associated with traditional women’s roles, such as hairstyling, restaurants, hotels,
retails shops and wholesale. More than two-thirds (66%) of these small enterprises
were found in non-urban strata (small towns and rural areas), (Kihonge, 2014).
A 2008 ILO study on women enterprises in Kenya and found that one of the major
barriers facing them was lack of sufficient capital for expansion (affecting 55 per
cent of businesses) and/or cash for the business (affecting 30 per cent of the
businesses). Inadequate access to formal credit stands out as a key impediment to

2
their survival and performance (ILO, 2008; ILO, 2011). In August 2007, the
government of Kenya set up the Women Enterprise Fund [WEF] to provide
accessible and affordable credit to support women start or expand business for
wealth and employment creation. WEF has reach hitherto un-served or seriously
under-served women, not too many as yet and not too smoothly as yet (WEF, 2009).
This fund is aimed to enable the government realize the 3rd Millennium
Development Goal (MDG) on “gender equality and empowerment of women”
(Kihonge, 2014).
In 2008, the country adopted Vision 2030, a new development blue print covering
the year 2008-2030. The reform aims to transform the country into a newly
industrializing “middle income” country providing high quality life to all its citizens
by year 2030. The government's Vision 2030 plan calls for these reforms, but
realization of the goals calls for more concerted efforts from all stake holders and
more so increased accountability and transparency in the government (Kihonge,
2014). In recognition of the critical role women play in socio-economic
development, the WEF has been identified as a flagship project under the social
pillar in the Vision 2030. It is expected that the fund will play a catalystic role in
mainstreaming women in the formal financial services sector (Mwobobia, 2012).
The Government of Kenya through the Treasury has to date allocated Kshs 4.5
billion (USD 50.6 Million). These funds have benefitted 864,920 women who have
borrowed over Kshs. 4.5 billion (USD 50.6Million) whilst over 404,800 have been
trained on business management skills, sensitization and registration of 52 Savings
and Credit Co-operatives (SACCOs), use of mobile phone loan repayment,
partnership with private-public non-state actors (GOK, 2014). WEF has exclusively
served the financing needs of women-owned SMEs; however, whether the
microcredit services provided by the institution has spurred growth is not clear
(Kiraka, Kobia & Katwalo, 2013).
Various studies on WEF funded SMEs have indicated that women owned enterprises
benefiting from the Fund had registered growth in the overall median gross business

3
worth, turnover and gross profit. They also grew the number of employees.
Evidence from the study by Kiraka et al. (2013) attributed the positive growth
observed in women owned businesses to low interest rates, the three-month grace
period granted to borrowers in the CWES stream, identification of the right business
for which demand exists, innovation through the establishment of complementary
services, passion for the enterprise and provision of individual loans (Kiraka et al.,
2013). The growth and expansion of SMEs requires sustained investment in working
capital. However, at low levels of income, the accumulation of such capital may be
difficult. Under such circumstances, microcredit facilities may help small-scale
entrepreneurs improve their incomes and accumulate own capital (Atieno, 2001).
An appropriate combination of access to credit, credit conditions, and adequate
financial and operational policies, is the only way to deal with the complex problem
of SMEs survival and growth. It is widely recognized that financial institutions play
an important role in supporting entrepreneurs who start innovative activities such as
new businesses (Mairura, Namusonge & Karanja, 2013).
Jonsson and Devonish (2009) recognize that firms that have properly planned and
applied competitive strategies have a tendency to have higher performance than those
that do not. Business leaders can achieve a higher rate of sustainability by focusing
on strengths, weaknesses, opportunities, and threats (Mirzakhani, Parsaamal &
Golzar, 2014). Competitive strategy applies when a firm exploits new or unique
markets good for strong low cost competitor, segment markets and offer
differentiated products and services to the new market segment offer unique features
products, focused relationship building (Porter, 1998). Thompson and Strickland
(2010) on their part, define competitive strategies as consisting of all those moves
and approaches that a firm has and is taking to attract buyers, withstand competitive
pressure and improve its market position (Thompson and Strickland, 2010).
Developing and implementing strategic and operational business plans enable owners
to position their businesses to outperform competitors when faced with conflicting
demands and limited resources (Cordeiro, 2013; Parnell, 2013).

4
Whilst micro-enterprises are very often the source of innovation, they are also
especially vulnerable to competition from counterparts who introduce new products
or services, or improve their production processes, lacking the resources to respond
rapidly. Competition (markets) and information related factors, are said to be major
challenges. Competition is seen in form of the size of market share in the rural
setting. Most of these markets are not expanding and new competitors such as mini-
super markets with wide varieties of products for those who were engaged in selling
household products are emerging (Mwobobia, 2012).
Consequently, there is need to assist SMEs gauge their performance, learn from their
environments about how to survive the competitive environment and continuously
seek to reposition their key factors of competitive advantage in line with
environmental changes (Rahman, 2012).
According to Ross and Perry (1999), there are different views for describing the four
aspects of a firm’s competitiveness. First is competition intensity which is explained
by increased number of firms or similar product offering in a given industry, which
according to Porter (1985) leads to product differentiation to enhance a firm’s
competitive position. Where competition intensity is high, a firm can identify a
unique product dimension that is valued by its customers and position itself to meet
those needs using its internal strengths (Ross & Perry, 1999).
A competitive product is the one that satisfies individual consumer needs and
preferences, this way, competition intensity is an important aspect of competition
(Crosby, 1979). The second aspect of competition is aspect of firm’s competitiveness
is the product quality, which is measured by the degree of conformance to
predetermined specifications and standards. Any absence of specified attributes of a
product or deviations from these standards can lead to its inability to compete
effectively in the industry (Crosby 1979). A third aspect of competition is a firm’s
product cost. Garvin and March (1986) describes a products competitiveness in terms
of costs and price. A competitive product is one that provides performance at
acceptable price or provides conformance at acceptable cost. The firm’s marketing

5
experience is the fourth aspect of a firm’s competitiveness. The competitiveness of a
product or service is a simple unanalyzable property that people learn to recognize
only through experience (Garvin & March, 1986).
The common denominator in the development of marketing strategies for the SME
sector that can lead to growth and success, is the concept of strategy development
and product differentiation strategy, such as specific service providing and as well as
innovation. It is always based on the principle of market segmentation for SMEs,
which suggest the implementation of marketing strategy in a focused (concentrated)
market (Marmullaku & Ahmeti, 2015). It has been suggested that certain strategic
alternatives are typically more appropriate for a small firm, namely those that avoid
direct competition with larger firms and that involve the development of close
customer relationships and product adaptation (Storey & Sykes, 1996). In the
specific language of Ansoff’s Matrix, it has been suggested by (Perry 1987) that for
SMEs the most appropriate growth strategies are therefore market penetration,
product development and market development.
Ansoff (1987) developed four directional strategies model called product /market
matrix as a tool for strategic choice as a business analysis technique that provides a
framework enabling growth opportunities to be identified. It can help businesses to
consider the implications of growing the business through existing or new products
and in existing or new markets. Each of these growth options draws on both internal
and external influences, investigations, and analysis that are then worked into
alternative strategies (Perry, 1987). While Porter offers, how to identify competitive
strategies, Ansoff matrix provided linkage between both products and the markets.
Ansoff’s model builds on Porters generic strategies and highlights the gap the
subsidiary objectives relating to the marketing mix are used to fill. Ansoff matrix is a
strategic marketing tool that links a firm’s marketing strategy with its general
strategic. Ansoff matrix is a planning technique used for deliberate judgment about
firm growth through product and market extension networks (Beamish & Ashford,
2005).

6
1.2 Statement of the Problem
Many women-owned MSEs are being created every year but the sizes in terms of
sales, profits and capitalization remain small majority employing one to two
employees. Majority of them do not live to see their second birthday and are pushed
out of operations in the course of time by unfavorable conditions (Kinyanjui, 2006).
The specific business problem is that some small-business owners lack the skills,
knowledge, and strategies to succeed in business beyond 5 years (Neumark Wall, &
Junfu, 2011). The SMEs can grow faster through proper practices of strategic
management and when it is very clear to them the factors they need to pay attention
to when implementing their strategies (Kihara, 2016).
Studies that have analyzed the relationship between credit and growth of enterprises
with positive results include Nkurunziza (2005); Obwori et al, (2012); Simwa and
Sakwa (2013); Simeyo et al. (2011); Memba et al. (2012); Mwangi and Wanjau
(2013). Considerable research has been on performance on WEF and growth of
SMEs. Kiraka et al. (2013) found the median business worth had increased two-fold
from Kshs. 20,000 to Kshs.40,000. among enterprises that received loans through
CWES. Study findings show that there was general indicators reflect positive growth
among women owned businesses in terms of total business worth, turnover, gross
profit and number of employees. Findings by Chepwony and Sang (2017) further
indicated that access to WEF microcredit results showed a strong positive correlation
between access to WEF and performance of women owned enterprises with a
coefficient of r= 0.714. This implied that access to WEF would mean an expansion
of the enterprise and consequently more sales and increased profits. Locally, Kiraka
et al. (2013) conducted a study on MSME growth and innovations by focusing on the
performance of the WEF in Kenya; Machira et al., (2014) did a study on accessibility
of WEF among small and micro enterprise owners in Tharaka South District, Kenya;
Muteru (2013) did a study on the effect of microfinance institutions on growth of
women owned enterprises: A case study of Kenya Women Finance Trust in Kikuyu
Township and Kombo, Onyango and Mukhebi (2014) did a study on the role of WEF
in entrepreneurship development in Bondo District, Kenya.

7
Less attention has also been paid on competitive strategies and growth of SMEs
using the Ansoff’s matrix. Various studies have previously been conducted regarding
WEF funded SMEs but none has specifically focused on SME growth strategies
through product and market linkage with a focus on the rural context of Kasipul and
Kabondo Kasipul. Ansoff's matrix is one of the well known frameworks for decision
making about product- market linkage strategies for expansion. Apart from this, the
emphases of the previous studies were on Porter’s competitive strategies by firms.
Therefore, the aim of this study is to find the relationship between the subsidiary
objectives relating to the marketing mix and growth of WEF funded SMEs. This
research would contribute to the existing literature on the Ansoff’s theory by giving
clues as to how product- market linkage strategies for growth of SMEs in the rural
agribusiness areas impact the performance of firms in Kenya.
1.3 Research Objectives
The study seeks to address the following objectives
1.3.1 General Objective
The general objective of the study was to investigate the effect of competitive
strategies on the growth of SMEs funded by Women Enterprise Fund in Kenya
1.3.2 Specific Objectives
1. To determine the effect of market penetration strategy on the growth of SMEs
funded by WEF in Kenya
2. To examine the effect of market development strategy on the growth of SMEs
funded by WEF in Kenya
3. To establish the effect of product development strategy on the growth of SMEs
funded by WEF in Kenya
4. To determine the effect of diversification strategy on growth of SMEs funded by
WEF in Kenya

8
1.4 Research Questions
1. What is the effect of market penetration strategy on growth of SMEs funded
by WEF in Kenya?
2. How does market development strategy affect the growth of SMEs funded by
WEF in Kenya?
3. What is the effect of product development on growth of SMEs funded by
WEF in Kenya?
4. How does diversification strategy affect the growth of SMEs funded by WEF
in Kenya?
1.5 Research Hypotheses
Ho1: Market penetration strategy has no significant effect on growth of SMEs
funded by WEF in Kenya
Ho2: Market development strategy has no significant effect on growth of SMEs
funded by WEF in Kenya
Ho3: Product development strategy has no significant effect on growth of SMEs
funded by WEF in Kenya
Ho4: Diversification strategy has no significant effect on growth of SMEs funded
by WEF in Kenya
1.6 Significance of the Study
This research is unique as it examined the competitive strategies for growth of SME
through product and market network using the Ansoff Matrix. This study is an
attempt to explore firm’s growth and role of Ansoff growth strategies in predicting
growth of SMEs in Kenya. In Kenya more than two-thirds (66%) of small enterprises
are found in non-urban areas (small towns and rural areas), the choice of Kasipul and
Kabondo Kasipul constituencies is a representation of rural SMEs in agri-business
regions, therefore this study will help provide some form of analysis for rural SMEs

9
in Kenya. It is estimated that rural non-farm income presents on average 42% of rural
income in Africa, 32% in Asia and 40% in Latin America.
Non-farm income is increasingly an important source of revenue in rural areas, even
in traditional subsistence areas such as many regions in Sub-Sahara Africa. The
SMEs in these constituencies form important nodes as they usually cater primarily to
the local market in the towns and its hinterland, and are better able to adapt to local
market conditions. They are often also more dependent on the local supply of inputs
and services than the large enterprises and their local branches. The SMEs in the said
areas also forward and back link the rural areas with Regional, National and
International markets. Therefore, enhanced SME activities in rural areas could form
an integrated symbiotic relationship which ensures continuous two-way flow of
benefits from cities to rural areas on a sustainable basis (Kihonge, 2014). This study
is intended to extend the generalization ability of Ansoff Matrix growth strategy.
1.6.1 SME Managers
The study findings are expected to provide knowledge that could inform
implementation of best practices for growing SMEs in Kenya. They will significantly
give important lessons on how best to organize the SMEs in order to realize long
lasting benefits and optimal contribution to economic growth. The findings of this
study are anticipated to be useful to the upcoming SMEs as they will be enabled to
better understand the importance of adopting the right strategies and be conversant
with best practices in regard to business growth and profit sustainability.
It is hoped that the study findings will help unsuccessful small business enterprises to
take off and also new ones to succeed while existing ones to even grow bigger.
Consequently, SMEs will gain understanding on the strategic issues they need to
address in order to position themselves more competitively. SMEs growth is
important for generating wealth and jobs although it is understood that at least
adequate profitability is always necessary and high profitability is important. If
growth also entails a rising market share, then it is also indicates underlying

10
competitiveness as long as some form of analysis and discussion of their implications
for small firm policy.
1.6.2 Women Enterprise Fund
WEF to develop entrepreneurship development programmes tailored to meet the
specific needs and constraints of women, including those in the informal economy.
WEF to set up business advisory centres for women to access so that they can
identify market niches and grow their businesses to assist them in particular to
identify growth strategies in new enterprises or agribusiness.
1.6.3 The Local Community
The local community comprises of many women who may be potential
entrepreneurs. For these high potential grouping, the study will provide insight into
the competitive strategies as they venture towards starting their businesses and
achieving business growth. The same applies to all other categories of new
entrepreneurs, especially those who belong to economically vulnerable groups, such
as youth and the old. The local community will also benefit through being able to
understand better the environment those businesses operate in and be more
responsive in meeting their obligations to these SMEs.
1.6.4 Business and Academic Researchers
Knowledge about SMEs strategic decisions has mostly been derived from data
obtained from developed economies that have many institutional similarities. This
study is of significance because it is being carried out from the perspective of the
Kenya; a developing economy will contribute to the body of knowledge. Thus, the
study findings might arouse the interest of business and academic researchers to
carry out more studies in the context of developing countries especially in Africa.

11
1.6.4 Policy Makers
In view of the economic significance of the MSEs in terms of employment creation
and economic development, this research work will be of immense benefit to the
Government. The study will also contribute to knowledge on competitive strategies
and growth in the agri-business areas for women MSEs in poverty alleviation.
Equally important, the government could apply the study information to develop
support programs and growth strategies for small business enterprises and also for
the counties in the face of devolution. This will be crucial in the evolution of
appropriate policies for promoting SME business enterprises, development and
increasing the County’s resources for poverty eradication and empowerment.
The government may use the finding as a policy framework within which this sector
can be enhanced to create more employment opportunities. This will provide
sufficient ground for the government to formulating relevant policy frameworks for
guiding the formation, incubation and growth of the SMEs in Kenya for government
microfinance programs such WEF, Youth Development Fund, Uwezo fund, etc.
In addition, this research will enable both policy makers and stakeholders to identify
the strengths and weaknesses of various strategies/incentives; policy areas are
required for growth of MSEs through appropriate policies intervention to enable
access of credit and affordable financial services. Such policies may be geared
towards encouragement of marketing strategies and growth of SMEs.
1.7 Scope of the Study
This study was conducted in two constituencies of Homa Bay County namely;
Kasipul and Kabondo Kasipul. These two sub-counties lie in agro-ecological zones
described as Upper Midland, coffee-tea-zone which occupies southern parts of
Kasipul and Kabondo Kasipul sub-counties where tea and coffee are grown. It is also
good for many other crops including sweet potato, maize, horticultural crops among
other agricultural production. The other zone is found in Lower Midland, Kasipul
and the north of Kabondo Kasipul sub-counties. This zone supports green grams,

12
millet, sorghum, tobacco, sunflower, sugarcane, beans, pineapples, sisal and
groundnuts. The choice of these two constituencies is a representation of rural SMEs
with strong agribusiness backgrounds. These two constituencies were selected on the
basis of the expected variations in the socio and economic profiles of the SMEs.
The focus was on 3768 women loan beneficiaries as at 30th September 2015 as per
the records of loan beneficiaries provided by the Constituency Women Enterprise
Scheme (CWES) offices in the two constituencies. The study was to determine the
strategies adopted by these SMEs which resulted in growth. This study reviewed
businesses which had received loans between 2009 and 2015. WEF began its
operations in December 2007, loan disbursement began in earnest during the 2008/09
fiscal year, hence the choice of this study period covering January 2009 to September
2015 when the study was undertaken.
1.8 Limitation of the Study
This study was restricted to four independent variables these being market
penetration, market development, product development and diversification strategies.
There are other independent variables that may affect the observed findings but
which are not accounted for in the model. Such independent variables include age of
the firm, location of the business, the person who manages the businesses and the age
of the loans, to name a few. Since strategies are plans for making strategic business
decisions keeping in view the environment and bureaucracy. In formation of their
strategies, it is expected that SMEs will have evolved around the three forces of
strategy formulation which are the environment, organizational operations system
and leadership.
One of the key limitations of the study is lack of access to the sampling frame.
However, with the support of the WEF credit officers who are volunteers in each
constituency and who were familiar with the women entrepreneurs who had
benefited from the Fund, we were able to construct a credible sampling frame. WEF
credit officers who are volunteers at the sub-county level were helpful in identifying

13
the women entrepreneurs. These volunteers are used by WEF to identify women
entrepreneurs and groups who can access the Fund. They also train the women and
help them to complete their loan applications. They are also trusted by the women,
which makes it relative easy for them to respond to the request for data. These credit
officers therefore were at the heart of the data collection exercise and were used in
this study as research coordinators at each constituency level.

14
CHAPTER TWO
LITERATURE REVIEW
2.1 Introduction
This chapter reviews the existing literatures theories and models relating to the
variables used in the study, a review of past studies on the area of study. This study
is based on some of the authors on competitive business strategies including Porters’
Competitive Strategies and Ansoff’s Marketing Matrix (1987). A critique of the
chosen theoretical framework used in the study is then presented and linked to the
conceptual framework.
2.2 Theoretical Framework
2.2.1 Porter’s Competitive strategies
This study was based on Porter’s competitive strategy theory (1998) in which the
main motive is to gain competitive advantage which means the organisation will
focus on developing an edge that helps the organisation in getting the maximum sales
of their product or service and also help in take it away from the competitors. (Porter,
1998).
Porter always maintained in his work of generic strategy that the one thing in which
companies need to focus is not to get stuck in the middle when it comes to strategy
which means it is very important to choose the right and a perfect generic strategy
since the decision to choose a specific type of strategy will help in underpinning
every other strategic decision for the company and make it more worthwhile in order
to spend right time on right things.
Therefore, when the company is in the process of choosing three generic strategies, it
is significant to take into account the competencies of the organisation and its
strength into account (Rangan et al., 2012).

15
Much discussion of small firm strategy is based upon the Porter approach (Burns &
Harris, 1996). In this framework, competitive advantage is hypothesized to derive
from product market positions based on either cost leadership (selling a standard
product at a lower cost than competitors) or market differentiation (selling a product
that is unique in some way and therefore commands a higher price). These two
strategies can also be distinguished according to their competitive scope. Thus, the
strategies may operate over a whole market or be focused upon a particular segment
(Megicks, 2002)
As a part of broad market strategies, it is very important to decide before hand
whether the company will focus on cost leadership or on differentiation strategy. So
in this strategy the company will either depend on cost focused strategy or on
differentiation strategy. On the broader basis, the main key is to ensure that the
company is adding something extra which as a result serves only that specific market
niche. The fact that something extra which can be done through number of ways like
reducing costs or by increasing differentiation, it is important to focus on the kind of
customers company is serving and the kind of expectation of the customers (Rangan
et al., 2012).
There are number of steps which can be followed here in this case. The first one is
that for each generic strategy the company will have to focus on SWOT analysis
where the company can (Rangan et al., 2012). There are two sources of superior
performance namely: locating an industry where industry conditions are good
enough to allow a rate of return above the competitive level and having a firm attain
a position of advantage viz a viz competitors within an industry to allow it to earn a
return in excess of industry average. As competition intensifies, very few industry
environments can guarantee same returns, hence the primary goal of a strategy is to
establish a position of competitive advantage for a firm (Kirunja, 2011).
Competitive strategy applies when a firm exploits new or unique markets good for
strong low cost competitor, segment markets and offer differentiated products and
services to the new market segment offer unique features products, focused

16
relationship building. A firm's relative position within its industry determines
whether a firm's profitability is above or below the industry average. Generic
strategies are concerned there are three approached which come under these
strategies since they can be applied on products or services and it also can be
available for all size of companies (Porter, 1998). Porter (1998) suggested three
generic competitive strategies for protecting new markets or strategic business units.
Porter’s typology of generic competitive strategies is: cost leadership, differentiation,
and focus. These three actually fall into two basic categories. The focus strategy
calls for concentration on a niche or a narrow segment. But Porter says that success
in this strategy can be achieved either via cost leadership or differentiation (Porter,
2012).
Porter named these strategies as cost leader ship which can also be known as no frill
strategy, differentiation where the company will have to create a unique or desirable
products and services and focus where companies offers a specialised service in a
specific niche market. Focus strategy can subdivide into further two parts as cost
focus and differentiation focus (Porter, 2012). The main motive of Porter’s generic
strategies is to gain competitive advantage which means the company will focus on
developing an edge that helps the company in getting the maximum sales of their
product or service and also help in take it away from the competitors. This can be
done through two strategies. First one is increasing the profits by reducing the costs
and also charging prices which are on the basis of average in the industry. Second
method is increasing the market share through charging lower prices and increasing
the sales (Porter & Lee, 2013).

17
Figure 2.1 below illustrates the three competitive strategies (Porter, 1998).
Figure 2.1: Porters Competitive Strategies
Source: Porter (1998). The Competitive advantage
a. Differentiation Strategy
Porter (1998) defines the differentiation strategy as one which means that the
company make its own product or services different from the competitors and also
make it more attractive for the customers. How a company does it completely depend
on the nature of the market in which the company is working and it will also involve
features, functionality, durability and support. Apart from this, the company also
depend on brand image of the customer value. An organization also needs to focus
on a strong research which involves development and innovation, the capacity to
deliver high quality product or services and effective sales and marketing so that the
industry understand the advantages offered by the differentiated company (Porter &
Lee, 2013).
In a differentiation strategy a firm seeks to be unique in its industry along some
dimensions that are widely valued by buyers. It selects one or more attributes that
many buyers in an industry perceive as important and uniquely positions itself to
meet those needs. It is rewarded for its uniqueness with a premium price (Porter,

18
1998). In using this strategy, a firm selects one or more attributes that many buyers in
an industry perceive as important, and uniquely positions itself to meet those needs.
It is rewarded for its uniqueness with a premium price (Porter, 1998). SMEs
primarily adopt a differentiation strategy, where the product or service delivered is
different from those already in the market. This is often further refined to a
particular market niche (Hay & Kamshad, 1994). Differentiation strategies are
designed to create and market innovative/high quality products and/or services
industry-wide (Porter, 1980).
This may enable the SME to grow more successfully as it exploits a gap in the
market. Investment in product innovation is usually the main strategy for growth
(Hay & Kamshad, 1994). Better after sell services, they further says for products to
have sustainable and differential advantages it must provide the customers the
benefits, be unique, sustainable, profitable, after a firm has created its differential
advantages it can enhance its competitiveness through positioning itself by diversify
its products, introduced new brands, changes existing brands, change customers
believes (Luiz & Geoff, 2006). According to a study by Marques, Lisboa, Zimmerer
and Yasin (2000), the success of this strategy is dependent on new product
development; brand identification; innovation in marketing techniques and methods;
and advertising.
b. Low Cost Leadership Strategy
An organization can increase the profits by reducing the costs and also charging
prices which are on the basis of average in the industry. Second method is increasing
the market share through charging lower prices and increasing the sales (Porter &
Lee, 2013). According to Porter (1998), in cost leadership, a firm sets out to become
the low cost producer in its industry. The sources of cost advantage are varied and
depend on the structure of the industry. They may include the pursuit of economies
of scale, proprietary technology, preferential access to raw materials and other
factors. A low cost producer must find and exploit all sources of cost advantage. If a
firm can achieve and sustain overall cost leadership, then it will be an above average
19
performer in its industry, provided it can command prices at or near the industry
average (Porter, 1998).
The cost reduction efforts of cost leadership strategy can be classified into three main
categories: the first one is reducing unit manufacturing costs through higher unit
volume, efficient scale facilities, and experience curve; the second one is exercising
strict cost control over engineered costs; and the third one is minimizing
discretionary costs like R&D (Porter, 1998). The cost leadership strategy requires the
sale of a “standard or no-frills” product combined with “aggressive pricing” (Porter,
1980). Thus, the strategy involves making a fairly standardized product and under
pricing everybody else (Kiechel, 1981b).
An important requirement of the cost leadership strategy is “heavy up-front capital
investment in state-of-the-art equipment” (Porter, 1980). So, Kiechel (1981a) says
that in order to maintain cost leadership a firm should therefore “buy the largest,
most modern plant in the industry,” these are such high stakes. The “low cost”
strategy involves the construction of efficient scale facilities, and aggressive pursuit
of cost reduction and cost minimization in all functions of the organization, and
products offered to customers who are price sensitive (Dess & Davis, 1984).
c. Focus Strategy
Focus strategy which companies use mainly concentrate on specific niche market and
also tries to understand the dynamics of the market and the specific needs of the
customers within it (Porter & Lee, 2013). The company also focus on developing a
uniquely low cost and well specified product or services (Rangan et al., 2012). Luiz
and Geoff (2006) cites the importance of market segment and the kind of products
the company chooses to offer serve and says that it determines where business will
compete effectively, sustainable differential advantages occurs due to superior
products. The generic strategy of focus rests on the choice of a narrow competitive
scope within an industry (Luiz & Geoff, 2006).

20
The main motive of these companies to build a strong brand loyal customers and the
company is able to do so since these companies serve customers in a unique manner.
This is why this specific market segment is less attractive for the competitors. Focus
strategy involves targeting activities to selected segment of the market, either by
providing goods or services at a lower cost to that segment cost focus or by providing
differentiated product or service for the needs of that segments focus strategies
enable organization to target their marketing mix decision to their needs of specific
customer groups (Rangan et al., 2012).
The focuser selects a segment or group of segments in the industry and tailors its
strategy to serving them to the exclusion of others. The focus strategy has two
variants. The first one is cost focus a firm seeks a cost advantage in its target
segment, while in the second on being differentiation focus a firm seeks
differentiation in its target segment. Both variants of the focus strategy rest on
differences between a focuser's target segment and other segments in the industry
(Luiz & Geoff, 2006).
The target segments must either have buyers with unusual needs or else the
production and delivery system that best serves the target segment must differ from
that of other industry segments. Cost focus exploits differences in cost behaviour in
some segments, while differentiation focus exploits the special needs of buyers in
certain segments (Porter, 1998). Anyanga and Nyamita, (2016), posit that SMEs in
Kisumu’s Kibuye market used service positioning whereby, the business enterprise
had identified a specific market segment to serve, to position the service in the
market place and consumer mind and the enterprise saw their customers as long term
partners and maintain relationship through quality service. (Anyanga & Nyamita,
2016).
Box (2011) conducted a qualitative case study that included 99 small-business
owners and entrepreneurs in which business owners fit into three categories—
differentiators, cost leaders, or stuck in the middle—when sustaining a business.
According to Porter (1980), the three competitive strategies are alternative viable

21
approaches for dealing with environmental forces. Firms that fail to select one of
these strategies are “stuck in the middle” and, therefore, almost always doomed to
failure. As Porter notes, the “stuck in the middle” firm lacks the investment in low
cost structure to compete on price, the industry-wide differentiation to necessarily
offset the need for a low cost position, and the focus to achieve differentiation or a
low cost within a limited market space (Porter, 1980).
Porter’s competitive strategy theory was applied in this study as part of broad
organizational strategies, it is very important for women in small businesses to
decide before hand whether the company will focus on cost leadership or on
differentiation strategy or adding something extra which as a result serves only that
specific market niche. As a part of broad market strategies, it is very important to
decide before hand whether the company will focus on cost leadership or on
differentiation strategy
2.2.2 Micro Small Medium Enterprises Cooperative Strategies
Cooperative strategies entail structured cooperative agreements between firms (e.g.,
buyer-supplier alliances, marketing alliances, R&D alliances). Such cooperation may
allow these entrepreneurial firms to increase product and process innovation through
R&D alliances, expand their production capacity through joint production
agreements, share marketing expenses and expertise with long-term marketing
arrangements, and reach foreign markets with distribution agreements (Larson,
1991). A firm's critical resources may span firm boundaries and may be embedded in
interfirm resources and routines. An increasingly important unit of analysis for
understanding competitive advantage is the relationship between firms and identify
four potential sources of interorganizational competitive advantage: (1) relation-
specific assets, (2) knowledge-sharing routines, (3) complementary resources/
capabilities, and (4) effective governance (Dyer & Singh, 1998).
Regard less of their function, these alliances are distinct from single-transaction
market relationships in that they are relatively enduring cooperative arrangements

22
(Steensma et al., 2000). Because of advantage of economies of scale, large
organisations tend to dominate many markets, leading to the demise of small firms.
However commercial cooperation give SMES similar opportunities to harvest scale
economies which with combination with their flexibility and knowledge of the local
market allows them to survive. SMEs can compete with chain stores and survive the
competition. In the retail sector the market position of SMEs is primarily threatened
by chain stores (Sterna & El-Ansury, 1988).
The 1950s saw the first important franchise organisations. In commercial cooperative
SME organisations, SMEs purchase substantial parts of their merchandize from the
organization. The participating firms standardize retail advertising and operating
procedures to a certain extent in order to obtain economies of scale. Economies of
scale have given retailers more power in the recent years in relation to both
manufacturers and wholesalers (The Economist, 1995). To reinforce their market
position, SMEs can join commercial mutual assistance organization like cooperative
groups, voluntary groups and franchise organisations. Commercial SME cooperation
in the retail sector is not only a modern phenomenon and an important trend for
future; it has a long history, cooperative and voluntary groups emerged in the 1930s
as a response to the appearance of chain stores (Stern & El-Ansay, 1980).
A general constraint that many of small entrepreneurial firms face is a relatively
restricted resource base as compared to what is available to larger, more established
competitors (Jarillo, 1989). One means for these entrepreneurial firms to overcome
this constraint is by cooperating with either other entrepreneurial firms or possibly
with larger, established, resource-rich firms (Suarez-Villa, 1998). Pecas and
Henriques (2006) opine that SMEs belonging to clusters and networks are often more
innovative than those operating in isolation and thus have a higher growth
propensity. Networking allows the SMEs to combine the advantages of smaller scale
and greater flexibility with economies of scale and scope in larger markets –
regionally, nationally and globally.

23
A large number of firms result in greater growth for new ideas. Ramsden and Bennett
(2005), also write that growth of small firms is strongly influenced by the level of the
inter-firms collaboration. The links take different shapes in which different firms join
together to co-produce, co-market, or co-purchase, cooperate in new product
development, or share of information. While networking is viewed as an important
requirement in enterprises of all sizes, these learning opportunities are argued to be
of particular importance to small firms in order to offset the vulnerability of size
acting as the key determinant of organizational success (Pecas & Henriques, 2006).
Research has shown that a significantly greater percentage of entrepreneurial firms
are using cooperative strategies than are their larger counterparts (Suarez-Villa,
1998).
Enterprise networking realizes tremendous benefits from increased collaboration and
better communication such as business growth, cost optimization and innovation
(Maria, 2011). Sathiabama (2011) shares similar views and belief that women gain
by networking through enhanced awareness, self-confidence, sense of achievement,
increased interaction, decision making capacity and involvement in solving problems
related to women and community. On the other hand, women networks are faced
with challenges that reduce their effectiveness (Sathiabama, 2011).
Sharafizad (2011) conducted a study in Australia on the determinants of business
networking behaviour of women in small businesses. The study established that
networking is important for small business owners as it can increase the success rate
of their business. The study findings revealed that the industry, industry experience,
and family responsibilities had direct impact on the networking behaviour of women
small business owners, with family and domestic responsibilities being the most
significant (Sharafizad, 2011).
In addition, the study established that the more domestic responsibility the women
had, the less likely they were to spend time doing non-core business activities, which
networking was often perceived as. Further, the study observed that specific and
relevant training programs gave the women more confidence to talk about their
24
business which enhanced their success rate. However, as the educational
backgrounds of the participants were often the determining factor behind their
chosen industry, it was concluded that educational background does indirectly impact
the networking behaviour and success of the owners (Sharafizad, 2011).
2.2.3 Resource-based View Theory
The origin of resource based view can be traced back to earlier research of Seiznick
(1957), Penrose (1959), among other researchers. The emphasis on this school of
thought was on the importance of resources and its implication for the firm
performance. This theory simply emphasizes the idea that an organization must be
seen as a bundle of resources and capabilities to create value and therefore gain
competitive advantage (Barney, 1991). The resource-based view further posits that
firms can achieve overall competitiveness and performance if they possess tangible
or intangible resources that are valuable, rare, inimitable and non-substitutable.
Penrose’s (1959) resources approach is concerned with managers who are ‘product-
minded,’ workmanship-minded,’ and ‘good-will builders.’ These managers are
interested in promoting the profitable growth of their firms by improving the quality
of existing products, reducing costs, developing better technology, and introducing
new products where it is likely to have a competitive advantage. Penrose recognizes
the presence of other types of entrepreneurs such as empire-builders; however, these
purely financially-oriented managers are viewed as financial speculators whose firms
show little resemblance to an industrial firm with strategic coherence and interlinks
among divisions (Penrose, 1959). These four characteristics of resources describe
what Barley (2007) considers strategic assets that, if properly mobilized build and
sustain a firm’s competitive advantage and improve its performance. According to
Barney (1991), enterprises in the same sector can be heterogeneous in respect to their
own resources and as resources are not perfectly transferable among enterprises, the
heterogeneity and the consequent competitive advantage achieved could be durable
over time.

25
However, resources and capabilities are not valuable on their own and are essentially
unproductive in isolation Newbert (2008). As such, Newbert contends that the key to
attaining a competitive advantage is by exploitation of a valuable resource-capability
combination. This view is further supported by Bitar and Hafsi (2007), who opine
that resources and capabilities are sources of competitive advantage, but they do not
necessarily contribute to competitive advantage.
However, despite the increased literature devoted to use of RBV. The theory has its
own critics. According to Hedman and Kalling (2003), this theory is criticized for
neglecting the obstacles to dynamics and managements. Chan et al. (2004) similarly
criticizes the theory for its implicit assumption of static equilibrium yet competitive
advantages stem from developing current capabilities that are highly effective in
responding to the organizational environment. For firms to attain competitive
advantage in this competitive environment, they need to provide value to customers.
This value can be derived from either cost advantage, service or differentiated
products.
Resource-based theory therefore, focuses on the relationship between a firm’s
internal resource stability and the ability to stay competitive through its strategy
formulation. RBV has also been extended by Grant (1991) to encompass competitive
strategy. According to Grant, RBV Theory links competitive strategies and
capabilities to value creation. He posits that not only do capabilities need to be
considered as the base to develop competitive strategy but they also need to be
renewed and maintained by strategist. Hence RBV is important to understand value
may stem from strategic alignment of resources and competitive strategies. In
developing their competitive strategies the SMES in Kenya may pay attention to the
resources existing within the firm so as to be able to create value for its customers.
2.2.4 Ansoff’s Marketing Matrix
While Porter offers, how to identify competitive strategies, Ansoff matrix provided
linkage between both products and the markets. Ansoff’s model builds on Porters

26
generic strategies and highlights the gap the subsidiary objectives relating to the
marketing mix are used to fill. Ansoff matrix is a strategic marketing tool that links a
firm’s marketing strategy with its general strategic. Ansoff matrix is a planning
technique used for deliberate judgment about firm growth through product and
market extension networks (Beamish & Ashford, 2005).
According to Rangan et al. (2012) there is a link of Porters Generic strategies to
Ansoff’s matrix, for example while an organization can go of product development,
market development, diversification or penetration strategies, they can either go for
cost differentiation or product differentiation strategies. While each case helps the
SME to increase market share it automatically helps in reducing fixed costs so cost
differentiation helps. You can actually gain new markets or penetrate in existing
market more using differentiation strategy also (Rangan et al., 2012).
It can help businesses to consider the implications of growing the business through
existing or new products and in existing or new markets. Each of these growth
options draws on both internal and external influences, investigations, and analysis
that are then worked into alternative strategies (Ansoff, 1957). The Ansoff matrix
presents the product and market choices available to an organisation. Herein markets
may be defined as customers, and products as items sold to customers (Lynch, 2003).
Ansoff matrix is a useful framework for looking at possible strategies to reduce the
gap between where the company may be without a change in strategy and where the
company aspires to be (Proctor, 1997). The Ansoff matrix is also referred to as the
market/product matrix in some texts. Ansoff matrix not only presents the options of
launching new products and moving into new markets, but also involves exploration
of possibilities of withdrawing from certain markets and moving into unrelated
markets (Lynch, 2003). This matrix is used by marketers, who have valor to grow in
market and create competitive advantage. Ansoff matrix offers strategic alternatives
to accomplish these objectives (Hussain et al., 2013).

27
Product market strategy concerns how a business intends to compete in the markets it
chooses to serve (Aaker 1999; Day and Wensley 1988), mapping the planned
patterns of resource deployments through which the firm attempts to achieve its
goals (Hughes & Morgan, 2007; Rosa & Spanjol, 2005). Product market strategy is
particularly important to marketing strategy researchers since it is the level of
strategy in which marketers in organizations typically have the greatest input and
influence and to which marketing strategy research has the potential to contribute
most to the “strategy dialogue” both within organizations and with management
scholars (Day, 1992; Varadarajan & Jayachandran, 1999).
Product market strategy is typically conceptualized in terms of two fundamental
decisions. First, product market scope, which concerns the extent to which a business
plans to target broad groups of customers or to focus more narrowly on a smaller
number of segments (Day, 1999; Vorhies et al., 2009). Second, the value proposition
to be delivered, which concerns the benefit/cost bundle by which a business seeks to
attract and retain target customers and achieve its strategic objectives (Day &
Wensley 1988; Slater & Olson, 2001). Value propositions comprise two core product
market strategy components: (1) the relative superiority of the business’s product
and/or service offerings, concerning the degree to which a business focuses on
creating superior product and service quality, image, and performance benefits for
target customers relative to those offered by competitors; and (2) the cost of
delivering its products and/or services to target customers, concerning the extent to
which the business focuses on actions and resource deployments that lower the cost
of delivering its products and/or services (Aaker, 1999; Vorhies et al., 2009).
Drawing on organization theory and industrial organization economics, early
strategic management theorists posited that product market strategies should focus on
either building superior products/services or achieving lowest delivered cost, and
either operating in narrow niches or broad mass marketplaces (Porter, 1985).
However, this viewpoint has been overtaken by both theory developments and
empirical evidence (e.g., Kotha & Vadlamani 1995). Theoretically, researchers have
posited that product/service superiority and lowering delivered cost product market
28
strategy decisions are not opposite ends of a continuum and are therefore not
mutually exclusive (Hill, 1988; Jones & Butler, 1988).
In addition, empirical studies have shown that many firms successfully pursue hybrid
product market strategies combining aspects of different scope, differentiation, and
cost minimization components (Vorhies et al., 2009). Lack of planning, improper
financing and poor management have been posited as the main causes of failure of
small enterprises (Longenecker et al., 2006). It has been suggested that certain
strategic alternatives are typically more appropriate for a small firm, namely those
that avoid direct competition with larger firms and that involve the development of
close customer relationships and product adaptation (Storey & Sykes, 1996). In the
specific language of Ansoff’s Matrix, it has been suggested by (Perry, 1987) that for
SMEs the most appropriate growth strategies are therefore market penetration,
product development and market development.

29
Dawes (2018), posits two logical inconsistencies in the Ansoff Matrix the first one
being the definition of a new product encompasses ‘mildly’ new-to-the-firm
additions such as a food company adding new package sizes or product formulations,
then the strategy of diversification, defined as new products and new markets, is not
necessarily a “break with past patterns … and an entry onto new and uncharted
paths” (Ansoff, 1957), nor necessarily inherently risky. Secondly if a firm develops,
acquires or sells a really new product – that is, something as yet unfamiliar to the
firm, arguably this simultaneously takes the firm into a new market. In which case
the matrix cell of diversification is redundant. The logical problem that arises now is
that there is an assumption that a business can venture into quite a different product
without its market changing (Dawes, 2018). It could learn about these issues, by
hiring relevant staff and doing research, but the key point is by launching or adding a
really new product to the business, the company has simultaneously moved into a
new market. In which case the diversification quadrant of the Ansoff Matrix is
redundant (Dawes, 2018).
To summarise, there are two logical inconsistencies embedded in the Ansoff matrix
are the first one being to accept new products can be incrementally new, then the
combination of new products and new markets does not necessarily equate to a risky
break from the past, as elucidated by Ansoff (1957) and echoed by other authors
(Gilligan & Wilson, 2009, Westwood, 2005). Secondly to reject the notion that new
products can be incrementally new, and must be really new (to the firm) then it is
very likely that developing or adding such a really new product simultaneously takes
the firm into a new market, in which case there is no need for a separate strategy
called diversification. These shortcomings, as well as the apparent subjectivity
involved in classifying the various Ansoff strategies, should be recognized by the
academics who include the Ansoff Matrix in their marketing or strategy curriculum
(Dawes, 2018).
While Ansoff analysis helps in mapping the strategic options for companies, it is
important to note that like all models, it has some limitations. By itself, the matrix
can tell one part of the strategy story but it is imperative to look at other strategic

30
models like SWOT analysis and PESTLE in order to view how the strategy of an
organisation is formulating and might change in the course of its future. Therefore,
the steps to be taken while conducting a strategic analysis of an organisation include
SWOT analysis, PESTEL and Ansoff matrix as fundamental models of analyses,
which should be used in conjunction and not in isolation, to view the complete
strategic scenario. Also, recommendations made on the basis on only one of the
models are not concrete and lack in depth. While the role of analysis in making
strategic choices cannot be undermined, it is imperative to note that judgement plays
a crucial role in making critical strategic choices that may change the future of the
firm (Macmillan et al., 2000). This theory was useful in explaining the competitive
strategies in this study that lead to a firm’s growth these are market penetration,
market development, product development and diversification strategies. The theory
affirms the role of marketing strategies for growth of SMEs. Further, this theory
informed the study on product and market extension networks, how a business
intends to compete in the markets it chooses to serve. The primary aim of this study
was to test the competitive strategies for growth of SMEs using Ansoff’s matrix.
This theory was used to guide this study to explain the effect of competitive
strategies (market penetration, market development, product development and
diversification) on the growth of WEF Funded SMEs.
2.2.5 Theory of Growth
There are various theoretical perspectives which explain the growth of SMEs and
associated strategies, but Dobbs and Hamilton (2007) claim that there is no single
theory which can adequately give the explanation. The organic/evolution theory by
Greiner (1972), cited in Gupta, Guha and Krishnaswami (2013), asserts that firms
learn about their efficiency overtime and move through distinguishable stages with
each phase containing a relatively calm period of growth and each with a
management crisis.
New firms entering the market are unaware of their true efficiencies immediately but
as they mature, they are able to uncover their productive efficiencies and adopt
31
strategies befitting the circumstances (Staines, 2005). According to dynamic stage
theory by Papadaki and Chami (1982), cited in Levie and Lichtenstein (2010), SMEs
have certain characteristics that are associated with the propensity for entrepreneurial
behaviour. SMEs with more of these characteristics are more likely to grow faster
than those with fewer ones (Papadiki & Chami, 2002).
In other words the attitude of the individual entrepreneur in taking risks, motive of
going into self employment, his or her managerial abilities to raise capital and
perceive new markets, will determine the growth of the firm. Finally, the life cycle
model by McMahon (1998) and similar in principle to the organic theory, explain the
growth of an enterprise using the biological metaphor of the “lifecycle” (McMahon,
1998).
The model postulates that organizations are born, grow and decline. The iterative life
cycle stages help to determine the genre of growth strategies to adopt (McMahon,
1998). From the review of growth studies (Penrose, 1959/95; Gilbert et al., 2006;
Garnsey et al., 2006; Davidsson et al., 2010; Senderovitz, 2010; Wright & Stigliani,
2013), it is clear that growth factors can make out a very long »laundry list« of
factors that may facilitate or hinder growth. Growth factors can roughly speaking be
divided into internal (within the firm) and external (environmental) factors, even if it
may in some instances be difficult to determine what is truly external and truly
internal (Davidsson et al., 2010). The industry development is usually seen as an
external factor, whereas in a Porterian world, industry affiliation is seen as a strategic
choice made by the firm (Porter, 1980, 1985). Similarly, opportunities may be
viewed as external factors, i.e. factors »out there« to be discovered, or as factors that
the firm should create and develop internally (Shane & Venkataraman, 2000; Dew et
al., 2009).
In her seminal work on firm growth, Penrose (1959/95) argues that firm resources
play a key role in achieving growth and competitive advantages. Limited resources
mean limited possibilities for growth. It is through the internal resources in general
and management resources in particular that the firm may develop unique

32
entrepreneurial (managerial) services which are, in turn, seen as a prerequisite to firm
growth and to achieving competitive advantage. According to Penrose, the internal
resource use is a key determinant of firm growth. Internal inducements to expansion
arise from the existence of currently unused productive services, resources and
specialised knowledge which, according to Penrose, are always to be found in any
firm (Penrose 1959). The issue of management capacity has been elaborated on and
categorised by Storey (1994) as management motivation, education, management
experience, number of founders and functional skills.
A number of studies have investigated the relationship between growth aspirations
and actual growth. These studies in general find that managers with higher
aspirations achieve higher actual growth. In this view, it is up to the management of
the firms to lay the foundations for growth (Wiklund & Shepherd, 2003; Delmar &
Wiklund, 2008; Stam & Wenneberg, 2009). External factors also influence growth.
These factors include macro-economic development, market conditions,
environmental dynamism, access to external financial capital, access to other
external resources and network, and access to general human capital (education
level) and specific human capital (experience) (Wiklund & Shepherd, 2003).
Growing ventures are highly dependent on the local environment for resources
needed for their operations, and the ability to acquire resources locally has
substantial implications for the levels of growth the firms will attain. The growth of
the individual firm is also influenced by the growth of the industry and the economic
and financial situation of the country and region as well as the industry dynamism
(Gilbert et al., 2006; Bamiatzi & Kirschmaier, 2014). In general, firm growth appears
to correlate with the general macro-economic and regional financial trends.
Summarising, from a theoretical perspective we argue that achieving growth may be
a matter of management capacity, growth aspiration, willingness and skills, but that
fundamental facilitators and obstacles in the environment play a key role for firm
growth (Gilbert et al., 2006; Bamiatzi & Kirschmaier, 2014).

33
2.3 Small and Medium Enterprises Growth
Female entrepreneurs find it difficult to start and operate their business because of
traditions, customs and societal attitudes towards women. Generally rural woman
appear to start business for survival to balance work and family with no intention to
grow. Rural women are burdened the family household roles. Because of these
women are left with little time for their businesses. The socio-cultural factors
influenced the growth of women-owned MSEs in rural areas (Mbiti et al., 2015).
Rural women appear not to be driven by profits but rather, by the need to provide for
their families or growth, all women entrepreneurs would benefit greatly from a
supportive environment that encourages women to “go for it”. Currently, there is a
lack of social and cultural support for the role of women as entrepreneurs; women
are subject to stereotypes with few visible role models for them at any level. Gender
barriers need to be addressed at all levels, from the legal system to the domestic
system (Muriungi, 2012).
Women entrepreneurs also need more access to a full range of financial and non-
financial support services. The growth of their enterprises is restricted by lack of
collateral and flexible finance options (Stevenson & St. Onge). The growth and
expansion of SMEs requires sustained investment in working capital. However, at
low levels of income, the accumulation of such capital may be difficult. Under such
circumstances, microcredit facilities may help small-scale entrepreneurs improve
their incomes and accumulate own capital (Atieno, 2001).
Growth can be an objective in itself, it can constitute a yardstick for the success of
the manager and his firm, and for the "progress" achieved by the latter (Starbuck,
1965).
Growth has been measured on the basis of an impressive number of variables, the
two indicators most widely used by literature being employment and sales (Kirchoff,
1991), for the entrepreneur, it can serve as an indicator of his success. An appropriate
combination of access to credit, credit conditions, and adequate financial and

34
operational policies, is the only way to deal with the complex problem of SMEs
survival and growth. It is widely recognized that financial institutions play an
important role in supporting entrepreneurs who start innovative activities such as
new businesses (Mairura, Namusonge & Karanja, 2013).
Growth enterprises are entrepreneurial firms with high possibilities to grow. Yet, not
all enterprises’ first and foremost objective was growth. Some enterprises are
established merely to exploit a short-time opportunity. Other enterprises like to
maintain the enterprise at its existing size. Enterprises that are seeking growth are
likely to be interested in innovation than those that were not. Enterprises whose
objective was to grow the enterprise, innovation provided a means to achieving
growth. Growth-oriented enterprises are characterized by a commitment to long-term
growth than short-term profit. Measures of growth of enterprises variable include:
employees, turnover, net assets and size (Njeru et al., 2013).
Growth of enterprises in their study was operationalized by annual employee
increase, degree of satisfaction on levels of turnover and degree of satisfaction on
innovation types (Njeru et al., 2013). Entrepreneurs and small business owners are
motivated to solve problems or deliver services better, faster, cheaper than others in
the market. Entrepreneurs harness creativity and innovation to seize opportunities
and offer alternatives in the marketplace (Muriungi, 2012). Successful entrepreneurs
manage risk by closely monitoring business processes and financial obligations, as
well as by focusing intently on their market and the challenges of building market
share (Muriungi, 2012).
In a number of countries, the scarcity of capital resources inhibits growth, so it is not
surprising that access to finance makes growth easier. Market niches allow fast
growth firms to exploit the quality of their product, as they tend to compete on
quality rather than price. Innovation, particularly amongst small high technology
firms is likely to lead to growth In other words; these firms develop high value
innovative products that are held in high esteem. A danger for many SMEs is that
attitudes to managing uncertainty and risk may lead to short-term decision-making
35
and the strategic objectives are ignored. Day-to-day survival is often behind many
decisions taken as SMEs balance the needs of customers with the demands of
suppliers and financiers (Storey, 1994). Focusing the firm’s strategy on sharing
equity, identifying a particular market niche, identifying new products, technological
sophistication and devolution of decision-making are key to growth businesses tend
to be those that extend ownership of the firm to others in exchange for equity
(Storey, 1994).
According to Mbiti et al. (2015), growth is the very essence of entrepreneurship,
making the relationship between growth and entrepreneurship a relevant question.
However, growth means increase in sales turnover, increase in profitability levels,
increase in number of employees, production lines, services and total capitalization.
Whereas women based enterprises have helped create 462,000 jobs annually in
Kenya (Republic of Kenya, 2005).
Women-owned enterprises have recorded low growth rate. General observation is
that there are many women-owned MSEs being created every year but the sizes in
terms of sales, profits and capitalization remain small majority employing one to two
employees. Majority of them do not live to see their second birthday. Further, those
businesses that survive they have remained small with insignificant growth
(Kinyanjui, 2006).
This trend supported the studies that many MSEs do not survive for long or they
transit to big ones or perhaps they are self-limiting in the sense that one is pushed out
of operations in the course of time by unfavorable conditions. This could account for
the observations that majority of the businesses are young and less than 5 years in
operation (Kinyanjui, 2006).
Management devolution is essential for growth as it becomes impossible for the
entrepreneur to manage on their own. Those firm that recruit experienced managers
from larger firms are likely to be more successful (Storey, 1994). A management
team that is too small is likely to be too busy to manage growth effectively. More

36
non-owner-managers regard business growth as important than owners and are
prepared to take greater risks to bring about this growth than owner-managers.
SMEs’ strategy tends to be emergent and informal. SMEs primarily adopt a
differentiation strategy, where the product or service delivered is different from those
already in the market. This is often further refined to a particular market niche. This
may enable the SME to grow more successfully as it exploits a gap in the market.
Investment in product innovation is usually the main strategy for growth (Hay &
Kamshad, 1994). It also allows the SME to focus on quality, innovation and
flexibility in delivering the product or service (Burns & Harrison, 1996). SMEs tend
to focus on operational planning with limited strategic planning, the main objective
being one of providing the product or service efficiently and effectively (Hagmann &
McCahon, 1993).
However, where firms monitor and develop external relationships it is likely to bring
competitive advantage (Goldberg et al., 2003; Savios & Blum, 2002). Strategies with
regard to the market, such as increase in marketing activities, improvement in
distribution, positioning and segmentation of the market, benefitting from market
niches and product correction were effective on growth (Brush et al., 2009;
Davidsson et al., 2010). Further, clients´ knowledge was positively associated with
growth (Barringer et al., 2005). Those SMEs that use strategic planning effectively
usually perform better than those who merely react to circumstance (Smith, 1998).
Determining strategy is often tied in with the firms’ innovativeness. In knowledge-
based firms, a resource-based view of strategy may support innovation (Savioz &
Blum, 2002).
Although product impact market strategies (PIMS) have shown that growth in market
share is correlated with profitability, other important forms of growth do exist.
Growth in the number of markets served, in the variety of products offered, and in
the technologies that are being used to provide goods or services frequently lead to
improvements in a firm’s competitive ability (Pearce & Robinson, 2005). Market
uncertainty is high in most SMEs as they tend to have a smaller share of the market,
to have one or two major customers and are hence less able to influence price. SMEs

37
tend to be price-takers. The high market share of large firms means that they usually
determine prices. An additional danger for SMEs is from those large firms that enter
a market and can compete on price. Thus, many SMEs operate in classic perfect
competition (Storey & Sykes, 1996). Churchill and Lewis (1983) also developed a
simple summary of the key factors which affect the success or failure of a business in
the different stages of its life. These are split between the attributes of the owner-
manager and resources. The important point is the move from the owner's operational
ability to their strategic ability as the business grows. This is one of the key qualities
of leadership (Churchill & Lewis, 1983).
Effective strategic management is vital if the firm is to succeed, indeed possibly
survive. Notwithstanding this, these firms will face numerous problems and crises as
they grow, some of which are predictable, others that are not (Lobonțiua &
Lobonțiua, 2013). Majumdar (2007) acknowledges that economies have included
many policies for the promotion of the SME sector like product reservation,
infrastructure support, direct and concessional credit, tax concession, special
assessment in procurement of equipment, facility of duty drawback, quality control,
and provision of market network (Majumdar, 2007).
Muthaih and Venkatesh (2012) suggest that many factors contribute in the SME
growth; similarly, there are many barriers to growth. For small businesses, barriers
can be of two types, institutional and financial. An institutional barrier includes the
enterprise's interaction with government, issues related to legalization, taxation, and
government support. Financial barriers will involve lack of financial resources.
Further, SMEs can also face external and internal barriers along with social barriers
which would cover aspects of market position of an enterprise, access to right kind of
human resources, and access to network (Muthaih & Venkatesh, 2012).
Moreover, Gaskill et al. (2003) assert that small businesses are dependent on the
owner's insight, managerial skills, training, education, and the background of the
company's leader. Often, lack of these characteristics is the cause of small business'
failure (Gaskill et al., 2003). Growth in market share is correlated with profitability;

38
other important forms of growth do exist. Growth in the number of markets served,
in the variety of products offered, and in the technologies that are being used to
provide goods or services frequently lead to improvements in a firm’s competitive
ability. Growth means change, and proactive change is essential in a dynamic
environment (Kiraka et al, 2013). Burns and Harrison (1996), good management is
the key to the growth and development of a smaller firm. This means that managerial
tasks in smaller firms are concentrated in the hands of very few people, and possibly
even a single person.

39
Most beneficiaries of WEF are low value enterprises therefore due to high level of
competition they therefore need to develop and apply strategies which will make
their businesses grow and survive competition (Kiraka et al., 2013). A key rationale
for supporting the MSME sector is its potential to generate output, employment and
income (Kantor, 2001).
Focusing the firm’s strategy on sharing equity, identifying a particular market niche,
identifying new products, technological sophistication and devolution of decision-
making are key to growth businesses tend to be those that extend ownership of the
firm to others in exchange for equity (Storey, 1994). A firm has a wide range of
strategies to pursue in creating and sustaining internal growth through use of Porter’s
Generic Strategies which include cost leadership, differentiation and focus (Barney,
2002). Besides these, marketing, development of alliances and the focus on the
ethical issues comprise important components of the growth strategy (Kazem, 2004).
O’Gorman (2001) notes that ‘success strategies’ are characterized as high growth
businesses. High growth businesses in turn are competitive on product quality, price
and new product offering (O’Gorman, 2001). Firms seeking growth on the basis of
innovation would essentially be oriented towards continuously offering a product
that would take a high rank on the ‘state-of-the-art’ scale in the market (O’Gorman,
2001). Porter and Stern (2001) attest that business growth is also realizable through
innovation, which the OECD (2000) defines as encompassing any new development
in firms (Porter & Stern, 2001).
This strategy involves creating or reengineering products or services to meet new
market demand, introducing new processes to improve productivity, developing or
applying new marketing techniques to expand sales opportunities, and incorporate
new forms of management systems and techniques to improve operational efficiency
(Porter & Stern, 2001). Production strategies, such as the development of new
products and services, technological specialization and focus on innovation, also
determined growth (Achtenhagen et al., 2010; Davidsson et al., 2010; Dobbs &
Hamilton, 2007; Moreno & Casillas, 2008).
40
2.4 Conceptual Framework
This section presents the conceptual framework that seeks to capture the main
components of the competitive strategies theory and SME growth. The conceptual
model cannot claim to be exhaustive. Inevitably, any framework is an
oversimplification of a complex reality and should be treated merely as a guide or a
lens through which to view the world (Owuor, citing Rakodi, 2006). According to
Mugenda (2008), a conceptual framework is a hypothesized model portraying the
relationship between variables graphically or diagrammatically. Conceptual
framework helps in quickly seeing the proposed relationship and is put to test in
order to establish the significance of the proposed relationship (Mugenda, 2008).
The development of the conceptual framework was guided by Ansoff’s marketing
matrix which argues that four strategies of market penetration, market development,
product development and diversification help create a defendable position that
contributes to growth of SMEs. The conceptual framework of this study was based
on available literature that states that Ansoff’s Matrix (1957) is a useful framework
for looking at possible strategies to reduce the gap between where the company may
be without a change in strategy and where the company aspires to be (Proctor, 1997).
This is further acknowledged that Ansoff matrix presents the product and market
choices available to an organisation (Lynch, 2003).
The conceptual framework (Figure 2.2) presents the postulated factors (the
independent variables) and the dependent variable (Growth of WEF Funded SMEs)
and illustrates the expected relationship between the independent variables and the
dependent variable. It also provides the initial framework for analysis on the basis of
the expected relationship between these variables. Using the measurements of the
independent variables (the competitive strategies), growth of WEF Funded SMES is
predicted on the basis of the Ansoff’s Marketing Matrix.
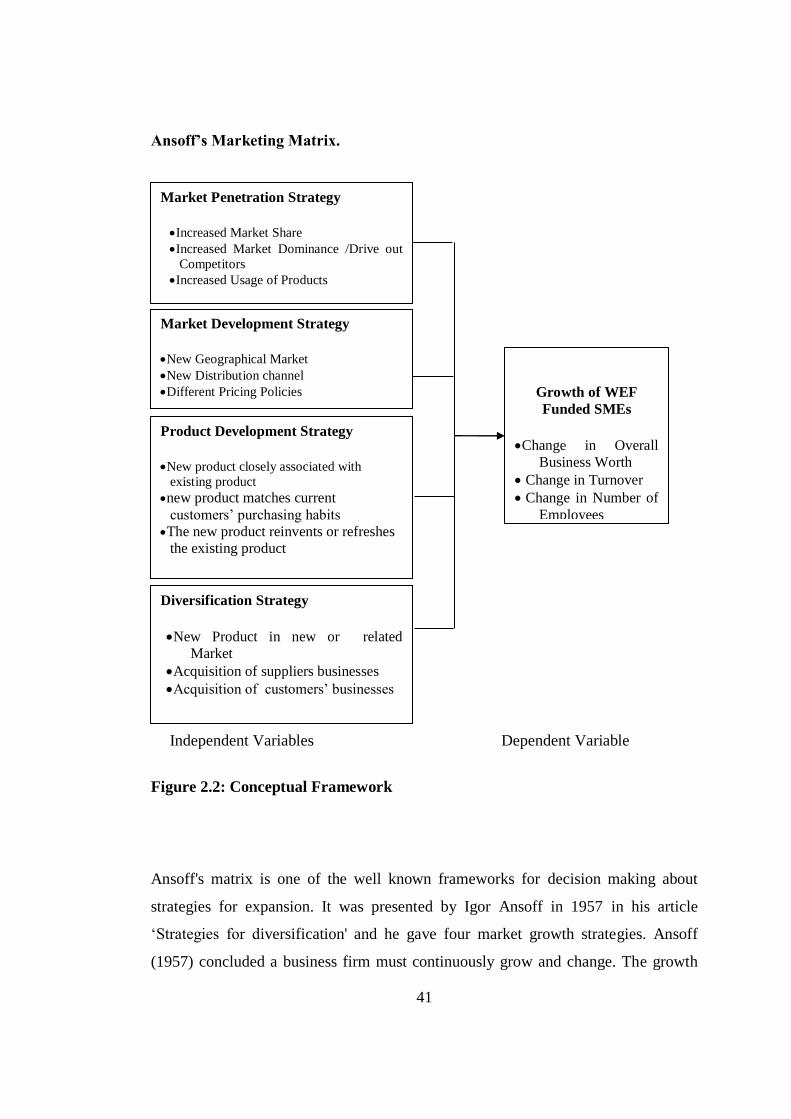
41
Ansoff’s Marketing Matrix.
Independent Variables Dependent Variable
Figure 2.2: Conceptual Framework
Ansoff's matrix is one of the well known frameworks for decision making about
strategies for expansion. It was presented by Igor Ansoff in 1957 in his article
‘Strategies for diversification' and he gave four market growth strategies. Ansoff
(1957) concluded a business firm must continuously grow and change. The growth
Market Penetration Strategy
Increased Market Share
Increased Market Dominance /Drive out
Competitors
Increased Usage of Products
Market Development Strategy
New Geographical Market
New Distribution channel
Different Pricing Policies
Product Development Strategy
New product closely associated with
existing product
new product matches current
customers’ purchasing habits
The new product reinvents or refreshes
the existing product
Growth of WEF
Funded SMEs
Change in Overall
Business Worth
Change in Turnover
Change in Number of
Employees
.
Diversification Strategy
New Product in new or related
Market
Acquisition of suppliers businesses
Acquisition of customers’ businesses

42
vectors are market penetration, market development, product development and
diversification (Hall & Lobina, 2007). This matrix is illustrated in the figure 2.3
below.
Figure 2.3: Ansoff’s Product/Growth Matrix
Source: Ingor Ansoff; Corporate Strategy. McGraw-Hill 1987
2.3.1 Market Penetration Strategy
Market penetration is the name given to a growth strategy where the business focuses
on selling existing products into existing markets. This is done by taking part or a
competitor’s entire market share. Other ways to penetrate the market could be by
finding new customers for your product or by getting current customers to use more
of your products (Free Management, 2015). Market penetration is the simplest and
first option for growth in most of companies. They is already in the market with a
present or on hand product. Market penetration is an attempt to increase company
sales without leaving original product market strategy at the cost of rivals in the
market (Ansoff, 1957).
The organisation recuperates business performance by either mounting the quantity
of sales to it’s on hand customers or by finding fresh customers for at hand products.
This means mounting income by promoting the product, repositioning the product,

43
and so on. However, the product is not changed and not looking for any new
consumers (Eagle & Brennan, 2007). Market penetration is a situation where the
company tries to sell the product to the present loyal customers and for that they
engage in some strategies. It can be done in various ways like by changing the
pricing and also by adding minute factors like new and improved features which will
add value to the products or by changing the packaging like sachets of shampoo or
by highlighting various other uses of product (Jarratt & Stiles, 2010).
Market penetration is considered a low risk method to grow the business and is very
much about considered as a business as usual affair (Free Management, 2015).
a. Increase the market share of current products
Increase in market share can be achieved by a combination of competitive pricing
strategies, advertising, sales promotion and perhaps more resources dedicated to
personal selling. This would involve focusing on the areas of sales and marketing
responsible for managing the pricing and promotion of the product (Pearce &
Robison, 2011). This involves taking your on-hand products, and advertising more of
them to either your existing customers, or new clients who fit your target market
(Eagle & Brennan, 2007).
b. Secure dominance of growth markets
This is another approach is to identify a new demographic for a firm’s product, for
example another age group. An excellent example of such a strategy would be to
identify a change in the age distribution of a firm’s product users and to then
aggressively market the product to this age group. This was exactly what happened
in the cell phone market when it was realized that teenagers were emerging as a key
demographic (Pearce & Robison, 2011). Companies and competitors offering similar
products and services to same customers at similar price and identified company
from industry, and market point of view. Companies trying to satisfy same
customers’ needs have to build closer relationship with the customers. The essence of

44
strategy lies in creating tomorrow’s competitive advantages faster than the
competitors (Kotler & Armstrong, 2008).
To restructure a mature market by driving out competitors this would require a much
more aggressive promotional campaign, supported by a pricing strategy designed to
make the market unattractive for competitors. Many organizations find themselves
in a mature or saturated market and to achieve further market share requires a
different approach. This strategy requires an aggressive promotional campaign,
supported by a pricing strategy designed to make the market unattractive for smaller
competitors (Free Management, 2015).
With a mature market there are no more demographic sectors to exploit and the only
way to attain market share is to take it from competitors. This strategy can be seen in
the rapid growth of the supermarket chains, which have taken market share from
small high street grocers who are unable to compete on price and product range.
c. Increase Usage
Another approach to market penetration is to persuade your existing customers to use
your product or service more frequently. There are several tactics you could use to do
this, including loyalty schemes, adding value to the current product, or making
alterations to the product that encourage greater use (Pearce & Robison, 2011). The
degree of customers loyalty has tendency to be higher when perception of both
cooperate reputation and cooperate image are strongly favorable. Additional
interaction between both contributes to better explanation of customer loyalty. The
tactics of this approach all aim to ‘tie in’ customers to a firm’s product or service by
making it more difficult for them to move to another supplier.
The ability of an organization to achieve higher usage by customers can be greatly
enhanced by rapidly changing technologies that encourage users to upgrade or that
offer more reasons to use the product or service (Strauss el Ansoury, 2004).

45
A successful market penetration strategy relies on detailed knowledge of the market
and competitor activities. It relies on having successful products in a market that is
already known well. Ansoff matrix and market penetration strategy requires both
market and competitor intelligence. One key constraint of market penetration is that
does not allow anything in the drive to grow market share to compromise existing
success. The organisation needs to be aware of what has made the product a success
so far and ensure that nothing it does will undermine it. This strategy should be given
careful consideration for organizations that are not in a position to invest heavily or
are not comfortable with taking risks, as the amount of risk associated with this
strategy is relatively low (Free Management, 2015).
2.3.2 Market Development Strategy
Market development happens when an existing product is being introduces in the
different market. This strategy is one of most used strategies in order to extract the
all the advantages of that successful products. A perfect example which can be taken
here is entering into different geographical area available on national and
international level (Hussain et al., 2013).
When firms get maturity in current markets they find new markets for their ongoing
products. Therefore, this is a marketing strategy to enhance firm’s current level of
income by increasing sales in new explored products. Marketing your existing
product range in a new market is a technique used for growth by the owners (Ansoff,
1957).
Markets can be explored outside the current markets or unexplored needs and wants
(Johns & Pineb, 2002) of current market’s segments. Market development is a grand
strategy of marketing present products, often with cosmetic modification, to
customers in related marketing areas. When firms get maturity in current markets
they find new markets for their ongoing products (Luiz & Geoff, 2006). More
franchises play a key role in Fast Food development. (Kwate et al., 2009).

46
Developing a profile of a firm’s present and prospective customers improves the
ability of its managers to plan strategic operations, to anticipate changes in the size of
markets, and to reallocate resources so as to forecast shifts in demand patterns. The
traditional approach to segmenting customers is based on customer profiles
constructed from geographic, demographic, psychographic and buyer behavior
information. New geographical markets are one of the ways an SME can grow its
market share. This could involve expanding outside of current region or selling to a
new country or a new continent. The element of risk in adopting this strategy will
depend if a firm can use established sales channels in the new market (Pearce &
Robinson, 2011).
a. New Geographical Market
This means that the product remains the identical, but it is marketed to newly
targeted customers. Ideas include exporting the product, or marketing it in new
regions. Marketing your existing product range in a new market is a technique used
for growth by the owners (Ansoff, 1957). This means that the product remains the
identical, but it is marketed to newly targeted customers. Ideas include exporting the
product, or marketing it in new regions. This looks at alternatives you can amplify
sales by selling your on-hand products or services to fresh markets. Geographical
reach, Guest posting on blogs in different niches (Kwate et al., 2009); Language,
other industries and different use for the product are different growth options through
market development. Markets can be explored outside the current markets or
unexplored needs and wants (Johns & Pineb, 2002) of current market’s segments.
More franchises play a key role in Fast Food development. (Kwate et al., 2009).
Firms that open branch offices in new cities, states or countries are practicing market
development. Likewise firms are practicing market development if they switch from
advertising in trade publications to advertising in newspapers or if they add jobbers
to supplement their mail-order sales efforts (Free Management, 2015).

47
Porac, Pollock and Mishina (2004) argued that product extension and market
development notably and significantly affects firm’s growth, and more assets are
required for above purposes.
b. Leveraging on traditional Strengths
Market development allows firms to leverage some of their traditional strengths by
identifying new uses for existing products and new demographically; psycho
graphically, or geographically defined markets. Frequently, changes in media
selection, promotional appeals and distribution signal the implementation of the
strategy (Pearce & Robinson, 2011). Language, other industries and different use for
your product are different growth options through market development (Johns &
Pineb, 2002). Better after sell services, they further says for products to have
sustainable and differential advantages it must provide the customers the benefits, be
unique, sustainable, profitable, after a firm has created its differential advantages it
can enhance its competitiveness through positioning itself by diversify its products,
introduced new brands, changes existing brands, change customers believes (Luiz &
Geoff, 2006).
The business is focusing on markets and products it knows well. It is likely to have
good information on competitors and on customer needs. It is unlikely, therefore, that
this strategy will require much investment in new market research. In defining this
strategy there is need for providing the market intelligence or customer feedback that
helps to inform of the current dynamics of the market. This data will help to
determine whether a growth market is an extension of the current market or is truly a
‘new’ market. This decision is likely to be based on how the organization is going to
approach this growth market (Free Management, 2015).
Product quality should be related to customers’ needs, product quality is determined
by customer’s views about the product quality which satisfy customers requirement it
is important for SMEs when introducing new product to conducts good
environmental scan to ensure introduction of right product at the right time to exploit

48
opportunities in the market and minimize threats. The most vulnerable result of
analyzing the operating environment is the understanding of firm’s customers that
this provides (Pearce & Robinson, 2011).
c. New Distribution Channel
New distribution channels are also another way of market development. Many
companies have transformed themselves from high street retailers into Internet
retailers. This process may include outlining the internal and financial implications
of such a change together with details of how to make this approach a success
(Pearce & Robinson, 2011). The organization looks at the new costs involved with
these changes and new markets requirements and alter the marketing messages so
that they are appropriate to that country’s culture (Pearce & Robinson, 2011). This
could include the training needs of employees so that they have the skills to fulfill
Internet orders, whether they are taking incoming calls or processing online orders.
There is need to demonstrate an understanding of the operational changes the
organization would face, such as a centralized warehouse rather than local depots
(Pearce & Robinson, 2011).
d. Different Pricing Policies
Different pricing policies to create a new market segment are another approach in
market development. The important aspect of this approach is whether or not current
users can easily alter their purchases to take advantage of the new market pricing by
protecting existing market whilst developing a new one. Another way for market
development is through developing new product dimensions or packaging. The
organization may simply repackage their product so that it can open up a whole new
market. For example, a company that sold industrial cleaning products in 20-liter
containers could break into the domestic market by repackaging in smaller quantities
and developing a suitable brand image (Pearce & Robinson, 2011).
Market development strategy involves a greater degree of uncertainty, risk, and
financial commitment. One of the biggest dangers of this strategy is the risk of
49
alienating your current customers. One way around this problem is to sell a cheaper
product under a different sub-brand (Pearce & Robinson, 2011). Porac et al. (2004)
argued that product extension and market development notably and significantly
affects firm’s growth, and more assets are required for above purposes. More
franchises play a key role in Fast Food development (Luiz & Geoff, 2006).
2.3.3 Product Development Strategy
Product development involves the substantial modification of existing products that
can be marketed to current customers through established channels. Product
development strategy often is adopted either to prolong the life cycle of current
products or take advantage of a favorite reputation or brand name (Pearce &
Robinson, 2011).
Making an effort to deal with the design, conception, and promotion of new products
is a large playing field of product development or new-product development (NPD).
NPD discipline pays attention on developing organized ways of guiding all the
processes concerned with having a new item for consumption to market (Ansoff,
1957).
The complete process of bringing new product to the market, there are two parallel
paths involved in new product development process one path involves idea
generation, product design and detail engineering the other path involves market
research and market analysis (Koen et al., 2007). Gima et al. (2001) concluded that
product innovation strategy and performance of new technology are closely
correlated. Environmental affects these growth strategies (Gima et al., 2001). Data
for and assessing the implications of change can be obtained through research and
development to investigate and assess the use of new technologies, processes, and
materials that would be needed to pursue this strategy (Pearce & Robinson, 2011).
Good product development strategy ensures that new products features, modification
of products is sufficiently done when products reaches maturity stage in the product
life cycle (Kotler & Armstrong, 2008). The organization may find the lifespan of its

50
products are longer, but few can ignore the necessity of continuous R&D. Assessing
customer needs which is something that can be done by the marketing department in
the form of customer questionnaires and user groups. However, customer needs can
also be become apparent to people who are in customer-facing roles, as they often
are the first to hear about problems or concerns with the product or service.
Customer-facing gives an organization the opportunity to gather data that may
initially appear negative but which can offer an organization the opportunity to meet
customers’ needs more fully (Pearce & Robinson, 2011).
a. New product Associated with Existing Customers
New product to be marketed to existing customers, increases growth vector of the
firm where there is a decline to existing products in current market segments. We can
develop new products or offerings to replace existing ones to boost market share in
comparison to rival firms (Ansoff, 1957). While breakthrough products are new to
the company and also new to the world have greater performance and highly
improved, platform products establish a basic architecture for next generation
product (Pearce & Robinson, 2011).
Within the fastmoving consumer goods (FMCGs) market the majority of product
development follows the first approach of creating new products that are easily and
closely associated with the existing product. These new products usually have strong
brand awareness within the market and use this as their main vehicle to gain
visibility in this highly competitive market (Pearce & Robinson, 2011). To solve
customers’ problems (Aarnio & Hamalainen, 2008), firms have to give those
solutions and for this you need to be awared of their underlying needs (Davies &
Smith, 2004), wants and demands of customers, which will consequently give you an
opportunity to develop new solutions (Johns & Pineb, 2002) for existing customers
(Mishina et al., 2004).
b. New Products Matching Current Customers Purchasing Habits

51
In product development a company like McDonald’s introduce different variety of
cuisine from time to time in order to retain its existing customers and many of the
items are pushing the concept of health and fitness for health conscious people. For
example, McDonald had introduced salads which are not something for which it is
known for. However, there was a lot of pressure from the system and also the
consumer behaviour changing towards health and fitness, the company had to take
the decision in order to develop their product (Jarratt & Stiles, 2010). The success of
this strategy is dependent on new product development; brand identification;
innovation in marketing techniques and methods; and advertising (Marques, Lisboa,
Zimmerer & Yasin, 2000). The new product matches current customers’ purchasing
habits requires an organization to have a thorough knowledge of the purchasing
habits of your existing customers Using this expertise an organisation would then
develop products in such a way that they match these habits. This may include
exploit the organization’s or brand’s image and reputation to achieve this by
promoting and mirroring existing brand image and its purchasing habits onto the new
product (Pearce & Robinson, 2011).
c. New Product Re-invents or Refreshes the Existing Product
Where a new product reinvents or refreshes the existing product this revolves around
brand extension which is to continuously offer a refreshed or revamped product. This
new product must convert your competitor’s customers rather than simply
cannibalizing your own sales (Pearce & Robinson, 2011). An organization should
avoid diverting existing sales to the new product as this will simply maintain
revenues rather than increase market share. Razors, washing detergent, and cars are
all examples of products that are continually ‘refreshed’ in this way, especially to
stay distinct from the competition and gain market share (Pearce & Robinson, 2011).
Product development, especially brand extension, is a popular strategy because it is
more easily accomplished within the organization than creating totally new products
(Free Management, 2015). The idea is to attract satisfied customers to new products
as a result of positive experience with the firm’s initial offering. This strategy is

52
based on the penetration of existing markets by incorporating product modifications
into existing items or by developing new products with a clear connection to the
existing product line (Pearce & Robinson, 2011). Common sense would suggest that
for brand extension to be successful there should be some logical association
between the original product and the new one, but there have been many exceptions
to this. It is extremely difficult to predict what will work and what will not, and even
with the benefit of hindsight it is sometimes hard to see why some attempts at brand
extension succeed whilst others fail. Whatever course of action is decided upon it
must not create confusion amongst your customers. It must also avoid having a
detrimental effect on current market share (Free Management, 2015).
Understanding what a customer’s real needs are and how these can be interpreted in
product development is essential to success when using this strategy. Brand
extension is a common method of launching a new product by using an existing
brand name on a new product in a different category. A company using brand
extension hopes to leverage its existing customer base and brand loyalty. However,
this is a high-risk strategy as success is impossible to predict and if a brand extension
is unsuccessful, it can harm the parent brand (Free Management, 2015). According to
Porac et al. (2004), there is a significant relationship between new product
development and firm’s growth.
Cheap, tasty, trend setting, quick, convenient, comfortable, and healthy Fast Food
eatables enhance growth plus people compensate for quality too. Incremental
products are considered to be cost reduction, improvement to existing products line
addition to existing platforms and repositioning of existing products introduced into
the market (Pearce & Robinson, 2011).
Each of these product development approaches involves investment and an element
of risk. One key aspect of this strategy is that firms are likely to have to develop new
skills and specializations within team or department to meet these new requirements
(Pearce & Robinson, 2011). These new skills, especially in the initial stages, could
be met by using outside skills and resources to control the cost and risk of such a

53
venture. Many organizations outsource this aspect of product development and
simply add their name to the packaging (Free Management, 2015).
2.3.4 Diversification Strategy
Diversification is the name given to the growth strategy where a business markets
new products in new markets. This is an inherently more risk strategy because the
business is moving into markets in which it has little or no experience. For a business
to adopt a diversification strategy, therefore, it must have a clear idea about what it
expects to gain from the strategy and an honest assessment of the risks. However, for
the right balance between risk and reward, a marketing strategy of diversification can
be highly rewarding (Free Management, 2015). Diversification includes brand
extensions or new brands and, in sometimes product modification can create a new
market by introducing new uses for the product. However, it is the final option to
pursue, if following the preceding strategies of market penetration, product
development and market development does not produce good results, and original
objectives do not meet (Ansoff, 1957).
Diversification can occur at two levels: either at the business unit level or at an
organizational level. When it happens at the business unit level, you will most likely
see your organization expanding into a new segment of its current market. At the
organizational level, this most likely find involves integrating a new organization
into the existing one; Diversification can be further segmented into: horizontal
diversification: new product, related market; vertical diversification: move into firms'
existing suppliers' or customers' business (Pearce & Robinson, 2011).
a.New Product in New Market
Diversification is something when a totally new product is introduced by the
company in a completely new market and this is termed as diversification (Hussain et
al., 2013). Diversification includes brand extensions or new brands and, in
sometimes product modification can create a new market by introducing new uses
for the product (Ansoff, 1957). This is possibly the toughest one to get things right. It

54
involves touching into a totally diverse line of business, selling different new
products to a different new market. The extent of boost in a diversification results in
enhanced effectiveness, depends significantly on, the asset utilization (Lichtenthaler,
2005) by the firm in comparison to single segment firms and also on the type of
industries, whether related or unrelated with the present activities (Martin & Sayrak,
2003).
An organization that introduces new products into new markets has chosen a strategy
of diversification. When companies have no previous industry nor market experience
this strategy is called unrelated diversification. Related diversification describes how
companies stay in a market with which they have some familiarity. Brand new
products may also be created in an attempt to leverage the company's brand name.
For an organization to adopt such a strategy it must have a clear idea of what it
expects to gain in terms of its growth. It also needs to make an honest assessment of
the risks involved (Free Management, 2015). The product diversification strategy
involves creating a new customer base product which expands the market potential
of the original product, and that is why it is quite different from market development
(Free Management, 2015). Conglomerate diversification is when an organization
sells an entirely new product in an entirely new market (Pearce & Robinson, 2011).
Growth may be related to new markets, especially in the case of technology firms,
with reference to diversification. They are also of the opinion that growth may occur
alternatively as an integration of part of the value chain, a sort of vertical growth, or
when a firm introduces itself within a market not related to the technology in which it
works, which would be a non-related diversification. Another type of growth may be
related to the combination of market-product by entrance into the market (Davidsson
et al., 2010).
b. Acquisition of Suppliers Business
At the organizational level, this most likely find involves integrating a new
organization into the existing one. As part of vertical diversification an organization

55
moves into firms' existing suppliers' business (Pearce & Robinson, 2011). They are
also of the opinion that growth may occur alternatively as an integration of part of
the value chain, a sort of vertical growth (Davidsson et al., 2010).
c. Acquisition of Customers Business
As part of vertical diversification an organization moves into firms' existing
customers' business; (Pearce & Robinson, 2011). They are also of the opinion that
growth may occur alternatively as an integration of part of the value chain, a sort of
vertical growth (Davidsson et al., 2010).
Diversification strategy is the highest risk strategy that markets new products to new
markets and requires acquiring experience in both sectors. For a business to adopt a
diversification strategy, therefore, it must have a clear idea about what it expects to
gain from the strategy and an honest assessment of the risks (Free Management,
2015). However, for the right balance between risk and reward, a marketing strategy
of diversification can be highly rewarding (Free Management, 2015). The big
advantage of diversification is that while each move is risky, if it is successful it
reduces the overall risk of the business to factors outside of the control of the
business like the wider economic environment, climate change, etc. It may also help
the business to move away from industries that are unattractive because they are
super-competitive or in long term decline to fast growing, new markets (Free
Management, 2015).
Therefore, it is argued that diversification strategy can enhance firm’s growth as last
strategy where market penetration, market development and new product
development cannot achieve desired objective (Ansoff, 1957). For an organization
defining or implementing a diversification strategy arouses discomfort or risk that
occurs when working outside existing knowledge base (Pearce & Robinson, 2011).
Lichtenthaler (2005) also posits that growing through diversification strategy is the
most dangerous of all the strategic choices as it relates to entering into new unknown

56
markets. It calls for a real-time going away from the at hand product line and present
market configuration (Lichtenthaler, 2005).
2.3.5 Small and Medium Enterprises Growth
Growth is regarded as the second most important goal of a firm, the most important
being firm survival. Aversion to growth has been said to the principal reason why
most SMEs stagnate and decline (Clark et al., 2001). Previous research reveals that
firm growth is a multidimensional phenomenon, there is substantial heterogeneity in
a number of factors associated with firm growth and related research (Delmar et al.,
2003). O’Shannassy (2009), however, simply categorized the organization
performance in the strategy literature into two measures, namely; strategic (for
example sales growth, market share, customer satisfaction, quality) and financial
objectives (for example return on asset, return on equity, return on sales).
The commonly used measures of firm growth: (employment growth, sales growth,
profit, return on equity [ROE], return on assets [ROA]) and entrepreneurs’ perceived
growth relative to their competitors in terms of increase in company value (Leona et
al., 2010).Growth in market share is correlated with profitability; other important
forms of growth do exist. Growth in the number of markets served, in the variety of
products offered, and in the technologies that are being used to provide goods or
services frequently lead to improvements in a firm’s competitive ability. Growth
means change, and proactive change is essential in a dynamic environment (Kiraka et
al, 2013).
A business or entrepreneurial venture is successful if it is growing. Growth has
various connotations: It can be defined in terms of revenue generation, value
addition, and expansion in terms of volume of the business. It can also be measured
in the form of qualitative features like market position, quality of product, and
goodwill of the customers (Kruger, 2004). Business growth is a vital indicator of a
flourishing enterprise. There are many factors like characteristics of the entrepreneur,
access to resources like finance, and manpower which affect the growth of the

57
enterprise and differentiate it from a non-growing enterprise (Morone & Testa,
2008). Gilbert et al. (2006) highlight that growth is a function of the decisions an
entrepreneur makes, like how to grow internally or externally and where to grow in
domestic market or international market.
a. Growth on Business Worth
Mateev and Anastasov (2010) argue that an enterprise's growth is related to size as
well as other specific characteristics like financial structure and productivity. They
further observe that the total assets have a direct impact on the sales revenue (Mateev
& Anastasov, 2010). Growth is indicated by the increase of revenues over time
employing more workers, opening new branches in different geographical locations
and increase in the variety of activities that the enterprises engage in (ILO, 2014).
Measures of growth of enterprises variable include: employees, turnover, net assets
and size (Njeru, 2013). O’Shannassy (2009), categorized the organization
performance in the strategy literature into financial objectives for example return on
asset, return on equity, etc.
However, new models use other parameters, such as patents, absolute growth of the
number of employees; sales to new clients; sales in new geographic markets; profit
variation; profit on assets and increase in the firm´s worth (Achtenhagen et al.,
2010). According to Mbiti et al. (2015), growth means increase in sales turnover,
increase in profitability levels, increase in number of employees, production lines,
services and total capitalization (Mbiti et al., 2015).
b. Growth on Turnover
Growth is indicated by the increase of revenues over time employing more workers,
opening new branches in different geographical locations and increase in the variety
of activities that the enterprises engage in (ILO, 2014). Further indicators if growth
includes sale of products in markets that were not originally targeted (KIPPRA,
2014). According to Njeru et al. (2013) in their study, growth of enterprises was
measured by annual employee increase, degree of satisfaction on levels of turnover

58
and degree of satisfaction on innovation types. Measures of growth of enterprises
variable include: employees, turnover, net assets and size (Njeru et al., 2013).
The analysis of growth consequence factors underscore the fact that there is no
agreement in measuring growth. The traditionally main measurements are the
number of employees and turnover (Achtenhagen et al., 2010). Growth has been
measured on the basis of an impressive number of variables, the two indicators most
widely used by literature being employment and sales (Kirchoff, 1991). However,
new models use other parameters, such as patents, absolute growth of the number of
employees; sales to new clients; sales in new geographic markets; profit variation;
profit on assets and increase in the firm´s worth (Achtenhagen et al., 2010).
According to Mbiti et al. (2015), growth means increase in sales turnover, increase in
profitability levels, increase in number of employees, production lines, services and
total capitalization (Mbiti et al., 2015). O’Shannassy (2009), simply categorized the
organization performance in the strategy literature into strategic (for example sales
growth, market share, customer satisfaction, quality). Sales do not automatically
imply profit increase due to possible variations in costs. Growth may be associated to
profit if unit costs are reduced or a stronger position in the market is affirmed. In
fact, the relationship between growth and profit is not conclusive (Davidsson et al.,
2010; Davidsson et al., 2009). Mateev and Anastasov (2010) argue that an
enterprise's growth is related to size as well as other specific characteristics like
financial structure and productivity. They further observe that the total assets have a
direct impact on the sales revenue.
c. Growth on Number of Employees
Growth is indicated by the increase of revenues over time employing more workers,
opening new branches in different geographical locations and increase in the variety
of activities that the enterprises engage in (ILO, 2014). Mateev and Anastasov (2010)
argue that an enterprise's growth is related to size as well as other specific
characteristics like financial structure and productivity. The number of employees,

59
investment in research and development, and other intangible assets have not much
influence on the enterprise's growth prospects
Growth has been measured on the basis of an impressive number of variables, the
two indicators most widely used by literature being employment and sales (Kirchoff,
1991). Measures of growth of enterprises variable include: employees, turnover, net
assets and size (Mbiti et al., 2015). However, new models use other parameters,
such as patents, absolute growth of the number of employees (Achtenhagen et al.,
2010).
According to Mbiti et al. (2015), growth means increase in sales turnover, increase in
profitability levels, increase in number of employees, production lines, services and
total capitalization (Mbiti et al., 2015). The traditionally main measurements are the
number of employees (Achtenhagen et al., 2010). Growth of enterprises in their
study was operationalized by annual employee increase (Njeru et al., 2013).
Growth may affect the size of the enterprise if it is followed by good performance.
Growth may be a measure of performance, albeit not inevitably of success, since
growth does not necessarily result in profit. The analysis of growth consequence
factors underscore the fact that there is no agreement in measuring growth (Mckelvie
& Wiklund, 2010). Achtenhagen et al. (2010) report that the use of different growth
measurements may provide different non-comparable results. One critical procedure
employs variation between the first and last year since it does not take into
consideration that growth does not have a linear standard. Consequently, longitudinal
studies are more adequate (Achtenhagen et al., 2010). However, it is not possible to
pinpoint which analysis period may actually represent the growth cross-section (two,
three, four, five or more years) due to its discontinuity (McKelvie & Wiklund, 2010).
According to Davidsson et al. (2010), the employment of a specific formula, such as
the regression analysis of a time period, may better reveal growth. However, organic
growth and growth by acquisition should be thoroughly distinguished.

60
Several measurement indications have been proposed in the literature to minimize
risks, such as the inclusion of past growth as control variable (Delmar & Wiklund,
2008), the exclusion of new enterprises (up to one year) from assessments (Stam,
2010) and the employment of measurement intervals due to non-linear growth
(Shepherd & Wiklund, 2009). The combined use of primary and secondary data is
another suggestion (Achtenhagen et al., 2010). Further, Davidsson et al. (2010)
remark that several researches use growth intentions rather than true growth. Growth
intentions are not always necessarily stable over time. For instance, “entrepreneurs´
attitudes may change radically due to events in their private life” (Davidsson et al.,
2010).
2.5 Empirical Literature
Various studies have examined growth of SMEs in Kenya. Kiraka et al. (2013)
undertook a study on the performance of the WEF. This study sought to examine the
growth and innovation in MSME in Kenya by assessing the performance of the WEF
on these dimensions. Evidence from study data indicated that women owned
enterprises benefiting from the Fund had registered growth in the overall median
gross business worth, turnover and gross profit. They also grew the number of
employees. Notwithstanding the evidence on growth among majority of women
owned enterprises, the study could not exclusively attribute the observed growth to
the WEF loans (Kiraka et al., 2013).
Evidence from the study attributed the positive growth observed in women owned
businesses to low interest rates, the three-month grace period granted to borrowers in
the CWES stream, identification of the right business for which demand exists,
innovation through the establishment of complementary services, passion for the
enterprise and provision of individual loans. Study findings also showed that
although the general indicators reflect positive growth among women owned
businesses (Kiraka et al., 2013).

61
According to this study, growth was in terms of total business worth, turnover, gross
profit and number of employees, they obscure incidences of stagnation or decline in
growth. Incidences of decline or stagnation were significant at between 15 to 30
percent across the four measures. The most common form of innovation was
observed in the change or addition of new products in the post loan period.
Innovations in terms of services, markets and sources of raw materials were,
however, less common among women owned enterprises. The study found no
evidence of significant differences in growth and innovation among enterprises
across geographical regions, borrowing stream and age groups. Overall, entrepreneur
characteristics such as age, marital status, level of education and family size were
poor determinants of growth (Kiraka et al., 2013).
Business characteristics such as location, the person who manages the businesses and
the age of the loans, were significant determinants of growth in the number of
employees. Growth in number of employees is considered a critical proxy for the
other forms of growth in terms of total business worth, turnover and gross profit.
From the findings, locating an enterprise in an urban area increased the likelihood
that the business would either stagnate on decline in its number of employees and
gross profit (Kiraka et al., 2013).
WEF was to provide accessible and affordable credit to support women start or
expand business and this was the group of entrepreneurs that was the focus of the
study undertaken by Kiraka et al. (2013). They observed that concentration of
women entrepreneurs in the low value enterprises leads to market saturation and little
room for growth. Many women entrepreneurs are located in low value markets where
there are few barriers to entry. The sectors tend to be crowded because of these low
barriers. Without innovation through new product development and access to higher
value markets, the potential for success for MSMEs in these sectors is low (Kantor,
2001).
Kiraka et al. (2012) aimed at looking how SMEs growth influence innovations. The
target population was the staff of WEF in Kenya. The study did not get the views of

62
the beneficiaries of the WEF, the target population were WEF staff. In addition, this
study did not outline how WEF influenced the growth of women owned SMEs in
Kenya. In a related issues the evidence on growth among majority of women owned
enterprises in the study could not exclusively attribute the observed growth to the
WEF loans. There were high incidences of decline or stagnation which were
significant at between 15 to 30 percent across the four measures as per the results of
the study.
Hassan and Mugambi (2013) undertook a study to investigate determinants of growth
of women micro enterprises in Garissa. They examined determinants of growth for
women micro enterprises in Garissa town and specifically investigating whether
access to credit and financial resources, entrepreneur education and training; and
social networks have influence on growth of women micro enterprises in Garissa and
depending on how the microcredit was utilized. Their paper discussed in detail three
key critical variables that may have considerable influence on growth of micro
enterprises. These variables were access to credit and financial resources,
entrepreneurial education and training and social networking. The study found out
that very many women were engaged micro enterprises to provide for their families,
the majority of whom were survivalist (Hassan & Mugambi, 2013).
There were serious challenges facing women entrepreneurs in Garissa such as low
social status, lack of access to credit and financial resources for individual
entrepreneurs, low levels of education and training and weak networking. There is
however, some support given by government and non state actors to enhance their
entrepreneurial capacities but more needs be done to realize the full. The study
concludes that financial resources, entrepreneurial skills and networking are
important ingredients in growth and expansion of women micro enterprises. To
enhance growth and expansion of their enterprises, there is need to mitigate the
challenges through creating community awareness about gender balanced
participation in business, develop inclusive and women responsive policies by
lending institutions, training women entrepreneurs on financial literacy, and
networking with stakeholders. This is the case in most parts of the country and that is
63
why the WEF was set up to assist women access finance, get relevant training as well
as market linkages to grow their business (Hassan & Mugambi, 2013).
The study concludes that financial resources, entrepreneurial skills and networking
are important ingredients in growth and expansion of women micro enterprises. To
enhance growth and expansion of their enterprises, there is need to mitigate the
challenges through creating community awareness about gender balanced
participation in business, develop inclusive and women responsive policies by
lending institutions, training women entrepreneurs on financial literacy, and
networking with stakeholders. It is important for any business to have a vision then
develop strategies for survival. Lack of strategies may lead to stagnation or death of
an organization (Hassan & Mugambi, 2013).
In the study by Hassan and Mugambi (2013) the business growth indicators were not
clearly articulated. The focus of the study on factors that influenced growth and these
were access to credit and financial resources, entrepreneur education and training;
and social networks, therefore the study did not include competitive strategies for
growth. The scope of this study was an urban area in a semi-arid region and therefore
these findings cannot be generalized to other the other parts of the country with
strong agribusiness economic activities.
Ijaza et al. (2014), in their study sought to understand the challenges women face in
utilizing microcredit accessed from WEF. The introduction of the women enterprise
fund through joint lending has greatly eased access to microcredit for the rural poor.
However, being able to access finance is not an end in itself because the success of
an enterprise. Challenges faced by WEF were challenges at two levels. The first level
was those challenges faced by the borrower and the second levels were lender
challenges. This study also found that women who had accessed this fund faced a
number of challenges which hampered enterprise growth (Ijaza et al., 2014).
The five major challenges facing petty businesses are: inadequate capital, high
competition, insecurity, poor infrastructure and loan diversion. The other finding was

64
that the other biggest challenge facing women in operating small businesses was
inadequate capital. They felt the microcredit they received was not enough for the
business venture they would have wanted to undertake which resulted in changing
the initial investment plan for other options that were totally new. The other
challenge was high competition from other businesses of the same nature. Women in
the rural areas of Hamisi tend to engage in businesses of the same nature. This
duplication leads to high competition (Ijaza et al., 2014).
The third major challenge was insecurity since most of the structures used for
business were semi permanent and therefore not secure or e operating in areas that
were not safe. Related to this was poor infrastructure in the area. Some of the roads
within Hamisi were impassable especially during the rainy season which made
transportation difficult and at times expensive. The fifth main problem was loan
diversion of microcredit from WEF in other purposes other than what it was meant to
do. Some used the money to pay school fees, pay medical bills, for domestic use
among others. Competition was cited as the major challenge by respondents (Ijaza et
al., 2014). These findings are similar to those of Hassan and Mugambi (2013), in
Garissa such as low social status, lack of access to credit and financial resources for
individual entrepreneurs, low levels of education and training and weak networking.
When asked how they dealt with it, they suggested number of strategies employed to
counter that. This includes good communication with the customers. It was indicated
by respondents that buyers tended to avoid places where they were not treated well
by the management. The other strategy was selling at a slightly cheaper price than
their counterparts. Using lower prices to compete may mean lower profits though it
may translate into selling bigger volumes. Also to counter competition some
respondents gave credit to their customers, sold goods of good quality, and offered
better services to their customers (Ijaza et al., 2014).
Women who access these funds also face challenges like small loan sizes, high
competition, insecurity, poor infrastructure, loan diversion and group dynamics. The
overall outcome of microcredit greatly depends on how it was utilized. This means

65
that the kind of business venture women get involved in will greatly determine the
outcome. Microenterprises are very often the source of innovation, they are
especially vulnerable to competition from counterparts who introduce similar
products or services making the market to be saturated with the same range of
products (Ijaza et al., 2014).
Findings by Ijaza et al., (2014) revealed that women who access these funds face
challenges as they put the money to use. Some of the approaches/strategies adopted
to counter the various challenges included good communication with the customers,
some respondents gave credit to their customers, sold goods of good quality and
offered better services to their customers. This findings concur with those of Storey
(1994) that focusing the firm’s strategy on sharing equity, identifying a particular
market niche, identifying new products, technological sophistication and devolution
of decision-making are key to growth.
This study found that women who had accessed the fund faced a number of
challenges which hampered enterprise growth. It is not clear what were the
measurement for growth in this study to be able to adduce that the challenges
hampered growth of SMEs. Though in this study, various strategies were identified
which would be useful in future studies and some have been included in this study.
Anyanga and Nyamita (2016) in their study sought to investigate growth strategies
adopted by SMEs in Kenya, focusing on artisans operating within one of the biggest
market in the country-Kibuye market. The study found that 96.5% of the enterprises
had adopted growth strategy. In order to understand the type and the extent of the
growth strategies adopted by the enterprises. The study found that most of the
enterprises adopted product development to a moderate extent through identification
of new markets for their new existing products. The study also found that most
entrepreneurs adopted product development strategy that targeted specific market
segments. Further, the study found that most entrepreneurs practiced innovation to a
great extent as a way of responding environment changes of tastes and preferences
(Anyanga & Nyamita, 2016).

66
The study concluded that enterprises had adopted growth strategy in order to sustain
internal growth. The study concluded that most enterprises are focused on product
development strategy targeting specific group of people resulting to entrepreneurs’
evolving from main co-activities into more complex business since they embarked on
product development strategy. To market penetration strategy, the study concluded
that enterprises have increased sales by selling new products in the new market so as
to attract more customers and increase their sales. The study affirmed the theory of
growth strategies by indicating through its findings that enterprises move through
distinguishable stages of growth and that each stage contains a relatively calm period
of growth that ends with a management crisis. The findings of the study
demonstration that SMEs in Kenya had realized relative growth with each stage of
growth characterized with myriad management challenges (Anyanga & Nyamita,
2016). The major growth strategy the enterprises adopted is product development
strategy, but to a moderate extent through identification of new markets for their new
existing products. The study also found that most entrepreneurs adopted product
development strategy that targeted specific market segments (Anyanga & Nyamita,
2016).
Anyanga and Nyamita (2016) sought to identify growth strategies of MSMEs , it was
not clear which theoretical framework which underpinned the study. The
independent variables used for measurement in the study had both Ansoff’s matrix
strategies and the entrepreneurship. The study did not indicate the measurement
indicators of growth for the SMEs. A further observation on the findings, states that
the study was affirming the theory of growth with distinguishable stages of growth
and that each stage contains a relatively calm period of growth that ends with a
management crisis by analysing the kind of strategies that the SMEs were using
during the study it is not clear how each growth stages of entities had been identified
in the study.
In another study by Mburu and Guyo (2015), sought to analyse the influence of the
WEF on the growth of the micro and small enterprise (MSE) sector in Kenya with a
case study of Dagoretti Constituency in Nairobi County. The general objective of the

67
study was to explore the influence of the Women Enterprise Fund on the growth of
women owned enterprises in Kenya. The study found that there is a positive
relationship between access to Women Enterprise Fund and customer base.
These findings agree with Muteru (2013) argument that WEF provides training
services like business development services and credit to the members which
business owners use to increase their number of customers by improving marketing
strategies. The study also found that access to Women Enterprise Fund and revenue
had a correlated positively. These findings concur with Mwarari (2013) argument
that an increase in funding leads to an increase in revenue in SMES. The study
further established that there is a positive relationship between access to Women
Enterprise Fund and profitability. These findings agree with Hassan and Mugambi
(2013) findings that funding leads to increase in profitability. Finally, the study
found that there is a positive relationship between access to Women Enterprise Fund
and return on shareholders, these findings agreed with Lambin (2000) argument that
an increase in funding leads to revenue and profitability increase, which
subsequently leads to an increase in return on shareholders. From these findings they
inferred that Women Enterprise Fund influences customer base most followed by
profitability, revenue and return on shareholders (Mburu & Guyo, 2015).
The study concludes that Women Enterprise Fund had a positive significant
influence on customer base of women owned SMEs. The study established that WEF
provides training services like business development services and credit to the
members, which leads to an improvement in skills through business development
services helps women to improves their marketing strategies and target more
customers. The study also concludes that Women Enterprise Fund influences volume
of sales in women owned SMEs positively and significantly. The study revealed that
Women Enterprise Fund was helping women to discover new opportunities in the
market and ways to plan the little resources to achieve more. In addition, Women
Enterprise Fund had increased the businesses’ capital of most of the women
entrepreneurs. An increase in business capital leads to an increase in sales which in
turns increases revenue. A low working capital leads to a dissatisfaction of customers

68
since their needs are not met and hence a decrease in revenue (Mburu & Guyo,
2015).
In a separate study, Chepkwony and Sang (2017) undertook to investigate on effect
of WEF on performance of MSE in Kericho County to determine the extent of access
to micro-credit as a component the WEF, and to examine the relationship between
micro-credit as a component of WEF and the performance of women owned micro-
enterprises. This study assessed three respondents’ characteristics namely; age,
marital status and education level. The results indicate that majority of the
respondents were youths and this implies that most of the women owned micro
enterprises are run by youthful people (Chepkwony & Sang, 2017). Previous studies
such as those of Coleman (2007) and Headd (2003) presuppose that older business
owners are likely to experience enterprise growth than younger business owners.
Regarding their marital status, the result show that those who were married were
almost the same number (as the unmarried. Philbrick and Fitzgerald, (2007) posit
that marriage increases the likelihood of women's involvement in business
ownership, but also holds the possibility of enhancing growth potential of their
businesses.
The results further indicate that most of the respondents had secondary education
(Chepkwony & Sang, 2017). Education is basic to effective management and success
of a business (Barringer et al., 2005). Regarding enterprise characteristics, the survey
assessed the kind of business enterprises that the respondents were engaged in,
resources invested, number of employees and the enterprise location. The results
show that majority of the enterprises were retail business which dealt with the sale of
groceries (Chepkwony & Sang, 2017).
It also emerged that majority of the businesses had invested between Kshs 1000 and
Kshs 200,000 that most of them small enterprises. Moreover, most of them had
between 1 and 10 employees and were located in urban areas of Kericho County
(Chepkwony & Sang, 2017). According to the results, most of the respondents
(97.2%) confirmed that they had access to the WEF. Of the 310 respondents who

69
reported that they had accessed WEF, 68.3% had accessed it at the start of the
business, 29.8% in the course of running it and 1.9% way after the business had
picked up. About 93% of the respondents had taken a loan of between Kshs 5,000
and Kshs 50,000 while 7% had taken a loan worth between Kshs 50,000 and Kshs
100,000 (Chepkwony & Sang, 2017). When asked to indicate the specific
requirements of the WEF credit facilities that were difficult to meet 42.3%
mentioned group formation, 10.3% stated savings, 28.8% indicated group dynamics,
16.9% felt it was pin registration, and 5% stated that it was difficult to find
guarantors. This shows that there are many women micro enterprises owners who
cannot access WEF because they do not belong to a group (Chepkwony & Sang,
2017). The findings confirm those of Stevenson and St-Onge (2005a) women
enterprises growth and development in Kenya are largely limited by financing and
the challenge is that women are very often unable to meet loan conditions,
specifically collateral requirements.
The third objective sought to determine the relationship between access to WEF and
the performance of women owned enterprises. The results indicate access to WEF
would mean an expansion of the enterprise and consequently more sales and
increased profits. The results confirms those of Hellen (2002) and peter (2001) that
inaccessibility of credit has significant effect on the performance of business
enterprises. This study concluded that WEF plays a pivotal role in improving the
performance of the women owned enterprises in Kericho County. The results
indicate strong positive correlation between access to WEF and performance of
women owned enterprises Although, most of the entrepreneurs had access to the
fund, a significant number didn’t especially those in the deep rural areas, many of
those who accessed the fund took a loan of between Kshs 5000 and Kshs 50,000.
This must have contributed to the improved satisfaction levels regarding the WEF
services in the County. Very few women entrepreneurs got information via mass
media channels; radio and television. It is also palpable that most of the
entrepreneurs were satisfied with the services of the WEF institution (Chepkwony &
Sang, 2017).
70
Machira, Njati, Thianie and Huka (2014) conducted a study to investigate factors that
hindered Tharaka women entrepreneurs from accessing women enterprise fund from
the women enterprise fund within Tharaka south District. Despite importance of
credit and financial services in business start-up and development, uptake of funds
disbursed from the women enterprise fund was generally low. In Tharaka South
District, only 44 out 312 (14%) of registered women groups had benefited contend
that the awareness level of availability of women enterprise fund was generally low
in Tharaka (Machira et al., 2014).
The study specifically sought to determine the effect of information sources on
access to women enterprise fund. It also sought to find out the influence of socio-
cultural factors on access to women enterprise fund and finally to determine the skills
relevant for accessing women enterprise fund. The result returned in this study was
that a large number of women entrepreneurs not being aware of women enterprise
funds was attributed to unavailability of effective programs to disseminate
information to entrepreneurs in the district. Many women in the district do not own a
radio or television or do they even access the newspapers which are mainly used by
enterprise fund to deliver information (Machira et al., 2014).
The finding agrees with Macharia and Wanjiru (1998) study of NGOs and Women
small scale entrepreneurs in the garment manufacturing sector in Nyeri and Nairobi
that found out that one of the factors that inhibit credit to women included lack of
awareness of existing credit schemes for entrepreneurs in the study area. Socio-
cultural cultural factors were indentified to influence the access of loans to women-
owned enterprises. Cultural factors such as religion, education, and women are not
being allowed to own anything as men believe that whatever the woman has belongs
to the man since he has paid dowry. Most women enterprise owners in the study area
belong the Christian religion and specifically to the catholic denomination who have
always relied on handouts and hence they do not see the need to look for funds so as
to expand their small businesses. The results were analyzed and found to influence
loan uptake of female-owned enterprises. The research also discovered that prior
negative experience with loan institutions and fear of unknown in business

71
environment impacted on the choice of entrepreneurs to take loans from women
enterprise fund in Tharaka South District. The research found out that majority of
entrepreneurs had not attended technical training in any of operational areas of their
business (Machira et al., 2014).
Most respondents noted that they lacked finances to meet the cost of available
training opportunities while others observed that time, educational level and choice
of training participants negatively affected their training aspirations. Another finding
of this study discovered that majority of businesses did not have a marketing plan.
This was attributed to laws and restrictions governing marketing, cost implications
and local customer‟s perception about marketing efforts. The research also identified
various products and services offered by women entrepreneurs in Tharaka south
district. The products were cereals, groceries, milk, motor transport, and shop
merchandise and livestock products. Most businesses were discovered to be using
one or two levels of distribution. Price was mainly determined by cost incurred in
producing the service or the product but some traders used competitor based pricing
strategy. However, the study also established that marketing training affected the
performance of enterprises (Machira et al., 2014).
The study established that majority of women-owned enterprises were not eligible
for loans because; they lacked up to date business records, engaged in risky and not
viable businesses. The study further established that some women entrepreneurs
lacked collateral or guarantors for the loan. More so it was also noted that some
women entrepreneur had poor credit history. Women who were eligible and applied
for the loan were found out to be successful. However, the uses of loan varied from
expanding the business, stating a new business to buying a piece of land and meeting
recreational expenses (Machira et al., 2014).
The information is generally accessed from the mainstream media, women group,
banks and churches. Further due to the group lending and guarantor structure of the
WEF, some women were not able to access the funds because they lacked guarantors
and group membership. Lending procedures factors were identified to influence the

72
access of loans to women-owned enterprises. Lending factors such as loan
application requirements, interest rate charged, minimal loan amounts and collaterals
were established and tested. The results were analysed and found to influence loan
uptake of female-owned enterprises. The research also discovered that interest rate
charged on enterprise fund loan does not discourage women entrepreneurs from
taking the loan. In fact it is a motivator since it is charged low and friendly compared
to other micro finance institutions (Machira et al., 2014).
The study was conducted in recognition of importance of WEF in Kenya’s economic
development and its potential to improve the livelihoods of many people due to its
targeted clientele. The study confirmed earlier findings that uptake of loan depends
on socio-cultural factors, entrepreneurial skills and sources of information in regard
to business support services. The study also revealed that entrepreneurial skills
contributed more to the accessibility of women enterprise fund followed by socio-
cultural factors and to lesser degree information source. It was also established that
as much as entrepreneurs acknowledged the role of marketing training in enhancing
business performance, not all businesses had prepared a marketing plan in order to
increase performance probably because of lack of support mechanism in regard to
cost implication and benefits (Machira et al., 2014).
In another study by Machado (2016) undertook to identify the understandings of the
phenomenon of growth of small companies presented in the literature and the
prospects of future studies. This study found several description of growth, namely,
growth is the product of an internal process in the development of an enterprise and
an increase in quality and/or expansion (Penrose, 2006); growth as a change in size
during a determined time span (Dobbs & Hamilton, 2007); a company´s growth is
essentially the result of expansion of demands for products or services (Janssen
(2009a); It first results in a growth in sales and consequently in investments in
additional production factors to adapt itself to new demands (Janssen, 2009c);
researched entrepreneurs´ ideas on growth and listed the following: increase in sales,
increase in the number of employees, increase in profit, increase in assets, increase in
the firm´s value and internal development. Internal development comprises

73
development of competences, organizational practices in efficiency and the
establishment of professional sales process (Achtenhagen et al., 2010).
Other growth definitions found in the study were; growth may be related to new
markets, especially in the case of technology firms, regarding diversification. growth
may occur alternatively as an integration of part of the value chain, a sort of vertical
growth, or when a firm introduces itself within a market not related to the technology
in which it works, which would be a non-related diversification. Another type of
growth may be related to the combination of market-product by entrance into the
market (Davidsson et al., 2010); growth as geographical expansion, increase in the
number of branches, inclusion of new markets and clients, increase in the number of
products and services, fusions and acquisitions (Brush et al., 2009).
However, the difficulty in analyzing the firm´s growth at the precise moment should
be underscored. It is easier to investigate the antecedent factors that affect growth
and the consequences of growth (Leitch et al., 2010) and more difficult to investigate
growth dynamics or the manner firms grow (Mckelvie & Wiklund, 2010). must also
develop strategies (Dobbs & Hamilton, 2007). The literature mainly insists on human
resources and market strategies. Human capital should be rightly valued and
strategies for human resources that would include financial incentives and training
for the development of personnel should be defined (Barringer et al., 2005; Dobbs &
Hamilton, 2007; Rauch & Rijskik, 2013), since the employees´ welfare has a positive
effect on growth (Antoncic & Antoncic, 2011).
Although in the case of enterprises “growth enhances survival and the benefits of
growth may last for many years” (Coad et al., 2013), it should be underscored that
growth implies in the increase of management and organizational complexity
(Davidsson et al., 2010), besides forfeiting its familial characteristics (Leitch et al.,
2010) through more impersonal relationships. In fact, no consensus exists with
regard to ways in measuring growth. The main indexes comprise variation in sales
volumes, followed by indexes in the variation in the number of employees
(Achtenhagen et al., 2010). According to the transaction costs theory, costs are the

74
result of hierarchy. Managers frequently prefer to sub-hire (Chandler et al., 2009)
and enterprises may expand sales without increasing the number of employees
(Delmar & Wiklund, 2008; Rauch & Rijskik, 2013). On the other hand, employee
rates may increase without simultaneously increasing sales.
Chandler et al. (2009) studied the simultaneous increase of sales and employees in
Swedish enterprises at three different periods and concluded that, in certain
conditions, firms tend more towards other types of hiring employees to advertise the
product or service when supervision costs are high. They reported that increase in
sales may be associated with increase in technology or equipments more than to
increase in the number of employees. On the other hand, several authors argue that
sale variations include different growth aspects, such as improvement in the
process´s efficiency (Davidsson et al., 2010). Consequently, the variation in the
number of employees may not demand increase in sales (Delmar & Wiklund, 2008),
although, according to Rauch and Rijskik (2013), employment rate is a more stable
index of growth. On the other hand, Davidsson et al. (2010) do not consider true the
premise that growth increases employment since the greatest generation of
employment rates occurs in fusions.
Besides variations in sales and in the number of employees, several other indexes
were employed to assess growth, namely, absolute growth of employees, sales for
new clients, sales for markets in new geographic areas, profit variation, profit on
assets and growth in the firm´s price. Specific sectorial indexes were also employed:
number of seats in the case of restaurants and theatres and the number of cars in the
case of taxi firms (Achtenhagen et al., 2010; Davidsson et al., 2010). Several
researchers underscore the use of multiple indicators (Davidsson et al., 2010; Dobbs
& Hamilton, 2007), although in the opinion of Janssen (2009a) variation in sales and
employee increase are distinct types of growth and may not be used together.
“Growth should not be measured by compound indexes and by mixing different
variables, such as sales or employees, since they do not assess the same
phenomenon” (Janssen, 2009c).

75
Growth may affect the size of the enterprise if it is followed by good performance.
Growth may be a measure of performance, albeit not inevitably of success, since
growth does not necessarily result in profit (Mckelvie & Wiklund, 2010). Sales do
not automatically imply profit increase due to possible variations in costs. Growth
may be associated to profit if unit costs are reduced or a stronger position in the
market is affirmed. In fact, the relationship between growth and profit is not
conclusive (Davidsson et al., 2010; Davidsson et al., 2009). Finally, measurement
complexity may be associated with the unity of analysis since enterprises change
their juridical status, frequently establish new firms instead of growing and other
change their activities (Davidsson et al., 2010; Mckelvie & Wiklund, 2010).
It should be underscored that methods of growth measurements may provide
different results due to the indexes employed. The analysis of publications revealed
how the growth phenomenon has been dealt with through its antecedents and
consequences. The characteristics of the former may contribute towards growth and
may comprise schooling level and experience (within the sector, with other
enterprises, previous successful experiences); position in personal carrier; insertion
within social and other networks; age; fear of failure; personal aims and internal
locus of control; growth aspirations and previous growth aspirations; motivations,
expectations and growth intentions; equilibrium between work and family (Machado,
2016).
Further, the firm´s characteristics or activities may also induce growth, such as size
and age of the enterprise; choice of site; learning and experience; mission and
commitment with growth; innovation and development in products and services;
hiring of consulters and experts; development of management competences;
strategies in human resources and marketing strategies; networks and joint ventures
with suppliers,; exports and internationalization; type of business (franchising);
fusions, acquisitions, joint ventures and strategic alliances. Moreover, several setting
characteristics also revealed a positive influence on the growth of small enterprises,
such as supply and demand conditions; dynamics of the sector and entrance
impairments; investors and venture capital; universities and mechanisms for the

76
transference of technology; availability and facility of access to human resources and
prime matter; importance of stakeholders and family ties; networks, alliances and
enterprise networks, public policies and national and local programs subsidizing the
firms (Machado, 2016).
2.6 Research Gaps
Despite SMEs significance, past statistics indicate that three out of five businesses
fail within the first few months of operation (KNBS, 2007). Muruingi (2012), SMEs
play an important role in the Kenyan economy such as creating jobs however they
face serious challenges such as lack of finance, discrimination, problems with the
city council, multiple duties, poor access to justice, lack of education, among others
recommends that women in entrepreneurs need to be accepted and supported
financially, legally and more capacity building should be made available.
According to Kiraka et al. (2013), business characteristics such location, person
managing the business and the age of the loans were significant determinants of
growth in the number of employees. Ijaza et al. (2014) in their study found that
financial resources, entrepreneurial skills and networking are important ingredients
in growth and expansion of women micro enterprises. According to Siwadi and
Mhangami (2011), the overall outcome of microcredit greatly depends on how it was
utilized. This means that the kind of business venture women get involved in will
greatly determine the outcome (Siwadi & Mhangami, 2011).
Whilst microenterprises are very often the source of innovation, they are especially
vulnerable to competition from counterparts who introduce similar products or
services making the market to be saturated with the same range of products (Ijaza et
al, 2014). Lack of planning, improper financing and poor management have been
posited as the main causes of failure of small enterprises (Longenecker, et al., 2006).
From the study by Anyanga and Nyamita (2016), it was clear that most enterprises
had adopted the growth strategies. Also the study found that growth strategies had a

77
relationship with marketing and aggressive promotion and that most enterprises
adopted this.
Notably the study of Kiveu and Ofafa (2014) imply existence of a growing concern
about persistent stagnation and decline in SME growth in Kenya. If this remains
unaddressed it will have an obvious negative bearing on the country’s employment
creation. A survey carried out by CDF (Kisumu) found that three out of five failed
within first few months of operations and this was connected to failure of
entrepreneurs to adopt growth strategies. According to a study by Bowen et al.
(2009), on challenges affecting small and medium sized manufacturing enterprises in
Kenya did not give sufficient insight into strategies that could spur growth and
competitiveness. Atieno (2001), studied SMEs growth but with a bias on “credit
access” as a catalyst for the survival of the juakali sector in Kenya, while Kipyegon,
(2009) did a survey on positioning strategies adopted by firms in Kenya. Basing on
these it’s clear that the area of the growth strategies have largely remained
undeveloped hence the significance of the findings on the same.
Further, Muteru (2013) did a study on the effect of microfinance institutions on
growth of women owned enterprises. Although, the dependent variable was the
growth of women owned enterprises, the study was focusing on all microfinance
institutions. However, microfinance institutions operate differently from WEF. In
addition, the study only focused on Kikuyu township and hence its findings cannot
be generalized to Dagoretti constituency. This is because the two areas have different
economic and demographic characteristics.
Kombo, Onyango and Mukhebi (2014) did a study to establish the role of women
enterprise fund in entrepreneurship development. The dependent variable in this
study was entrepreneurship development which is different from growth of SMEs.
Further, this study was limited to Bondo District and hence its findings cannot be
limited to Kasipul and Kabondo Kasipul constituencies. This is because Bondo
District is in rural areas but with a weak economic background and Dagoretti
78
Constituency is in the rural area with cash crops and some production factories and
hence they have different characteristics.
In their study Hassan and Mugambi (2013) focused at establishing determinants of
growth for women owned and operated micro enterprises in Garissa County. This
study did not seek to establish the role of WEF in the growth for women owned and
operated micro enterprises. In addition, the study was limited to Garissa County and
hence its findings cannot be generalized to Kasipul and Kasipul Kabondo
Constituencies.
Lastly, Tubey (2012) did a study to establish the influence of socio-economic
characteristics of women entrepreneurs on the performance of their micro enterprises
in Eldoret Municipality in Uasin-Gishu County. The independent variables in this
study were socio-economic characteristics of women entrepreneurs and the
dependent variable was the performance of their micro enterprises. These variables
are different from the variables of the current study. In addition, the study was
limited to Eldoret Municipality in Uasin-Gishu County which is a different study
area from the current study area.
There are numerous literature on WEF and growth of SMEs both globally and
locally. However most of these studies were conducted as case studies and hence
their findings cannot be generalized to all SMEs in Kenya. In addition, these studies
had different aims and objectives and focused on different target populations. For
instance, Kiraka et al. (2012) aimed at looking how SMEs growth influence
innovations. The target population was the staff of Women Enterprise Fund in
Kenya. The study did not get the views of the beneficiaries of the WEF, women. In
addition, this study did not outline how WEF influences the growth of women owned
SMEs in Kenya. On the other hand, Machira et al. (2014) had the dependent variable
as the accessibility of Women Enterprise Fund among small and micro enterprise
owners. This study was limited to accessibility of WEF and hence it does not show
how WEF influences SMEs growth. In addition, the study was limited to Tharaka
south district and hence its findings cannot be generalized to other parts of Kenya

79
including Kasipul and Kabondo Kasipul Constituencies. The independent variables
in this study were socio-cultural factors, entrepreneurial skills and sources of
information. The study therefore did not look at how market penetration, market
development, product development and Diversification strategies.
Various studies have previously been done regarding growth of WEF funded SME’s
but none has specifically investigated product marketing linkage using the Ansoff
Matrix. No research has investigated competitive strategies for growth of WEF
funded enterprises in Kasipul and Kabondo Kasipul Contituencies. This study
therefore investigates competitive strategies for growth of WEF funded enterprises in
Kasipul and Kabondo Kasipul Constituencies.
2.7 Summary
Growth in market share is correlated with profitability; other important forms of
growth do exist. Growth in the number of markets served, in the variety of products
offered, and in the technologies that are being used to provide goods or services
frequently lead to improvements in a firm’s competitive ability. It has been observed
that concentration of women entrepreneurs in the low value enterprises leads to
market saturation and little room for growth. Many women entrepreneurs are located
in low value markets where there are few barriers to entry. The sectors tend to be
crowded because of these low entry barriers (Kiraka et al., 2013). Women owned
businesses are known for their low start up and working capital it has been noted that
under normal circumstances women’s enterprises have low growth rate and limited
potential partially due to the type of business activities they run Ijaza et al. (2014).
There are many studies that have conducted on Women Enterprise Fund and growth
of SMEs. Locally, Kiraka et al. (2012) conducted a study on micro, small and
medium enterprise growth and innovations by focusing on the performance of the
Women Enterprise Fund in Kenya; Machira et al., (2014) did a study on accessibility
of Women Enterprise Fund among small and micro enterprise owners in Tharaka
South District, Kenya; Muteru (2013) did a study on the effect of microfinance

80
institutions on growth of women owned enterprises: A case study of Kenya Women
Finance Trust in Kikuyu Township and Kombo, Onyango and Mukhebi (2014) did a
study on the role of women enterprise fund in entrepreneurship development in
Bondo District, Kenya. However, the studies did not show competitive strategies
influence on growth of women owned enterprises funded by WEF in Kenya.
Growth in the number of markets served, in the variety of products offered, and in
the technologies that are being used to provide goods or services frequently lead to
improvements in a firm’s competitive ability. Growth means change, and proactive
change is essential in a dynamic environment. One particular implication of the
process of growth is that, once initiated, the entrepreneur will have to adapt and
change (Kiraka et al., 2013).
It has been suggested that certain strategic alternatives are typically more appropriate
for a small firm, namely those that avoid direct competition with larger firms and that
involve the development of close customer relationships and product adaptation
(Perry, 1987). In the specific language of Ansoff’s Matrix, for SMEs the most
appropriate growth strategies are therefore market penetration, product development
and market development (Perry, 1987). Growth in market share is correlated with
profitability; other important forms of growth do exist (Kiraka et al., 2013).
The overriding message in the reviewed studies is that access to microcredit is a
crucial factor for the survival and performance of SMEs. Although a number of
studies have their setting in Kenya, the relationship between microcredit, strategies
and performance of women-owned SMEs has not attracted as much empirical
investigation, notwithstanding the fact that WEF has been financing women –owned
SMEs in the country for close to seven year. This study attempts to create this
linkage by assessing how selected WEF loan beneficiaries choice of strategies affects
growth of SMEs.

81
CHAPTER THREE
RESEARCH METHODOLOGY
3.1 Introduction
This chapter provides a description of the research methodology used in this study. It
discusses the research philosophy, design, population of the study, sample and
sampling techniques, data collection and analysis methods used as well as data
presentation methods employed in the study.
3.2 Research Philosophy
Research Philosophy relates to the development and foundation of knowledge upon
which assumptions and predispositions of a study are based. These assumptions
underpin the research strategy and the methods chosen to be used in the study
(Saunders, Lewis & Thorn hill, 2012). A Positivist Research Philosophy was adopted
that has the assumption that social reality is singular and objective and is not affected
by the act of investigation (Collis & Hussey, 2009). The philosophy stresses the
importance of scientific rigour in the quest for knowledge. Positivism is quantitative,
objective and scientific, using a highly structured methodology to facilitate
replication. Based on the philosophy, formulated variables, hypotheses and
operational definitions were deduced based on existing theory. Only observable
phenomenon by a researcher can lead to the production of credible data in
positivism. Data was collected about an observable reality (phenomena) growth.
Trends, regularities and causal relationships in the data were used to create
generalizations. The research strategy used in the study was generated based on
existing theories. Hypotheses were tested using data and were confirmed in whole or
part leading to further contribution to theory (Saunders et al., 2012).
In positivism, the researcher is independent (neither affects nor is affected by the
subject) of the research. This has the implication of the research being conducted in a
value freeway, where the researcher is external to the process of data collection to

82
ensure little interference with data (Collis & Hussey, 2009). Based on positivism, the
study applied a deductive approach which involved collection of data that was used
in evaluating prepositions related to existing theories. The study sought to explain
causal relationships between variables which were operationalised in a way that
enabled facts to be measured quantitatively. In order to generalise the results, a
sample of sufficient size was carefully selected (Saunders et al., 2012).
3.3 Research Design
A research design is a plan showing how the problem under investigation will be
solved. The function of a research design is to ensure that the evidence obtained
enables the study to answer the research question as unambiguously as possible. The
study was conducted using a mixed method comprising qualitative and quantitative
approaches. Such a design entails the use of quantitative and qualitative study
approaches. Namusonge (2010) observes that this method is best suited for gathering
descriptive information where the researcher wants to know about people or attitudes
concerning one or more variables through direct query. The descriptive design was
appropriate in ascertaining the effect of competitive strategies on growth of WEF
funded SMEs in Kenya.
Quantitative method was used to collect data on profiles of the enterprises,
competitive strategies implemented, indicators of firms’ growth. The qualitative
approach elicited indepth information based on personal experiences and opinions of
women entrepreneurs. As advanced by Cooper and Schnidler (2008), a quantitative
method is selected to allow for the generalization of the findings among women-
owned SMEs and provide a framework for conducting an extensive survey. The
quantitative approach obtained numerical and quantifiable data.
This study adopted a cross sectional survey research design. According to Cooper
and Schindler (2010), cross sectional survey research designs are used to study where
exposures and outcomes are observed or measured simultaneously in a population. In
this design, a researcher examines the association between the exposure and the

83
outcome, but cannot infer cause and effect. Cross sectional survey strategy was used
to collect data to gain a snapshot into the effect of competitive strategies on growth
of WEF Funded SMEs at a particular period (Hair et al., 2010). The survey strategy
was deemed appropriate in view of the fact that it allows the collection of large
amounts of data from a sizeable population in an economic way while giving the
researcher more control.
3.4 Population
The primary target population for the study was women entrepreneurs who had
accessed the WEF loan through the C-WES. The study was conducted in one
purposively selected county out of the 47 counties in Kenya. The target county was
Homa Bay County. This county was selected on the basis of the expected variations
in the socio and economic profiles of the entrepreneurs. Within the County, two (2)
constituencies were purposively selected based on the estimated populations to
include areas with lower, medium and higher population densities, and a large
number of WEF beneficiaries.
3.6 Sample and Sampling Technique
Requests were made to WEF volunteers in the CWES offices to provide lists of the
women entrepreneurs, their contact details and business location. The lists formed
the sampling frame. While the county and constituencies had been purposively
selected, entrepreneurs who had benefitted from the WEF loans who are the key
decision makers in their SMEs were randomly selected. According to loan records of
C-WES offices in two constituencies, 3,768 SMEs had been funded by WEF as at
30th September 2015. Kasipul had 165 groups funded with an average of 1,992
women entrepreneurs. Kabondo Kasipul had 148 groups funded with an average
number of 1,776 women entrepreneurs. A sampling frame is defined by Cooper and
Schindler (2010) as the list of elements from which the sample is actually drawn.
The sample was selected from two defined clusters based on geographical location.
Cluster one comprised of WEF funded SMEs in Kasipul constituency and Cluster
84
two comprised on WEF funded SMEs in Kabondo Kasipul constituency. Each of the
constituency was allocated a fixed quota of 169 for Kasipul and 135 for Kabondo
Kasipul. Respondents were then randomly selected from a constituency list. Care
was taken in the sampling to ensure a good representation of both clusters of SMEs,
at the ratio corresponding to the target population of the enterprises. Sampling is the
process of collecting information about a total population by investigating only a part
of it (Kothari, 2009). The study employed a multistage sampling design that
combined cluster and stratified random sampling. Multi-stage sampling procedure is
a sampling technique that is carried out in stages and usually involves more than one
sampling method (Kothari, 2009). This sampling design was considered appropriate
due to the fact that SMEs in this study were located in two constituencies based on
their location. Stratified Random sampling was further applied in the clusters to
reduce biasness in the sample collected. In the first stage of sampling, two clusters of
SMEs were selected; Kasipul and Kabondo Kasipul constituencies.
In the second stage of sampling, stratified random sampling was used to select SMEs
from the two clusters. Stratification was necessary because SMEs are heterogeneous
in terms of the activities they are involved in. This study considered stratification
based on business activities and enterprises where they were classified as agriculture,
repairs or service and retail. Enterprises were randomly selected from the strata to
eliminate bias.
A sample refers to a selection of some elements in a population, from which
conclusion may be drawn about the whole population. The sample was expected to
represent well the characteristics of the population and also of each category of
businesses. Stratified random sampling method was used, where the population will
embrace a number of distinct categories. The frame was organized by these
categories into separate “strata” in this case were the two constituencies. Each
stratum was then sampled as an independent sub-population, out of which individual
elements were randomly selected. A stratified sampling approach is most effective
when three conditions are met.

85
These are variability within strata are minimized, variability between strata are
maximized and the variables upon which the population is stratified are strongly
correlated with the desired dependent variable. The variables used for stratification
were the business activities, commercial, services and agriculture. The study
involved undertaking statistical analyses on the sample to enable inferences about the
population to be made on the basis of the sample. As the distribution of each of the
various population characteristics is not known, a sample size that ensured inferences
about the population characteristics was made on the basis of the sample taken.
According to Mugenda and Mugenda (1999) the sample size for a population of
10,000 or more can be computed as per the formula below:
n =pqz2
e2
Where, n = Minimum Sample Size
p = Population proportion with given characteristic
z = Standard normal deviate at the required confidence level
e = Error Margin
Mugenda and Mugenda (1999), recommend that since p and q are unknown, both are
set at 50%. At a confidence level of 95% that will be used for this study, z = 1.96 and
the sampling error of e = + 5%. Thus, sample size n becomes:
N = 50*50*(1.96/5) 2 = 384
For a population less than 10,000 the population is computed as per the formula
below:-
nf = n/(1+n/N)

86
Where, nf = desired sample size when the population is less than 10,000.
A total of 304 respondents were targeted to complete questionnaires and return.
Excluded from the analysis were those respondents who contained data from male
entrepreneurs who had benefitted from the WEF loans

87
Table 3.1: Sampling Frame
Sector Population Sample Size__
Kasipul Kabondo Kasipul Kabondo Total
Kasipul Kasipul
Retail 1,020 756 90 49 139
Agriculture 300 588 16 60 75
Repairs and Services 672 432 63 26 89
Total 1,992 1,776 169 135 304
Source: Kasipul CWES Office, 2015
The computed sample size in this study is 304 respondents. This sample size
comprised 8.1% of the target population which was sufficiently large even for
descriptive studies. The researcher distributed 350 questionnaires in order to
compensate for potential non-respondents. A total of 304 respondents were targeted.
Due to over sampling, 345 complete questionnaires were returned. Of the 345
respondents, 10 of the respondents were excluded from the analysis as they contained
data from male entrepreneurs who had benefitted from the WEF loans.
3.6 Data Collection Instruments
The research instrument will be a questionnaire. Kothari (1993) highlights that a
questionnaire gives the respondents’ adequate time to give well thought out answers.
The questions in the questionnaire are a mixture of open-ended, forced response
types and matrix type (Likert-type scales). Kothari and Pals (1993), note that
whereas the open-ended types of questions give respondents freedom of response,

88
the forced types facilitate consistency of certain data across respondents. Likert-type
questions serve to assess the extent of persuasiveness of given campaign materials.
The questionnaire is ideal for the descriptive survey, as it enabled quick collection of
similar data across a relatively dispersed population. Using a predesigned
questionnaire ensured that information sought is relevant to the objectives of the
research, is standard and focuses the research on collecting the information rather
than thinking about what information to collect.
3.7 Data Collection Procedure
Primary data collection was used in this study. Primary data is data collected in an
original research which is designed specifically to answer the research question
(Cooper & Schindler, 2010). This method of data collection was selected because
very little research has been conducted in the area of business growth strategies for
businesses which have benefited from the WEF. Therefore there was need for more
empirical data in this area to build on the body of knowledge.
In the field, survey questionnaires were administered on respondents within their
premises. Request for participation was sought through an introduction and informed
consent on the front page of the questionnaire which was read out to each
prospective respondent in a language they understand. Individual questionnaires
were administered by four research assistants in each constituency. On average, it
took each entrepreneur 45 minutes to fill a questionnaire. The researcher visited
research assistants in the field to ensure questionnaires were accurately completed.
A questionnaire consists of a number of questions printed or typed in a definite order
on a form or sets of forms (Kothari, 2009). The questionnaire was mainly structured
and respondents were guided through illustrated answers to ensure that the
respondents had a clear understanding of questions thus responding appropriately.
The respondents were requested to complete the questionnaire within two days to
ensure they had enough time. Four fully briefed research assistant, administered the
instrument to the sampled group. Data was collected between November and
December 2015.

89
3.8 Pilot Test
A pilot test of the instrument was conducted on 30 entrepreneurs in Ndhiwa
constituency, Homa Bay County. The constituency in which the pilot was conducted
was excluded from the main study. The objective of conducting a pilot test is to
detect weakness in design and instrumentation and to provide alternative data for
selection of a probability sample (Kothari, 2008). The purpose of pre-testing a tool is
to ensure that items in the tool bear the same meaning to all respondents and to
assess the average time that is required to administer the instrument, a successful
pilot study uses 1% to 10% of the actual sample size. The research instrument in this
study was pre-tested as per recommendations.
The respondents were SMEs in the population with similar characteristics to, but not
those that were used in the main study. Subjects from the actual sample were not
used in the pre-test. Procedures used in pre-testing the questionnaire were similar to
those used in the actual study. This helped in clarifying questions and in refining the
data analysis methods (Mugenda & Mugenda, 1999).
3.8.1 Validity
According to Kumar, (2000) pilot test ensures validity and reliability of the
instrument. Validity is the accuracy and meaningfulness of inferences, which are
based on the research results (Mugenda, 2008). Solution for assuring validity is to
use multiple source of information, establish chain of evidence, and have key
informants review the report. To test the validity of the tools, a pilot test of the
instruments was conducted with 30 entrepreneurs in Ndhiwa constituency, Homa
Bay County. The constituency in which the pilot was conducted was excluded from
the main study.
3.8.2 Reliability
According to Kumar (2000) pilot test ensures validity and reliability of the
instrument. Reliability is the extent to which any measuring procedure yields the

90
same results on repeated trials (Mugenda, 2008). To test the reliability in this study a
pilot test of the instrument was conducted with 30 entrepreneurs in Ndhiwa
constituency, Homa Bay County. The constituency in which the pilot was conducted
was excluded from the main study.
3.9 Data Analysis and Presentation
Cooper and Schindler (2010) define data analysis techniques as statistical methods
used to analyse data so that it can be interpreted. Research analysis breaks down data
into consistent parts to obtain answers to research questions or test hypothesis. Data
collected was analysed using descriptive statistics. Descriptive statistics display
characteristics of the location, spread and shape of an array of data. To ensure easy
analysis, the questionnaire was coded as detailed in Annex 3, to allow for accuracy
during analysis. Coding of data involves assigning numbers or other symbols to
answers so that responses can be grouped into a limited number of classes or
categories (Cooper & Schindler, 2010).
For qualitative data, the data were coded to form categories of constructs in line with
Miles and Huberman (1994). Responses were categorized using constructs that were
consistent with the research questions such as ‘effect of market penetration strategy
on the growth of SMEs’, ‘The market penetration strategy was further categorised
into ‘increased market share’, ‘increased market dominance/drive out competitors’
and ‘increased usage of products’. Other categories included ‘market development
strategy’, ‘product development strategy’ and ‘diversification strategy’. The key
objective was to define the strategies that resulted into growth. This helped in
shaping future models and approaches as well as policy initiatives. Finally, the
findings were categorised into the four levels strategies of the conceptual framework
– the market penetration, market, development strategy, product development
strategy and diversification strategy which formed the basis of interpreting the
findings, and drawing conclusions and recommendations.

91
Quantitative data were analysed using Statistical Package for Social Sciences (SPSS)
version 20.0 package to generate frequency distributions, percentages and cross-
tabulations. Beyond the identification of the perceived growth, the study sought to
empirically establish the effects of competitive strategies on SME growth using
regression model. Results were presented in descriptive and multivariate forms.
Descriptive results show the extent of growth indicators in the post loan period.
Multivariate analysis sought to empirically establish the effects of competitive
strategies and growth among women owned enterprises. SMEs growth was defined
by three indicators namely; employee growth, total business worth and monthly
turnover. Likewise, the competitive strategies were measured using market
penetration strategy, market development strategy, product development strategy and
diversification strategy.
The explained variables of this study were quantitative while explanatory variables
were categorical or exclusively dummy in nature. Dummy variables can be used in
regression models just as easily as quantitative variables. As a matter of fact,
regression model may contain explanatory variables that are exclusively dummy or
qualitative in nature. Such models are called analysis-of-variance (ANOVA) models
(Gujarati, 2007). Therefore, the data analyses for this study was done using ANOVA
model. This was because in regression analysis the dependent variable is frequently
influenced not only by variable that can be readily quantified on some well-defined
scales, but it also by variables that are essentially qualitative in nature (Greene,
2002). Since the independent variables for this study were qualitative in nature and
the dependent variables were quantitative, therefore, ANOVA model helped to assess
the influence of the independent variables on the dependent variables more
efficiently and effectively. The general rule for ANOVA model is that if qualitative
variables have m categories, introduce only m-1 dummy variables (Greene, 2002). If
this rule is not followed, the model will fall into what might be called the dummy
variable trap. This is the situation of perfect multicollinearity. In order to avoid
multicollinearity problem in the regression model, the market penetration strategy
92
was used as a reference or base group. It was the base in the sense that comparisons
was done with that omitted category.
This study applied adjusted R-Squared to measure the proportion of the variation in
the dependent variable (Yi) explained by the independent dummy variables for the
linear regression model. The adjusted R Squared compares the descriptive power of
the regression models that include a diverse number of predictors. Every predictor
added to a model increases the R Squared and never decreases it. Thus a model with
more terms may seem to have a better fit just from the fact it has more terms, while
the adjusted R-Squared compensates for the addition of variables and only increases
if the new term enhances the model above what would be obtained by probability
and decreases when a predictor enhances the model less than what is predicted by
chance. In an overfitting condition, an incorrectly high value of R Squared, which
leads to a decreased ability to predict, is obtained. This is not the case with the
adjusted R-Squared because Adjusted R Squared, gives the percentage variation
explained by only those independent variables that in reliability affect the dependent
variable (Gujarati, 2007).
Evidence from study data indicated that women owned enterprises benefiting from
the Fund had registered growth in the overall median gross business worth, turnover
and number of employees. The use of the median as a measure of growth between
the pre-and-post loan periods eliminated the problems associated with outlier effects
on the position of the mean. In terms of proportions higher of women owned
enterprises had registered growth along the selected indicators.
3.9.1 Statistical Model
Beyond the identification of perceived effect of the competitive strategies and growth
factors, the study sought to empirically establish the effect of competitive strategies
on growth using multiple regression models for the selected indicators of growth.
SME growth was defined by three indicators namely; employee growth, total
business worth and turnover. To examine the effect of competitive strategies on

93
growth, enterprise level information was used. Independent variables were defined as
dummies. The dependent variable is represented by (Y) while competitive strategies
the independent variable (D) is represented by the four types of strategies; market
penetration, market development, product development and diversification. Gujarati
(2007) suggested that whichever category serve as the base category. Therefore, it is
a matter of choice for the reference group. Hence, the ANOVA model used for this
study was:
Yi = α1 + α2D2i +α3D3i + α4D4i + ui
Where Yi= growth
α1 = Influence of market penetration on growth
D2i= 1 if market development strategy
= 0 otherwise
D3i= 1 if product development strategy
= 0 otherwise
D4i= 1 if diversification strategy
= 0 otherwise
Zero (0) indicates the absence of an attribute and one (1) indicates the presence of
that attribute. The influence of market penetration strategy on growth is E (Yi/D1i=
0, D2i= 0, D3i= 0) = α1. That is, the intercept term α1 gives the influence of the
market penetration strategy on growth of WEF funded SMEs. However, the slope
coefficient attached to the dummy variable D (α2, α3 andα4) tell by how much the
market development, product development and the diversification strategies differ
from the market penetration strategy on the effect on growth of WEF funded SMEs.
If the t-test shows that α2, α3 and α4 are statistically significant (P ≤ 0.05); the

94
impact of the competitive strategies on growth of the business is different from
market penetration strategy. However, if the t-test is statistically insignificant at 5%
level of significance, therefore, the influence of the competitive strategies on growth
of the business is not different from market penetration strategy.
The findings were categorised into the four levels of the conceptual framework –
Competitive strategies and growth factors which forms the basis of interpreting the
findings, and drawing conclusions and recommendations. Quantitative data was
analysed using SPSS Version 20.0. Results are presented in descriptive and
multivariate forms. Descriptive results show the extent of growth indicators in the
post loan period. Multivariate analysis sought to empirically establish the effects of
competitive strategies on growth among WEF Funded SMEs.
Hypothesis tests were set up using null hypothesis and trying to reject it, on the basis
of the evidence from the sample. In this case, the null hypothesis says that there is no
relationship between the variables (i.e., that SME growth and competitive strategies
are statistically independent) and that any difference between the conditional
distributions was actually due to random sampling error. If the null hypothesis is
rejected, this will lend support to the research hypothesis that there is a real
relationship between the variables in the population from which the sample is drawn.
The computations normally make two key assumptions, that is, none of the expected
values (as computed) may be less than 1 and no more than 20% of the expected
values may be less than 5. The chosen alpha level for the analysis was 0.05 (α=0.05).
The decision rule was that if the exact probability was less than the critical alpha
level (p<α), the finding was significant and the null hypothesis was rejected. If the
exact probability was greater than the critical alpha level (p>α), the finding was not
significant and the study failed to reject the null hypothesis. Where the finding is
significant, then the probability that the relationship happened by chance is very
small and the difference is real. When the finding is not significant, then the
probability is high that the difference or relationship happened by chance.

95
3.10 Operational Definition of the Variables
Table 3.2 present the operationalization of the variables. This is done by presenting
the research objectives, the research independent variables, measurement, the
instrument of data collection and data analysis techniques.

96
Table 3.2: Operationalization of Variables
Objectives Operational Definition of Variables
Variables Indicators Measurement Data Collection Scale Data Analysis
Technique
To determine the effect
of market penetration
strategy on the growth
of SMEs funded by
WEF in Kenya
Independent Variable
market penetration
strategy
Increased Market Share
Increased Market
Dominance
Increased Usage of
Products
How does market
penetration strategy
affects growth of SMEs
funded by WEF in
Kenya?
Questionnaire Ordinal -Frequencies
-Means
-Median
-Standard deviation
-Percentages
-Regression
To examine the effect
of market development
strategy on the growth
of SMEs funded by
WEF in Kenya
Independent Variable
market development
strategy
New Geographical Market
New Distribution channel
Different Pricing Policies
How does market
development strategy on
the growth of SMEs
funded by WEF in
Kenya?
Questionnaire Ordinal -Frequencies
-Means
-Median
-Standard deviation
-Percentages
-Regression

97
To establish the effect
of product development
strategy on the growth
of SMEs funded by
WEF in Kenya
Independent Variable
product development
strategy
New product closely
associated with existing
product
New product matches
current customers’
purchasing habits
New product reinvents or
refreshes the existing
product
How does product
development strategy on
the growth of SMEs
funded by WEF in
Kenya?
Questionnaire Ordinal -Frequencies
-Means
-Median
-Standard deviation
-Percentages
-Regression
To determine the effect
of diversification
strategy on growth of
SMEs funded by WEF
in Kenya
Independent Variable
diversification strategy
New Product in new or
related market
Acquisition of suppliers’
businesses
Acquisition of customers’
businesses
How does diversification
strategy on growth of
SMEs funded by WEF in
Kenya?
Questionnaire Ordinal -Frequencies
-Means
-Median
-Standard deviation
-Percentages
-Regression
The objective of the
study was to investigate
the effect of
competitive strategies
on the growth of SMEs
funded by Women
Enterprise Fund in
Dependent Variable
growth of SMEs funded
by WEF
Business Worth
Turnover
Growth of SMES funded
by WEF
Questionnaire Ordinal -Frequencies
-Means
-Median
-Standard deviation

98
Kenya
Number of Employees
.
-Percentages
-Regression

CHAPTER FOUR
RESULTS AND DISCUSSION
4.1 Introduction
This chapter presents the results of statistical analysis along with discussion
contextualized in the light of previous studies done in the area. The study had four
research questions; to determine the effect of market penetration strategy on the
growth of WEF funded SMEs in Kenya; to investigate the effect of market
development strategy on the growth of WEF funded SMEs in Kenya; to establish the
effect of product development strategy on the growth of WEF funded SMEs in
Kenya; to explore the effect of diversification strategy on the growth of WEF funded
SMEs in Kenya.
4.2 Response Rate
After data coding and entry and as a prelude to data analysis, data was explored to
isolate any outliers and to identify and rectify any consistency errors. On the whole,
31 respondents were received above the expected sample size which had a proposed
sample of 304 SMEs. Of the 350 questionnaires distributed 345 questionnaires were
received. Of the 345 respondents, 10 of the respondents were excluded from the
analysis as they contained data from male entrepreneurs who had benefitted from the
WEF loans. Out of 345, 200 were from Kasipul and 135 were from Kabondo
Kasipul. The overall response rate was thus found to be 95.7% which is quite high
compared to the usually expected response rate of 50-75% for hand delivered
questionnaires (Saunders et al., 2009).
Figure 4.1: Response Rate
Constituency Questionnaires Questionnaires Response
Distributed Received Percentage
Kasipul 210 200 95.2%
Kabondo Kasipul 140 135 96.4%

100
Total 350 335 95.7%
4.3 Normality Test
An assessment of the normality of data is a prerequisite for many statistical analyses
such as ANOVA model analysis. This is because normality is an underlying
assumption in parametric testing, especially in ordinary least square estimates.
Normality can be tested using either graphically (visual inspection), numerically
(statistical tests) or both (Razali & Wah, 2011). However, statistical tests are better
than the visual inspection because they make objective judgment of normality. As a
result, this study used statistical tests to check normality. The normality test is
conducted using Shapiro-Wilk test which has power to detect departure from
normality due to either skewness or kurtosis or both. Its statistic ranges from zero to
one and figures higher than 0.05 indicate the data is normal (Razali & Wah, 2011).
Hence, the results in table 4.2 showed that the data is not normally distributed
because the P-value under the Shapiro-Wilk test is less than 0.05. A more detailed
analysis of the normality test can be found in appendix 7. However, Arbuckle (1997)
stated that deviation from normality may not affect the result of the analysis.
Therefore, the results of this study are hoped to be unbiased due to lack of normal
distribution of the data.
Table 4.2: Normality test
Descriptives Statistic Std. Error
Tests of Normality
Kolmogorov-Smirnova Shapiro-Wilk
Statistic Df Sig. Statistic Df Sig.
Turnover .340 335 .000 .474 335 .000
a. Lilliefors Significance Correction

101
4.4 Descriptive Results
This section discusses the results of the general information about the entrepreneur
including education level, type of business training accessed, types of businesses
being run and the main reason for getting into this business. These characteristics
appeared to have some moderating influence on the type of strategies adopted.
4.4.1 Education level
KCPE/CPE level education was the most common level of education of the
respondents (42.99%), followed by secondary level education at 26.27% and 2.67%
had tertiary education (see table 4.3 below). The rest of the respondents, 8% didn’t
complete primary school, 13% went up-to pre-school while a further 7% did not have
any formal education. These findings show that most of the respondents have low
level of education (71%) which is quite a significant proportion of the respondents.
Table 4.3: Level of Education
Enterpreneur Level of Education Frequency Percentage (%)
None 24 7.16
Pre-school 43 12.84
Some Primary 27 8.06
KCPE/CPE 144 42.99
Secondary 88 26.27
Tertiary Education 9 2.69
Total 335 100
The low level of education by women entrepreneurs in this study confirms the
findings of Hassan and Mugambi (2013) that one of the serious challenges facing
women entrepreneurs were low levels of education and training. This also agrees
with those of Ijaza et al. (2014), that most of their borrowers only have basic
education (Ijaza et al., 2014). Stevenston and St. Onge (2005) also confirm that
women owned enterprises, often unregistered and in the informal economy, have

102
little education (less than secondary level (Stevenston & St. Onge, 2005). These
findings are consistent with Kiraka et al. (2013) who affirm that a sizeable proportion
of women entrepreneurs lacked basic literacy
4.4.2 Business Training Undertaken
In this study 99.7% of the respondents had received one form of business training as
shown in figure 4.4 below. Forty nine percent of the respondents had undertaken
marketing training, 22% took other training while around 18% had undertaken book-
keeping.
Table 4.4: Business Training Undertaken
Business Training Frequency Percent
Book keeping 60 17.91
Marketing 164 48.96
Pricing 8 2.39
Sales Forecasting 1 0.30
Inventory Control 24 7.16
Other 77 22.99
None 1 0.30
Total 335 100
WEF had trained 116,372 women in loan management and business skills (WEF,
2013), this study confirms that over 99% of the respondents had received some form
of training from WEF. From this study, marketing training had been given a
significant emphasis as part of the training programmes. This knowledge is key in
helping WEF beneficiaries to be able to find markets for their products as well as be
create awareness of how to access new markets. This is in line with one of WEFs
objective of training women entrepreneurs in marketing.
Only 18% of the respondents had received training in book-keeping. Book keeping is
very important for an SME so as to be able to determine the cost of doing business,

103
sales and ultimately be able to know the profit the business is able to generate. These
findings are consistent with Kiraka et al. (2013) who affirm that a sizeable proportion
of women entrepreneurs lacked basic literacy which incapacitated them in terms of
proper record keeping.
This study confirms that little or no training has been done on WEF funded
entrepreneurs on competitive strategies for survival of small businesses. Models on
competitive advantage need to be developed and constantly reviewed to assist
enterprises strengthen their performance in terms of their behaviour towards the
competitive factors that are crucial in the successful performance of an enterprise
(Banjoko, Iwuji & Bagshaw, 2012; Dyer & Singh, 1998).
4.4.3 Type of Business
Fifty four percent of the SMEs were given WEF loans for table banking, 14.9% of
the respondents were engaged in farming while 30% were in the trading sector and
the service sector. None of the SMEs were engaged in manufacturing sector (as
shown in table 4.5). 90% of the SMEs in the commercial sector women were trading
in open market stalls.
Table 4.5: Type of Business
Type of Business Frequency Percentage
Retail 182 54.3
Agriculture 50 14.9
Repairs or services 103 30.7
Total 335 100
These findings agree with the findings of Kiraka et al. (2013) who observed that
concentration of women entrepreneurs is in the low value enterprises. This is also
confirmed by Ijaza et al. (2014) that many women entrepreneurs are located in low
value markets where there are few barriers to entry and they are especially vulnerable
to competition from counterparts who introduce similar products or services making
the market to be saturated with the same range of products. According to ILO

104
(2008), most women entrepreneurs are to be found in the smallest informal
enterprises. This is also confirmed in this study that most of the respondents are in
the small informal sectors as per Table 4.5.
4.4.4 Reason for Getting into Business
Sixty percent of the respondents got into business due to the need for additional
income while 20% saw a business opportunity. Twenty percent of the women had
various reasons for getting into business as shown in figure 4.6 below.
Table 4.6: Reason for Getting into Business
Reason for Doing Business Frequency Percentage Cumulative
Percent
Lack of other Income 11 3.3 3.3
Need of Additional Income 201 60.0 63.3
Availability of Loan 3 .9 64.2
Influence of Friends/Relatives 27 8.1 72.2
Saw an Opportunity 67 20.0 92.2
Other 26 7.8 100.0
Total 335 100.0
The findings in this study shows that majority of the respondents got into business
due to the need for additional income agreeing with the findings of Stevenson and St.
Onge (2005) that members of the current MSE sector were more likely to have
started an enterprise “out of necessity” – there were no employment alternatives –
rather than because of the “opportunity” they perceived in doing so. According to
Muruingi (2012), where the rural women appear not to be driven by profits but
rather, by the need to provide for their families. Hassan and Mugambi (2013) posit
that other family issues also motivated many women were engaged in micro
enterprises to provide for their families, the majority of whom were survivalist.
Another key motivating force for women to become business owners has been
identified as interest in helping others (Muruingi, 2012).
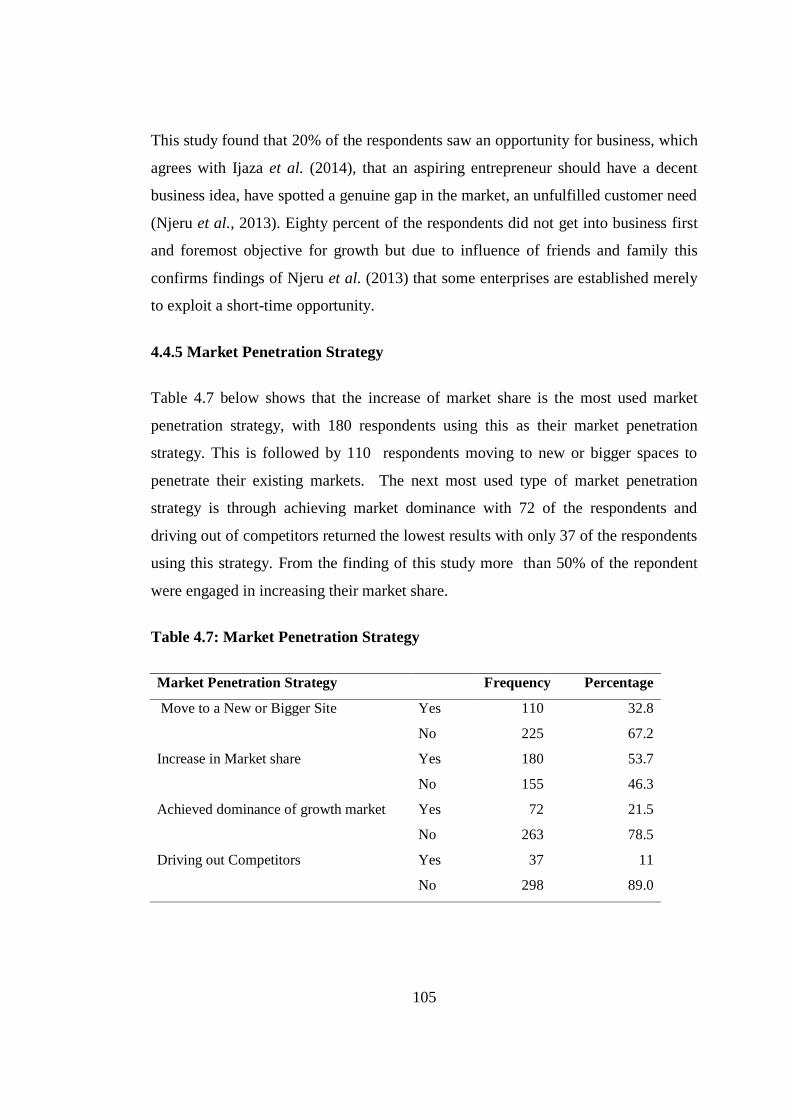
105
This study found that 20% of the respondents saw an opportunity for business, which
agrees with Ijaza et al. (2014), that an aspiring entrepreneur should have a decent
business idea, have spotted a genuine gap in the market, an unfulfilled customer need
(Njeru et al., 2013). Eighty percent of the respondents did not get into business first
and foremost objective for growth but due to influence of friends and family this
confirms findings of Njeru et al. (2013) that some enterprises are established merely
to exploit a short-time opportunity.
4.4.5 Market Penetration Strategy
Table 4.7 below shows that the increase of market share is the most used market
penetration strategy, with 180 respondents using this as their market penetration
strategy. This is followed by 110 respondents moving to new or bigger spaces to
penetrate their existing markets. The next most used type of market penetration
strategy is through achieving market dominance with 72 of the respondents and
driving out of competitors returned the lowest results with only 37 of the respondents
using this strategy. From the finding of this study more than 50% of the repondent
were engaged in increasing their market share.
Table 4.7: Market Penetration Strategy
Market Penetration Strategy
Frequency Percentage
Move to a New or Bigger Site Yes 110 32.8
No 225 67.2
Increase in Market share Yes 180 53.7
No 155 46.3
Achieved dominance of growth market Yes 72 21.5
No 263 78.5
Driving out Competitors Yes 37 11
No 298 89.0
106
The findings in this study was that increase in market share was used by 53.7% of the
respondents as a market penetration strategy. To increase their market share, the
respondents mainly used building of close customer relationships to retain existing
customers and to get new customers through recommendations by existing
customers. This is confirmed by Storey and Sykes (1996) that certain strategic
alternatives are typically more appropriate for a small firm, namely those that avoid
direct competition with larger firms and that involve the development of close
customer relationships (Storey & Sykes, 1996). The findings in this study also agree
with those of Ijaza et al. (2014), that SMEs maintain good communication with the
customers as a strategy, others strategies included giving credit to their customers,
sold goods of good quality and offered better services to their customers. A further
32.8% of the respondents were able to move to a new or bigger site. This was made
possible through their access of WEF loans and were therefore able to increase their
stock necessitating their need to move to bigger spaces.
In order to achieve dominance of the market, 21 % of the respondents used better
service to their clients and good quality products. The findings in this study also
agree with those of Ijaza et al (2014) that SMEs gave credit to their customers, sold
goods of good quality and offered better services to their customers. Luiz and Geoff
(2006) cites better after sell services, they further say for products to have sustainable
and differential advantages it must provide the customers the benefits, be unique,
sustainable, profitable, after a firm has created its differential advantages it can
enhance its competitiveness through positioning itself by diversify its products,
introduced new brands, changes existing brands, change customers believes.
According to Kotler and Armstrong (2008) companies trying to satisfy same
customers’ needs have to build closer relationship with the customers (Kotler &
Armstrong, 2008).
4.4.6 Market Development Strategy
Three hundred and fourteen respondents leveraged on their existing strengths to
develop new market (see table 4.8) . Other respondents, 215 in number used price
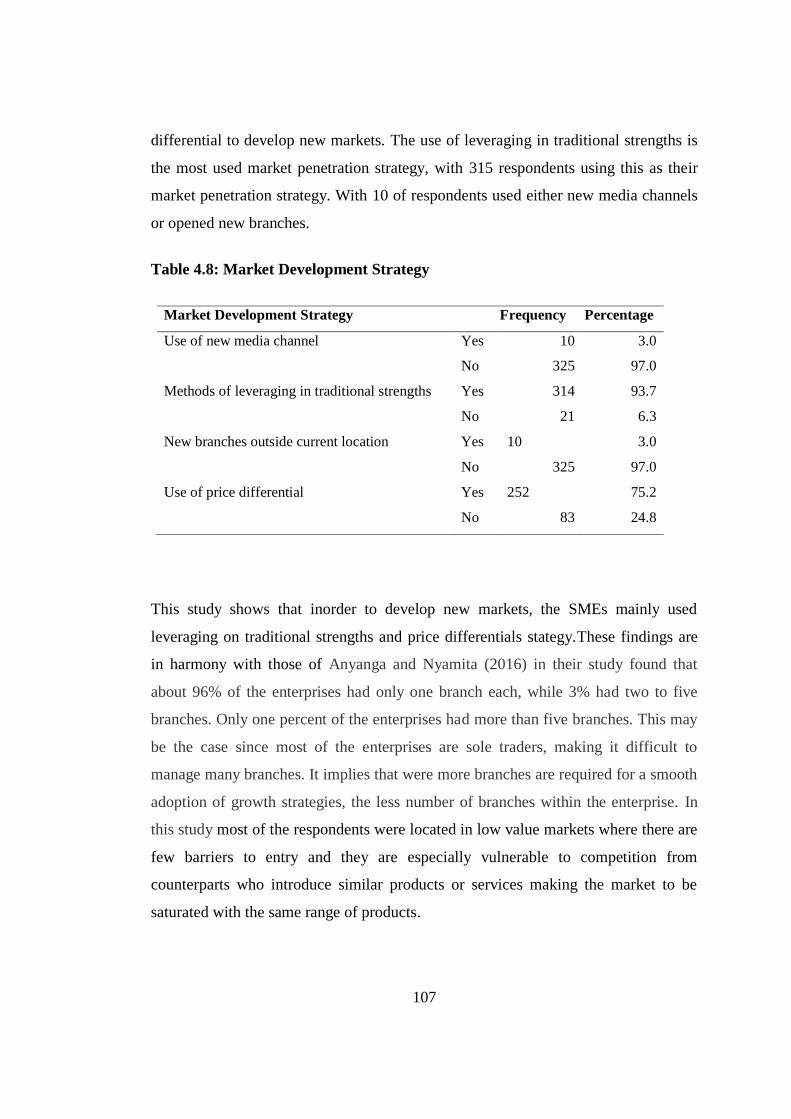
107
differential to develop new markets. The use of leveraging in traditional strengths is
the most used market penetration strategy, with 315 respondents using this as their
market penetration strategy. With 10 of respondents used either new media channels
or opened new branches.
Table 4.8: Market Development Strategy
Market Development Strategy Frequency Percentage
Use of new media channel Yes 10 3.0
No 325 97.0
Methods of leveraging in traditional strengths Yes 314 93.7
No 21 6.3
New branches outside current location Yes 10 3.0
No 325 97.0
Use of price differential Yes 252 75.2
No 83 24.8
This study shows that inorder to develop new markets, the SMEs mainly used
leveraging on traditional strengths and price differentials stategy.These findings are
in harmony with those of Anyanga and Nyamita (2016) in their study found that
about 96% of the enterprises had only one branch each, while 3% had two to five
branches. Only one percent of the enterprises had more than five branches. This may
be the case since most of the enterprises are sole traders, making it difficult to
manage many branches. It implies that were more branches are required for a smooth
adoption of growth strategies, the less number of branches within the enterprise. In
this study most of the respondents were located in low value markets where there are
few barriers to entry and they are especially vulnerable to competition from
counterparts who introduce similar products or services making the market to be
saturated with the same range of products.

108
The findings also agree with those of Ijaza et al. (2014) that the other strategy by
SMEs is selling at a slightly cheaper price than their counterparts. Using lower prices
to compete may mean lower profits though it may translate into selling bigger
volumes (Ijaza et al., 2014). Due to low capitalization level, only 10 firms (3%)
opened new branches in new location. However, according to Atieno (2001) at low
levels of income, the accumulation of such capital may be difficult. Under such
circumstances, microcredit facilities may help small-scale entrepreneurs improve
their incomes and accumulate own capital (Atieno, 2001).
Use of advertisement to promote/develop new markets was only used by 10 SMEs.
This is could be attributed to lack of training in marketing as posited by Hassan and
Mugambi (2013) that one of the serious challenges facing women entrepreneurs were
limited access to market information makes SMEs less aware of opportunities in the
market (Hassan & Mugambi, 2013). SMEs also face difficulties accessing markets
due to limited market information, poor marketing capacity and poor market research
leading to a discrepancy between the supply and demand (KIPPRA, 2006).
In this study 252 respondents (75%) used price differentials to grow their market.
This do not agree with Storey and Sykes (1996), that market uncertainty is high in
most SMEs as they tend to have a smaller share of the market, to have one or two
major customers and are hence less able to influence price thus tend to be price-
takers.
4.4.7 Product Development Strategy
In order to decide whether to develop new products, 151 of the SMEs made some
investment to help them make a decision (see table 4.9 below). Only 25 SMEs
invested in product development processes while, 25 SMEs invested in new product
closely associated with their current product, 24 SMEs invested in new product
which match with current customer purchasing habit and 23 SMEs developed new
products which reinvents or refreshes current products.
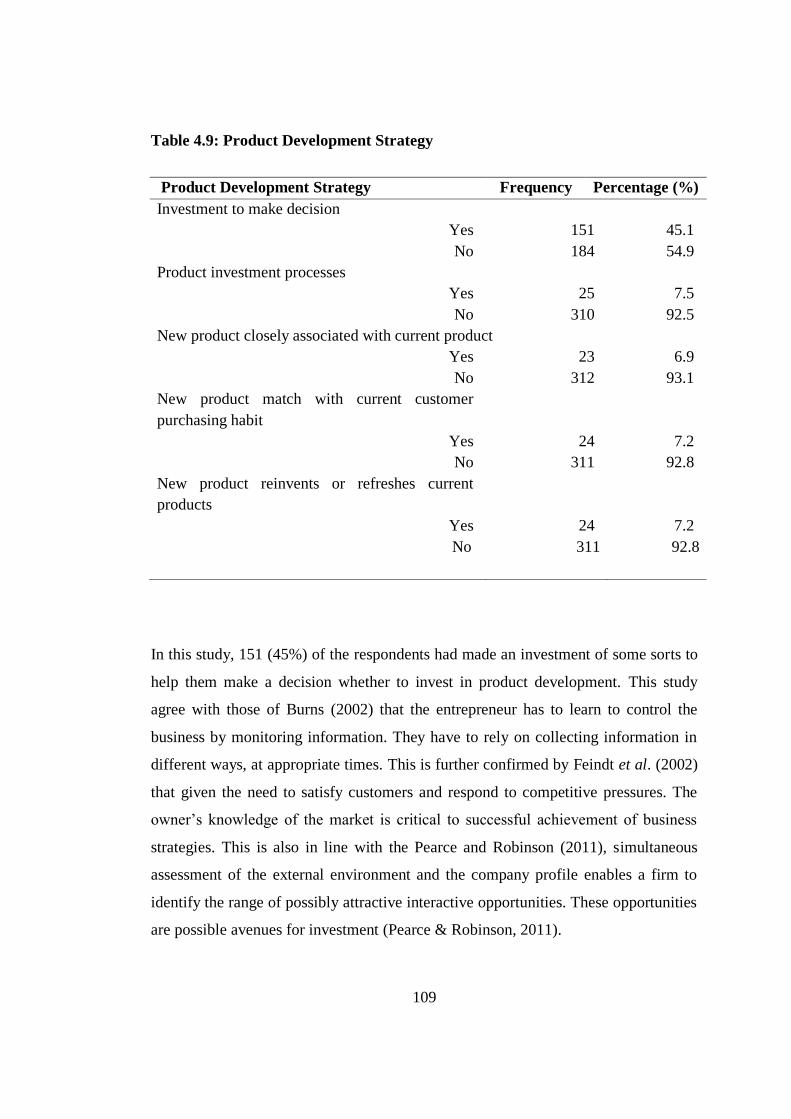
109
Table 4.9: Product Development Strategy
Product Development Strategy Frequency Percentage (%)
Investment to make decision
Yes 151 45.1
No 184 54.9
Product investment processes
Yes 25 7.5
No 310 92.5
New product closely associated with current product
Yes 23 6.9
No 312 93.1
New product match with current customer
purchasing habit
Yes 24 7.2
No 311 92.8
New product reinvents or refreshes current
products
Yes 24 7.2
No 311 92.8
In this study, 151 (45%) of the respondents had made an investment of some sorts to
help them make a decision whether to invest in product development. This study
agree with those of Burns (2002) that the entrepreneur has to learn to control the
business by monitoring information. They have to rely on collecting information in
different ways, at appropriate times. This is further confirmed by Feindt et al. (2002)
that given the need to satisfy customers and respond to competitive pressures. The
owner’s knowledge of the market is critical to successful achievement of business
strategies. This is also in line with the Pearce and Robinson (2011), simultaneous
assessment of the external environment and the company profile enables a firm to
identify the range of possibly attractive interactive opportunities. These opportunities
are possible avenues for investment (Pearce & Robinson, 2011).

110
The results of this study showed that only 7.5% of the respondents invested in new
products which agree with the findings Ijaza et al. (2014) that challenge facing
women in operating small businesses was inadequate capital. The absence of
innovation in the low value enterprise segment also confirms assertions by Aikaeli
(2007) that MSMEs often find themselves in a vicious cycle of providing what is
already in the market and not able to grow and expand to realize their full potential
as they lack both funding and business support services to venture into unexplored
business ideas. Only 23 (6.9%) of the respondents developed products closely
associated with their current products and another 24 (7.2%) developed products
which match current customer purchasing habits, this is an indication of low levels of
innovation. This is further confirmed by Ijaza et al. (2014) that challenge facing
women in operating small businesses was inadequate capital.
4.4.8 Diversification Strategy
Only 8 SMEs used the differentiation strategy by getting new products into new
markets. This represents only 2.4% of the SMEs according to table 4.10 below.
These SMEs used the strategy in which they made new product in new or related
Markets. None of the SMEs had acquired any of their suppliers businesses or
acquired any of their customers’ businesses.
Table 4.10: Diversification Strategy
Diversification Strategy Frequency Percentage (%)
Yes 8 2.4
No 327 97.6
Total 335 100.0
Diversification strategy was not generally adopted by the respondents with only 8
SMEs undertaking this strategy. The capitalization level of SMEs in this study were
very low therefore, diversification requires some considerable amount of investment.

111
This also concurs with the Atieno (2001), at low levels of income, the accumulation
of such capital may be difficult. Under such circumstances, microcredit facilities may
help small-scale entrepreneurs improve their incomes and accumulate own capital
(Atieno, 2001). These findings agree with the findings of Ijaza et al. (2014) that
challenge facing women in operating small businesses was inadequate capital. The
absence of innovation in the low value enterprise segment also confirms assertions
by Aikaeli (2007) that MSMEs often find themselves in a vicious cycle of providing
what is already in the market and not able to grow and expand to realize their full
potential as they lack both funding and business support services to venture into
unexplored business ideas
4.4.9 SME Growth in Number of Employees
The number of respondents who did not have any paid employee were 295
representing 88% of the SMEs implying business owners ran their own businesses
single handedly. 11.64% of the respondents had between 1 and 20 employees. Only 1
respondent had more than 20 employees (see table 4.11 below).
Table 4.11: SME Growth Number of Employees
Growth in No. of Employees Frequency Percentage (%)
0 295 88.06
1 – 20 39 11.64
21 – 40 1 .30
Total 335 100
The results of this study indicate low levels of growth of paid employees by the
SMEs with 88% of the SME were owner run firms. Only 12% of the of the SMEs
had between 1 and 20 employees and only l respondent had more than 20 employees.
These findings agree with Mutai (2011) that MSEs have tended to absorb large

112
numbers of unemployed people, they themselves are not able to generate reasonable
remunerated long-term jobs. This study also agrees with Kinyanjui (2006) who posits
that many women-owned MSEs that their sizes in terms of sales, profits and
capitalization remain small majority employing one to two employees. Stevenson
and St-Onge (2005) state that MSEs owned by women, about 86 per cent of the
workers are the owner operators; only four per cent of their workers are hired; the
remainder is made up of either family members or apprentices. In their study
Anyanga and Nyamita (2016) on SMES at Kondele Market, found that 99% of them
had employed less than ten people, with an exception of one enterprise which has
employed more 20 people. According to the study by Chepkwony and Sang (2017)
most SMEs had between 1 and 10 employees and were located in urban areas of
Kericho County. This implies that most of the growth strategies adopted had been
restricted in a way by the numbers of employees, particularly where more employees
are required for implementation.
The findings in this study do not agree with ILO (2011), that SMEs have proved to
be big employers. A high number of respondents (88.06%) did not have any paid
employee, therefore the findings of this study show that SMEs are not big employer
except for the SME owners. This study does not agree with the findings of Ouma
and Rambo (2013) who posits that microfinance loans is associated with growth of
women-owned SMEs in terms of number of paid workers. This suggests that most
SMEs experienced increased performance after receiving microcredit, which
necessitated the number of paid workers to go up. Access to microcredit is likely to
spur SME growth, which in turn is likely to create more employment opportunities.
4.4.10 SME Growth in Monthly Turnover
The mean value of monthly turnover has shown a gradual increase from the time of
taking the first loan of Ksh. 11,140 to current monthly turnover of Ksh. 17.419 (see
Table 4.12). The very high standard deviations demonstrate a wide dispersion around
the mean of the distribution, implying that actual average monthly turnover differ
widely. The mean value likewise demonstrates some change, whereas the high
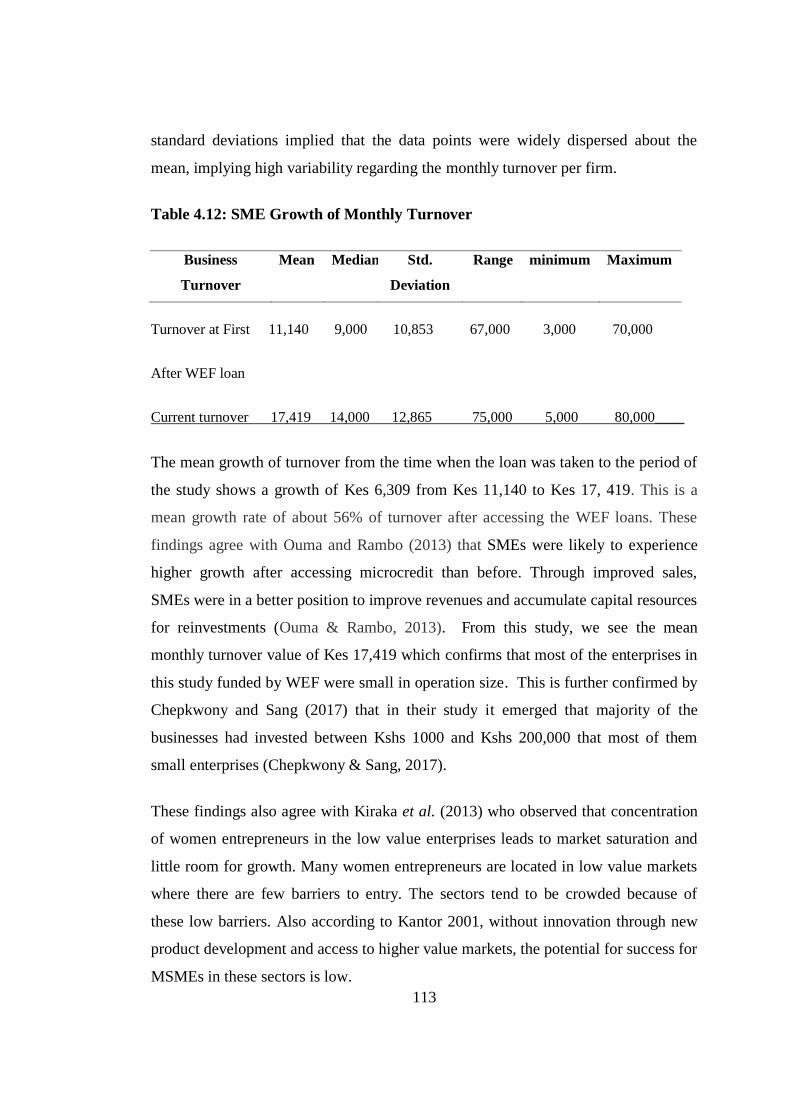
113
standard deviations implied that the data points were widely dispersed about the
mean, implying high variability regarding the monthly turnover per firm.
Table 4.12: SME Growth of Monthly Turnover
Business
Turnover
Mean Median Std.
Deviation
Range minimum Maximum
Turnover at First 11,140 9,000 10,853 67,000 3,000 70,000
After WEF loan
Current turnover 17,419 14,000 12,865 75,000 5,000 80,000____
The mean growth of turnover from the time when the loan was taken to the period of
the study shows a growth of Kes 6,309 from Kes 11,140 to Kes 17, 419. This is a
mean growth rate of about 56% of turnover after accessing the WEF loans. These
findings agree with Ouma and Rambo (2013) that SMEs were likely to experience
higher growth after accessing microcredit than before. Through improved sales,
SMEs were in a better position to improve revenues and accumulate capital resources
for reinvestments (Ouma & Rambo, 2013). From this study, we see the mean
monthly turnover value of Kes 17,419 which confirms that most of the enterprises in
this study funded by WEF were small in operation size. This is further confirmed by
Chepkwony and Sang (2017) that in their study it emerged that majority of the
businesses had invested between Kshs 1000 and Kshs 200,000 that most of them
small enterprises (Chepkwony & Sang, 2017).
These findings also agree with Kiraka et al. (2013) who observed that concentration
of women entrepreneurs in the low value enterprises leads to market saturation and
little room for growth. Many women entrepreneurs are located in low value markets
where there are few barriers to entry. The sectors tend to be crowded because of
these low barriers. Also according to Kantor 2001, without innovation through new
product development and access to higher value markets, the potential for success for
MSMEs in these sectors is low.

114
4.4.11 SME Growth on Business Worth
The mean value of business worth has shown a gradual increase from the time of
taking the first loan of Ksh. 20,670 to current level of Ksh. 36,241 (see Table 4.13).
The very high standard deviations demonstrate a wide dispersion around the mean of
the distribution, implying that actual average monthly turnover differ widely. The
mean value likewise demonstrates some change from an average mean of Kshs.
13,000 before SMEs took loans to Kshs. 36,241 which a 300% increase, whereas the
high standard deviations implied that the data points were widely dispersed about the
mean, implying high variability regarding the firms’ business worth.
Table 4.13: SME Growth Business Worth
Business Worth Mean Median Std.
Deviation
Range minimum Maximum
Business worth
at first WEF
loan
20,670 13,000 18,736 119,000 1,000 120,000
Current
estimated worth
of business
36,241 26,000 28,499 174,000 6,000 180,000
The findings of this study confirm a mean growth rate of business worth of 75% after
accessing the WEF loans from Ksh 20,670 Ksh 36,241. The growth of mean business
worth in this study after access WEF loans, could imply that additional capital enable
firms to grow their business worth. This agrees with the Ouma and Rambo (2013),
SMEs were likely to experience higher growth after accessing microcredit than
before. Through improved sales, SMEs were in a better position to improve revenues
and accumulate capital resources for reinvestments. Growth and expansion of SMEs
requires sustained investment in working capital. However, at low levels of net
profits, the accumulation of such capital may be difficult. Net profits provide a
natural way through which SMEs build their financial base and replenish working

115
capital. As net profits increase, so is the likelihood that an SME is experiencing
growth (Ouma & Rambo, 2013).
According Chepkwony and Sang (2017) the results, most of the respondents (97.2%)
confirmed that they had access to the WEF. of the 310 respondents who reported that
they had accessed WEF, 68.3% had accessed it at the start of the business, 29.8% in
the course of running it and 1.9% way after the business had picked up. About 93%
of the respondents had taken a loan of between Kshs 5,000 and Kshs 50,000 while
7% had taken a loan worth between Kshs 50,000 and Kshs 100,000 (Chepkwony &
Sang, 2017).Although the level of capitalization remains low at Ksh 36,241. This
agrees with the findings of Kiraka et al. (2013) who observed that concentration of
women entrepreneurs is in the low value enterprises. This is also confirmed by Ijaza
et al. (2014) that women owned businesses are known for their low start up and
working capital it has been noted that under normal circumstances women’s
enterprises have low growth rate and limited potential partially due to the type of
business activities they run.
4.5 Discussion of Findings
The effect of the competitive strategies adopted of each SME was identified and
discussed under the descriptive analysis above. In this section, the effect on growth
of the competitive strategic adoption by the SMEs on their performance was
discussed based on the results.
4.5.1 Effect of Market Penetration on SME Growth
The base category or reference was market penetration strategy. Hence, the intercept
term refers to the base category and comparison was done with this base category.
After the analysis of model fitness and coefficient of determination, the impact of
competitive strategies on growth of SMEs was assessed. The section below
illustrates the model fit with the data.

116
a.Effect of Market Penetration on Turnover
In this section inferential statistics on effect of market penetration on SME turnover
are presented in Tables 4.14, 4.15 and 4.16. Table 4.14 depicts the R-Square value as
.874. R-squared is a statistical measure of how close the data are to the fitted
regression line. The results in this is study was R- Squared of 87.4% which is a high
percentage, in general, the higher the R-squared, the better the model fits the data.
This study applied adjusted R-Squared to measure the proportion of the variation in
the dependent variable (Yi) explained by the independent dummy variables for the
linear regression model. The results in Table 4.14 showed the results of Adjusted R
Squared value of .858 implying that there was 85.8% variation of the turnover in
SMEs was due to the market penetration strategy that they applied.
Table 4.14: Model Summary Market Penetration on Turnover Growth
Growth on Turnover Model summary
Model Summary
Model R R Square Adjusted R
Square
Std. Error of the
Estimate
1 .935a .874 .858 236.69714
a. Dependent Variable: Turnover
b. Predictors: (Constant), Productdevlop, Marketdevelop
Table 4.15 below showed that the market penetration strategy had statistically a
positive significant effect on turnover of the business (P = 0.000).

117
Table 4.15: Market Penetration on Turnover Growth
Growth on Turnover Model summary F-Test
ANOVAa
Model Sum of
Squares
Df Mean Square F Sig.
1 Regression
Residual
Total
544487387.5
38794314582.7
39338801970.2
2
332
334
272243693.719
11685034.129
23.30 .000b
a. Dependent Variable: Turnover
b. Predictors: (Constant), Productdevlop, Marketdevelop
According to Table 4.16 below, the mean impact of market penetration on turnover
was 11994.595. This implied that the customers are price sensitive. Consequently,
market penetration strategy brought significant effect on business turnover.
Table 4.16: Parameter Estimation of Market Penetration on Turnover Growth
Growth on Turnover parameter estimation
Coefficientsa
Model Unstandardized
Coefficients
Standardized
Coefficients
T Sig.
B Std.
Error
Beta
1 (Constant)
Productdevlop
marketdevlop
11994.595
-996.615
-3680.869
794.747
1346.079
1709.622
-.042
-.122
15.092
-.740
-2.153
.000
.460
.032
a. Dependent Variable: Turnover
b. Predictors: (Constant), Productdevlop, Marketdevelop

118
119
The inferential analysis on Tables 4.14, 4.15 and 4.16 on Market Penetration effect
on turnover growth provide the regression analysis below
Ŷi = 11994.595 -996.655 D2i – 3680.869D3i
The findings in this study agree also with those of Sajjad et al. (2013) in their study
on SME in the fast food sector of Pakistan were found to be generally using market
penetration. But intensity of the strategy implementation was not too high that may
have been due to a moderately dynamic environment. Correlation results depicted
that growth in the fast food sector had a clear relevance with Market penetration.
Linear regression analysis revealed that market penetration was significantly and
positively related with the fast food firm’s growth in Pakistan. Market penetration
had a significant effect on growth turned into a significant and positive relationship,
R2 change, which was significant but turned into insignificant. Hence, it could be
said that environment did not moderate the relationship between market penetration
and firm’s growth in Pakistani fast food sector. Logically, it seems alright that
market environment may not have any effect while penetrating in current market
with same products because pace of change in single market is not as rapid as
moving into another market (Sajjad et al., 2013).
Anyanga and Nyamita (2016) also found in their study that the correlation between
service positioning and total asset value and market penetration was not significant.
The study also found that the correlation between the number of branches within the
enterprise and the major adoption of market penetration had significantly correlated.
These findings agree with Kinyanjui (2006) that many women-owned MSEs are
being created every year but the sizes in terms of sales remain small. Further, those
businesses that survive have remained small with insignificant growth. This is further
confirmed by Ijaza et al. (2014) that generally rural women were engaged in similar
businesses with services or products which were not differentiated. Low growth of
SMEs is partly because SMEs in rural area, there are no wide variety of economic
activities for women to choose from. Lack of differentiation meant that switching
costs for customers were minimal, therefore increasing competition among the

120
enterprises (Ijaza et al., 2014).
b.Effect of Market Penetration on Business Worth
Table 4.17 depicts the R-Square value as .792. R-squared is a statistical measure of
how close the data are to the fitted regression line. In this case 79.2% which is a high
percentage, in general, the higher the R-squared, the better the model fits the data.
This study applied adjusted R-Squared to measure the proportion of the variation in
the dependent variable (Yi) explained by the independent dummy variables for the
linear regression model. The table 4.17 showed that market penetration strategy had
79.0% variation of the business worth in SMEs which had affected business worth
significantly.
Table 4.17: Model Summary on Effect of Market Penetration on SME Business
Worth
Growth on Business-worth Model summary
Model R R Square Adjusted R Square Std. Error
Estimate
1 .89a .792 .790 24018.895
a.Predictors: (Constant), Productdevlop, Marketdevelop
The results in table 4.18 below showed that market penetration strategy had
statistically a positive significant effect on business worth of the business (P =
0.000).

121
Table 4.18: Effect of Market Penetration on SME Business Worth
Growth on Business-worth F-test
ANOVAa
Model Sum of Squares Df Mean Square F Sig.
1 Regression
Residual
Total
79739216748.3
191533234774.1
271272451522.4
2
332
334
39869608374.153
576907333.657
69.109 .000b
a. Dependent Variable: Businessworth
b. Predictors: (Constant), Productdevlop, Marketdevelop
The mean impact of market penetration on business worth was 37247.568. This
implied that the customers are price sensitive as indicted in the descriptive analysis
below.
Table 4.19: Effect of Market Penetration on SME Business Worth
Growth on Business-worth Model summary, F-test, parameters
Coefficientsa Model Unstandardized
Coefficients
Standardize
d
Coefficients
T Sig.
B Std. Error Beta
1 (Constant)
Productdevlop
Marketdevlop
37247.568
-3050.598
-688.744
2099.240
3555.525
4515.783
-.049
-.009
17.7
-.858
-.153
.000
.392
.879
a. Dependent Variable: Business worth

122
The tables 4.17, 4.18 and 4.19 we can develop the regression analysis below on
Market Penetration effect on business worth growth
Ŷi = 37247.568 -3050.598D2i – 688.744D3i
These findings agree with Anyanga and Nyamita (2016) in their study that to a large
extent the value of total assets, which represents investment value, determines the
growth strategy of the SME’s market penetration. The main firms’ characteristics
that influenced adoption of growth strategies within the artisan enterprises in Kibuye
were the value of total assets (investment). They posited that estimated value of total
assets was significantly positively correlated with major items of adoption of growth
strategies.
The study by Anyanga and Nyamita (2016) also found that 60% of the enterprises
had an estimated total asset value between Kshs. 50,000 and Kshs. 1,000,000, with
majority (33%) of them recording total asset value of Kshs. 100,000 to Kshs.
200,000. However, only one percent of the enterprises recorded an estimated total
asset value of above Kshs. 1,000,000. This indicates that majority of the Juakali
artisans in Kibuye fall within the category of small enterprises. Further, this may be a
limitation, but not restricted to, an expansion strategy of the enterprises. These
findings agree with Ijaza et al. (2014) that generally rural woman were engaged in
similar businesses with services or products which were not differentiated. Lack of
differentiation meant that switching costs for customers were minimal, therefore
increasing competition among the enterprises (Ijaza et al., 2014). With minimal
switching costs customers are price sensitive and therefore as confirmed in this study
the impact of using price differential has a great impact on business worth and
turnover.
c.Effect of Market Penetration on Size of Employees
According to Table 4.20 below, the variation of the employee size explained by the
strategies was 0.005 and the model was not significant. This implied that the strategy
does not have impact on employee size. R-squared is a statistical measure of how

123
close the data are to the fitted regression line, in general, the higher the R-squared,
the better the model fits the data. This study applied adjusted R-Squared to measure
the proportion of the variation in the dependent variable (Yi) explained by the
independent dummy variables for the linear regression model. The results in Table
4.20 showed the results Adjusted R Squared value of -.001 implying that there was -
1% variation of the employee size due to market penetration strategy which had
statistically insignificant effect on employee size.
Table 4.20: Effect of Market Penetration on SME Number of Employees
Growth
Growth on No. of employees Model summary
Model Summary
Model R R
Square
Adjusted R
Square
Std. Error of the Estimate
1 .074a .005 -.001 3.578
a. Predictors: (Constant), Productdevlop, Marketdevelop
Table 4.21 revealed that the market penetration strategy had statistically insignificant
effect on employee size (P = .405).
Table 4.21: Effect of Market Penetration on SME Number of Employees
Growth
Growth on No. of employees F-test
ANOVAa
Model Sum of
Squares
Df Mean Square F Sig.
1 Regression 23.232 2 11.616
12.802
.907 .405b
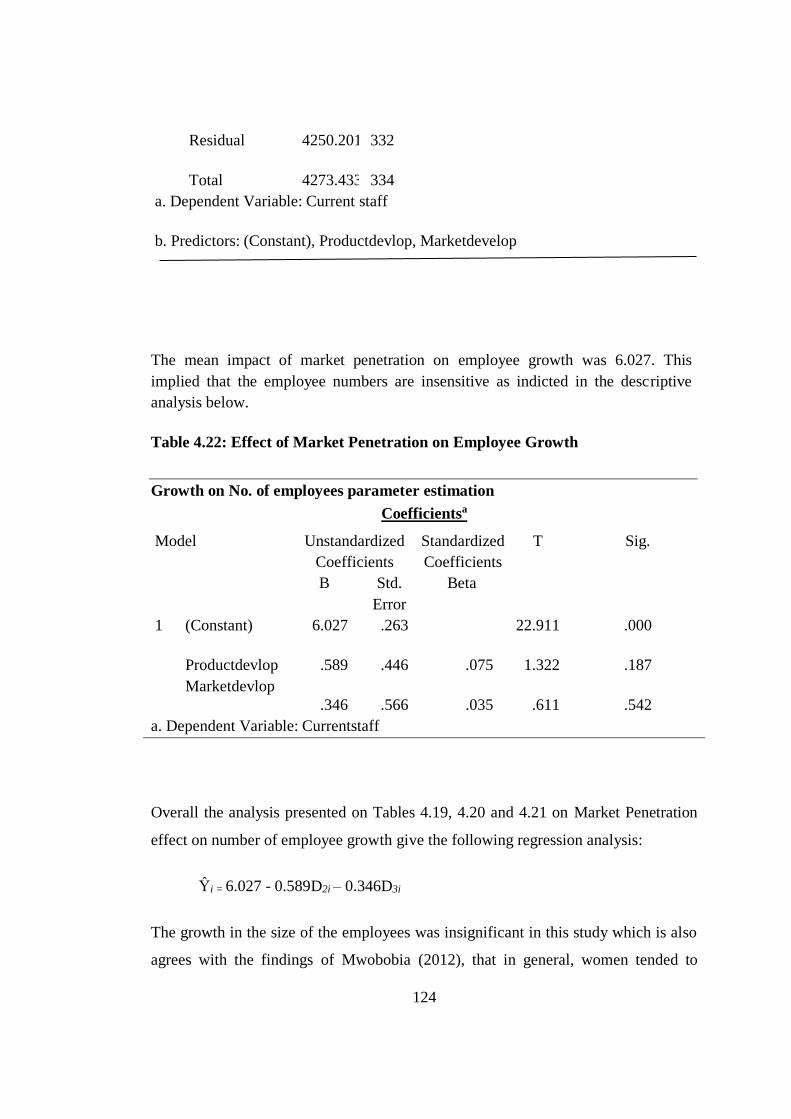
124
Residual
Total
4250.201
4273.433
332
334
a. Dependent Variable: Current staff
b. Predictors: (Constant), Productdevlop, Marketdevelop
The mean impact of market penetration on employee growth was 6.027. This
implied that the employee numbers are insensitive as indicted in the descriptive
analysis below.
Table 4.22: Effect of Market Penetration on Employee Growth
Growth on No. of employees parameter estimation
Coefficientsa
Model Unstandardized
Coefficients
Standardized
Coefficients
T Sig.
B Std.
Error
Beta
1
(Constant)
Productdevlop
Marketdevlop
6.027
.589
.346
.263
.446
.566
.075
.035
22.911
1.322
.611
.000
.187
.542
a. Dependent Variable: Currentstaff
Overall the analysis presented on Tables 4.19, 4.20 and 4.21 on Market Penetration
effect on number of employee growth give the following regression analysis:
Ŷi = 6.027 - 0.589D2i – 0.346D3i
The growth in the size of the employees was insignificant in this study which is also
agrees with the findings of Mwobobia (2012), that in general, women tended to

125
operate smaller enterprises than men, with the average number of employees in a
women-owner/manager MSE being 1.54. Kinyanjui (2006) also posits that many
women-owned MSEs are being created every year but the sizes remain small
majority employing one to two employees. Majority of them do not live to see their
second birthday. Further, those businesses that survive have remained small with
insignificant growth.

126
4.5.2 Effect of Product Development on SME Growth
The effect of product development strategy on turnover, business worth and
employee size is discussed from the empirical results in tables 4.23, 4.24 and 4.25.
The two regression models, namely, turnover and business worth were significant.
However, the regression model for employee size was not significant (see tables
4.23, 4.24 and 4.25). The effect of product development strategy on business
turnover, business worth and employee size are scientifically discussed below.
a. Effect of Product Development on SME Turnover
The empirical results in table 4.23 showed that the mean impact of product
development strategy on turnover was 10997.98 (11994.595 - 996.615). However,
the product development strategy had statistically insignificant effect on turnover (P
= 0.460).
Table 4.23: Effect of Product Development on SME Turnover Growth
Growth on No. of Turnover Model summary, F-test and parameter estimation
Coefficientsa
Model Unstandardized
Coefficients
Standardized
Coefficients
T Sig.
B Std.
Error
Beta
1 (Constant) 11994.595 794.747 15.092 .000
Productdevelop -996.615 1346.079 -.042 -.740 .460
a. Dependent Variable: Turnover
b. Predictors: (Constant), productdevelop
Anyanga and Nyamita (2016) found that there was a significant correlation between
the number of branches within the enterprise and product development. The
enterprise has evolved from its main core activity into more complex business since

127
it embarked on product development strategy. Product development strategy
adopted by the firm targets a specific group of people. Sajjad et al. (2013) in their
study on SME in the fast food sector of Pakistan was found to be generally using
Product Development. But intensity of these strategy implementation was not too
high that may have been due to a moderately dynamic environment. Correlation
results depict that growth in the fast food sector had a clear relevance with Product
Development. Product development was positively and significantly related to
firm’s growth in Pakistani fast food sector (Sajjad et al., 2013).
Moderated regression analysis with the interaction term of Product Development
strategy so that unique effect of environment could be found returned an
insignificant relationship for product development and remained insignificant after
moderation of environment (Sajjad et al., 2013). This study findings also agree with
the findings of Ijaza et al. (2014) that most entrepreneurs who run grocery shops
stocked according to demand. This means if you have few clients you stock fewer
goods. This also spells a death knells to the business because it means making little
or no profit at all. Some of them admitted selling on credit rather than have the
goods spoil.
b. Effect of Product Development on SME Business Worth
The results in table 4.17 showed that 79.2% variation of the business worth in
SMEs was due to product development strategy that they were applied. The product
development strategy had statistically insignificant effect on business worth (P =
0.392) and its mean impact on business worth was less from market penetration
strategy by 3050.598 (37247.568 - 3050.598 = 34196.97) which is equivalent to
34196.97.

128
Table 4.24: Effect of Product Development on SME Business Worth
Growth on Business worth Model summary, F-test and parameter estimation
Coefficientsa
Model Unstandardized
Coefficients
Standardized
Coefficients
T Sig.
B Std.
Error
Beta
1 (Constant) 37247.568 2099.240 17.743 .000
Productdevelop -3050.598 3555.525 -.049 -.858 .392
a. Dependent Variable: Businessworth
b. Predictors: (Constant), Productdevelop
The findings by Anyanga and Nyamita (2016) returned different results from those in
this study. In their study they found that to a large extent the value of total assets,
which represents investment value, determines the major growth strategy of the
SME’s, product development, innovation and part of diversification strategy.
Therefore, the main firms’ characteristics that may influence adoption of growth
strategies within the artisan enterprises in Kibuye were the value of total assets
(investment) and the number of branches. In their study estimated value of total
assets was significantly positively correlated with major items of adoption of growth
strategies (Anyanga & Nyamita, 2016).
The study of SMEs in Kisumu by Anyanga and Nyamita (2016) also found that 60%
of the enterprises had an estimated total asset value between Kshs. 50,000 and Kshs.
1,000,000, with majority (33%) of them recording total asset value of Kshs. 100,000
to Kshs. 200,000. However, only one percent of the enterprises recorded an
estimated total asset value of above Kshs. 1,000,000. This indicates that majority of
the SMEs had low business worth. Further, this may be a limitation, but not restricted
to, an expansion strategy of the enterprises (Anyanga & Nyamita, 2016).

129
The findings in this study coincided with those of Ijaza et al. (2014) women owned
businesses are known for their low start up and working capital it has been noted that
under normal circumstances women’s enterprises have low growth rate and limited
potential partially due to the type of business activities they run. Whilst
microenterprises are very often the source of innovation, they are especially
vulnerable to competition from counterparts who introduce similar products or
services making the market to be saturated with the same range of products (Ijaza et
al., 2014). These findings are in harmony with those of Kinyanjui (2006), that many
women-owned MSEs are being created every year but the sizes in terms of sales,
profits and capitalization. Further, those businesses that survive have remained small
with insignificant growth.
c.Effect of Product Development on SME Employee Size
The results in table 4.25 showed that the Product development strategy had
statistically insignificant effect on employee size (P = 0.187).
Table 4.25: Effect of Product Development on SME Number of Employees
Growth
Growth on No. of employees Model summary, F-test and parameter estimation
Coefficientsa
Model Unstandardized
Coefficients
Standardized
Coefficients
T Sig.
B Std.
Error
Beta
1 (Constant) 6.027 .263 22.911 .000
Productdevelop .589 .446 .075 1.322 .187
a. Dependent Variable: Currentstaff
b. Predictors: (Constant), Productdevelop

130
The findings of this study coincide with those of Anyanga and Nyamita (2016) that
the number of employees had significant negative correlation with some product
development strategy items and significant positive correlation with innovation
strategy items. And also the size of the employees was not significant which also
agrees with the findings of Mwobobia (2012), that in general, women tended to
operate smaller enterprises than men, with the average number of employees in a
women-owner/manager MSE being 1.54.
These findings also agree with the findings of Kinyanjui (2006) that many women-
owned MSEs are being created every year but the sizes in terms of sales, profits and
capitalization remain small majority employing one to two employees. Majority of
them do not live to see their second birthday. Further, those businesses that survive
have remained small with insignificant growth. In addition this agrees with the
findings of Ijaza et al. (2014) that most entrepreneurs who run grocery shops stocked
according to demand. This means if you have few clients you stock fewer goods.
This also spells a death knells to the business because it means making little or no
profit at all.
4.5.3 Effect of Market Development on SME growth
The impact of market development strategy on turnover, business worth and
employee size is discussed from the empirical results in tables 4.12, 4.13 and 4.14.
The ANOVA model, namely, turnover was significant, however, two of the
regression models for business worth and employee size were not significant.
a.Effect of Market Development on Turnover
The empirical results in table 4.26 showed that market development strategy had
statistically significant effect on turnover (P = 0.032). The mean effect of market
development strategy on turnover was 8313.726 (11994.595 - 3680.87).

131
Table 4.26: Effect of Market Development on SME Turnover Growth
Growth on Turnover Model summary, F-test and parameter estimation
Coefficientsa
Model Unstandardized
Coefficients
Standardized
Coefficients
T Sig.
B Std.
Error
Beta
1 (Constant) 11994.595 794.747 15.092 .000
Marketdevlop -3680.869 1709.622 -.122 -2.153 .032
The findings by Anyanga and Nyamita (2016) returned different results from those in
this study. Their study showed that there was a significant correlation between the
number of branches within the enterprise and the major adoption strategies of market
development Therefore, the main firms’ characteristics that may influence adoption
of growth strategies within the artisan enterprises in Kibuye are the number of
branches. Their study also found that enterprises had achieved high growth by
identifying new markets for their new but related products (Anyanga & Nyamita,
2016).
Sajjad et al. (2013) in their study on SME in the fast food sector of Pakistan were
found to be using Market Development. But intensity of this strategy implementation
was not too high which may have been due to a moderately dynamic environment.
Correlation results depicted that growth in the fast food sector had a clear relevance
with Market Development. Similarly, Market Development revealed firm’s growth in
the fast-food sector of Pakistan with a very high significance level. Moderated
regression analysis with the interaction term of Market Development strategy so that
unique effect of environment could be found, this returned a significant relationship
after moderation of environment the result of R2 was significant. As market newness
and technological newness are related to up to date consumer demands. Therefore,
market development may be affected while moving into another market because of

132
change of environment (Sajjad et al., 2013).
These findings concur with KIPPRA (2006) that limited access to market
information makes SMEs less aware of opportunities in the market. SMEs also face
difficulties accessing markets due to limited market information, poor marketing
capacity and poor market research leading to a discrepancy between the supply and
demand. Kinyanjui (2006) posits that many women-owned MSEs are being created
every year but the sizes in terms of sales, profits and capitalization remain small.
Majority of them do not live to see their second birthday. Further, those businesses
that survive have remained small with insignificant growth.
b.Effect of Market Development on Business Worth
The results in table 4.27 showed that 79.2% variation of the business worth in
SMEs was due to the market penetration strategy and market development strategy
that were applied. The market development strategy had statistically insignificant
effect on business worth (P = 0.879) and its mean impact on business worth was
36558.82 (37247.568 - 688.744 = 36558.82).
Table 4.27: Effect of Market Development on SME Business worth Growth
Growth on Business worth Model summary, F-test and parameter estimation
Coefficientsa
Model Unstandardized
Coefficients
Standardized
Coefficients
T Sig.
B Std.
Error
Beta
1 (Constant) 37247.568 2099.240 17.743 .000
Marketdevlop -688.744 4515.783 -.009 -.153 .879
a. Dependent Variable: Businessworth
b. Predictors: (Constant), marketdevlop

133
Findings of this study agree with that of Anyanga and Nyamita (2016) in their study
found that to a large extent the value of total assets, which represents investment
value, determines the major growth strategy of the SME’s, market development,
innovation and part of diversification strategy. Therefore, the main firms’
characteristics that may influence adoption of growth strategies within the artisan
enterprises in Kibuye are the value of total assets (investment) and the number of
branches. estimated value of total assets is significantly positively correlated with
major items of adoption of growth strategies. The study also found that in Kibuye
60% of the enterprises had an estimated total asset value between Kshs. 50,000 and
Kshs. 1,000,000, with majority (33%) of them recording total asset value of Kshs.
100,000 to Kshs. 200,000. However, only one percent of the enterprises recorded an
estimated total asset value of above Kshs. 1,000,000. This may indicate that majority
of the Juakali artisans in Kibuye fall within the category of small enterprises. Further,
this may be a limitation, but not restricted to, an expansion strategy of the
enterprises.
These findings correspond to the findings of Kinyanjui (2006) that many women-
owned MSEs are being created every year but the sizes in terms of sales, profits and
capitalization remain small. Further, those businesses that survive have remained
small with insignificant growth. Oumo and Rombo (2013) argue that the growth and
expansion of SMEs requires sustained investment in working capital. However, at
low levels of net profits, the accumulation of such capital may be difficult. Net
profits provide a natural way through which SMEs build their financial base and
replenish working capital. As net profits increase, so is the likelihood that an SME is
experiencing growth.
Ijaza et al. (2014), in the study found that respondents who run grocery shops were
asked which strategy they employed to counter this and many of they said that they
stocked according to demand. This means if you have few clients you stock fewer
goods. This also spells a death knell to the business because it means making little or
no profit at all. Some of them admitted selling on credit rather than have the goods
spoil (Ijaza et al., 2014).

134

135
c.Effect of Market Development on Employee Size
The results in table 4.28 showed that the market development strategy had
statistically insignificant effect on employee size (P = 0.542). The mean impact of
product development on employee size was almost six employees.
Table 4.28: Effect of Market Development on Number of Employees Growth
Growth on No. of employees Model summary, F-test and parameter estimation
Coefficientsa
Model Unstandardized
Coefficients
Standardized
Coefficients
T Sig.
B Std.
Error
Beta
1 (Constant) 6.027 .263 22.911 .000
Marketdevlop .346 .566 .035 .611 .542
a. Dependent Variable: Currentstaff
b. Predictors: (Constant), Marketdevlop
Kinyanjui (2006) agrees with this study when he posits that many women-owned
MSEs are being created every year but the sizes in terms of sales, profits and
capitalization remain small majority employing one to two employees. Further, those
businesses that survive have remained small with insignificant growth. This is further
confirmed that vertical growth is desired for any enterprise since it has been
associated with increased capacity for employment generation (Ndungu &
Mwambeo, 2015). While MSEs have tended to absorb large numbers of unemployed
people, they themselves are not able to generate reasonable remunerated long-term
jobs (Mutai, 2011).
The findings in this study do not agree with ILO (2011), that SMEs have proved to
be big employers and to be more resilient than large firms during the recent

136
economic crisis. In this study SMEs (88.06%) did not have any employee, therefore
the findings of this study is that SMEs are not big employer except for the SME
owners. The findings of this also do not agree with those of Anyanga and Nyamita
(2016) that number of employees had significant negative correlation with market
development strategy items. The number of employees influenced how market
development strategy would be implemented in Kondele.
4.5.4 Effect of Diversification Strategy on SME Growth
The diversification strategy was not included in the ANOVA model because only 8
SMEs (2%) applied diversification strategy. As a result, it was omitted in the
regression analysis. Most beneficiaries of WEF are low value enterprises therefore
due to high level of competition. Market uncertainty is high in most SMEs as they
tend to have a smaller share of the market. For the diversification strategy to be
applied SMEs should built a strong business worth.
Due to the low levels of capitalization only 2% of the respondents implemented the
diversification strategy which therefore agrees with Mutai (2011) that the SME
sector is still characterized by low productivity, low product quality, lack of
diversification in product range and the dominance of trading activities. This
findings are corroborated by Ijaza et al. (2014) who posits that women owned
businesses are known for their low start up and working capital it has been noted that
under normal circumstances women’s enterprises have low growth rate and limited
potential partially due to the type of business activities they run. According to Oumo
and Rombo (2013) argue that the growth and expansion of SMEs requires sustained
investment in working capital. However, at low levels of net profits, the
accumulation of such capital may be difficult. Net profits provide a natural way
through which SMEs build their financial base and replenish working capital. As net
profits increase, so is the likelihood that an SME is experiencing growth (Oumo &
Rombo, 2013).

137
On the other hand, Anyanga and Nyamita (2016) in their study found that the SMEs
in Kisumu had adopted diversification strategy to a great extent, though, with high
standard deviation. The firms used diversification strategy to widen their scope
across different products and market sector. Diversification strategy had increased
international diversity of the firm’s ability to share activities of different geographic
areas providing greater opportunities to achieve economies of scale in critical
functions such as research and development. The firm has gained greater
opportunities to leverage strategic resources while simultaneously diversifying
market risk, thus raising their performance.
Sajjad et al. (2013) in their study on SME in the fast food sector of Pakistan the
SMEs were using Diversification. But the intensity of these strategy implementation
was not too high that may have been due to a moderately dynamic environment. In
this study, Product Development and Market Development had significant positive
effect on growth which is in alignment with theory of Ansoff growth strategies
because new product development and market development simultaneously creates
diversification effect. The environment was correlated with Diversification which
had positive significance. However, diversification demonstrated negative correlation
with growth but significance of this result was low. Moderated regression analysis
found an insignificant relationship between diversification and growth which
remained insignificant after moderation of environment as R2 Change was
insignificant. Regression analysis on diversification did not predict the growth and
negative relationship with growth were not significant (Sajjad et al., 2013).
4.5.5 Hypothesis Testing
The following were the hypothesis to be tested in this study Ho1: Market penetration
strategy has no significant effect on growth WEF Funded SMEs; Ho2: Market
development strategy has no significant effect on growth of WEF Funded SMEs;
Ho3: Product development strategy has no significant effect on growth WEF funded
SMEs; Ho4: Diversification strategy has no significant effect on growth on WEF
Funded SMEs. Table 4.29 below provides the results of the regression analysis run to

138
test these hypotheses. Using the results of P-value < 0.05 to determine if the
hypothesis was to be rejected.

139
Table 4.29: Parameter Estimation on Growth Variables
Coefficientsa
Model Unstandardized
Coefficients
Standardized
Coefficients
T Sig.
B Std. Error Beta
Turnover
Marketpenetration
Productdevlop
Marketdevelop
Business worth
Marketpenetration
Productdevlop
Marketdevelop
No. Employees
Marketpenetration
Productdevlop
Marketdevelop
11994.595
-996.615
-3680.869
37247.568
-3050.598
-688.744
6.027
.589
.346
794.747
1346.079
1709.622
2099.240
3555.525
4515.783
.263
.446
.566
-.042
-.122
-.049
-.009
.075
.035
15.092
-.740
-2.153
17.7
-.858
-.153
22.911
1.322
.611
.000
.460
.032
.000
.392
.879
.405
.187
.542
a.Ho1: Market penetration strategy has no significant effect on growth of WEF
funded SMEs in Kenya
The P-values for market penetration on turnover, business worth and number of
employees are 0.000, 0.000 and 0.405 respectively implying that market penetration

140
had a significant impact on turnover and business worth and no significant impact on
number of employees. We therefore reject the hypothesis that Ho1: Market
penetration strategy has no significant effect on growth on turnover and business
worthwhile accepting the hypothesis that market penetration had no significant
impact on the number of employees of WEF Funded SMEs.
The findings agree with those of Ijaza et al. (2014) that the strategy by SMEs is
selling at a slightly cheaper price than their counterparts. Using lower prices to
compete may mean lower profits though it may translate into selling bigger volumes.
Also to counter competition some respondents gave credit to their customers, sold
goods of good quality, and offered better services to their customers. According to
Ouma and Rambo (2013), sales volume is one of the factors used to gauge whether
an SME is growing positively or otherwise. Hence, SMEs were likely to experience
higher growth after accessing microcredit than before. These findings agree with
Kinyanjui (2006) concerning growth in number of employees that many women-
owned MSEs are being created every year but the sizes remain small majority
employing one to two employees.
b. Ho2: Market development strategy has no significant effect on growth of
WEF funded SMEs in Kenya
The P-values of market development on turnover, business worth and number of
employees are 0.032, 0.879 and 0.542 respectively. These results are greater than
0.05 therefore implying that market development had significant impact on growth
dependant variable of turnover, but, had no significant impact on the two growth
dependant business worth and number of employees therefore we accept the
hypothesis that Ho2: Market development strategy has no significant effect on growth
on WEF Funded SMEs.
Kinyanjui (2006) agrees with this study when he posits that many women-owned
MSEs are being created every year but the sizes in terms of sales, profits and
capitalization remain small ma. Further, those businesses that survive have remained

141
small with insignificant growth. This is further confirmed Ndungu and Mwambeo
(2015) that vertical growth is desired for any enterprise since it has been associated
with increased capacity for employment generation (Ndungu & Mwambeo, 2015).
These findings concur with KIPPRA (2006) that limited access to market
information makes SMEs less aware of opportunities in the market. SMEs also face
difficulties accessing markets due to limited market information, poor marketing
capacity and poor market research leading to a discrepancy between the supply and
demand.
c. Ho3: Product development strategy has no significant effect on growth of
WEF funded SMEs in Kenya
The P-values of product development on turnover, business worth and number of
employees are 0.460, 0.392 and 0.187 respectively. These results are greater than
0.05 therefore implying that product development has no significant impact on the
three growth dependent variables of turnover, business worth and number of
employees therefore we accept the hypothesis Ho3: Product development strategy has
no significant effect on growth on turnover, business worth and number of
employees of WEF funded SMEs.
According to Oumo and Rombo (2013) argue that the growth and expansion of
SMEs requires sustained investment in working capital. However, at low levels of
net profits, the accumulation of such capital may be difficult. Net profits provide a
natural way through which SMEs build their financial base and replenish working
capital. As net profits increase, so is the likelihood that an SME is experiencing
growth (Oumo & Rombo, 2013).
d. Ho4: Diversification strategy has no significant effect on growth of WEF
funded SMEs in Kenya
No test was run for the diversification strategies due to low number of respondents
therefore the study cannot accept or reject the hypothesis

142
Ho4: Diversification strategy has no significant effect on growth on turnover,
business worth and number of employees of WEF Funded SMEs.
Mutai (2011) posits that the SME sector is still characterized by low productivity,
low product quality, lack of diversification in product range and the dominance of
trading activities.
Hence, we rejected the first hypothesis on market penetration and accepted the other
two hypotheses (Market development and product development) but we neither
rejected or accept the fourth hypothesis due to insignificant and contrary results.
There is a need to further explore diversification strategy and its impact on growth
with larger sample that may give us significant results.

143
CHAPTER FIVE
SUMMARY, CONCLUSIONS AND RECOMMENDATIONS
5.1 Introduction
This chapter provided the summary of the key findings, conclusion and
recommendations from the empirical findings reported in chapter four. The
overarching goal of this study was to identify the influence of competitive strategies
on SMES growth. The conclusions of the study are drawn and recommendations on
the impact of competitive strategies on firm performance are elucidated. The final
section of this chapter suggests areas for further research.
5.2 Summary of Major Findings
Beyond the identification of the perceived growth, the study sought to empirically
establish the effects of competitive strategies on SME growth using regression
model. SMEs growth was defined by three indicators namely; employee growth, total
business worth and monthly turnover. Likewise, the competitive strategies were
measured using market penetration strategy, market development strategy, product
development strategy and diversification strategy. The explained variables of this
study were quantitative while explanatory variables were categorical or exclusively
dummy in nature. Dummy variables can be used in regression models just as easily
as quantitative variables. As a matter of fact, regression model may contain
explanatory variables that are exclusively dummy or qualitative in nature. Therefore,
the data analyses for this study was done using ANOVA model.
Since the independent variables for this study were qualitative in nature and the
dependent variables were quantitative, therefore, ANOVA model helped to assess the
influence of the independent variables on the dependent variables more efficiently
and effectively. In order to avoid multicollinearity problem in the regression model,
the market penetration strategy was used as a reference or base group. It was the base
in the sense that comparisons was done with that omitted category. The results

144
showed that the growth in SMEs was due to some competitive strategies that SMEs
applied. The data were fitted with the ANOVA model. After the analysis of model
fitness and coefficient of determination, the impact of competitive strategies on
growth of SMES was assessed.
5.2.1 Effect of Market Penetration Strategy on the Growth of SMEs
The market penetration strategy had statistically a positive significant effect on
growth of the business. The mean impact of market penetration on growth had a
significant effect. This implied that the strategy does not have impact on employee
size. The market penetration strategy had statistically a positive significant effect on
turnover and business worth of the business. The results showed that a high variation
of the turnover in SMEs was due to the competitive strategies that they were applied.
Market penetration strategy had statistically insignificant effect on employee size.
This study revealed that market penetration was a key strategy of growth among
SMEs. In this study increase of market share was the most used market penetration
strategy, with most respondents using this as their growth strategy. This was
followed by respondents moving to new or bigger spaces to penetrate their existing
markets. The respondents moved from their open market spaces to permanent
structures within their current areas of operation. In this study most of the retailers
sold their wares in open market which meant that having no permanent structures
their stock remained minimal in size. The next most used type of market penetration
strategy was through achieving market dominance with while driving out of
competitors returned the lowest results as per the respondents using this strategy.
5.2.2 Effect of Market Development Strategy on the Growth of SMEs
Market development strategy had no statistically significant effect on growth.
Market development strategy had statistically significant effect on turnover but had
statistically insignificant effect on employee size and business worth.

145
The results of this study indicate that most respondents (93%) leveraged on their
traditional strengths by using good after sales service as the main market
development strategy. SMEs also used Price differentials (75%) as another major
strategy to develop new markets. Most businesses were able to develop new markets
through packaging their products in different sizes to suit different purchasing
capabilities of their clients. Only 3% of the respondents used new media channels to
advertise products or distribution channels or opening new branches as market
development strategies. New media channels were used mainly by the service SMEs
using fliers and posters to advertise their businesses. The respondents opened new
branches by moving their wares to different areas on their market days.
5.2.3 Effect of Product Development Strategy on the Growth of SMEs
However, the product development strategy had insignificant effect on growth of
SMEs. The statistical analysis showed that, the product development strategy had
statistically insignificant effect on turnover, on business worth and also on employee
size. Therefore we accept the hypothesis that Product development strategy has no
significant effect on growth on turnover, business worth and number of employees of
WEF funded SMEs.
Almost half of the SMEs (45%) had invested in some basic form of market research
or market analysis in order to develop new products. About 7% of the respondents
had either invested in new processes for new products, or created new products
closely associated with the current product or reinvented existing product. Low
amounts capitalization was cited as contributing to their inability to develop new
products. WEF loans received by the respondents were small amounts and therefore
not able develop new products due to low capitalization.
5.2.4 Effect of Diversification Strategy on the Growth of SMEs
The diversification strategy was not included in the ANOVA model in this study.
This is because an insignificant number of SMEs applied diversification strategy. As
a result, it was omitted in the regression analysis. The results of the study provided

146
recommendations on how to empower women with competitive strategies to enable
them to grow their businesses. Due to the low levels of capitalization only 8 of the
respondents implemented the diversification strategy which is one common
characteristic of SME sector that are often characterized by low productivity, low
product quality, lack of diversification in product range and the dominance of trading
activities.
5.3 Conclusions
It has been suggested that certain strategic alternatives are typically more appropriate
for a small firm, namely those that avoid direct competition with larger firms and that
involve the development of close customer relationships and product adaptation
SMES that emphasized on market penetration strategy performed better than those
SMES which emphasized on market development and product development
strategies. However, the environment in which such SMEs operate may also have
significant influence on their financial health and the economic status of women
entrepreneurs.
5.4 Recommendations
Drawing from the findings, this section presents some of the key recommendations
that, when implemented, would enhance the SMEs growth of their monthly turnover,
business worth and promote SME growth
The below section provides the suggestions made by the respondents on how they as
well as the government could improve on the effect of competitive strategies.
Entrepreneurs had varied suggestions regarding how to improve implementation of
competitive strategies.
5.4.1 Recommendation in Practice
This study recommends that SMEs should focus on competitive strategies for
increased growth as a means of improving their profitability and survival. Growth in

147
market share is correlated with profitability. Growth in the number of markets
served, in the variety of products offered can be used to provide goods or services
frequently lead to improvements in a firm’s competitive ability.
For SMEs to use purpose of financing as a winning tool, it is imperative that they
objectivize their strategic planning process and adopt formal tools and procedures in
doing so. An informal approach to strategic planning tends to be viewed with
suspicion by potential lenders more so debt-issuers. A formal strategic planning
process lays out the SMEs mission and vision, and operationalizes the company’s
strategy as well as having effective strategic control tools. This enables such SMEs
to score higher in the credit scoring tools and also act as risk mitigants where
consideration for debt arises.
Proper management practices should be emphasized that centres on discipline and
diligence in day to day execution of business affairs. There is need to assist SMEs
gauge their performance, learn from their environments about how to survive the
competitive environment and continuously seek to reposition their key factors of
competitive advantage in line with environmental changes. This would also include
compliance with the law such as tax and licences.
Entrepreneurs also cited the need for training seminars and workshops on financial
literacy. This would help them to adopt proper accounting such as book keeping and
costing of products. This will also help them with sourcing from other financiers
such as UWEZO fund, Youth Fund and Micro Finance banks.
One of WEFs objectives is to facilitate marketing of products and services of women
in local and international markets. The larger SMEs in this study propose that WEF
should support them with market linkages as well as reduce information asymmetry
regarding markets for their products. Government, through bulletins and
publications, could also disseminate timely/relevant information in regard to the
investment atmosphere, thus empowering people in the field.
148
Entrepreneurs also suggested the need to consult more for financial options such as
banks and SACCOs, save more due to restrictions in accessing WEF loans through
group guarantee model. These include the need to accumulate assets (real estate,
goods and services) for collateral formation.
Entrepreneurs recognized the need for healthy competition as an incentive to
improve marketing of goods and services as well as reducing the cost of doing
business such as lower operating costs, sourcing for finances with lower interest rates
and reduced licensing requirements
Finally, WEF should improve on business monitoring of SMEs that have received
loans. It is also necessary that frequent visits be made to know what women have
invested in and monitor their progress. This will increase the likelihood that women
borrowers will receive timely interventions to enable their businesses continue on a
growth and innovation path.
5.4.2 Recommendation for Policy
This study recommends that the government as the regulatory authority should
reduce the cost of doing business through increased subsidies, to reduce tax rates and
streamline licensing. The traders wanted county governments to reduce cess fees
charged across neighboring markets to spur trade across counties.
In order to facilitate faster movement of goods and services, especially fresh
produce, it was felt that there was a need to improve on transport system. The area
of the study being mainly an agricultural region with poor infrastructure limited the
movement of farm produce to various markets.
Entrepreneurs also felt that they needed to be consulted when policies were being
formulated. Entrepreneurs encouraged that WEF should not consider group size
when developing financing strategies and this was important given loan guarantee
parameters under consideration when giving loans.

149
Loan allocation ceilings should be significantly increased. In most instances, the
amounts of funds allocated to borrowers fall far below the actual financial needs of a
business. Individual Funding through the CWES stream should be remodelled
towards more individual lending. This will give prospective borrowers the freedom
of investment choice. As opposed to group interests, individual initiative can spur
greater growth and innovation.
Entrepreneurs also felt that collateral requirements for the CWE channel of WEF
funding was a major barrier to accessing loans and that this, along with the loan
application process in general, also needed to be addressed.
5.5 Areas for Further Research
Future studies should explore environmental factors influencing the performance of
women-owned SMEs. These include internal factors on the quantity and quality of
their financial, human and physical resources. The firm’s external environment
consists of all the conditions and forces that affect its strategic options and define its
competitive situation.
There are moderating variables, which may influence the relationship between the
independent and dependent variables. Such as, entrepreneurial competencies may
include the level and quality of guidance; and entrepreneur’s experience, location of
business. These may also need to be accounted for in future research.
The study focused on two rural constituencies (out of 290 constituencies in the
country). Constituencies in urban areas and the arid/semi arid areas were excluded
from the study. It would be interesting to study these to two areas because the
business environment are different from the one in the study. Future research could
focus on SMEs in these areas. Secondly, most of the respondents were micro-
entrepreneurs. There is a small segment of medium-sized enterprises that have
benefitted from WEF purposive sampling to study these enterprises to determine
their growth and innovation patterns.

150
REFERENCES
Aaker, D.A. (1999). Strategic market management. New York: Wiley
Aarnio, T., & Hamalainen, B.A.A., (2008). Challenges in packaging waste
management in the fast food industry. Resources, Conservation and
Recycling, (52), 612-621.
Achtenhagen, L., Naldi, L., & Melin, L. (2010). Business growth”: do practitioners
and scholar really talk about the same thing? Entrepreneurship Theory
and Practice, 34(3), 289-316.
Ahmad, S. Z., Xavier, S. R., Perumal, S., Nor, M. L. & Mohan C. J. (2011). The
transition from corporate careers to business ownership: The case for
women entrepreneurs in Malaysia. International Journal of Business
Administration, 2(3).
Ansoff, H.I. (1957). Strategies for Diversification. Harvard Business Review. 35,
113-24.
Ansoff, H.I. (1987). Corporate strategy. New York: McGraw Hill publishers
Antoncic, J. A., & Antoncic, B. (2011). Employee satisfaction Intrapreneurship and
firm growth: a model. Industrial Management & Data Systems, III(4),
589- 607.
Anyanga, S.O & Nyamita, M.O. (2016). The Major Growth Strategies Adopted by
Small and Medium Enterprises in Kenya: A Case of Kisumu County.
International Journal of Advanced and Multidisciplinary Social Science,
2(1), 11-26.
Armstrong, M. (2006). Human resource practice and system thinking. London:
Kegan Page Limited Publishers

151
Arregle, J., Batjargal, B., Hitt, M., Webb, J., Miller, T. & Tsui, A. (2013). Family
ties in entrepreneurs ‘social networks’ and new venture growth.
Entrepreneurship Theory and Practice, 3, 1-32
Atieno, R. (2009). Linkages, access to finance and the performance of small-scale
enterprises in Kenya. Research Paper No. 2009/06. New York: World
Institute for Development Economics Research.
Barnat, R. (2012). Introduction to Management. Retrieved from
http://www.introduction-to-management.24xls.com/en222.
Barney, J.B. (2001). Is the Resource-Based View a Useful Perspective for Strategic
Management Research?. Academy of Management Review, 26(1), 41–
56.
Barringer, B. R., Jones, F. F., & Neubaum, D. O. (2005). A quantitative content
analysis of the characteristics of rapid growth firms and theirs founder.
Journal of Business Venturing, 20(5), 663-687.
Beekman, A., & Robinson, R.B. (2004). Supplier partnerships and the small, high-
growth firm: selecting for success. Journal of Small Business
Management, 42(1), 59-77.
Bentzen, J., Madsen, E. S., & Smith, V. (2012). Do firm’s growth rates depend on
firm size?. Small Business Economics, 39(4), 937-947.
Bernard, B & Koerte, P. (2007). Strategic Responses to Multiple Dimensions of
Lowcost-Country Competition. Frankfurt: EMP, European Management
Publication.
Bharradwaj, S., Clark, T., & Kulviwat, S. (2005). Marketing, Market growth and
Endogenous growth theory: An inquiry into the case of market growth.
Journal of the academy of marketing science, 33(3), 347-359.

152
Blattman, C., Fiala, N. & Martinez, S. (2013). Credit constraints, occupational
choice, and the process of development: long run evidence from cash
transfers in Uganda. Retrieved from: http://cega.berkeley. edu/
assets/cega_events/53/WGAPE_Sp2013_Blattman.pdf
Box, T.M. (2011). Small firm strategy in turbulent times. Academy of Strategic
Management Journal, 10, 115–122.
Brenner, T., & Schimke, A. (2015). Growth development paths of firms: a study of
smaller businesses. Journal of Small Management, 53(2), 539-557.
Brito, L.A.L., & Vasconcelos, F.C. (2009). The variance composition of firm growth
rates. Brazilian Administration Review, 6(2), 118-136.
Brito, L.A.L., Brito, E.P.Z., & Vasconcelos, F.C. (2007). Ser uma empresa grande é
vantagem para crescer?. Faces: Revista de Administração, 6(2), 61-75.
Brush, C.G., Ceru, D.J., & Blackburn, R. (2009). Pathways to entrepreneurial
growth: the influence of management, marketing, and money. Business
Horizons, 52(5), 481-491.
Bumgardner, M., Buehlmann, U., Schuler, A., & Crissey, J. (2011). Competitive
actions of small firms in a declining market. Journal of Small Business
Management, 49, 578–598.
Burns, P. & Harrison, J. (1996). Small Business and Entrepreneurship (2nd Ed.)
(pp.73-93). Basingstoke: Palgrave Macmillan Business.
Burns, P. (2002). Entrepreneurship and small business (p. 246). Hampshire:
Palgrave Macmillan Business.
Campbell, D., Edgar, D. & Stonehouse, G. (2011). Business Strategy: an
Introduction, Australia: Palgrave Macmillan.

153
Carson, D. J. (1985). The evolution of marketing in small firms. European Journal of
Marketing, 19(5), 7-16.
Castrogiovanni, G.J., & Justis, R.T. (2002). Strategic and contextual influences on
firm growth: an empirical study of franchisors. Journal of Small Business
Management, 40(2), 98-108.
Central Bureau of statistics, (1999). ICEG and K-REP, National MSE Baseline.
Nairobi: Central Bureau of statistics.
Chandler, A. (1962). Strategy and structure. Cambridge, MA: MIT Press.
Chandler, G.N., Mckelvie, A., & Davidsson, P. (2009). Asset specificity and
behavioral uncertainty as moderators of the sales growth: employment
growth relationships in emerging ventures. Journal of Business
Venturing, 24(4), 373-387.
Chandler, V. (2010). The economic impact of the Canada small business financing
program. Canada: Public Works and Government Services.
Chatain, O. (2010). Value creation, competition and performance in buyer supplier
relationships. Retrieved from: onlinelibrary.wiley.com/doi/ 10. 1002/
smj.864
Chepkwony, C.P. & Sang, C. (2017). Effect of Women Enterprise Fund on
performance of micro-enterprises in Kericho County. International
Journal of Economics, Commerce and Management United Kingdom,
V(10).
Churchill, N.C. & Lewis, V.L. (1983). The five stages of small business
growth. Harvard Business Review, 61(3), 30–50.
Clarke, J., Holt, R., & Blundel, R. (2014). Re-imagining the growth process: (co)-
evolving metaphorical representations of entrepreneurial growth.
154
Entrepreneurship and Regional Development: International Journal
(Toronto, Ont.), 26(3-4), 234-256.
Coad, A., & Tamvada, J. P. (2012). Firm growth and barriers to growth among small
firms in India. Small Business Economics, 39(2), 383-400.
Coad, A., Frankish, J., Roberts, R. G., & Storey, D. J. (2013). Growth paths and
survival chances: an application of Gambler’s Ruin theory. Journal of
Business Venturing, 28(5), 615-632.
Coleman, S. (2007). The Role of Human and Financial Capital in the Profitability
and Growth of Women Owned Small Businesses. Journal of Small
Business Management, 45(3), 303-319.
Cooper, D. R. & Schindler, P. S. (2010). Business research methods. NY: McGraw-
Hill Irwin.
Cordeiro, W. P. (2013). Small businesses ignore strategic planning at their peril.
Academy of Business Research Journal, 3, 22–30.
Craig, B.R., Jackson, III W.E. & Thomson J.B. (2007). Does government
intervention in the small-firm credit market help economic performance?
Policy Discussion Paper Number 22, Cleveland: Federal Reserve Bank
of Cleveland.
Cressy, R. (2009). Determinants of small firm survival and growth. In: M. Casson, B.
Yeung, A. Basu and N. Wadeson. The Oxford handbook of
entrepreneurship (pp. 161-193). Milton Keybnes: Oxford University
Press.
Crosby, P. (1979). Quality is free: The art of making quality certain. New York:
McGraw-Hill.

155
Crosby, P. (1986). Running things: The art of making things happen. New York:
McGraw-Hill.
Datta, Y. (2009). A Critique of Porter’s cost leadership and differentiation strategies.
Chinese Business Review; April 2018, 9(4), 37.
Daunfeldt, S-O., & Elert, N. (2013). When is Gibrat’s law a law? Small Business
Economics, 41, 133-147.
Davidsson, P., Achtenhagen, L., & Naldi, L. (2010). Small firm growth. Foundations
and Trends in Entrepreneurship, 6(2), 69-166.
Davidsson, P., Steffens, P., & Fitzsimmons, J. (2009). Growing profitable or growing
form profits: putting the horse in front of the cart? Journal of Business
Venturing, 24(4), 388-406.
Davies, G.J., & Smith, J.L. (2004). Fast food: dietary perspectives. Nutrition and
Food Science, 3(2), 80-82.
Davis, A.E., & Shaver, K.G. (2012). Understanding Gendered variations in business
growth intentions across the life course. Entrepreneurship Theory and
Practice, 36(3), 495-512.
Day, G.S. (1992). Marketing’s contribution to the strategy dialogue. Journal of the
Academy of Marketing Science, 20(4), 323–329.
Day, G.S. (1994). The capabilities of market-driven organizations. Journal of
Marketing, 58(4), 37–51.
Day, G.S. (1999). Market-driven strategy. Cambridge: Free press.
Day, G.S., & Wensley, R. (1988). Assessing advantage: a framework for diagnosing
competitive superiority. Journal of Marketing, 52(2), 1–20.

156
Delmar, F., & Wiklund, J. (2008). The Effect of small business managers ‘growth
motivation on firm growth: a longitudinal study. Entrepreneurship
Theory and Practice, 32(3), 437-457.
Delmar, F., Davidsson, P., & Gartner, W. B. (2003). Arriving at the high growth
firm. Journal of Business Venturing, 18(2), 189-216.
Deng, Z., Hofman, P.S. & Newman, A. (2013). Ownership concentration and
product innovation in Chinese private SMEs. Retrieved from:
https://doi.org/10.1007/s10490-012-9301-0
Dobbs, M., & Hamilton, R.T. (2007). Small business growth: recent evidence and
new directions. International Journal of Entrepreneurship Behaviour and
Research, 13(5), 296-322.
Doern, R. (2009). Investigating barriers to SME growth and development in
transition environment”: a critique and suggestions for developing the
methodology. International Small Business Journal, 27(3), 275- 305.
Dollinger, M.J. (2008). Entrepreneurship Strategies and Resources. Lombard,
Illinois: Marsh Publications.
Douglas, E. (2013). Reconstructing entrepreneurial intentions to identify
predisposition for growth. Journal of Business Venturing, 28(5), 633-
651.
Douglas, W., John, F. & Ibrahim, S. (2008). Strategic marketing management.
Creating competitive advantage, (2nd ed. Pp. 263-266). New York:
Prentice Hall
Drazin, R. & Howard, P. (1984) Strategy Implementation: A Technique for
Organizational Design, Columbia Journal of World Business, 19, 40-46.

157
Dunkelberg, W.G., Cooper, A.C., Woo, C. & Dennis, W.J. (1987). New firm growth
and performance in Churchill, Nairobi: N.C.
Dutta, D. K., & Thornhill, S. (2008). The evolution of growth intentions: toward a
cognition-based model. Journal of Business Venturing, 23(3), 307-332.
Dyer, J.H. & Singh, H. (1998). The Relational View: Cooperative Strategy and
Sources of Interorganizational Competitive Advantage. Academy of
Management Review, 23(4).
Eagle, L., & Brennan, R., (2007). Beyond advertising: in-home promotion of fast
food. Young Consumers, 8(4), 278-288.
Eriksson, J. (2006). Resources and Entrepreneurial Orientation: Empirical findings
from the software industry of Sri Lanka. Retrieved from
http://www.divaportal.org/diva/getDocument?urn_nbn_se_hj_diva-786-
1_fiulltext.pdf
Estrella, A., & Bataglia, W. (2013). A influência da rede de alianças no crescimento
das empresas de biotecnologia de saúde humana na indústria brasileira.
Organização and Sociedade, Salvador, 20(65), 321-340.
Ethiraj, S.K., Kale, P., Krishnan, M.S. & Singh, J.V. (2005). Where do capabilities
come from and how do they matter? A study in the software services
industry. Retrieved from: onlinelibrary.wiley.com/doi
Federico, J.S., & Capelleras, J.L. (2015). The heterogeneous dynamics between
growth and profits: the case of Young firms. Small Business Economics,
44(2), 231-253.
Ferreira, J. & Azevedo, S. O. (2008). Entrepreneurial orientation (EO) and growth of
firms: Key lessons for managers and business professionals. Problems
and perspectives in management, 2 (1), 81-87. Retrieved from
http://www.businessperspectives.org

158
Ferreira, J., & Azevedo, S.G. (2007). Entrepreneurial orientation as a main resource
and capacity on small firms’ growth. Retrieved from
http://204.19.44.91/FondationlEntrepreneurial%200rientation.pdf.
Fleming, D.M., Chow, C.W., & Chen, G., (2009). Strategy, Performance-
measurement systems, and performance: A study of Chinese firms. The
International Journal of Accounting, 44, 256-278.
Foss, N.J., & Klein, P.G. (2004). Entrepreneurship and the economic gain of the
firm: Any gains from trade? Retrieved from: www.mises.org.
Free Management (2015). Retrieved from http://www.free-management-
ebooks.com/faqst/ansoff-02.htm.
Garvin, D., & March, A. (1986). A note on quality: The views of Deming, Juran, and
Crosby. Harvard Business School, 9, 687-011.
Gilligan, C. & Wilson, R. (2009). Strategic Marketing Planning, United Kingdom:
Elsevier.
Gima, K.A., & Li, H., (2001). Product Innovation Strategy and performance of new
technology ventures in China. Academy of Management Journal, 44,
1123-1134.
Government of Kenya (2008). Mid-term review of the Vision 2030. Nairobi:
Government Printer.
Government of Kenya (2009). Economic Survey Report 2008. Nairobi: Government
Printers.
Government of Kenya, (2006). Micro and Small Enterprises Bill. Nairobi:
Government Printer.
159
Government of Kenya, (2014). Review of the implementation of the Beijing platform
for action. Retrieved from https://sustainabledevelopment.un.org/
content/ documents/ 13118Kenya_review_Beijing20.pdf
Government of Kenya, (2017). Economic Survey Report 2016. Nairobi: Government
Printers.
Greene, W.H. (2002). LIMDEP 8.0 Econometric modeling guide. Plainview, NY:
Econometric Software.
Greiner, L.E. (1972). Evolution and revolution as organizations growth. HBR July-
August, 1972, 37.
Gujarati, D.N. (2007). Basic econometrics. India: McGraw-Hill Education (India)
Pvt Limited
Hair, F., Money, A. Samouel, P., & Page, M. (2007). Research Methods for
Business. England: John Wiley & Sons.
Hall, D., & Lobina, E., (2007). Profitability and the poor: Corporate strategies,
innovation and sustainability. Geoforum. 38, 772-785.
Hamilton, R.T. (2010). How firms grow and the influence of size and age.
International Small Business Journal, 30(6), 611-621.
Hassan, I. B. & Mugambi, F. (2013). Determinants of growth for women owned and
operated micro enterprises: The case of Garissa, Kenya. International
Journal of Business and Commerce, 2(7), 45-55.
Hauc, A., & Kovac, J. (2000). Project Management in Strategy Implementation –
Experiences in Slovenia, International Journal of Project Management,
18, 61-67.

160
Hay, M. & Kamshad, K. (1994). Small firm growth: intentions, implementation and
impediments. Business Strategy Review, 5(3), 49–68.
Headd, B. (2003). Redefining Business Success: Distinguishing Between Closure
and Failure. Small Business Economics, 21, 51-61.
Headd, B., & Kirchhoff, B. (2009). The growth, decline and survival of small
businesses: an exploratory study Growth of small businesses of life
cycles. Journal of Small Business Management, 47(4), 531-550.
Hellen, H. (2002). Micro-Enterprise Development: Nairobi: Food and Research
Management. Retrieved from: http://www.businessdailyafrica.com/
Women-fund-set-to-raise-its-lending-as-cost-of-loans-rises-/-/539546/
1313500/-/msorp1z/-/index
Hermans, J., Vanderstraeten, J., Dejardin, M., Ramdani, D., Stam, E., & Van
Witteloostuijn, A. (2012). Ambitious entrepreneurship: antecedents and
consequences (Research paper 2012-023). Antwerpen: University of
Antwerp.
Higgins, R. (1977). How much growth can a firm afford. Financial Management,
6(3), 7-16.
Hollensen, S. (2010). Marketing Planning a Global Perspective, UK: McGraw Hill.
Hoogstra, G. J., & Djik, J. V. (2004). Explaining firm employment growth: does
location matter? Small Business Economics, 22(3/4), 179-192.
Hornaday, J.A., Kirchoff, B.A., Krasner, C.J. & Vesper, K.H. (ed.). Frontiers of
entrepreneurship research, Boston (Mass.): Babson College.
Hughes, P., & Morgan, R. E. (2007). A resource-advantage perspective of product–
market strategy performance and strategic capital in high technology
firms. Industrial Marketing Management, 36(4), 503–517.

161
Hussain, S., Khattak, J., Rizwan, A., & Latif, M.A. (2013). Ansoff matrix,
environment, and growth - An interactive triangle. Management and
Administrative Sciences Review, 2(2), 196-206.
Ijaza, A.K., Mwangi, S.W. & Ng’etich, K.A. (2014). Challenges faced by the
Women Enterprise Fund in Kenya; A survey of Hamisi constituency,
Vihiga County - Kenya. Research on Humanities and Social Sciences,
4(14).
International Labour Organization & Asian Development Bank (2011). Women and
labour markets in Asia: Rebalancing for gender equality in labour
markets in Asia. Bangkok: ILO Regional Office for Asia and the Pacific;
Asian Development Bank.
International Labour Organization, (2008). Women entrepreneurs in Kenya & factors
affecting women entrepreneurs in micro and small enterprises in Kenya.
Geneva: ILO.
Janssen, F. (2009a). Do manager’s characteristics influence the employment growth
of SMEs? Journal of Small Business and Entrepreneurship, 19(3), 293-
315.
Janssen, F. (2009b). Does the environment Influence the employment growth of
SMEs? Journal of Small Business and Entrepreneurship, 22(3), 311-326.
Janssen, F. (2009c). The conceptualization of growth: are employment and turnover
interchangeable criteria? The Journal of Entrepreneurship, 18(21), 21-
45.
Jarratt, D., & Stiles, D. (2010). How are methodologies and tools framing managers'
strategizing practice in competitive strategy development?. British
Journal of Management, 21(1), 28-43.

162
Johns, A, N. & Pineb, R. (2002). Consumer behaviour in the food services industry:
a review. Hospitality management, 21, 119-134.
Johnson, G., Scholes, K. & Whittington, R. (2008). Exploring corporate strategy.
(8th edition). London: Prentice-Hall.
Julien, P.A. (2002). Les PME à forte croissance. L’exemple de 17 gazelles dans 8
regions du Québec. Sainte-Foye: Presses de l’Université du Québec.
Julien, P.A. (2010). Empreendedorismo e economia do conhecimento. São Paulo:
Saraiva.
Juran, J. (1988). Quality control handbook. New York, McGraw-Hill.
Kantor, P. (2001). Promoting women’s entrepreneurship development based on good
practice programmes: Some experiences from the north to the south.
Geneva: ILO.
Karlan, D. & Jacob, A. J. (2011). More than good intentions: Improving the ways the
world's poor borrow, save, farm, learn, and stay healthy. London: Dutton
Press.
Kenya National Bureau of Statistics, (2010). The 2009 Kenya Population and
Housing Census; Population Distribution by Administrative Units:
Republic of Kenya. Nairobi: Kenya National Bureau of Statistics.
Kenya National Bureau of Statistics, (2016). Economic Survey 2016. Nairobi: Kenya
National Bureau of Statistics.
Khandker, S.R. (2012). Grameen Bank lending: Does group liability matter? Policy
Research Working Paper No. 6204. Geneva: World Bank Group:
Development Research Group.

163
Kiechel, W. (1981a). The decline of the experience curve. Fortune, October (5), 139-
146.
Kiechel, W. (1981b). Three or four or more ways to win. Fortune, October (19),
181-183.
Kihonge, E. (2014). The Role of Small and Medium Enterprises (SMEs) in small
towns in Rural-Urban continuum: The Karatina in Mt. Kenya Region,
Central Kenya. Retrieved from https://www.researchgate.net/
publication/281534192
Kinyanjui, M.N. (2006). Overcoming barriers to enterprise growth: The experience
of MSEs in rural central Kenya. Nairobi: Longhorn
Kiraka, R.N., Kobia, M. & Katwalo, A.M. (2013). Micro, small and medium
enterprise growth and innovation in Kenya: A Case study on the Women
Enterprise Fund. ICBE-RF Research Report No. 47/13
Kirchhoff, B. A. (1991). Entrepreneur’s contribution to economics. Entrepreneurship
Theory and Practice, 16(2), 93-112.
Kirunja, M.M. (2011). Strategic management practices in small and medium
enterprises at Kariobangi light industries, Nairobi.
Koen, P. (2007). Product development research and technology management
Butterwoths (2nd edition), Butterwoths, 46-55.
Kotelnikov, V. (2010). New Paradigm: Resource-Based Theory. Retrieved from
http://www.1000ventures.com/business_guide/mgmt_stategic_resource-
based.html
Kotha, S., & Vadlamani, B. L. (1995). Assessing generic strategies: an empirical
investigation of two competing typologies in discrete manufacturing
industries. Strategic Management Journal, 16, 75–83.

164
Kothari, C.R. (2008). Research methodology: Methods and techniques, (2nd Rev.
Ed.) New Delhi: New Age International Limited Publishers.
Kothari, C.R. (2009). Research methodology: Methods and techniques. New Delhi:
New Age International (P) Ltd.
Kothari, N. & Pals, D. (1993). Introduction to educational research. Njoro: Egerton
University
Kotler, P. & Armstrong, G. (2008). Principles of marketing. (2nd ed. Pp. 67-69). New
York: McGraw Hill international Publishers.
Kotler, P., Brown, L., Adam, S., Burton, S. & Armstrong, G. (2007). Marketing,
Australia: Pearson Education Australia, Frenchs Forest.
Leitch, C., Hill, F., & Neergaard, H. (2010). Entrepreneurial and business growth and
the quest for a “comprehensive theory: tilting at Windmills?
Entrepreneurship Theory and Practice, 34(1), 249-260.
Lichtenthaler, E., (2005). Corporate Diversification: identifying new businesses
systematically in the diversified firm. Technovation, (25), 697-709.
Lobonțiua, G. & Lobonțiua, M. (2013). The Owner-manager and the functional
management of a small firm. Procedia-Social and Behavioral Sciences,
124(2014), 552 – 561.
Longenecker, J.G., Moore, C.W., Petty, J.W., & Palich, L.E. (2006). Small business
management: An entrepreneurial emphasis. Mason, oh: South-Western.
Lotti, F., Santarelli, E., & Vivarelli, M. (2009). Defending Gibrat’s law as a long-run
regularity. Small Business Economics, 32(1), 31-44.
http://dx.doi.org/10.1007/ s11187-007-9071-0.

165
Machado, H.P.V (2016). Growth of small businesses: a literature review and
perspectives of studies. 430 Gest. Prod., São Carlos, 23(2), 419-432.
Machado, H.P.V., (2016). 432 Gest. Prod., São Carlos, 23(2), 419-432.
Machira, H.K., Njati, I.C., Thiaine, K.S. & Guyo H.S. (2014). Accessibility of
Women Enterprise Fund among small and Micro Women Enterprise
Owners in Tharaka South District, Kenya. IOSR Journal of Business and
Management, 16(1), 79-103.
Macmillan, H. & Tampoe, M. (2000). Strategic Management, Oxford University
Press. Vignali, C. (2001), Virgin Cola, British Food Journal, 103(2).
Mairura, C.J., Namusonge, G.S. & Kabare, K. (2013). The role of financial
intermediation in the growth of small and medium manufacturing
enterprises in Kenya: A survey of small and medium enterprises in
Nairobi. International Journal of Advanced Research in Management
and Social Sciences, 2(5).
Marmullaku, B. & Ahmeti, F.B (2015). Factors affecting marketing strategies:
pricing, channel, structure and advertising strategies. International
Journal of Economics, Commerce and Management United Kingdom.
III(6).
Marques, A., Lisboa, J., Zimmerer, T.W. & Yasin, M.M. (2000). The effectiveness
of strategies employed by dominant firms in the Portuguese crystal glass
industry: a empirical investigation. European Business Review. 12(1), 34-
40.
Martin J. D., & Sayrak, A., (2003). Corporate diversification and shareholder value:
A survey of recent literature. Journal of Corporate Finance, 9, 37-57.
166
Masurel, E., & Janszen, R. (1998). The Relationship between SME Cooperation and
Market Concentration: Evidence from Small Retailers in the Netherlands.
Journal of Small Business Management; Milwaukee, 36(2), 68-73.
Mata, J. & Portugal, P. (2002). The Survival of new domestic and foreign owned
firms. Strategic Management Journal, 23, 323-43.
Mbiti, F. M, Mukulu, E., Mung’atu, J. & Kyalo, D. (2015). The influence of socio-
cultural factors on growth of women-owned micro and small enterprises
in Kitui County, Kenya. International Journal of Business and Social
Science, 6(7).
Mburu, C. & Guyo, W. (2015). Influence of Women Enterprise Fund on the growth
of women owned enterprises in Kenya. A Case study of Dagoretti north
Constituency in Nairobi County. International Journal of Social Sciences
Management and Entrepreneurship, 2(1), 185-201.
McCormick, D. (2001). Gender in Small Enterprise in Kenya: An Institutional
Analysis, in Stevenson, L & St-Onge, A. (2005). Support for growth-
oriented women entrepreneurs in Kenya. International Labour
Organization.
McDonald, M. & Wilson, H. (2011). Marketing Plans, how to prepare them how to
use them, United Kingdom: John Wiley & Sons.
McKelvie, A., & Wiklund, J. (2010). Advancing firm growth research: a focus on
growth mode instead of growth rate. Entrepreneurship Theory and
Practice, 34(1), 261-288.
Megicks, P.B., (2002). Competitive strategy and firm size in the estate agency
industry. Journal of Small Business and Enterprise Development, 9(2),
150 – 161.

167
Mensah, A. (2013). Strategic Resources and Performance of Rural SMEs.
International Journal of Business and Social Research (IJBSR), 3(4).
Miller, D., (1987). The structural and environmental correlates of business strategy.
Strategic Management Journal, 8, 55-76.
Mills, J. (2010). Resource and Competence-based Strategy. Retrieved from
http://www.ifm.eng.cam.ac.uk/csp/summaries/res_competence.html
Ministry of Industrialization and Enterprise Development (2015). Kenya’s Industrial
Transformation Programme
Mintzberg, H. (1979). Patterns in strategy formation. International Studies of
Management and Organizations, 9(3), 67-86.
Mintzberg, H. (1994). The rise and fall of strategic planning: Reconceiving the roles
for planning, plans, planners. London: Free Press.
Mintzberg, H., (1978). Patterns in strategy formation. Management Science, 24(9),
934- 948.
Mirzakhani, M., Parsaamal, E., & Golzar, A. (2014). Strategy formulation with
SWOT matrix: A case study of an Iranian company. Global Business and
Management Research, 6, 150–168.
Mishina, Y., Pollock, T.G., & Porac, J.F., (2004). Are more resources always better
for growth? Resource stickiness in market and product expansion.
Strategic Management Journal, 25, 1179–1197.
Mohr, V. & Garnsey, E. (2011). How do high-growth firms grow? Evidence from
Cambridge, UK. Working Paper No: 2011/04, August 2011. Cambridge:
University of Cambridge.

168
Morduch, J. (1999). The microfinance promise. Journal of Economic Literature,
37(4), 1569-1614.
Moreno, A.M., & Casillas, J.C. (2008). Entrepreneurial orientation and growth of
SMEs: a causal model. Entrepreneurship Theory and Practice, 32(2),
507-528.
Moyi, E.D. (2013). Credit and Employment Growth among Small Enterprises in
Kenya. International Journal of Business and Economics Research, 2(3),
69-76.
Mugenda, O.M & Mugenda, A. G. (2003). Research methods: Quantitative and
qualitative approaches. Nairobi. ACTS Press.
Mugenda, O.M. & Mugenda, A.G. (1999). Research methods: qualitative and
Quantitative approaches. Nairobi. ACT Press
Muriungi, F.M. (2012). The challenges facing small-scale women entrepreneur. Case
of Kenya. International Journal of Business Administration, 3(2), 112-
114.
Murphy, P.J. (2011). A 2 X 2 Conceptual foundation for entrepreneurial discovery
theory. Retrieved from: WWW/Allbusiness.com,
Mutai, R. (2011). Micro and Small Enterprise Sector and Existing Support System
with emphasis on High-Tech oriented Entrepreneurship in Kenya.
Journal of Language, Technology and Entrepreneurship in Africa, 3(1).
Mwangi, P.K. (2016). Influence of Strategy Implementation on the Performance of
Manufacturing Small and Medium Firms in Kenya. Retrieved from
http://ir.jkuat.ac.ke

169
Mwobobia, F.N. (2012). The Challenges Facing Small-Scale Women Entrepreneurs:
A Case of Kenya. Retrieved from http://dx.doi.org/10.5430/
ijba.v3n2p112
Namusonge, G.S. (2010). Business Statistics: Concepts and Applications. Beau
Bassin, Mauritius: VDM Publishing House Ltd.
Navaretti, G.B. (2014). Age and firm growth: evidence from three European
countries. Small Business Economics, 43(4), 823-837.
Ndung’u, E.N. & Mwambeo, H.M. (2015). Factors leading to poor performance and
subsequent closure of small businesses in Kenya: The case of Thika sub
county. The International Journal of Humanities & Social Studies, 6.
Neumark, D., Wall, B., & Junfu, Z. (2011). Do small businesses create more jobs?
New evidence for the United States from the national establishment time
series. Review of Economics & Statistics, 93, 16–29.
Njeru, A.W., Namusonge, G.S., & Kihoro, J.M. (2013). Determinants of choice of
entrepreneurial finance for small and medium sized enterprises: A survey
of Thika District. Journal of Human Resource and Entrepreneurship
Development, 4(1), 109 – 117.
OECD, (2005). The Measurement of Scientific and Technological Activities:
Guidelines for Collecting and interpreting Innovation data: Oslo manual,
(3rd edition). Paris: OECD
OECD, (2014). Promoting Entrepreneurship and innovative SMES in a global
Economy: Towards a more responsible and inclusive globalization,
Instabul, Turkey. OECD.
Omri, A, & Ayadi-Frikha, M. (2014). Constructing a meditational model of small
business growth. International Entrepreneurship Management, (10), 319-
342.

170
Ongori, H. & Migiro, S.O. (2011). Enhancing SMEs competitiveness: The strategies
to resolve barriers to information communication technologies adopted
by SMEs. A paper presented in 2011 International Conference on
Innovation and Growth: University of Botwsana.
Ouma, C.O. & Rambo, C.M. (2013). The impact of microcredit on women owned
small and medium enterprises: Evidence from Kenya. Global Journal of
business research. 7(5).
Papadiki, E. & Chami, B. (2002). Growth Determinants of Micro-Businesses in
Canada. Canada: Small Business Policy Branch Industry Canada.
Parker, S., Storey, D., & Witteloostuijn, J. (2010). What happens to gazelles? The
importance of dynamic management strategy. Small Business Economics,
35(2), 203-226.
Parnell, J.A. (2013). Uncertainty, generic strategy, strategic clarity, and performance
of retail SMEs in Peru, Argentina, and the United States. Journal of
Small Business Management, 51, 215–234.
Pearce II, J.A., & Robinson, R.B. (2005). Strategic Management. (Ninth Edition)
New Delhi: McGraw-Hill.
Pearce, J.A. & Robinson, R.B. (2011). Strategic management: Formulation,
implementation and control. New York: McGraw-Hill/Irwin.
Pecas, P, & Henriques, E. (2006). Best Practices of Collaboration between
University and Industrial SMEs, Benchmarking: An International
Journal, 2006.
Penrose, E. (2006). A teoria do crescimento da firma. Campinas: Editora da
Unicamp.
171
Penrose, E.T. (1959). The theory of the growth of the firm. New York: Oxford
University Press.
Perry, C. (1987). Growth strategies for small firms: Principles and case studies. Sage
Journals, 5(2).
Peter, B.K. (2001). Impact of Credit on Women-Operated Micro-Enterprises in
Uasin Gishu District, Kenya. Geneva: ILO, Retrieved from:
http:/books.google.com.my book/book?
Philbrick, C., & Fitzgerald, M. (2007). Women in Business-owning
Families: a Comparison of Roles, Responsibilities and Predictors of
Family Functionality. Journal of Family and Economic, 28, 618-634.
Porter, D.R. (2012). Managing growth in America's communities. Island: Island
Press.
Porter, M. (1985). Competitive advantage: Creating and sustaining superior
performance. New York: Free Press.
Porter, M. (1996). What is strategy? Harvard Business Review, 1, 1996.
Porter, M.E. & Lee, T.H. (2013). The Strategy That Wilt Fix Health Care. Harvard
Business Review, 91(10), 50.
Porter, M.E. (1979). How competitive forces shape strategy. Harvard Business
Review, 57, 86-93. New York: Free Press.
Porter, M.E. (1990). The Competitive advantage. New York: Free Press.
Porter, M.E. (1998). Competitive Strategy: Techniques for Analyzing Industries and
Competitors. New York: Free Press.
Porter, M.E., & Kramer, M.R. (2011). Creating shared value. Harvard business
review, 89(1/2), 62-77.

172
Porto, E.C & Brito, L.A.L. (2010). Aglomeração industrial e seu efeito na taxa de
crescimento das empresas brasileiras. Revista de Administração REAd,
16(2), 447-480.
Ramsden, M. & Bennett, R.J. (2005). The benefits of external support to SMEs: hard
versus soft outcomes and satisfaction levels, Journal of Small Business
and Enterprise Development, 4(3), 227-243.
Rangan, S., Adner, R., & Strategy, E.S. (2012). Profits and the Internet: Seven
misconceptions. MIT Sloan Management Review, 42(4), 44.
Rauch, A. & Rijskik, S.A. (2013). The effects of general and specific human capital
on long-term growth and failure of newly founded businesses.
Entrepreneurship Theory and Practice, (3), 923-941.
Reid, G.C., & Xu, Z. (2012). Generalizing Gibrat: using Chinese evidence founded
on fieldwork. Small Business Economics, 39(4), 1017-1028.
Republic of Kenya (2006). Economic survey. Nairobi: Kenya: The Government
Printer.
Rosa, J.A., & Spanjol, J. (2005). Micro-level product-market dynamics: shared
knowledge and its relationship to market development. Journal of the
Academy of Marketing Science, 33(2), 197–216.
Ross, J. (2009). Total Quality Management. Retrieved from:
https://totalqualitymanagement.wordpress.com/2009/08/27/definition-of-
quality/.
Saunders, M., Lewis, P., & Thornhill, A., (2012). Research Methods for Business
Students (6th ed.) Harlow: Pearson Education.
Saunders, M.N.K, Lewis, P. & Thornhill, A. (2009). Research methods for business
students. NY: Prentice Hall.

173
Schoonjans, B., Cauwenberge, P. V., & Bauwhede, H.V. (2013). Formal business
networking and SME growth. Small Business Economics, 41(1), 169-
181.
Seifert, R.E., & Vizeu, F. (2015). Crescimento organizacional: uma ideologia
gerencial? Documentos e Debates. Revista de Administração
Contemporânea, 19(1), 127-141.
Sharafizad, J. (2011). Determinants of business networking behaviour of women in
small businesses. Small Enterprise Research, 18(2), 158-160.
Shepherd, D., & Wiklund, J. (2009). Are we comparing apples with apples or apples
with oranges? Appropriateness of knowledge accumulation across
growth studies. Entrepreneurship Theory and Practice, 33(1), 105-123.
Sial, A., Usman, M., Zufiqar, S., Satti, A., & Khursheed, I. (2013). Why do public
sector organizations fail in implementation of strategic plan in Pakistan.
Public Policy and Administration Journal, 3(1).
Sims, M., & Regan, N. (2006). In search of gazelles using a research DNA model.
Technovation, 26(8).
Siwadi, P. & Mhangami, M. (2011). An analysis of the performance of women
entrepreneurs in a multi-currency economy: The case of Midlands
province of Zimbabwe. Botswana: University of Botswana Journal.
Slater, S.F., & Olson, E.M. (2001). Marketing’s contribution to the implementation
of business strategy: an empirical analysis. Strategic Management
Journal, 22(11), 1055–1067.
Slater, S.F., Olson, E.M., & Hult, G.T.M. (2006). The moderating influence of
strategic orientation on the strategy formation capability-performance
relationship. Strategic Management Journal, 27(12), 1221–1231.

174
Stam, E. (2010). Growth beyond Gibrat: firm growth processes and strategies. Small
Business Economics, 35(2), 129-135.
Stam, E., & Wennberg, K. (2009). The roles of R& D in new firm growth. Small
Business Economics, 33(1), 77-89.
Starbuck, W.H. (1965). Organizational growth and development, in March,
Handbook of organizations. Chicago: Rand McNally
Steensma, K. H., Marino, L., & Weaver, K. M. (2000). Attitudes toward cooperative
strategies: A cross-cultural analysis of entrepreneurs. Journal of
International Business Studies, 31(4), 591-609.
Stevenson, L & St-Onge, A. (2005). Support for growth-oriented women
entrepreneurs in Kenya. Geneva: International Labour Organization.
Stokes, D. (2003). Thomas learning small business management. Retrieved from
www.mhlw.go.jp
Storey, D. & Sykes, N. (1996). Uncertainty, innovation and management. Small
Business and Entrepreneurship: 25-47. London: Palgrave.
Storey, D. (1994). Understanding the small business sector. London, UK:
Routledge.
St-Pierre, J. (2004). La gestion du Risque comment améliorer le financement des
PME et faciliter leur développement. Sainte-Foy: Presses de l’Universitú
du Québec. http://dx.doi.org/10.1016/j.technovation.2005.07.001.
Strauss el Ansoury (2004). Marketing channels marketing, (2nd Edition) Font:
Prentice Hall International Publishers.
Summers, D.C.S. (2006). Quality. New Jersey: Pearson Education Inc.

175
Teruel-Carrizosa, M. (2010). Gibrat’s law and the learning process. Small Business
Economics, 34(4), 355-373. http://dx.doi.org/10.1007/s11187-008-9127-
9.
United Nations Industrial Development Organization (2015). Industrial Development
Report 2016. The Role of Technology and Innovation in Inclusive and
Sustainable Industrial Development. Vienna: United Nations Industrial
Development Organization.
Vorhies, D. W. & Morgan, N. A. (2005). Benchmarking marketing capabilities for
sustained competitive advantage. Journal of Marketing, 69(1), 80–94.
Vorhies, D.W. & Morgan, N.A. (2003). A configuration theory assessment of
marketing organization fit with business strategy and its relationship with
marketing performance. Journal of Marketing, 67(1), 100–115.
Vorhies, D.W. Morgan, R.E., & Autry, C.W. (2009). Product-market strategy and the
marketing capabilities of the firm: impact on market effectiveness and
cash flow performance. Strategic Management Journal, 30(12), 1310–
1334.
Wakkee, I., Van Der Veen, M., & Eurlings, W. (2015). Effective growth paths for
SMEs. The Journal of Entrepreneurship, 24(2), 169-185.
Watson, J. & Everett, J. E. (1998). Small business failure and external risk factors.
Small Business Economics, 11, 371-90.
Welter, F. (2011). Contextualizing entrepreneurship: conceptual challenges and ways
forward. Entrepreneurship Theory and Practice, 35(1), 165-184.
Westwood, J. (2005. The Marketing Plan Workbook, London: Kogan Page.
Wheelen, T. & Hunger, J. (2005). Concepts in Strategic Management and Business
Policy, Singapore: Pearson Education.

176
Wiklund, J., Patzelt, H., & Shepherd, D. A. (2009). Building an integrative model of
small business growth. Small Business Economics, 32(4), 351-374.
Wilk, E.O & Fensterseifer, J.E. (2003). Use of Resource-Based View in industrial
cluster strategic analysis. International Journal Operation and
Production and Management, 23(9), 995-1009.
Women Enterprises Fund, (2009). Rapid assessment report. Retrieved from:
http://www.wef.co.ke/reports-and-publications .
Women Enterprises Fund, (2013). Retrieved from http://www.wef.co.ke/reports-and-
publications.
Wright, M. & Stigliani, I. (2012). Entrepreneurship and growth. International Small
Business Journal, 31(1), 3-22.

177
APPENDICES
Appendix1: Letter of Introduction
Hello. My name is ___________James Ondiek__________. I am working with
Atieno Onyonyi, a PhD student from Jomo Kenyatta University of Agriculture
and Technology, in this area. She is undertaking a research study on Effects of
Competitive Strategies on Growth of WEF funded SMEs in Kenya; we are
conducting a survey of businesses in this area. Your business has been selected by
chance from all enterprises in the area. I would like to ask you some questions
related to some characteristics of your business.
Combined with the participation of other entrepreneurs in the SME sector in the
constituency, the information you provide will be useful in establishing the overall
situation of SMEs in this region. Participation in the survey is voluntary. All the
information you give will be confidential. The information will be used to prepare a
report, but will not include any specific names of entrepreneurs or their businesses.
There will be no way to identify that you are the one who gave this information.
If you have any questions about the survey, you can ask me, my team leader who is
here with the survey team. At this point, do you have any questions about the survey?
Signature of interviewer:
Date:
Registration No.: HD433-C002-3433/12
Contacts: PO Box 43404, Nairobi 00100

178
Appendix 2: Questionnaire
ENTERPRISE IDENTIFICATION
This section to be completed for each enterprise visited
001Beneficiary’s Name __________________________________
002Contact Information (Telephone number)
__________________________________
003Position in the organizationOwner C.E.O
004How long have you been in the organization
__________________________________
005Name of Constituency__________________________________
# A.ENTERPRENEUR PROFILE # Insert Code
/Value Here
A1 Level of Education (1) = None (2) =Pre-School (3)= Some
Primary (4)=KCPE/CPE
(5)=Secondary (6)=Tertiary Education (7)=University
A1
A2 Have you accessed any business training services (1)=YES
(2)=NO [If NO skip to A5]
A2
A3 If YES in A3, which training have you accessed?
(1)=Accounting (2)=Marketing (3)=Pricing
(4)=Sales Forecasting
(5)=Strategic Management (6)=Inventory Control
(99)=Other (Specify)_____________________
A3

179
A4 What types of businesses do you own? (a)_______________
(b)____________________ (c)_____________________
A4
A5 What was the main reason for getting into this business?
(1)=Lack of another source of income (2)=Needed additional
sources of income (3)=Retirement (4)=Availability of loan
(5)=Influence from friends/relatives (6)=Own initiative/saw an
opportunity (7)=Other (specify)_____________________
A5

180
# B.LOAN PROFILE
# Insert
Code/Val
ue Here
B
1
In which Month and Year did you receive your first loan from
WEF? Month [ ] Year [ ]
B
1
B
2
How much did you receive in B1 above in
KES?__________________________________________
B
2
B
3
Have you received any subsequent loan from the WEF? [1] = YES,
[2] = NO [If NO, skip to B6]
B
3
B
4
If YES in B3 above, how many subsequent loans have you
received?___________________________
B
4
B
5
If YES in B3 above, how much in total, have you received in KES
for all the subsequent loans?__________
B
5
B
6
Have you applied for any non-WEF loan after the first loan from
WEF [1] = YES [2] = NO
[If NO, skip to C1]
B
6
B
7
If YES in B6 above, did you receive the loan? [1] = YES, [2] = NO
[If NO, skip to C1]
B
7
B
8
If yes to B6, what was your source of the loan? [1]=Commercial
Bank, [2]=Cooperative Society, [3]=Micro-Finance Institution,
[4]=Merry Go Round, [5]=Friends, [6]=Family Members,
[99]=Other(Specify)______________________________________
_______
B
8
B
9
If YES in B6 above, how much in total, have you received in KES
for all none WEF loans?_________
B
9

181
C.Market Penetration Strategy
# Insert Code
/Value Here
C1 Have you ever moved to a new/bigger site since you received
the WEF loan? (1)=YES (2)=NO
C1
C2 Have you managed to increase the market share of current
products? (1)=YES (2)=NO [If No, skip to C4]
C2
C3 To increase your market share which of these options have you
used? (1)=competitive pricing (2)=advertising (3)= sales
promotion (4)= dedicated personal selling
(99)=Other (Specify)________________
C3
C4 What is the percentage increase of your market share?
1)=1% – 20% (2 )= 21% - 40% (3)=41% - 60% (4)=61%-
80% (5)=81%-100% (6)=more than 101%
C4
C5 Have you achieved dominance of growth markets? (1)=YES
(2)=NO [If No , skip to C6]
C5
C6 How have you achieved this market dominance?
(1)=Identifying new demographic
(2)= Market intelligence (3) =customer feedback (4)=
competitor intelligence
(99)=Other (specify)___________________________
C6
C7 Have you been able to drive out any of your competitors?
(1)=YES (2)=NO [If No , skip to C8]
C7
C8 How have you been able to drive out your competitors? (1)
aggressive promotional campaign (2) pricing strategy designed
(99)=Other
(Specify)_________________________________________
C8
C9 Have you been able to increase usage of your products or
services by existing customers? (1)=YES (2)=NO [If No ,
skip to C10]
C9

182
C10 How have you been able to increase usage of your products?
(1)= loyalty schemes
(2)=adding value to current product (3)=making alterations
to your current product
(4)= user upgrades of your products (99)=Other
(specify)________________________________
C10
C11 What is the percentage increase of usage of your products or
services by existing customers? 1)=1% – 20% (2 )= 21% -
40% (3)=41% - 60% (4)=61%-80% (5)=81%-100%
(6)=more than 101%
C11

183
D.Market Development Strategy # Insert Code
/Value Here
D1 Which of these methods have you used to leverage on your
traditional strengths? (1)= identifying new uses for existing
products (2) Identifying new demographically (3)= identifying
psycho graphically (4)= Identifying geographically defined
markets (5)= open branch offices
D1
D2 Have you been able to change your media channel? (1)= YES
(2)=NO [If NO , skip to D4]
D2
D3 What new media channel have you used in the last 12 months?
(1)=promotional appeals (2)=distribution signal advertising
(3)= trade publications (4)=advertising in newspapers
(5) Fliers (99) Others (Specify)_______________________
D3
D4 Have you been able to get into new geographical markets?
(1)= YES (2)=NO [If NO , skip to D7]
D4
D5 Have you been able to open branch outside of your current
location? (1)= YES (2)=NO [If NO, skip to D7]
D5
D6 How many branches have you opened outside of current
location? (1)= 1 - 5 (2 )= 6- 10 (3)=more than 10
D6
D7 Which new distribution channel have you been able to use in
the last 6 months? (1)=Internet Retailing (2)=Motor cycle
distributors (3)= Super Market (4)=Kiosk (99) Others
(Specify)_______________________
D7
D8 Do you use different pricing policies for your products? (1)=
YES (2)=NO [If NO , skip to E1]
D8
D9 How have you implemented your price differential? price split
into (1)= 1/4 (2 )= 1/3 (3)=1/2 (4)= more than ½
D9

184
E.Product Development Strategy # Insert Code
/Value Here
E1 Have you developed new products to increase penetration of
existing market? (1)= YES (2)=NO
E1
E2 What prompted you to implement product development? (1)=
Advantage of a favorite reputation (2) Advantage of brand
name (3)= Prolong the product life cycle
99) Other (specify)__________________
E2
E3 Have you invested in either (1)=market research (2)=market
analysis (3) Product R & D
E3
E4 To develop your new product which of these process(es) did
you invest in (1)= idea generation (2)=product design (3)=
detail engineering (99) Other
(specify)__________________________
E4
E5 Is the new product/s closely associated with current products?
(1)= YES (2)=NO
E5
E6 What is the percentage of similarity of the new products to the
existing products?
1)=1% – 20% (2 )= 21% - 40% (3)=41% - 60% (4)= more
than 61%
E6
E7 Does the new product/s match current customers’ purchasing
habits? (1)= YES (2)=NO
E7
E8 Does the new product/s reinvents or refreshes the existing
product? (1)= YES (2)=NO
E8
E9 What is the percentage increase of usage of your products or
services by existing customers? 1)=1% – 20% (2 )= 21% - 40%
(3)=41% - 60% (4)=61%-80% (5)=81%-100% (6)=more than
101%
E9
F.Diversification Strategy # Insert Code
/Value Here
F1 Have you been able markets new products in new markets? 1)=
YES (2)=NO ( If NO, this is the end)
F1
F2 What prompted the decision to adopt this strategy? (1)=
Leverage the company's brand name (2)= uncompetitive
products (3)= shrinking markets (99)=Others
specify)___________________
F2
F3 How was this strategy implemented? (1)= new product, related
market (2)=Move into firms' existing suppliers' or customers'
F3

185
business (3)= new product closely related to current product in
new market (4)= entirely new product in an entirely new market
F4 What has been the gain in terms of growth in sales? 1)=1% –
20% (2 )= 21% - 40% (3)=41% - 60% (4)=61%-80%
(5)=81%-100% (6)=more than 101%
F4
F5 What is the percentage increase of customers numbers? 1)=1%
– 20% (2 )= 21% - 40% (3)=41% - 60% (4)=61%-80%
(5)=81%-100% (6)=more than 101%
F5
G.Growth Indicators # Insert Code
/Value Here
G1 How much was your business worth in KES at the time of
applying for your first WEF loan?
G1
G2 What is the current estimated worth of business in
KES?_________________________
G2
G3 What was your average monthly turnover in KES at the time of
applying for your WEF loan in KES?
_____________________________
G3
G4 What is your monthly turnover by the end of last month in
KES?___________________________
G4
G5 How many employees did you have at the time of applying for
your first WEF loan?_____
G5
G6 How much growth in number of employees have you realized,
since you received your first WEF loan in C7 above? (1)=1 – 20
(2 )= 21 - 40 (3)=41 - 60 (4)=61 - 80 (5)= 81- 100 (6)=more
than 100
G6
G7 In your view has there been a change/growth in the market that
you serve ( Insert the month and year when credit was received
________________) (1)=YES (2)=NO If No This is the
end
G7
G8 How would describe this change/growth in your market?
(1)=Many sellers & buyers have come into the market
(2)=Your business has become one of the many large sellers
(3)= This business has emerged as the only seller (4)= Your
business now has a single buyer (5)=Equity prospects (Other
businesses/individuals are interested in joining this business)
(99)=Other
(specify)__________________________________________
G8
Thank you for your participation in this study
END

186
Appendix 3: Growth on Business worth Model summary, F-test and parameter
estimation
Model Summary
Model R R Square Adjusted R
Square
Std. Error of
the Estimate
1 .89a .792 .790 24018.895
a. Predictors: (Constant), Productdevlop, Marketdevelop
ANOVAa
Model Sum of
Squares
Df Mean Square F Sig.
1 Regression
Residual
Total
79739216748.3
191533234774.1
271272451522.4
2
332
334
39869608374.153
576907333.657
69.109 .000b
a. Dependent Variable: Businessworth
b. Predictors: (Constant), Productdevlop, Marketdevelop
Coefficientsa
Model Unstandardized
Coefficients
Standardized
Coefficients
T Sig
.
B Std.
Error
Beta
1 (Constant)
Marketdevelop
Productdevlop
37247.568
-3050.598
-688.744
2099.240
3555.525
4515.783
-.049
-.009
17.7
-.858
-.153
.000
.392
.879
a. Dependent Variable: Businessworth
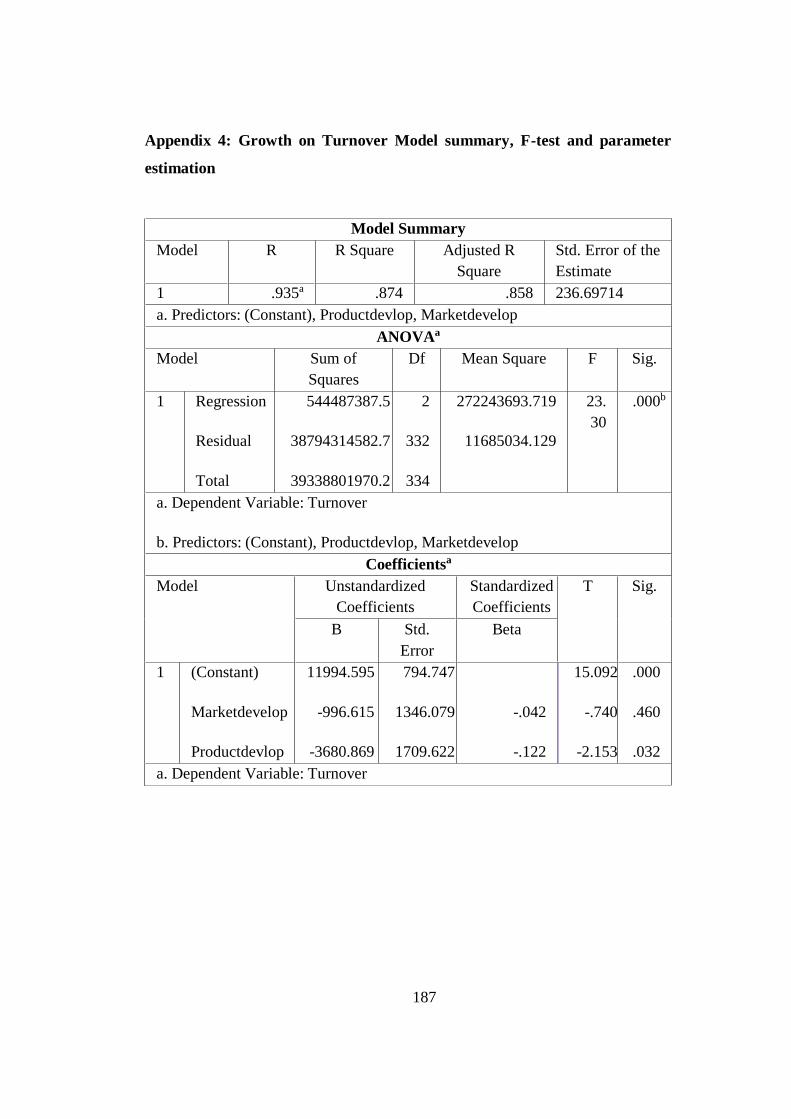
187
Appendix 4: Growth on Turnover Model summary, F-test and parameter
estimation
Model Summary
Model R R Square Adjusted R
Square
Std. Error of the
Estimate
1 .935a .874 .858 236.69714
a. Predictors: (Constant), Productdevlop, Marketdevelop
ANOVAa
Model Sum of
Squares
Df Mean Square F Sig.
1 Regression
Residual
Total
544487387.5
38794314582.7
39338801970.2
2
332
334
272243693.719
11685034.129
23.
30
.000b
a. Dependent Variable: Turnover
b. Predictors: (Constant), Productdevlop, Marketdevelop
Coefficientsa
Model Unstandardized
Coefficients
Standardized
Coefficients
T Sig.
B Std.
Error
Beta
1 (Constant)
Marketdevelop
Productdevlop
11994.595
-996.615
-3680.869
794.747
1346.079
1709.622
-.042
-.122
15.092
-.740
-2.153
.000
.460
.032
a. Dependent Variable: Turnover
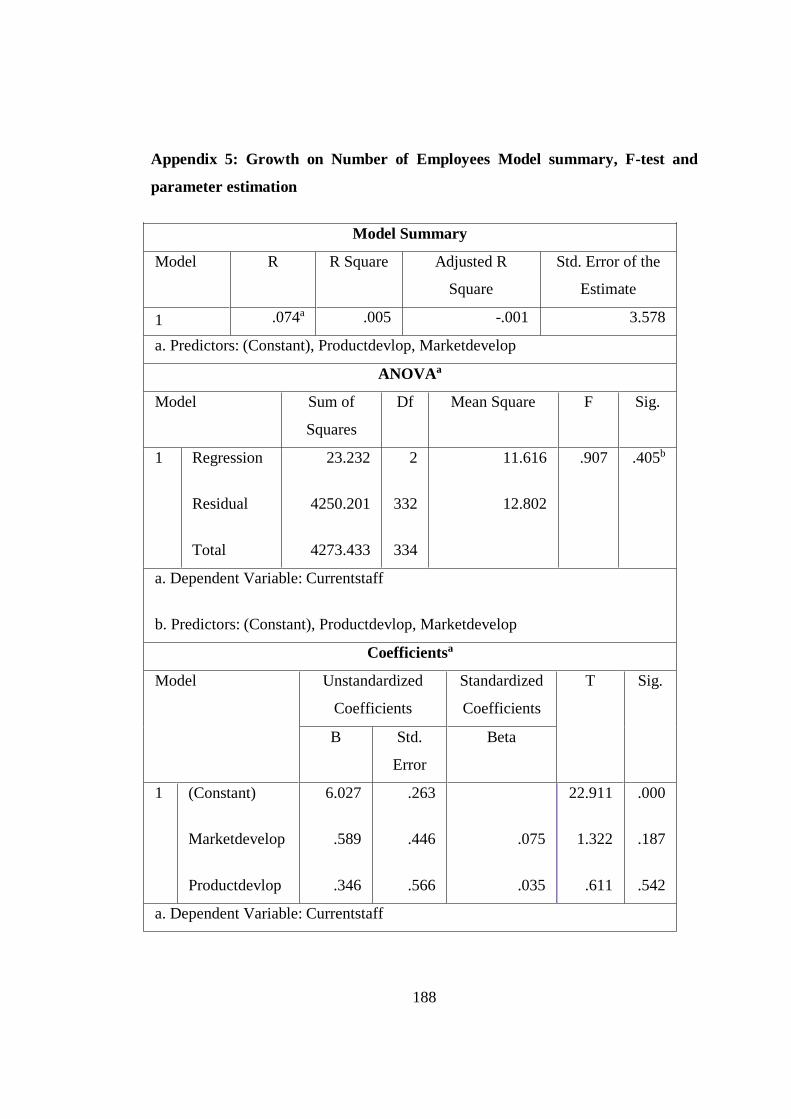
188
Appendix 5: Growth on Number of Employees Model summary, F-test and
parameter estimation
Model Summary
Model R R Square Adjusted R
Square
Std. Error of the
Estimate
1 .074a .005 -.001 3.578
a. Predictors: (Constant), Productdevlop, Marketdevelop
ANOVAa
Model Sum of
Squares
Df Mean Square F Sig.
1 Regression
Residual
Total
23.232
4250.201
4273.433
2
332
334
11.616
12.802
.907 .405b
a. Dependent Variable: Currentstaff
b. Predictors: (Constant), Productdevlop, Marketdevelop
Coefficientsa
Model Unstandardized
Coefficients
Standardized
Coefficients
T Sig.
B Std.
Error
Beta
1 (Constant)
Marketdevelop
Productdevlop
6.027
.589
.346
.263
.446
.566
.075
.035
22.911
1.322
.611
.000
.187
.542
a. Dependent Variable: Currentstaff

189
Appendix 6: Normality test
Descriptives Statistic Std. Error
Turnover
Mean 11139.70 592.946
95% Confidence
Interval for Mean
Lower
Bound
9973.32
Upper
Bound
12306.08
5% Trimmed Mean 9108.62
Median 9000.00
Variance 117780844.222
Std. Deviation 10852.688
Minimum 3000
Maximum 70000
Range 67000
Interquartile Range 3000
Skewness 3.849 .133
Kurtosis 14.984 .266
Tests of Normality
Kolmogorov-Smirnova Shapiro-Wilk
Statistic Df Sig. Statistic Df Sig.
Turnover .340 335 .000 .474 335 .000
a. Lilliefors Significance Correction

190
Appendix 7: University Research Approval

191
Appendix 8: Research Permit Letter
10th September 2016
FROM: Atieno Ouko Onyonyi,
Jomo Kenyatta University of Agriculture and Technology,
P.O. Box 43404,
00100 GPO,
NAIROBI.
TO: The Permanent Secretary
Ministry of Higher Education, Science & Technology,
P.O. Box 30400,
NAIROBI.
SUBJECT: PHD RESEARCH PERMIT
I am currently a graduate student in the Department of business Administration,
JKUAT. As a partial fulfilment for the requirements of a PhD degree programme, I
am required to undertake a Research project in my area of specialisation. Therefore,
in conformance with the legal requirement pertaining to research activities in the
country, I am requesting that I be issued with the necessary permit to allow me
undertake the research for the purpose of my studies.
The title of the proposed study is, “Effect of Competitive Strategies on the Growth of
Women Enterprise Funded Small and Medium Enterprises in Kenya”.
The research report will be used for academic purposes only.
I have attached a copy of my research proposal and an introductory letter from the
University for your consideration.
Thank you,
ATIENO ONYONYI
Jomo Kenyatta University of Agriculture and Technology

Respondents
104
Appendix 9:
WEF Loanee
Constituency Market Penetration Strategy Market Development Product Development Diversification Strategy Growth Details Loanee Category
Kasipul
Kabondo
Kasipul
Competitve
Pricing
Advertising
sales
promotion
dedicate
d
personal selling
Other
Total
Identifying
new uses
of existing products
Identifying
new
demography
Identifying
new
psycho- graphy
Indentifying
new
geographic al markets
Total
advantage
of a
favourite reputation
Advantag
e of brand
name
Prolonging
life cycle
Other
Total
New
products
, related markets
new product
closely
related
to
current
products
in new markets
entirely
new
products
in an
entirely
new market
Total
Current
business
worth (Kes)
Business
worth
before first WEF loan
Current
monthly
turnover
Monthly
turnover
before
first WEF loan
No. Of
Staff
before
WEF Loan
Current
No. Of
Staff
Retail
Repairs Or
Services
Agriculture
Abigael Malete 0 1 1 0 0 0 0 1 0 0 0 1 1 0 0 0 0 0 0 0 0 0 15,000 8,000 9,000 7,000 0 0 1 0 0
Agnes Nyasawiri 1 0 1 0 0 0 0 1 1 0 0 0 1 0 0 0 0 0 0 0 0 0 18,000 12,000 15,000 9,000 0 0 1 0 0
Agnes Ongus 1 0 0 0 0 0 0 0 0 0 0 1 1 0 0 0 0 0 0 0 0 0 18,000 12,000 7,000 4,000 0 0 1 0 0
Alice Atieno 1 0 0 0 0 0 0 0 1 0 0 0 1 0 0 0 0 0 0 0 0 0 21,000 18,000 15,000 8,000 0 0 0 1 0
Alice Dulo 1 0 0 0 0 0 0 0 1 0 0 0 1 0 0 0 0 0 0 0 0 0 28,000 19,000 13,000 12,000 1 10 1 0 0
Alice Ochilo 0 1 1 0 0 0 0 1 0 0 0 1 1 0 0 0 0 0 0 0 0 0 17,000 8,000 7,000 7,000 0 0 0 1 0
Alice Ochunga 0 1 1 0 0 0 0 1 0 0 0 1 1 0 0 0 0 0 0 0 0 0 17,000 7,000 13,000 8,000 0 0 1 0 0
Alice Odera 1 0 0 0 0 0 0 0 1 0 0 0 1 0 0 0 0 0 0 0 0 0 24,800 12,500 15,000 11,000 0 0 1 0 0
Angelina Okeyo 0 1 1 0 0 0 0 1 0 0 0 1 1 0 0 0 0 0 0 0 0 0 18,000 9,000 11,000 8,000 0 0 1 0 0
Anjeline Odhiam 1 0 0 0 0 1 0 1 0 0 0 1 1 0 0 0 0 0 0 0 0 0 83,000 47,000 22,000 14,000 0 0 1 0 0
Anna Achieng 1 0 0 0 0 0 0 0 1 0 0 0 1 1 0 0 0 1 1 0 0 1 47,000 31,000 17,000 9,000 1 10 0 0 1
Annah Atieno 0 1 1 0 0 0 0 1 0 0 0 1 1 0 0 0 0 0 0 0 0 0 15,000 8,000 9,000 7,000 0 0 1 0 0
Anne Akinyi 1 0 0 0 0 0 0 0 0 0 0 1 1 0 0 0 0 0 0 0 0 0 18,000 10,000 13,000 6,000 0 0 0 1 0
Anne Odhiambo 1 0 0 0 0 0 0 0 0 0 1 0 1 0 0 0 0 0 0 0 0 0 88,000 50,000 26,000 14,000 0 0 1 0 0
Annety Makhoha 1 0 0 0 0 0 0 0 0 0 0 1 1 0 0 0 0 0 0 0 0 0 29,000 14,000 14,000 10,000 0 0 1 0 0
Antonina Osodo 1 0 0 0 0 0 0 0 1 0 0 0 1 0 0 0 0 0 0 0 0 0 140,000 70,000 25,000 12,000 1 10 0 0 1
Beatrice Abade 1 0 1 0 0 0 0 1 0 1 0 0 1 1 0 0 0 1 0 0 0 0 36,000 12,000 27,000 14,000 1 10 1 0 0
Beatrice Ochien 1 0 1 0 0 0 0 1 1 0 0 0 1 0 0 0 0 0 0 0 0 0 59,000 34,000 15,000 8,000 0 0 1 0 0
Beatrice Okeyo 0 1 1 0 0 0 0 1 0 0 0 1 1 0 0 0 0 0 0 0 0 0 13,000 9,000 8,000 6,000 0 0 1 0 0
Beatrice Okoth 0 1 1 0 0 0 0 1 0 0 0 2 2 0 0 0 0 0 0 0 0 0 16,000 8,000 9,000 6,000 0 0 0 1 0
Beatrice Okoth 1 0 1 0 0 0 0 1 0 0 0 1 1 0 0 0 0 0 0 0 0 0 22,000 11,000 14,000 10,000 0 0 1 0 0
Beatrice Ongila 1 0 0 0 0 0 0 0 1 0 0 0 1 1 0 0 0 1 0 0 0 0 60,000 30,000 19,000 20,000 0 0 0 0 1
Beatrice Otula 1 0 0 0 0 0 0 0 1 0 0 0 1 0 0 0 0 0 0 0 0 0 38,000 11,000 18,000 10,000 0 0 1 0 0
Benta Akuno 1 0 1 0 0 0 0 1 1 0 0 0 1 0 0 0 0 0 0 0 0 0 33,000 20,000 14,000 7,000 0 0 1 0 0
Benta Gumbe 1 0 1 0 0 0 0 1 0 0 0 0 0 1 0 0 0 1 0 0 0 0 26,000 13,000 12,000 9,000 0 0 1 0 0
Benta Kasuku 1 0 1 0 0 0 0 1 1 0 0 0 1 0 0 0 0 0 0 0 0 0 107,000 70,000 24,000 13,000 0 0 1 0 0
Benta Okello 0 1 0 0 0 1 0 1 0 1 0 0 1 0 0 0 0 0 0 0 0 0 80,000 50,000 35,000 30,000 0 0 0 1 0
Benta Ongoya 1 0 0 0 0 0 0 0 0 1 0 0 1 0 0 0 0 0 0 0 0 0 28,000 15,000 28,000 12,000 1 10 1 0 0
Benta Oyoo 1 0 0 0 0 1 0 1 0 1 0 0 1 0 0 0 0 0 0 0 0 0 40,000 10,000 32,000 18,000 3 10 0 1 0
Benter Achieng 1 0 0 0 0 0 0 0 0 1 0 0 1 0 0 0 0 0 0 0 0 0 34,000 20,000 15,000 8,000 0 0 1 0 0
Benter Atieno 0 1 1 0 0 0 0 1 1 0 0 0 1 0 0 0 0 0 0 0 0 0 17,000 12,000 15,000 7,000 0 0 1 0 0
Benter Atieno 0 1 1 0 0 0 0 1 0 0 0 2 2 0 0 0 0 0 0 0 0 0 80,000 60,000 70,000 50,000 0 0 1 0 0
Benter Omollo 1 0 0 0 0 0 0 0 0 0 0 1 1 0 0 0 0 0 0 0 0 0 18,000 3,000 13,000 4,500 0 0 1 0 0
Berinedita Ayay 1 0 1 0 0 0 0 1 0 0 0 1 1 0 0 0 0 0 0 0 0 0 11,000 5,000 9,000 7,000 0 0 0 1 0
Bernard Ongere 1 0 0 0 0 0 0 0 1 0 0 0 1 0 0 0 0 0 0 0 0 0 64,000 40,000 22,000 10,000 1 10 0 1 0
Careen Anyango 1 0 0 0 0 0 0 0 1 0 0 0 1 0 0 0 0 0 0 0 0 0 43,000 28,000 24,000 9,000 0 0 1 0 0
Carne Mbori 1 0 0 0 0 0 0 0 1 0 0 0 1 1 0 0 0 1 0 0 0 0 24,000 13,000 21,000 11,000 1 10 0 1 0
Caroline Oluoch 0 1 1 0 0 0 0 1 0 0 0 1 1 0 0 0 0 0 0 0 0 0 16,000 10,000 10,000 7,000 0 0 1 0 0
Caroline Otieno 1 0 1 0 0 0 0 1 0 0 0 1 1 0 0 1 0 1 0 1 0 1 26,000 12,000 16,000 8,000 1 10 0 1 0
Carolyne Odongo 1 0 0 0 0 0 0 0 0 1 0 0 1 0 0 0 0 0 0 0 0 0 36,000 14,000 14,000 8,000 0 0 1 0 0
Carolyne Odongo 1 0 0 0 0 0 0 0 0 1 0 0 1 0 0 0 0 0 0 0 0 0 50,000 25,000 17,000 12,000 0 0 1 0 0
Carolyne Onyang 0 1 0 1 0 0 0 1 0 0 0 1 1 0 0 0 0 0 0 0 0 0 50,000 15,000 25,000 17,000 0 0 1 0 0
Chepkemi Some 1 0 0 0 0 0 0 0 1 0 0 0 1 0 0 0 0 0 0 0 0 0 150,000 100,000 25,000 15,000 0 0 1 0 0
Christine Anyan 1 0 0 0 0 0 0 0 1 0 0 0 1 0 0 0 0 0 0 0 0 0 39,000 21,000 18,000 10,000 0 0 1 0 0
Christine Atien 1 0 0 0 0 0 0 0 1 0 0 0 1 1 0 0 0 1 0 0 0 0 23,000 10,000 9,000 7,000 0 0 0 0 1
Christine Opiyo 0 1 1 0 0 0 0 1 0 0 0 1 1 0 0 0 0 0 0 0 0 0 9,000 3,000 10,000 5,000 0 0 0 1 0
Claris Adhiambo 1 0 0 0 0 1 0 1 0 1 0 0 1 0 0 0 0 0 0 0 0 0 56,000 41,000 14,000 9,000 0 0 1 0 0
Colleta Akinyi 1 0 1 0 0 0 0 1 0 0 0 1 1 0 0 0 0 0 0 0 0 0 90,000 50,000 70,000 60,000 0 0 1 0 0
Consilata Adhia 0 1 1 0 0 0 0 1 0 0 0 1 1 0 0 0 0 0 0 0 0 0 14,000 7,000 10,000 6,000 0 0 1 0 0
Cosmas Awendo 0 1 1 0 0 0 0 1 0 0 0 1 1 0 0 0 0 0 0 0 0 0 22,000 12,000 14,000 10,000 0 0 0 0 1
Damaris Atieno 0 1 1 0 0 0 0 1 0 0 0 1 1 0 0 0 0 0 0 0 0 0 17,000 12,000 11,000 9,000 0 0 0 0 1
Damaris Nyagaya 0 1 1 0 0 0 0 1 0 0 0 1 1 0 0 0 0 0 0 0 0 0 20,000 12,000 13,000 9,000 0 0 0 1 0
Damaris Obala 1 0 0 0 0 1 0 1 1 0 0 0 1 1 0 0 0 1 0 0 0 0 96,000 53,000 15,000 10,000 0 0 0 0 1
Damaris Ogada 0 1 1 0 0 0 0 1 0 0 0 1 1 0 0 0 0 0 0 0 0 0 9,000 3,000 8,000 5,000 0 0 1 0 0
Damaris Ojwang 1 0 0 0 0 0 0 0 0 0 0 1 1 0 0 0 0 0 0 0 0 0 20,000 16,000 8,000 6,000 0 0 0 1 0
Damaris Okumu 1 0 1 0 0 0 0 1 0 1 0 0 1 0 0 0 0 0 0 0 0 0 72,000 48,000 12,000 8,000 0 0 1 0 0
Damaris Owira 1 0 0 0 0 0 0 0 1 0 0 0 1 1 0 0 0 1 0 0 0 0 31,000 25,000 12,000 9,000 0 0 0 0 1
Derrick Okoth 1 0 1 0 0 0 0 1 0 0 0 1 1 0 0 0 0 0 0 0 0 0 60,000 30,000 14,000 9,000 0 0 0 1 0
Diana Omondi 1 0 0 0 0 0 0 0 1 0 0 0 1 0 0 0 0 0 0 0 0 0 27,000 14,000 13,000 7,000 0 0 0 0 1
Dolly Athiang 1 0 0 0 0 0 0 0 0 0 1 0 1 0 0 0 0 0 0 0 0 0 50,000 20,000 17,000 9,000 0 0 1 0 0
Dorcas Mwangang 1 0 0 0 0 0 0 0 1 0 0 0 1 0 0 0 0 0 0 0 0 0 44,000 28,000 18,000 10,000 0 0 1 0 0
Dorothy Obilo 0 1 0 0 0 0 1 1 1 0 0 0 1 0 0 0 0 0 0 0 0 0 16,000 11,000 14,000 8,000 0 0 1 0 0
Dorothy Otieno 1 0 0 0 0 0 0 0 1 0 0 0 1 0 0 0 0 0 0 0 0 0 18,000 10,000 13,000 6,000 0 0 0 0 1
Dorothy Ouko 1 0 0 0 0 0 0 0 1 0 0 0 1 0 0 0 0 0 0 0 0 0 25,000 20,000 10,000 6,000 0 0 0 0 1
Elector Ogweyo 0 1 1 0 0 0 0 1 1 0 0 0 1 0 0 0 0 0 0 0 0 0 40,000 16,000 35,000 12,000 0 0 0 1 0
Elida Akinyi 1 0 0 0 0 0 0 0 0 0 1 0 1 0 0 0 0 0 0 0 0 0 19,000 8,000 12,000 7,000 0 0 1 0 0
Eliza Odongo 0 1 1 0 0 0 0 1 0 0 0 0 0 0 0 0 0 0 0 0 0 0 90,000 60,000 70,000 65,000 0 0 0 1 0
Elizabeth Achie 1 0 0 0 0 0 0 0 1 0 0 0 1 0 0 0 0 0 0 0 0 0 108,000 74,000 18,000 10,000 0 0 1 0 0
Elizabeth Ademb 0 1 1 0 0 0 0 1 0 0 0 1 1 0 0 0 0 0 0 0 0 0 90,000 60,000 80,000 70,000 0 0 1 0 0
Elizabeth Ayoo 1 0 0 0 0 0 0 0 0 0 0 1 1 0 0 0 0 0 0 0 0 0 25,000 10,000 10,000 6,000 0 0 0 1 0
Elizabeth Dete 0 1 1 0 0 0 0 1 1 0 0 0 1 0 0 0 0 0 0 0 0 0 17,000 12,000 12,000 8,000 0 0 0 0 1
Elizabeth Sidhe 0 1 1 0 0 0 0 1 0 0 0 1 1 0 0 0 0 0 0 0 0 0 17,000 9,000 12,000 8,000 0 0 0 0 1
Elizer Nyakado 1 0 0 0 0 0 0 0 0 0 0 1 1 0 0 0 0 0 0 0 0 0 24,000 19,000 10,000 6,000 0 0 0 0 1
Emilly Adhiambo 1 0 0 0 0 0 0 0 0 0 0 1 1 0 0 0 0 0 0 0 0 0 19,000 10,000 13,000 6,000 0 0 0 1 0
Emily Akinyi 0 1 1 0 0 0 0 1 0 0 0 1 1 0 0 0 0 0 0 0 0 0 11,000 5,000 8,000 3,000 0 0 0 1 0
Esther Atieno 1 0 0 0 0 0 0 0 1 0 0 0 1 0 0 0 0 0 0 0 0 0 18,000 12,000 14,000 10,000 0 0 1 0 0
Esther Mainga 1 0 1 0 0 0 0 1 1 0 0 0 1 0 0 0 0 0 0 0 0 0 35,000 10,000 10,000 5,000 0 0 0 0 1
Esther Ochieng 0 1 1 0 0 0 0 1 0 0 0 1 1 0 0 0 0 0 0 0 0 0 12,000 5,500 5,000 5,000 0 0 0 1 0
Eucabeth Muga 1 0 0 0 0 0 0 0 0 1 0 0 1 0 0 0 0 0 0 0 0 0 24,000 21,000 21,000 12,000 1 10 0 0 1

Respondents
104
WEF Loanee
Constituency Market Penetration Strategy Market Development Product Development Diversification Strategy Growth Details Loanee Category
Kasipul
Kabondo
Kasipul
Competitve
Pricing
Advertising
sales
promotion
dedicate
d
personal selling
Other
Total
Identifying
new uses
of existing products
Identifying
new
demography
Identifying
new
psycho- graphy
Indentifying
new
geographic al markets
Total
advantage
of a
favourite reputation
Advantag
e of brand
name
Prolonging
life cycle
Other
Total
New
products
, related markets
new product
closely
related
to
current
products
in new markets
entirely
new
products
in an
entirely
new market
Total
Current
business
worth (Kes)
Business
worth
before first WEF loan
Current
monthly
turnover
Monthly
turnover
before
first WEF loan
No. Of
Staff
before
WEF Loan
Current
No. Of
Staff
Retail
Repairs Or
Services
Agriculture
Eunice Odera 1 0 0 0 0 0 0 0 1 0 0 0 1 1 0 0 0 1 0 0 0 0 20,000 10,000 12,000 6,000 0 0 1 0 0
Eunice Okeyo 1 0 1 0 0 0 0 1 1 0 0 0 1 0 0 0 0 0 0 0 0 0 24,000 14,000 13,000 9,000 0 0 0 1 0
Eunice Omondi 0 1 1 0 0 0 0 1 0 0 0 1 1 0 0 0 0 0 0 0 0 0 15,000 8,000 9,000 7,000 0 0 1 0 0
Eunice Otieno 1 0 0 0 0 0 0 0 0 0 0 1 1 0 0 0 0 0 0 0 0 0 45,000 32,000 12,000 8,000 0 0 1 0 0
Everline Ochieng 0 1 1 0 0 0 0 1 0 0 0 1 1 0 0 0 0 0 0 0 0 0 16,000 9,000 10,000 8,000 0 0 1 0 0
Everline Odhiam 0 1 1 0 0 0 0 1 0 0 0 1 1 0 0 0 0 0 0 0 0 0 16,000 10,000 13,000 9,000 0 0 0 0 1
Everline Otieno 0 1 1 0 0 0 0 1 0 0 0 1 1 0 0 0 0 0 0 0 0 0 19,000 8,000 10,000 6,000 0 0 0 1 0
Everlyne Bula 1 0 0 0 0 0 0 0 1 0 0 0 1 0 0 0 0 0 0 0 0 0 48,500 34,000 15,000 7,000 0 0 0 1 0
Everlyne Ndede 1 0 0 0 0 0 0 0 1 0 0 0 1 0 0 0 0 0 0 0 0 0 32,000 14,000 16,000 10,000 0 0 1 0 0
Everlyne Oyoo 1 0 0 0 0 0 0 0 1 0 0 0 1 0 0 0 0 0 0 0 0 0 78,000 58,000 11,000 7,000 0 0 0 0 1
Farida Ali 1 0 0 0 0 0 0 0 1 0 0 0 1 0 0 0 0 0 0 0 0 0 160,000 100,000 16,000 10,000 0 0 0 1 0
Fatuma Odhiabom 0 1 1 0 0 0 0 1 0 0 0 1 1 0 0 0 0 0 0 0 0 0 16,000 12,000 12,000 6,000 0 0 0 1 0
fatuma Odhiambo 0 1 1 0 0 0 0 1 0 0 0 1 1 0 0 0 0 0 0 0 0 0 16,000 6,000 12,000 7,000 0 0 1 0 0
Fenny Atieno 1 0 0 0 0 0 0 0 1 0 0 0 1 0 0 0 0 0 0 0 0 0 31,000 12,000 16,000 7,000 0 0 1 0 0
Fleria Nyandiko 0 1 1 0 0 0 0 1 0 0 0 1 1 0 0 0 0 0 0 0 0 0 80,000 50,000 70,000 60,000 0 0 1 0 0
Floice Mboko 1 0 0 0 0 0 0 0 0 0 0 1 1 0 0 0 0 0 0 0 0 0 24,000 15,000 10,000 5,000 0 0 0 1 0
Florence Atieno 1 0 1 0 0 0 0 1 1 0 0 0 1 0 0 0 0 0 0 0 0 0 29,000 21,000 10,000 6,000 0 0 1 0 0
Florence Auma 0 1 1 0 0 0 0 1 0 0 0 1 1 0 0 0 0 0 0 0 0 0 20,000 10,000 17,000 12,000 0 0 0 0 1
Florence Odhiam 0 1 1 0 0 0 0 1 0 0 0 1 1 0 0 0 0 0 0 0 0 0 14,000 6,000 8,000 5,000 0 0 0 1 0
Florence Oloo 0 1 1 0 0 0 0 1 1 0 0 0 1 0 0 0 0 0 0 0 0 0 19,000 8,000 16,000 10,000 0 0 1 0 0
Florence Otieno 0 1 1 0 0 0 0 1 0 0 0 1 1 0 0 0 0 0 0 0 0 0 16,000 8,000 11,000 9,000 0 0 1 0 0
Florence Oyugi 1 0 0 0 0 0 0 0 1 0 0 0 1 0 0 0 0 0 0 0 0 0 16,000 8,000 12,000 6,000 0 0 1 0 0
Florence Oyugi 1 0 0 0 0 0 0 0 1 0 0 0 1 0 0 0 0 33,000 21,000 20,000 11,000 2 10 1 0 0
Flota Ongenya 0 1 1 0 0 0 0 1 0 0 0 1 1 0 0 0 0 0 0 0 0 0 17,000 12,000 11,000 9,000 0 0 1 0 0
Francisca Maran 0 1 1 0 0 0 0 1 0 0 0 1 1 0 0 0 0 0 0 0 0 0 18,000 7,000 15,000 9,000 0 0 0 1 0
Francisca Matat 1 0 0 0 0 1 0 1 0 1 0 0 1 1 0 0 0 1 0 0 0 0 50,000 30,000 15,000 8,000 0 0 1 0 0
Gaudensia Awend 0 1 1 0 0 0 0 1 0 0 0 1 1 0 0 0 0 0 0 0 0 0 9,000 3,000 10,000 5,000 0 0 0 1 0
George Abuba 1 0 0 0 0 0 0 0 1 0 0 0 1 0 0 0 0 0 0 0 0 0 46,000 21,000 16,000 10,000 1 10 0 0 1
Gladys Ooko 1 0 1 0 0 0 0 1 0 0 0 1 1 0 0 0 0 0 0 0 0 0 56,000 12,000 24,000 6,000 1 10 0 1 0
Grace Adiwour 1 0 0 0 0 0 0 0 0 0 0 0 0 0 0 0 0 0 0 0 0 0 15,000 10,000 12,000 8,000 0 0 1 0 0
Grace Juma 1 0 0 1 0 0 0 1 0 1 0 0 1 0 0 0 0 0 0 0 0 0 51,000 32,000 22,000 12,000 0 10 0 1 0
Grace Otieno 0 1 1 0 0 0 0 1 0 0 0 0 0 0 0 0 0 0 0 0 0 0 80,000 60,000 70,000 50,000 0 0 0 1 0
Grace Ouma 0 1 1 0 0 0 0 1 0 0 0 1 1 0 0 0 0 0 0 0 0 0 19,000 11,000 16,000 14,000 0 0 1 0 0
Grace Rapemo 0 1 1 0 0 0 0 1 0 0 0 1 1 0 0 0 0 0 0 0 0 0 80,000 50,000 70,000 65,000 0 0 0 1 0
Hana Akinyi 1 0 1 0 0 0 0 1 0 0 0 1 1 0 0 0 0 0 0 0 0 0 14,000 9,000 9,000 6,000 0 0 1 0 0
Hana Opolo 1 0 0 0 0 0 0 0 0 1 0 0 1 0 0 0 0 0 0 0 0 0 6,000 32,000 15,000 10,000 0 0 1 0 0
Helda Omenda 1 0 0 0 0 0 0 0 0 1 0 0 1 0 0 0 0 0 0 0 0 0 55,000 31,000 13,000 11,000 0 0 1 0 0
Hellen Ajumbo 1 0 0 0 0 0 0 0 1 0 0 0 1 0 0 0 0 0 0 0 0 0 34,000 12,000 16,000 7,000 0 0 0 1 0
Hellen Aluko 0 1 1 0 0 0 0 1 0 1 0 0 1 0 0 0 0 0 0 0 0 0 15,000 5,000 11,000 6,000 0 0 0 1 0
Hellen Juma 0 1 1 0 0 0 0 1 0 0 0 0 0 0 0 0 0 0 0 0 0 0 60,000 40,000 30,000 35,000 0 0 1 0 0
Hellen Kwaka 0 1 1 0 0 0 0 1 0 0 0 1 1 0 0 0 0 0 0 0 0 0 15,000 8,000 9,000 7,000 0 0 1 0 0
Hellen Odhiambo 0 1 1 0 0 0 0 1 0 0 0 1 1 0 0 0 0 0 0 0 0 0 16,000 10,000 12,000 9,000 0 0 0 0 1
Hellen Omollo 0 1 1 0 0 0 0 1 0 0 0 1 1 0 0 0 0 0 0 0 0 0 20,000 15,000 18,000 17,000 0 0 1 0 0
Hellen Oyugi 1 0 0 0 0 0 0 0 0 0 0 0 0 0 0 0 0 0 0 0 0 0 28,000 20,000 12,000 8,000 0 0 1 0 0
Herine Onyango 1 0 0 0 0 0 0 0 0 0 1 0 1 0 0 0 0 0 0 0 0 0 10,000 4,000 6,000 3,000 0 0 1 0 0
Hesbon Asero 0 1 1 0 0 0 0 1 0 0 0 0 0 0 0 0 0 0 0 0 0 0 80,000 60,000 70,000 50,000 0 0 1 0 0
Irene Ochieng 1 0 0 0 0 0 0 0 0 0 0 0 0 0 0 0 0 0 0 0 0 0 29,000 20,000 12,000 8,000 0 0 0 1 0
Ischer Anyango 1 0 0 0 0 0 0 0 0 0 0 1 1 1 0 0 0 1 0 0 0 0 31,000 23,000 17,500 9,000 0 0 0 1 0
Jackline Adhiam 1 0 0 0 0 0 0 0 0 1 0 0 1 0 0 0 0 0 0 0 0 0 13,000 8,000 12,000 7,000 0 0 1 0 0
Jackline Ochien 0 1 1 0 0 0 0 1 0 0 0 1 1 0 0 0 0 0 0 0 0 0 16,000 9,000 10,000 8,000 0 0 1 0 0
Jael Juma 1 0 1 0 0 0 0 1 0 0 0 0 0 0 0 0 0 0 0 0 0 0 18,000 12,000 12,000 7,000 0 0 0 1 0
Jane Adhiambo 0 1 1 0 0 0 0 1 0 0 0 1 1 0 0 0 0 0 0 0 0 0 17,000 9,000 12,000 8,000 0 0 0 1 0
Jane Akumu 1 0 1 0 0 0 0 1 0 1 0 0 1 0 0 0 0 0 0 0 0 0 40,000 25,000 19,000 9,000 0 10 1 0 0
Jane Atieno 0 1 1 0 0 0 0 1 0 0 0 1 1 0 0 0 0 0 0 0 0 0 15,000 8,000 13,000 9,000 0 0 1 0 0
Jane Gogo 1 0 0 0 0 0 0 0 1 0 0 0 1 0 0 0 0 0 0 0 0 0 30,000 20,000 20,000 10,000 1 10 1 0 0
Jane Juma 1 0 0 0 0 0 0 0 0 0 0 1 1 0 0 0 0 0 0 0 0 0 29,000 10,000 14,000 6,000 0 0 1 0 0
Jane Kemuma 0 1 1 0 0 0 0 1 0 0 0 1 1 0 0 0 0 0 0 0 0 0 28,000 20,000 14,000 10,000 0 0 1 0 0
Jane Kwenya 1 0 0 0 0 0 0 0 1 0 0 0 1 1 0 0 0 1 0 0 0 0 30,000 24,000 12,000 8,000 0 0 0 0 1
Jane Odada 1 0 1 0 0 0 0 1 0 0 0 1 1 0 0 0 0 0 0 0 0 0 18,000 10,000 13,000 9,000 0 0 0 1 0
Jane Odada 1 0 1 0 0 0 0 1 0 0 0 1 1 0 0 0 0 0 0 0 0 0 20,000 13,000 16,000 10,000 0 0 1 0 0
Jane Odhiambo 0 1 1 0 0 0 0 1 0 0 0 1 1 0 0 0 0 0 0 0 0 0 17,000 9,000 13,000 10,000 0 0 1 0 0
Jane Odogo 0 1 1 0 0 0 0 1 0 0 0 1 1 0 0 0 0 0 0 0 0 0 19,000 9,000 12,000 5,000 0 0 1 0 0
Jane Okoth 0 1 1 0 0 0 0 1 0 0 0 1 1 0 0 0 0 0 0 0 0 0 14,000 7,000 11,000 6,000 0 0 1 0 0
Jane Oluoch 1 0 0 0 0 0 0 0 1 0 0 0 1 0 0 0 0 0 0 0 0 0 19,000 5,000 12,000 4,000 0 0 1 0 0
Jane Oyatta 1 0 1 0 0 0 0 1 0 1 0 0 1 0 0 0 0 0 0 0 0 0 94,000 60,000 26,000 14,000 1 10 0 1 0
Janepher Oyugi 0 1 1 0 0 0 0 1 0 0 0 1 1 0 0 0 0 0 0 0 0 0 16,000 7,000 10,000 9,000 0 0 1 0 0
Janet Atieno 1 0 0 0 0 0 0 0 0 1 0 0 1 0 0 0 0 0 0 0 0 0 35,000 21,000 14,000 8,000 0 0 1 0 0
Janet Kenyatta 1 0 0 0 0 0 0 0 0 0 0 0 0 0 0 0 0 0 0 0 0 0 22,000 13,000 10,000 6,000 0 0 0 1 0
Janet Odhiambo 0 1 1 0 0 0 0 1 0 0 0 1 1 0 0 0 0 0 0 0 0 0 12,000 5,500 6,000 5,000 0 0 0 0 1
Janet Ogol 0 1 0 0 0 0 0 0 0 1 0 0 1 0 0 0 0 0 0 0 0 0 63,000 34,000 14,000 9,000 0 0 1 0 0
Janet Tom 1 0 0 0 0 0 0 0 1 0 0 0 1 0 0 0 0 0 0 0 0 0 34,000 23,000 15,000 10,000 0 10 0 1 0
Janet William 1 0 1 0 0 0 0 1 1 0 0 0 1 0 1 0 0 1 1 0 0 1 100,000 60,000 16,000 7,000 1 10 1 0 0
Janet Zacharia 0 1 1 0 0 0 0 1 0 0 0 1 1 0 0 0 0 0 0 0 0 0 15,000 5,000 10,000 6,000 0 0 0 0 1
Jenifa Mark 1 0 1 0 0 0 0 1 1 0 0 0 1 1 0 0 0 1 0 0 0 0 108,000 72,000 28,000 18,000 1 10 1 0 0
Jenipher Miland 1 0 0 0 0 0 0 0 1 0 0 0 1 0 0 0 0 0 0 0 0 0 18,000 12,000 10,000 6,000 0 0 0 0 1
Jesse Omenda 1 0 1 0 0 0 0 1 0 0 0 1 1 0 0 0 0 0 0 0 0 0 20,000 15,000 17,000 12,000 0 0 1 0 0
Jocinta Okello 1 0 1 0 0 0 0 1 0 1 0 0 1 0 0 0 0 0 0 0 0 0 78,000 55,000 18,000 12,000 0 0 1 0 0
John Ochuka 0 1 1 0 0 0 0 1 0 0 0 1 1 0 0 0 0 0 0 0 0 0 18,000 9,000 12,000 8,000 0 0 0 0 1
Josca Ogina 0 1 1 0 0 0 0 1 0 0 0 1 1 0 0 0 0 0 0 0 0 0 17,000 9,000 10,000 8,000 0 0 0 1 0

Respondents
104
WEF Loanee
Constituency Market Penetration Strategy Market Development Product Development Diversification Strategy Growth Details Loanee Category
Kasipul
Kabondo
Kasipul
Competitve
Pricing
Advertising
sales
promotion
dedicate
d
personal selling
Other
Total
Identifying
new uses
of existing products
Identifying
new
demography
Identifying
new
psycho- graphy
Indentifying
new
geographic al markets
Total
advantage
of a
favourite reputation
Advantag
e of brand
name
Prolonging
life cycle
Other
Total
New
products
, related markets
new product
closely
related
to
current
products
in new markets
entirely
new
products
in an
entirely
new market
Total
Current
business
worth (Kes)
Business
worth
before first WEF loan
Current
monthly
turnover
Monthly
turnover
before
first WEF loan
No. Of
Staff
before
WEF Loan
Current
No. Of
Staff
Retail
Repairs Or
Services
Agriculture
Josephen Akoth 1 0 1 0 0 0 0 1 0 0 0 1 1 0 0 0 0 0 0 0 0 0 90,000 50,000 70,000 60,000 0 0 1 0 0
Josephine Auma 0 1 1 0 0 0 0 1 0 0 0 1 1 0 0 0 0 0 0 0 0 0 14,000 7,000 7,000 6,000 0 0 1 0 0
Joshua Nyadera 0 1 1 0 0 0 0 1 0 0 0 1 1 0 0 0 0 0 0 0 0 0 15,000 8,000 9,000 7,000 0 0 1 0 0
Josphine Akiny 1 0 1 0 0 0 0 1 0 0 0 1 1 0 0 0 0 0 0 0 0 0 25,000 10,000 10,000 6,000 0 0 0 1 0
Joyce Abonyo 1 0 1 0 0 0 0 1 0 0 0 1 1 0 0 0 0 0 0 0 0 0 35,000 15,000 14,000 9,000 0 0 1 0 0
Joyce Adhola 1 0 0 0 0 0 0 0 0 0 0 1 1 0 0 0 0 0 0 0 0 0 15,000 10,000 11,000 8,000 0 0 1 0 0
Joyce Amata 1 0 0 0 0 0 0 0 0 1 0 0 1 0 0 0 0 0 0 0 0 0 60,000 30,000 14,000 9,000 0 0 0 1 0
Joyce Ochieng 1 0 1 0 0 0 0 1 1 0 0 0 1 0 0 0 0 0 0 0 0 0 72,000 30,000 33,000 20,000 1 10 0 1 0
Joyce Odero 0 1 1 0 0 0 0 1 0 0 0 1 1 0 0 0 0 0 0 0 0 0 14,000 7,000 8,000 6,000 0 0 1 0 0
Joyce Otieno 1 0 0 0 0 0 0 0 1 0 0 0 1 1 0 0 0 1 0 0 1 1 96,000 72,000 32,000 14,000 1 10 1 0 0
Judith Agola 0 1 1 0 0 0 0 1 0 0 0 1 1 0 0 0 0 0 0 0 0 0 15,000 8,000 9,000 7,000 0 0 1 0 0
Judith Akoth 0 1 1 0 0 0 0 1 1 0 0 0 1 0 0 0 0 0 0 0 0 0 90,000 60,000 43,000 35,000 0 0 1 0 0
Judith MMbone 0 1 1 0 0 0 0 1 0 0 0 1 1 0 0 0 0 0 0 0 0 0 18,000 8,000 12,000 7,000 0 0 1 0 0
Judith Modi 0 1 1 0 0 0 0 1 0 0 0 1 1 0 0 0 0 0 0 0 0 0 19,000 10,000 10,000 8,000 0 0 1 0 0
Judith Odegi 1 0 0 0 0 0 0 0 0 0 0 0 0 0 0 0 0 0 0 0 0 0 28,000 14,000 12,000 6,000 0 0 1 0 0
Judith Odero 1 0 0 0 0 0 0 0 0 1 0 0 1 0 0 0 0 0 0 0 0 0 73,000 5,000 18,000 12,000 0 0 1 0 0
Judith Ogalo 0 1 1 0 0 0 0 1 0 0 0 1 1 0 0 0 0 0 0 0 0 0 19,000 10,000 18,000 9,000 0 0 1 0 0
Judith Orony 0 1 1 0 0 0 0 1 0 0 0 1 1 0 0 0 0 0 0 0 0 0 18,000 11,000 9,000 10,000 0 0 0 1 0
Judith Otieno 1 0 0 0 0 0 0 0 1 0 0 0 1 0 0 0 0 0 0 0 0 0 44,000 28,000 12,000 6,000 0 0 0 0 1
Juliet Adhiambo 1 0 1 0 0 0 0 1 0 0 1 0 1 1 0 0 0 1 0 0 0 0 40,000 20,000 15,000 8,000 0 0 1 0 0
Julita Ndira 0 1 1 0 0 0 0 1 0 0 0 1 1 0 0 0 0 0 0 0 0 0 10,000 3,000 7,000 4,000 0 0 1 0 0
kakinyi Martin 1 0 1 0 0 0 0 1 0 0 0 1 1 0 0 0 0 0 0 0 0 0 25,000 17,000 20,000 19,000 0 0 0 1 0
Leah Atieno 1 0 1 0 0 0 0 1 0 0 0 1 1 0 0 0 0 0 0 0 0 0 19,000 12,000 14,000 11,000 0 0 0 1 0
Leah Atieno 1 0 1 0 0 0 0 1 0 0 0 1 1 0 0 0 0 0 0 0 0 0 20,000 15,000 15,000 17,000 0 0 1 0 0
Leah Onyango 1 0 0 0 0 0 0 0 0 1 0 0 1 0 0 0 0 0 0 0 0 0 18,000 6,000 18,000 6,000 0 0 0 1 0
Leah Onyango 0 1 0 0 0 0 0 0 0 1 0 0 1 0 0 0 0 0 0 0 0 0 58,000 28,000 26,000 14,000 2 10 1 0 0
Leonora Okamo 1 0 0 0 0 0 0 0 1 0 0 0 1 0 0 0 0 0 0 0 0 0 49,000 17,000 19,000 8,500 0 0 1 0 0
Lilian Adhiambo 1 0 0 0 0 0 0 0 1 0 0 0 1 0 0 0 0 0 0 0 0 0 26,000 12,000 17,000 6,000 0 0 0 1 0
Lilian Akiny 1 0 0 0 0 0 0 0 1 0 0 0 1 0 0 0 0 0 0 0 0 0 40,000 25,000 10,000 5,000 0 0 0 0 1
Lilian Akinyi 0 1 1 0 0 0 0 1 0 0 0 1 1 0 0 0 0 0 0 0 0 0 25,000 10,000 17,000 12,000 0 0 1 0 0
Lilian Banja 0 1 1 0 0 0 0 1 0 0 0 1 1 0 0 0 0 0 0 0 0 0 30,000 20,000 26,000 22,000 0 0 1 0 0
Lilian Moses 1 0 0 0 0 0 0 0 1 0 0 0 1 0 0 0 0 0 0 0 0 0 49,000 18,000 23,000 11,000 1 10 0 1 0
Lilian Odhiambo 0 1 1 0 0 0 0 1 0 0 0 1 1 0 0 0 0 0 0 0 0 0 9,000 3,000 6,000 4,000 0 0 1 0 0
Liliana Aloka 1 0 1 0 0 0 0 1 0 0 0 1 1 0 0 0 0 0 0 0 0 0 80,000 50,000 70,000 60,000 0 0 1 0 0
Lindah Oyugi 1 0 0 0 0 0 0 0 0 1 0 0 1 0 0 0 0 0 0 0 0 0 30,000 20,000 15,000 9,000 0 0 0 1 0
Linet Ngede 1 0 1 0 0 0 0 1 0 0 0 1 1 0 0 0 0 0 0 0 0 0 10,000 5,000 8,000 6,000 0 0 0 1 0
Linet Okumu 1 0 0 0 0 0 0 0 0 0 1 0 1 0 0 0 0 0 0 0 0 0 103,000 70,000 28,000 16,000 0 0 0 1 0
Loice Ochieng 1 0 1 0 0 0 0 1 0 0 0 1 1 1 0 0 0 1 0 0 1 1 170,000 100,000 30,000 15,000 5 10 1 0 0
Lonah Magak 1 0 0 0 0 0 0 0 0 1 0 0 1 0 0 0 0 0 0 0 0 0 38,000 24,000 11,000 7,000 0 0 1 0 0
Lonah Ouma 0 1 1 0 0 0 0 1 0 0 0 0 0 0 0 0 0 0 0 0 0 0 19,000 10,000 17,000 12,000 0 0 0 1 0
Lonica Odhiambo 1 0 0 0 0 0 0 0 1 0 0 0 1 0 0 0 0 0 0 0 0 0 47,500 28,000 12,000 7,000 0 0 0 0 1
Lovy Oyamo 1 0 0 0 0 0 0 0 0 0 1 0 1 0 0 0 0 0 0 0 0 0 44,000 11,000 15,000 9,000 0 0 1 0 0
Loyce Adhiambo 1 0 0 0 0 0 0 0 1 0 0 0 1 0 0 0 0 0 0 0 0 0 42,000 27,000 22,000 9,000 0 0 1 0 0
Lucy Juma 0 1 1 0 0 0 0 1 1 0 0 0 1 0 0 0 0 0 0 0 0 0 27,000 12,000 15,000 10,000 0 0 1 0 0
Lydia Ogeta 1 0 1 0 0 0 0 1 0 1 0 0 1 0 0 0 0 0 0 0 0 0 34,000 18,000 24,000 12,000 1 10 1 0 0
Magdalene Ngete 0 1 0 0 0 1 0 1 1 0 0 0 1 0 0 0 0 0 0 0 0 0 55,000 40,000 15,000 10,000 0 0 1 0 0
Magdaline Okeyo 0 1 1 0 0 0 0 1 0 0 0 1 1 0 0 0 0 0 0 0 0 0 15,000 5,000 11,000 6,000 0 0 1 0 0
Margaret Jacint 1 0 0 0 0 0 0 0 0 0 0 0 0 0 0 0 0 0 0 0 0 0 18,000 15,000 9,000 5,000 0 0 0 1 0
Margaret Mwai 0 1 1 0 0 0 0 1 0 0 0 1 1 0 0 0 0 0 0 0 0 0 17,000 7,000 13,000 8,000 0 0 0 0 1
Margaret Odhiam 0 1 0 0 0 0 0 0 1 0 0 0 1 0 0 0 0 0 0 0 0 0 34,000 22,000 21,000 12,000 0 0 1 0 0
Margaret Odongo 0 1 1 0 0 0 0 1 0 0 0 1 1 0 0 0 0 0 0 0 0 0 14,000 6,000 7,000 5,000 0 0 0 1 0
Margaret Okoko 1 0 0 0 0 0 0 0 1 0 0 0 1 0 0 0 0 0 0 0 0 0 110,000 70,000 14,000 11,000 0 0 0 0 1
Martha Aroko 0 1 1 0 0 0 0 1 0 0 0 1 1 0 0 0 0 0 0 0 0 0 20,000 10,000 17,000 12,000 0 0 1 0 0
Martha Ojwang 0 1 1 0 0 0 0 1 0 0 0 1 1 0 0 0 0 0 0 0 0 0 19,000 10,000 11,000 9,000 0 0 1 0 0
Martha Okello 1 0 0 0 0 0 0 0 1 0 0 0 1 0 0 0 0 0 0 0 0 0 55,000 30,000 20,000 12,000 1 10 0 0 1
Martha Yogo 1 0 0 0 0 0 0 0 1 0 0 0 1 0 0 0 1 1 0 0 0 0 17,000 12,000 11,000 6,000 0 0 1 0 0
Mary Agoro 1 0 0 0 0 0 0 0 1 0 0 0 1 1 0 0 0 1 0 0 0 0 25,000 10,000 15,000 6,000 0 0 0 0 1
Mary Agutu 0 1 1 0 0 0 0 1 0 0 0 1 1 0 0 0 0 0 0 0 0 0 18,000 6,000 7,000 5,000 0 0 1 0 0
Mary Akiny 1 0 1 0 0 0 0 1 0 0 1 0 1 0 0 0 0 0 0 0 0 0 50,000 20,000 18,000 10,000 0 0 1 0 0
Mary Akoth 0 1 1 0 0 0 0 1 0 0 0 1 1 0 0 0 0 0 0 0 0 0 17,000 8,000 7,000 7,000 0 0 1 0 0
Mary Aoko 1 0 0 0 0 0 0 0 1 0 0 0 1 0 0 0 0 0 0 0 0 0 48,000 20,000 22,000 12,000 0 0 1 0 0
Mary Auma 0 1 1 0 0 0 0 1 0 0 0 1 1 0 0 0 0 0 0 0 0 0 15,000 6,000 12,000 8,000 0 0 1 0 0
Mary Bee 1 0 0 0 0 0 0 0 1 0 0 0 1 0 0 0 0 0 0 0 0 0 64,000 42,000 16,000 9,000 0 0 1 0 0
Mary Gwayo 0 1 1 0 0 0 0 1 0 0 0 1 1 0 0 0 0 0 0 0 0 0 18,000 10,000 13,000 9,000 0 0 1 0 0
Mary Hannah 0 1 1 0 0 0 0 1 0 0 0 1 1 0 0 0 0 0 0 0 0 0 20,000 11,000 13,000 10,000 0 0 1 0 0
Mary Mitalo 1 0 0 0 0 0 0 0 1 0 0 0 1 0 0 0 0 0 0 0 0 0 33,000 21,000 15,000 7,000 0 0 1 0 0
Mary Mola 1 0 0 0 0 1 0 1 0 1 0 0 1 0 0 0 0 0 0 0 0 0 18,000 10,000 9,000 6,000 0 0 0 0 1
Mary Obala 1 0 0 0 0 0 0 0 0 0 0 1 1 0 0 0 0 0 0 0 0 0 43,000 24,000 10,000 6,000 0 0 0 0 1
Mary Odegi 1 0 0 0 0 0 0 0 1 0 0 0 1 0 0 0 0 0 0 0 0 0 21,000 17,000 10,000 7,000 0 0 0 0 1
Mary Ojuka 1 0 1 0 0 0 0 1 0 0 0 0 0 0 0 0 0 0 0 0 0 0 24,000 15,000 14,000 12,000 0 0 0 1 0
Mary Okello 1 0 0 0 0 0 0 0 0 1 0 0 1 0 0 0 0 0 0 0 0 0 30,000 17,000 11,000 6,000 0 0 1 0 0
Mary Oloo 1 0 0 0 0 0 0 0 1 0 0 0 1 0 0 0 0 0 0 0 0 0 42,000 26,000 12,000 7,000 0 0 0 0 1
Mary Omollo 0 1 1 0 0 0 0 1 0 0 0 1 1 0 0 0 0 0 0 0 0 0 16,000 8,000 11,000 7,000 0 0 0 0 1
Mary Otieno 0 1 1 0 0 0 0 1 0 0 0 1 1 0 0 0 0 0 0 0 0 0 15,000 10,000 12,000 6,000 0 0 0 1 0
Maslina Owino 0 1 1 0 0 0 0 1 0 0 0 1 1 0 0 0 0 0 0 0 0 0 20,000 8,000 15,000 10,000 0 0 0 1 0
Mathlidah Ongay 1 0 0 0 0 0 0 0 0 0 0 1 1 0 0 0 0 0 0 0 0 0 30,000 13,000 12,000 7,000 0 0 0 0 1
Maxwel Odedo 0 1 1 0 0 0 0 1 0 0 0 0 0 0 0 0 0 0 0 0 0 0 80,000 70,000 65,000 50,000 0 0 1 0 0
Melda Odhiambo 0 1 1 0 0 0 0 1 0 0 0 1 1 0 0 0 0 0 0 0 0 0 13,000 6,000 7,000 5,000 0 0 1 0 0
Milicent Akiny 0 1 1 0 0 0 0 1 0 0 0 1 1 0 0 0 0 0 0 0 0 0 55,000 35,000 40,000 29,000 0 0 1 0 0

Respondents
104
WEF Loanee
Constituency Market Penetration Strategy Market Development Product Development Diversification Strategy Growth Details Loanee Category
Kasipul
Kabondo
Kasipul
Competitve
Pricing
Advertising
sales
promotion
dedicate
d
personal selling
Other
Total
Identifying
new uses
of existing products
Identifying
new
demography
Identifying
new
psycho- graphy
Indentifying
new
geographic al markets
Total
advantage
of a
favourite reputation
Advantag
e of brand
name
Prolonging
life cycle
Other
Total
New
products
, related markets
new product
closely
related
to
current
products
in new markets
entirely
new
products
in an
entirely
new market
Total
Current
business
worth (Kes)
Business
worth
before first WEF loan
Current
monthly
turnover
Monthly
turnover
before
first WEF loan
No. Of
Staff
before
WEF Loan
Current
No. Of
Staff
Retail
Repairs Or
Services
Agriculture
Milicent Omondi 1 0 0 0 0 0 0 0 0 1 0 0 1 0 0 0 0 0 0 0 0 0 60,000 30,000 25,000 10,000 0 0 0 1 0
Milka Adhiambo 1 0 1 0 0 0 0 1 0 0 0 0 0 0 0 0 0 0 0 0 0 0 15,000 10,000 10,000 9,000 0 0 0 1 0
Milka Omenda 0 1 1 0 0 0 0 1 0 0 0 1 1 0 0 0 0 0 0 0 0 0 11,000 7,000 8,000 5,000 0 0 0 1 0
Milka Otieno 1 0 0 0 0 0 0 0 0 0 0 0 0 0 0 0 0 0 0 0 0 0 27,000 20,000 11,000 9,000 0 0 0 1 0
Millicent Achie 1 0 0 0 0 0 0 0 0 0 0 1 1 0 0 0 0 0 0 0 0 0 30,000 15,000 17,000 9,000 0 0 0 1 0
Millicent Aning 1 0 1 0 0 0 0 1 0 0 0 0 0 0 0 0 0 0 0 0 0 0 30,000 15,000 15,000 10,000 0 0 0 1 0
Millicent Atien 1 0 0 0 0 0 0 0 1 0 0 0 1 0 0 0 0 0 0 0 0 0 14,000 11,000 10,000 7,000 0 0 1 0 0
Millicent Kephe 1 0 0 0 0 0 0 0 0 0 0 1 1 0 0 0 0 0 0 0 0 0 36,000 21,000 12,000 8,000 0 0 1 0 0
Millicent Omond 0 1 1 0 0 0 0 1 0 0 0 1 1 0 0 0 0 0 0 0 0 0 70,000 30,000 50,000 10,000 0 0 1 0 0
Millicent Oring 0 1 1 0 0 0 0 1 0 0 0 1 1 0 0 0 0 0 0 0 0 0 35,000 15,000 14,000 8,000 0 0 1 0 0
Millicent Oruon 0 1 1 0 0 0 0 1 0 0 0 1 1 0 0 0 0 0 0 0 0 0 18,000 10,000 13,000 11,000 0 0 0 1 0
Monica Agola 0 1 1 0 0 0 0 1 0 0 0 1 1 0 0 0 0 0 0 0 0 0 9,000 4,000 7,000 4,000 0 0 1 0 0
Monica Ogwang 0 1 1 0 0 0 0 1 0 0 0 1 1 0 0 0 0 0 0 0 0 0 17,000 12,000 13,000 9,000 0 0 1 0 0
Monica Oluoch 1 0 1 0 0 0 0 1 0 1 0 0 1 0 0 0 0 0 0 0 0 0 78,000 54,000 18,000 10,000 1 10 1 0 0
Monica Owili 1 0 1 0 0 0 0 1 0 0 0 1 1 0 0 0 0 0 0 0 0 0 25,000 15,000 10,000 6,000 0 0 1 0 0
Monica Oyier 1 0 0 0 0 0 0 0 1 0 0 0 1 0 0 0 0 0 0 0 0 0 170,000 100,000 29,000 14,000 1 10 0 0 1
Moses Ademba 0 1 1 0 0 0 0 1 0 0 0 0 0 0 0 0 0 0 0 0 0 0 90,000 60,000 70,000 70,000 0 0 0 1 0
Mourine Anyango 1 0 1 0 0 0 0 1 0 0 0 1 1 0 0 0 0 0 0 0 0 0 13,000 9,000 10,000 6,000 0 0 1 0 0
Olivia Ogilla 0 1 1 0 0 0 0 1 0 0 0 1 1 0 0 0 0 0 0 0 0 0 19,000 11,000 14,000 10,000 0 0 1 0 0
onsolata Odera 0 1 1 0 0 0 0 1 0 0 0 1 1 0 0 0 0 0 0 0 0 0 15,000 7,000 9,000 6,000 0 0 0 1 0
Pam Odhiambo 1 0 0 0 1 0 0 1 0 0 0 1 1 0 0 0 0 0 0 0 0 0 89,000 32,000 32,000 10,000 1 10 0 1 0
Pamela Mboya 1 0 0 0 0 0 0 0 0 0 0 1 1 0 0 0 0 0 0 0 0 0 49,000 18,000 18,000 7,000 1 10 0 1 0
Pamela Ojwang 1 0 0 0 0 0 0 0 0 1 0 0 1 0 0 0 0 0 0 0 0 0 28,000 20,000 12,000 9,000 0 0 0 1 0
Pamela Okal 0 1 1 0 0 0 0 1 0 0 0 2 2 0 0 0 0 0 0 0 0 0 20,000 13,000 16,000 10,000 0 0 1 0 0
Pamela Okal 0 1 1 0 0 0 0 1 0 0 0 2 2 0 0 0 0 0 0 0 0 0 22,000 12,000 15,000 11,000 0 0 0 1 0
Pamela Okoth 0 1 1 0 0 0 0 1 0 0 0 1 1 0 0 0 0 0 0 0 0 0 13,000 5,000 10,000 6,000 0 0 1 0 0
Pamela Olilo 1 0 0 0 0 0 0 0 0 0 0 1 1 0 0 0 0 0 0 0 0 0 15,000 5,000 12,000 6,000 0 0 1 0 0
Pamela Owenje 0 1 1 0 0 0 0 1 0 0 0 1 1 0 0 0 0 0 0 0 0 0 14,000 7,000 8,000 6,000 0 0 0 1 0
Paul A Mwanga 0 1 1 0 0 0 0 1 1 0 0 0 1 0 0 0 0 0 0 0 0 0 14,000 7,000 8,000 6,000 0 0 1 0 0
Paul Aroko 0 1 1 0 0 0 0 1 0 0 0 1 1 0 0 0 0 0 0 0 0 0 16,000 9,000 11,000 8,000 0 0 0 1 0
Paulina Owidi 1 0 0 0 0 0 0 0 0 0 0 1 1 0 0 0 0 0 0 0 0 0 42,000 21,000 15,000 8,000 0 0 0 0 1
Penina Kasera 1 0 0 0 0 0 0 0 1 0 0 0 1 0 0 0 0 0 0 0 0 0 45,000 12,000 21,000 10,000 0 10 0 0 1
Penina Okoth 1 0 0 0 0 0 0 0 1 0 0 0 1 0 0 1 0 1 0 0 0 0 36,000 28,000 15,000 8,000 1 10 0 1 0
Phelega Agola 1 0 1 0 0 0 0 1 0 0 0 1 1 0 0 0 0 0 0 0 0 0 26,000 11,000 9,000 6,000 0 0 1 0 0
Phenus Okoth 0 1 1 0 0 0 0 1 0 0 0 1 1 0 0 0 0 0 0 0 0 0 17,000 6,000 8,000 7,000 0 0 0 0 1
Phoebe Kobara 0 1 1 0 0 0 0 1 0 0 0 1 1 0 0 0 0 0 0 0 0 0 16,000 1,000 10,000 8,000 0 0 0 0 1
Phoebe Nyakido 1 0 0 0 0 0 0 0 1 0 0 0 1 0 0 0 0 0 0 0 0 0 39,000 20,000 18,000 10,000 0 0 0 1 0
Pricila Barongo 1 0 0 0 0 0 0 0 0 1 0 0 1 0 0 0 0 0 0 0 0 0 55,000 25,000 19,000 11,000 0 0 0 1 0
Rael Awino 1 0 0 0 0 0 0 0 1 0 0 0 1 0 0 0 0 0 0 0 0 0 51,000 34,000 18,000 7,000 0 0 0 1 0
Rael Odongo 1 0 0 0 0 0 0 0 1 0 0 0 1 1 0 0 0 1 0 0 0 0 20,000 10,000 17,000 8,000 0 0 1 0 0
rebecca Owuor 1 0 0 0 0 0 0 0 0 0 0 1 1 0 0 0 0 0 0 0 0 0 38,000 32,000 14,000 7,000 0 0 0 1 0
Rena Oluoch 1 0 0 0 0 0 0 0 0 1 0 0 1 0 0 0 0 0 0 0 0 0 34,000 21,000 16,000 9,000 0 0 0 0 1
Rispa Obat 1 0 1 0 0 0 0 1 1 0 0 0 1 0 0 0 0 0 0 0 0 0 40,000 22,000 12,000 8,000 0 0 0 1 0
Rispa Okeyo 1 0 0 0 0 0 0 0 0 0 0 1 1 0 0 0 0 0 0 0 0 0 36,000 10,000 21,000 7,000 0 0 1 0 0
Risper Aluko 0 1 1 0 0 0 0 1 0 0 0 1 1 0 0 0 0 0 0 0 0 0 17,000 7,000 13,000 8,000 0 0 1 0 0
Rosamael Adoyo 1 0 1 0 0 0 0 1 0 0 1 0 1 1 0 0 0 1 0 0 0 0 28,000 12,000 18,000 9,000 0 0 0 0 1
Rose Achieng 0 1 1 0 0 0 0 1 0 0 0 1 1 0 0 0 0 0 0 0 0 0 70,000 40,000 50,000 10,000 0 0 1 0 0
rose Akeyo 0 1 1 0 0 0 0 1 0 0 0 1 1 0 0 0 0 0 0 0 0 0 60,000 50,000 40,000 50,000 0 0 1 0 0
Rose Anyango 0 1 0 0 0 0 0 0 0 0 0 1 1 0 0 0 0 0 0 0 0 0 80,000 40,000 50,000 60,000 0 0 1 0 0
Rose AOtieno 1 0 0 0 0 0 0 0 1 0 0 0 1 0 0 0 0 0 0 0 0 0 31,000 24,000 16,000 9,000 1 10 0 1 0
Rose Kelly 0 1 1 0 0 0 0 1 1 0 0 0 1 0 0 0 0 0 0 0 0 0 45,000 40,000 18,000 11,000 0 0 0 1 0
Rose Nyawara 0 1 1 0 0 0 0 1 0 0 0 1 1 0 0 0 0 0 0 0 0 0 20,000 8,000 15,000 10,000 0 0 0 1 0
Rose Odul 1 0 0 0 0 0 0 0 1 0 0 0 1 0 0 0 0 0 0 0 0 0 30,000 23,000 13,000 7,000 0 0 1 0 0
Rose Okello 0 1 1 0 0 0 0 1 0 0 0 1 1 0 0 0 0 0 0 0 0 0 35,000 15,000 14,000 8,000 0 0 1 0 0
Rose Olale 1 0 0 0 0 0 0 0 0 0 0 0 0 0 0 0 0 0 0 0 0 0 30,000 15,000 10,000 9,000 0 0 1 0 0
Rosebella Okumu 1 0 1 0 0 0 0 1 0 0 0 1 1 0 0 0 0 0 0 0 0 0 18,000 10,000 16,000 11,000 0 0 0 0 1
Roseline Nalo 0 1 1 0 0 0 0 1 0 0 0 1 1 0 0 0 0 0 0 0 0 0 17,000 8,000 9,000 7,000 0 0 1 0 0
Roseline Yoga 1 0 1 0 0 0 0 1 0 1 0 0 1 0 0 0 0 0 0 0 0 0 34,000 12,000 14,000 7,000 0 0 1 0 0
Ruth Anyango 1 0 1 0 0 0 0 1 0 1 0 0 1 0 0 0 0 0 0 0 0 0 52,000 37,000 17,000 8,000 1 10 1 0 0
Ruth Odhiambo 1 0 0 0 0 0 0 0 0 0 0 1 1 0 0 0 0 0 0 0 0 0 57,000 28,000 15,000 10,000 0 0 0 1 0
Ruth Peter 1 0 0 0 0 0 0 0 0 1 0 0 1 0 0 0 0 0 0 0 0 0 26,000 12,000 14,000 8,000 0 0 1 0 0
Salien Ouma 1 0 1 0 0 0 0 1 1 0 0 0 1 1 0 0 0 1 1 0 0 1 39,000 28,000 20,000 9,000 0 0 1 0 0
Salina Olum 0 1 1 0 0 0 0 1 0 0 0 1 1 0 0 0 0 0 0 0 0 0 20,000 12,000 15,000 11,000 0 0 0 1 0
Saline Atieno 1 0 0 0 0 0 0 0 1 0 0 0 1 0 0 0 0 0 0 0 0 0 18,000 12,000 14,000 7,000 0 0 0 1 0
Salome Aluoch 1 0 0 0 0 0 0 0 1 0 0 0 1 0 0 0 0 0 0 0 0 0 30,000 20,000 20,000 10,000 2 30 1 0 0
Salome Auko 0 1 1 0 0 0 0 1 0 0 0 1 1 0 0 0 0 0 0 0 0 0 50,000 30,000 40,000 28,000 0 0 1 0 0
Salome Ndira 1 0 0 0 0 0 0 0 1 0 0 0 1 0 0 0 0 0 0 0 0 0 57,000 32,000 9,000 7,000 0 10 0 1 0
Salome Ouma 1 0 0 0 0 0 0 0 0 0 0 1 1 0 0 0 0 0 0 0 0 0 29,000 10,000 19,000 8,000 0 0 0 0 1
Sammy Kasera 1 0 0 0 0 0 0 0 0 0 0 1 1 0 0 0 0 0 0 0 0 0 180,000 120,000 22,000 14,000 0 0 1 0 0
Sarah Koko 0 1 1 0 0 0 0 1 0 0 0 1 1 0 0 0 0 0 0 0 0 0 16,000 8,000 10,000 6,000 0 0 1 0 0
Selline Abiero 1 0 0 0 0 0 0 0 1 0 0 0 1 1 0 0 0 1 0 1 0 1 63,000 20,000 27,000 10,000 0 10 1 0 0
Seraphine Auma 0 1 1 0 0 0 0 1 0 0 0 1 1 0 0 0 0 0 0 0 0 0 19,000 10,000 13,000 9,000 0 0 1 0 0
Sharon Atieno 0 1 1 0 0 0 0 1 0 0 0 1 1 0 0 0 0 0 0 0 0 0 70,000 50,000 80,000 30,000 0 0 1 0 0
Sipros Otieno 1 0 1 0 0 0 0 1 0 1 0 0 1 0 0 0 0 0 0 0 0 0 85,000 50,000 18,000 12,000 0 0 1 0 0
Siprose Okoyo 0 1 1 0 0 0 0 1 0 0 0 1 1 0 0 0 0 0 0 0 0 0 18,000 11,000 12,000 9,000 0 0 1 0 0
Sofia Adhiambo 0 1 1 0 0 0 0 1 0 0 0 1 1 0 0 0 0 0 0 0 0 0 16,000 7,000 13,000 11,000 0 0 0 1 0
Sophia Atieno 0 1 1 0 0 0 0 1 0 0 0 1 1 0 0 0 0 0 0 0 0 0 15,000 8,000 9,000 7,000 0 0 1 0 0
Stella Okoth 0 1 0 0 0 1 0 1 1 0 0 0 1 0 0 0 0 0 0 0 0 0 50,000 30,000 17,000 12,000 0 0 1 0 0
Susan Odwor 0 1 1 0 0 0 0 1 0 0 0 1 1 0 0 0 0 0 0 0 0 0 15,000 7,000 7,000 6,000 0 0 1 0 0

WEF Loanee
Constituency Market Penetration Strategy Market Development Product Development Diversification Strategy Growth Details Loanee Category
Kasipul
Kabondo
Kasipul
Competitve
Pricing
Advertising
sales
promotion
dedicate
d
personal selling
Other
Total
Identifying
new uses
of existing products
Identifying
new
demography
Identifying
new
psycho- graphy
Indentifying
new
geographic al markets
Total
advantage
of a
favourite reputation
Advantag
e of brand
name
Prolonging
life cycle
Other
Total
New
products
, related markets
new product
closely
related
to
current
products
in new markets
entirely
new
products
in an
entirely
new market
Total
Current
business
worth (Kes)
Business
worth
before first WEF loan
Current
monthly
turnover
Monthly
turnover
before
first WEF loan
No. Of
Staff
before
WEF Loan
Current
No. Of
Staff
Retail
Repairs Or
Services
Agriculture
Syprina Oyugi 1 0 0 0 0 0 0 0 1 0 0 0 1 0 0 0 0 0 0 0 0 0 14,000 8,000 9,000 6,000 0 0 1 0 0
Syprosa Oyugi 1 0 0 0 0 0 0 0 0 0 0 1 1 0 0 0 0 0 0 0 0 0 30,000 15,000 17,000 9,000 0 0 0 1 0
Syprose Sore 1 0 0 0 0 1 0 1 0 0 0 1 1 0 0 0 0 0 0 0 0 0 39,000 6,000 23,000 3,800 0 0 0 1 0
Tabitha Aduol 0 1 1 0 0 0 0 1 0 0 0 1 1 0 0 0 0 0 0 0 0 0 15,000 7,000 9,000 6,000 0 0 1 0 0
Tabitha Ogaga 1 0 0 0 0 0 0 0 0 1 0 0 1 0 0 0 0 0 0 0 0 0 37,000 10,000 25,000 7,000 0 0 0 1 0
Tenna Okun 1 0 1 0 0 0 0 1 0 0 0 0 0 0 0 0 0 0 0 0 0 0 31,000 16,000 15,000 10,000 0 0 0 1 0
Teresa Owuor 0 1 1 0 0 0 0 1 0 0 0 1 1 0 0 0 0 0 0 0 0 0 18,000 10,000 13,000 9,000 0 0 1 0 0
Teresia Osila 1 0 0 0 0 0 0 0 1 0 0 0 1 0 0 0 0 0 0 0 0 0 15,000 10,000 9,000 6,000 0 0 0 1 0
Tobias Onyango 1 0 0 0 0 0 0 0 1 0 0 0 1 0 0 0 0 0 0 0 0 0 24,000 13,000 21,000 11,000 1 10 0 1 0
Turphenia Omolo 1 0 1 0 0 0 0 1 1 0 0 0 1 0 0 0 0 0 0 0 0 0 29,000 20,000 11,000 7,000 0 0 1 0 0
Victor Ochieng 1 0 0 0 0 0 0 0 0 0 0 1 1 0 0 0 0 0 0 0 0 0 36,000 22,000 13,000 7,000 0 0 1 0 0
Vivian Ochieng 1 0 0 0 0 0 0 0 0 1 0 0 1 0 0 0 0 0 0 0 0 0 39,000 18,000 24,000 13,000 0 0 0 1 0
Vivian Salim 1 0 1 0 0 0 0 1 1 0 0 0 1 0 1 0 0 1 1 0 0 1 52,000 38,000 21,000 12,000 1 10 1 0 0
Wilfrida Akoth 1 0 0 0 0 0 0 0 1 0 0 0 1 0 0 0 0 0 0 0 0 0 17,000 6,000 12,000 5,000 0 0 1 0 0
Wilkister Simba 1 0 0 0 0 0 0 0 0 0 0 1 1 0 0 0 0 0 0 0 0 0 30,000 25,000 12,000 9,000 0 0 0 0 1
Winnie Ochieng 1 0 0 0 0 0 0 0 1 0 0 0 1 0 0 0 0 0 0 0 0 0 39,000 21,000 18,000 6,000 0 0 1 0 0
Yunes Apiyo 0 1 1 0 0 0 0 1 0 0 0 1 1 0 0 0 0 0 0 0 0 0 17,000 10,000 12,000 9,000 0 0 0 1 0
Yunita Okeyo 0 1 1 0 0 0 0 1 0 0 0 1 1 0 0 0 0 0 0 0 0 0 16,000 7,000 8,000 6,000 0 0 0 0 1
Zilpa Ndege 1 0 0 0 0 0 0 0 1 0 0 0 1 0 0 0 0 0 0 0 0 0 19,000 11,000 12,000 6,000 0 0 0 0 1 200 135 182 2 1 10 1 196 98 41 9 170 318 12 2 1 1 16 4 2 2 8 185 99 51