Effect of cloudiness on the production of electricity by ...
4
a Corresponding author: [email protected] Effect of cloudiness on the production of electricity by photovoltaic panels Pavel Chrobak 1,a , Jan Skovajsa 1 and Martin Zalesak 1 1 Tomas Bata University in Zlin, Faculty of Applied Informatics, Namesti T.G.Masaryka 5555, 760 01 Zlin, Czech Republic Abstract. The paper deals with the influence of different types of cloud on the production of electricity by photovoltaic panels. In the introductory part of the paper, processes in the atmosphere are described, giving rise to various types of clouds and, consequently, to the formation of cloud. In the next section of the paper, the system is described on which the research and the methodology of acquisition and data evaluation were carried out. The last part of the paper summarizes the overall results of the research. 1 Introduction Nowadays, there is an increasing development of photovoltaic power plants which serve as a source of clean energy for power, whether the large industrial enterprises or small houses. These photovoltaic plants convert sunlight to electricity by the various types of photovoltaic cells which differ both in used construction materials, efficiency and cost. Moreover, the increase of temperature is causing decrease of effectiveness of the photovoltaic panel. This phenomenon is a common property of photovoltaic panel. This declination of the efficiency and thus the production of electrical energy may vary according to the type of photovoltaic cell due to the increased surface temperature. The production of electric energy also affects the orientation, position, inclination, and the ambient climate conditions in which the photovoltaic panels are located. In this post, we will focus mainly on the issue of the impact of changing climatic conditions for the production of electricity. These issues are often ignored while changing climatic conditions, in which the photovoltaic panels are located, may have significant impact on the total production of electricity in long time horizon. In particular, the incidence of various types of cloudiness which are formed during the day and at certain time intervals prevents impact of the direct solar radiation on the photovoltaic panels. 2 Processes leading to formation of cloudiness From the surface of the water, soil and living organism, particles of water or ice evaporates into the atmosphere, and at a certain height above the ground surface gradually condensing into droplets or ice crystals that form clouds. Height, at which this process takes place, is variable and the boundary at which the water in the vapour phase transformed into liquid is called the dew point. This depends on the stability of the air and the percentage of moisture. The average particle size of water or ice crystals in a cloud is 0.01 mm [1, 2]. Clouds vary not only on the height in which is formed, but also on the appearance, properties and may consist of particles of different size and origin. Formation and development of the cloud is connected with the thermodynamic conditions occurring in the ambient atmosphere, and inside the cloud. Maximum water vapour concentration in the atmosphere is 4 percent, and if it is reached then we talk about a hundred percentage of humidity. The size of the droplets, that form clouds, is different depending on the types of individual clouds. Rain clouds (Nimbostratus) contain the largest droplets of size up to one hundred micrometre. The smallest droplets are about nine micrometres. These droplets are contained in the clouds of Cumulus type, and Stratus. Basic international classification divides clouds into 10 cloud types. Given the observed differences in appearance and internal structure of the clouds, the clouds were further separated into 14 basic shapes. For this reason, the cloud observed in the sky may be labelled with the name of only one shape, which means that shapes of clouds are mutually exclusive. Certain shapes can also be found in several types of clouds. The clouds may also have particular characteristics, which are called varieties and distinction nine of them [3, 4]. These distinctive features are related to the different arrangement of cloud elements (for example the arrangement in the form of waves, etc.) and more or less translucency. The variety may again be common to several kinds of clouds. For some clouds, the withholding stripes, shreds of low clouds, etc. can occur directly in the cloud or outside the cloud. This certain characteristic DOI: 10.1051/ 02010 (2016) matecconf/2016 MATEC Web of Conferences 7602010 7 2016 , 6 CSCC © The Authors, published by EDP Sciences. This is an open access article distributed under the terms of the Creative Commons Attribution License 4.0 (http://creativecommons.org/licenses/by/4.0/). brought to you by CORE View metadata, citation and similar papers at core.ac.uk provided by Institutional repository of Tomas Bata University Library
Transcript of Effect of cloudiness on the production of electricity by ...
a Corresponding author: [email protected]
Effect of cloudiness on the production of electricity by photovoltaic panels
Pavel Chrobak1,a, Jan Skovajsa1 and Martin Zalesak1 1Tomas Bata University in Zlin, Faculty of Applied Informatics, Namesti T.G.Masaryka 5555, 760 01 Zlin, Czech Republic
Abstract. The paper deals with the influence of different types of cloud on the production of electricity by
photovoltaic panels. In the introductory part of the paper, processes in the atmosphere are described, giving rise to
various types of clouds and, consequently, to the formation of cloud. In the next section of the paper, the system is
described on which the research and the methodology of acquisition and data evaluation were carried out. The last
part of the paper summarizes the overall results of the research.
1 Introduction
Nowadays, there is an increasing development of
photovoltaic power plants which serve as a source of
clean energy for power, whether the large industrial
enterprises or small houses. These photovoltaic plants
convert sunlight to electricity by the various types of
photovoltaic cells which differ both in used construction
materials, efficiency and cost. Moreover, the increase of
temperature is causing decrease of effectiveness of the
photovoltaic panel. This phenomenon is a common
property of photovoltaic panel. This declination of the
efficiency and thus the production of electrical energy
may vary according to the type of photovoltaic cell due to
the increased surface temperature. The production of
electric energy also affects the orientation, position,
inclination, and the ambient climate conditions in which
the photovoltaic panels are located.
In this post, we will focus mainly on the issue of the
impact of changing climatic conditions for the production
of electricity. These issues are often ignored while
changing climatic conditions, in which the photovoltaic
panels are located, may have significant impact on the
total production of electricity in long time horizon. In
particular, the incidence of various types of cloudiness
which are formed during the day and at certain time
intervals prevents impact of the direct solar radiation on
the photovoltaic panels.
2 Processes leading to formation of cloudiness
From the surface of the water, soil and living organism,
particles of water or ice evaporates into the atmosphere,
and at a certain height above the ground surface gradually
condensing into droplets or ice crystals that form clouds.
Height, at which this process takes place, is variable and
the boundary at which the water in the vapour phase
transformed into liquid is called the dew point. This
depends on the stability of the air and the percentage of
moisture. The average particle size of water or ice
crystals in a cloud is 0.01 mm [1, 2]. Clouds vary not
only on the height in which is formed, but also on the
appearance, properties and may consist of particles of
different size and origin. Formation and development of
the cloud is connected with the thermodynamic
conditions occurring in the ambient atmosphere, and
inside the cloud. Maximum water vapour concentration in
the atmosphere is 4 percent, and if it is reached then we
talk about a hundred percentage of humidity. The size of
the droplets, that form clouds, is different depending on
the types of individual clouds. Rain clouds
(Nimbostratus) contain the largest droplets of size up to
one hundred micrometre. The smallest droplets are about
nine micrometres. These droplets are contained in the
clouds of Cumulus type, and Stratus.
Basic international classification divides clouds into
10 cloud types. Given the observed differences in
appearance and internal structure of the clouds, the
clouds were further separated into 14 basic shapes. For
this reason, the cloud observed in the sky may be labelled
with the name of only one shape, which means that
shapes of clouds are mutually exclusive. Certain shapes
can also be found in several types of clouds. The clouds
may also have particular characteristics, which are called
varieties and distinction nine of them [3, 4]. These
distinctive features are related to the different
arrangement of cloud elements (for example the
arrangement in the form of waves, etc.) and more or less
translucency. The variety may again be common to
several kinds of clouds. For some clouds, the withholding
stripes, shreds of low clouds, etc. can occur directly in the
cloud or outside the cloud. This certain characteristic
DOI: 10.1051/02010 (2016) matecconf/2016MATEC Web of Conferences 76020107
2016
,6
CSCC
© The Authors, published by EDP Sciences. This is an open access article distributed under the terms of the Creative Commons Attribution License 4.0 (http://creativecommons.org/licenses/by/4.0/).
brought to you by COREView metadata, citation and similar papers at core.ac.uk
provided by Institutional repository of Tomas Bata University Library
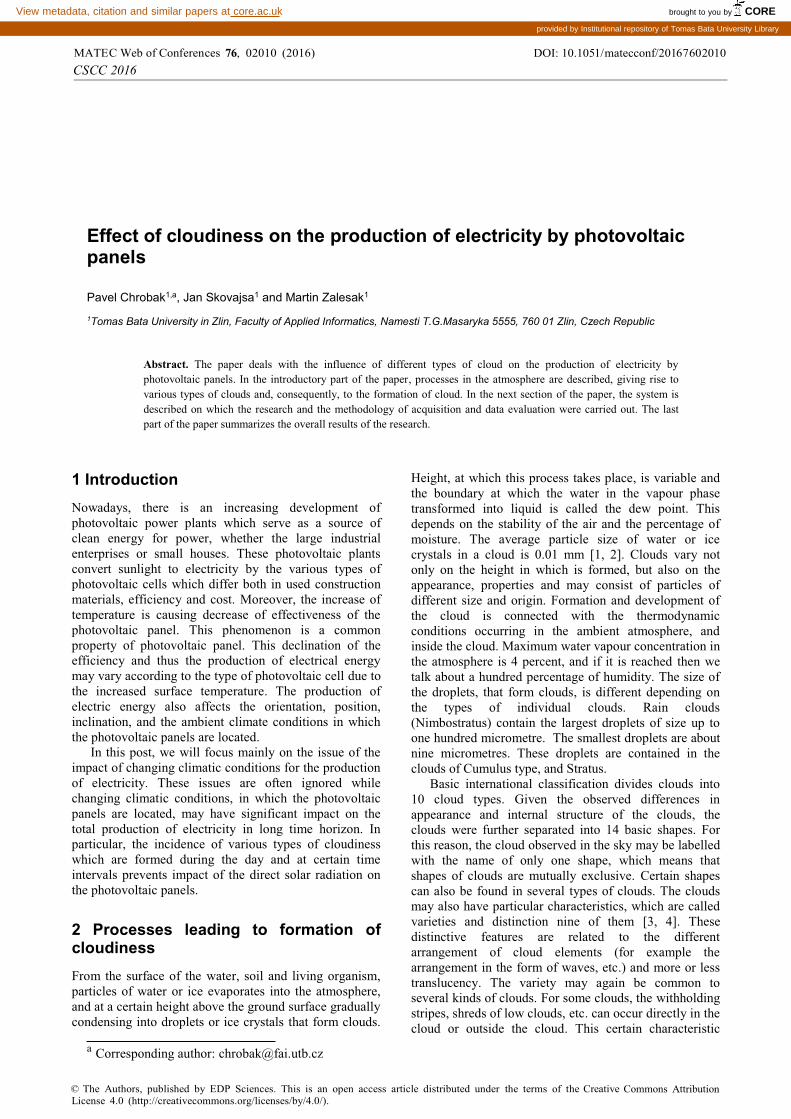
traits are referred to as peculiarities clouds. The following
Figure 1 shows ten basic types of cloud [5].
Cirrus Cirrocumulus
Cirrostratus Altocumulus
Altostratus Stratocumulus
Stratocumulus Kumulus
Nimbostratus Cumulonimbus
Figure 1. Types of clouds. [5]
According to the altitude of its occurrence, the clouds
are classified into three levels. The first level is low,
which is up to 2 km from the earth's surface. Second level
is medium (2-7 km) and last is high (5-13 km). Part of the
sky covered with clouds is called cloudiness [5].
Cloudiness can be given in the eights (meteorologists) or
in the tenths (climatologists) and expresses the fraction of
the sky covered with clouds. Completely clear sky has
zero cloudiness. If the sky is completely covered with
clouds, the cloudiness is on code eight according to the
scale used by meteorologists. Individual degrees of
cloudiness used in meteorology are shown in Table 1.
Table 1. The degree of cloudiness and their brands. [6]
Coverage x code Meaning Symbol
0/8 x 0 Sky completely clear
1/8 x 1 Sky completely clear
2/8 x 2 Almost sky completely
clear
3/8 x 3 Small cloudy
4/8 x 4 Sky half cloudy
5/8 x 5 Cloudy
6/8 x 6 Cloudy
7/8 x 7 Almost cloudy
8/8 x 8 Sky completely cloudy
x 9 Sky obstructed from view
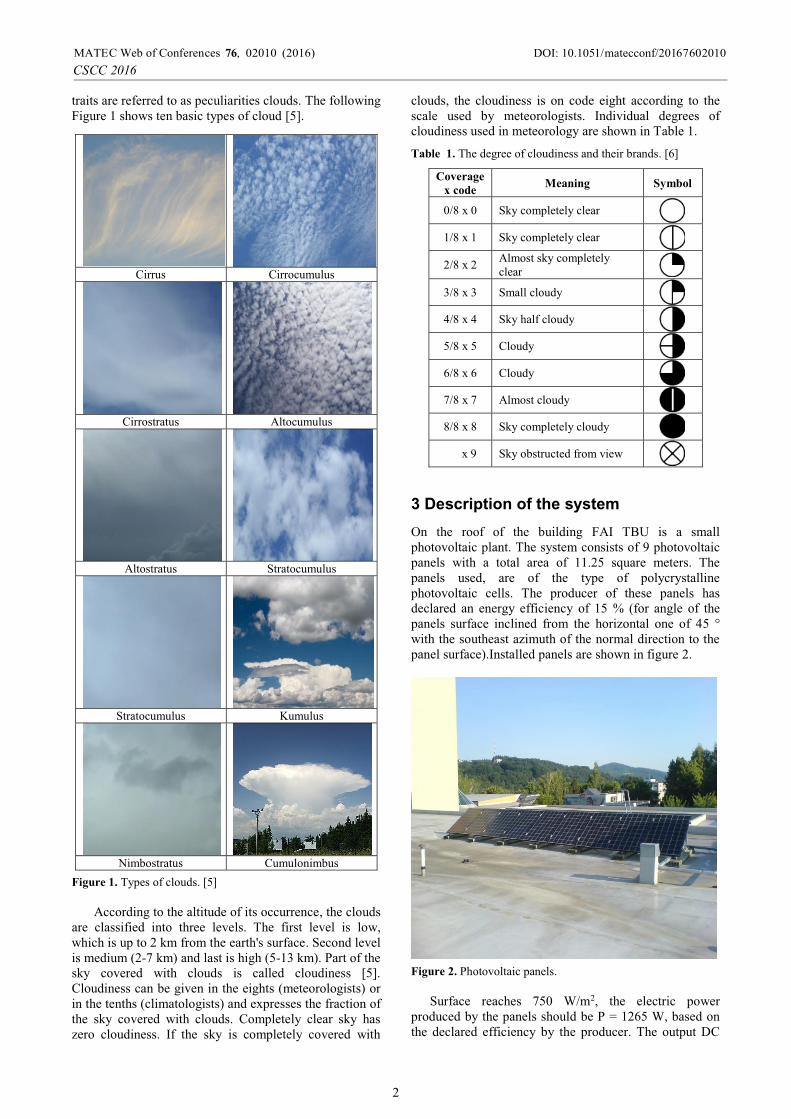
3 Description of the system
On the roof of the building FAI TBU is a small
photovoltaic plant. The system consists of 9 photovoltaic
panels with a total area of 11.25 square meters. The
panels used, are of the type of polycrystalline
photovoltaic cells. The producer of these panels has
declared an energy efficiency of 15 % (for angle of the
panels surface inclined from the horizontal one of 45 °
with the southeast azimuth of the normal direction to the
panel surface).Installed panels are shown in figure 2.
Figure 2. Photovoltaic panels.
Surface reaches 750 W/m2, the electric power
produced by the panels should be P = 1265 W, based on
the declared efficiency by the producer. The output DC
DOI: 10.1051/02010 (2016) matecconf/2016MATEC Web of Conferences 76020107
2016
,6
CSCC
2

voltage of the panels is converted by the AC voltage
inverter in one phase AC current with the 230 V AC. This
inverter is housed in the building faculty and in the
laboratory of environmental engineering and energy
efficiency is ηeuro = 91.8 %. This value is measured under
varying climatic conditions. Maximum efficiency were
reached ηmax = 93.5 % with the optimal measuring
conditions (stable temperature conditions, nominal DC
voltage and medium values of AC power). The rest of the
converted energy is lost by the electrical conversion in
the form of heat [7], [8].
4 Measurement
Collecting meteorological conditions occurred at the
placement of photovoltaic panels in October, November,
December, and January in year 2015 and 2016,
respectively. For this purpose, the weather station on the
building of FAI was used, which provided data on the
average outdoor temperature and global solar radiation.
Furthermore, the cloud amount occurring in Zlin was
observed. Data were obtained from the Czech
Hydrometeorological Institute (CHMI) that publishes this
information on their website in the form of graphs. This
includes a summary of the percentage coverage of the
different types of cloudiness for high, medium, low and
the total cloud cover for each hour occurring at the
placement of photovoltaic panels. These data from graphs
were regularly read out and written to the database. The
last part of the record is complemented by information on
the amount of electricity produced by photovoltaic
panels. The following Table 2 shows the average amount
of each type of cloudiness occurring in selected months
of the year along with production of electricity with
photovoltaic panels and the amount of solar radiation
incident on a horizontal plane.
Table 2. Coverage cloudiness in selected months.
Months
Coverage cloudiness [%] Global
solar
radiation
[W/m2]
Producti
on PV
[kWh] low medium high overall
October 40.23 44.49 42.19 68.61 80.73 3.106
November 34.01 46.63 42.88 68.81 52.14 2.652
December 45.40 35.14 30.65 62.25 23.27 1.006
January 52.45 48.74 29.98 74.46 30.12 1.370
In the months of December and January, resulting
values of production of electrical energy, global solar
radiation and the degree of the sky clouded were adjusted
for days in which power were not produced due to
unfavourable weather conditions. Especially in days
when the solar panels were covered with a thick layer of
frost or snow, which made it impossible to produce
electricity for a significant part of the day. Table 3 details
the values of electrical energy production for selected day
in the month of November.
Table 3. Production of electricity in different parts of the day.
Time
[h:min]
Coverage cloudiness [%] Global
solar
radiation
[W/m2]
Producti
on PV
[kWh] low medium high overall
6:00 85 20 78 97 3.29 0.002
7:00 93 35 70 98 66.12 0.038
8:00 96 60 63 99 185.68 0.153
9:00 98 86 65 100 302.35 0.267
10:00 96 83 60 99 264.07 0.202
11:00 98 95 62 100 291.49 0.246
12:00 95 92 0 99 352.93 0.336
13:00 95 96 0 100 156.84 0.114
14:00 90 97 0 100 155.75 0.117
15:00 95 85 0 99 237.43 0.199
16:00 75 85 5 96 414.25 0.378
17:00 75 70 30 95 325.83 0.075
18:00 40 65 40 84 119.87 0.025
19:00 9 25 30 60 0.58 0.002
Average 81.43 71.00 35.93 94.71 205.46 0.150
Figure 3 shows the dependence of the total cloudiness
on the intensity of solar radiation and power production
in the month of November. Degree sky coverage cloud is
here expressed in the eights.
Figure 3. The dependence of the total cloudiness on production electrical energy.
5 Results
From the measured values, which are listed in table 2, the
occurrence of cloudiness in the different parts of the year,
showing that the overall power production in individual
months affects irradiance photovoltaic modules. On the
other hand, the individual cloudy days do not affect the
overall production of electricity. Decisive in this case,
that the average value of the solar radiation and the
lighting time of photovoltaic panels which are different
each part of the year. Table 3 lists grade cloud cover,
solar radiation and the amount of electricity produced by
photovoltaic panels for each hour. These values were
measured for each day in months. From these data, the
values of the percentage coverage of the sky by different
types of cloudiness, solar radiation intensity and the
amount of electricity produced had been selected only 12
hour for each day of the month. All these values had been
summarized in the database and linear regression was
used to determine the effects of the percentage coverage
DOI: 10.1051/02010 (2016) matecconf/2016MATEC Web of Conferences 76020107
2016
,6
CSCC
3

of the sky clouds on the production of electricity
photovoltaic panels. The results showed that the
production of electricity by photovoltaic panels at the
same percentage sky coverage of clouds is random. These
measured data cannot determine the dependence between
cloudiness and the production of the electricity. The same
procedure was applied to determine the dependence of
the cloudiness on the intensity of the global solar
radiation incident on a horizontal plane. Even in this case,
it showed that the intensity of the solar radiation is
random and these measured data cannot define the
dependence between the cloudiness and the light intensity
on the horizontal plane.
6 Conclusion
In our case, the determination of the percentage of the
dependence between cloudiness and the production of the
electricity of photovoltaic panels cannot be determined
from the collected data in number of reasons. The
measurement of the percentage of coverage cloudiness
can determine what cloud cover it is whether it is high,
medium or low, but we cannot determine the strength of
cloud cover, type and density of clouds, which are in
various heights. This information is clearly essential for
determining the influence of individual kinds of
cloudiness on the production of electricity by
photovoltaic panels, because the strength and type of
cloud very substantially affects the transmittance of
sunshine through the cloud. Based on the results, it is
impossible to determine the effect of different types of
clouds on electricity production of photovoltaic panels.
The measured data shows that the most negative effect on
the daily production of electricity is low cloud cover,
because it prevents the passage of most of sunlight. Other
climatic conditions that affect the production of
electricity are ambient temperature, humidity (mist) the
degree of air pollution and the wind, which increases heat
dissipation from the surface of photovoltaic panels in
clear days, and thus increases efficiency.
Further research will focus on determining the
passage of the solar radiation different types of clouds.
On the basis of these results, model that will determine
exactly how clouds influence production of photovoltaic
power plants will be created.
Acknowledgement
This work was supported by the Ministry of Education,
Youth and Sports of the Czech Republic within the
National Sustainability Programme project No. LO1303
(MSMT-7778/2014) and also by the European Regional
Development Fund under the project CEBIA-Tech No.
CZ.1.05/2.1.00/03.0089 and also by internal grant agency
of Tomas Bata University in Zlin no. IGA/CEBIA-
Tech/2016/001.
References
1. Meteocentrum [Online]. Prague: 2014, [cit.2016-04-13]. Available: http://www.meteocentrum.cz/zajimav osti/encyklipedie/oblacnost.
2. Cloud atlas [Online]. Brno: 2005, [cit. 2016-04-10]. Available: http://mraky.astronomi e.cz/zvlastni.php
3. Weather station Maruska [Online]. Hostýnské vrchy: 2007 [cit. 2016-04-13]. Available: http://maruska.or doz.com/meteorologie/oblacnost
4. Sunny [Online]. Ostrava: 2014, [cit. 2016-04-13]. Available: http://www.slunecno.cz/clanky/oblacnost-a-jeji-urcovani-83
5. My NASA Data [online]. [cit. 2016-04-22]. Available: http://mynasadata.larc.nasa.gov/science_ projects/make-a-sky-mirror-to-observe-clouds-and contrails/
6. Weather news - Meteoblog [Online]. 2012 [cit. 2016-04-27]. Available: http://meteo-aktuality.blog. cz/15 12/meteorologicke-znacky
7. P. Chrobak, M. Zalesak, M. Oplustil, S. Sehnalek, J. Vincenec. In: Proceedings of the International Conferences: Latest Trends on Systems - Volume II.1. rel. Santorini Island, Greece, (2014), s. 581-587. ISBN 978-1-61804-244-6ISSN 1790-5117.
8. T. Habrovansky. Control and monitoring of heating
and cooling units in laboratory of building control
systems. Zlin (2014). Available: http://dspace.k.utb.c z/handle/10 563/ 6910
DOI: 10.1051/02010 (2016) matecconf/2016MATEC Web of Conferences 76020107
2016
,6
CSCC
4