EEG Source Network for the Diagnosis of Schizophrenia and ...
13
Journal of Clinical Medicine Article EEG Source Network for the Diagnosis of Schizophrenia and the Identification of Subtypes Based on Symptom Severity—A Machine Learning Approach Jeong-Youn Kim 1 , Hyun Seo Lee 2 and Seung-Hwan Lee 2,3, * 1 Center for Bionics, Korea Institute of Science and Technology (KIST), Seoul 02792, Korea; [email protected] 2 Clinical Emotion and Cognition Research Laboratory, Inje University, Goyang 10380, Korea; [email protected] 3 Department of Psychiatry, Inje University, Ilsan-Paik Hospital, Goyang 10380, Korea * Correspondence: [email protected] or [email protected] Received: 29 October 2020; Accepted: 2 December 2020; Published: 4 December 2020 Abstract: A precise diagnosis and a comprehensive assessment of symptom severity are important clinical issues in patients with schizophrenia (SZ). We investigated whether electroencephalography (EEG) features obtained from EEG source network analyses could be effectively applied to classify the SZ subtypes based on symptom severity. Sixty-four electrode EEG signals were recorded from 119 patients with SZ (53 males and 66 females) and 119 normal controls (NC, 51 males and 68 females) during resting-state with closed eyes. Brain network features (global and local clustering coefficient and global path length) were calculated from EEG source activities. According to positive, negative, and cognitive/disorganization symptoms, the SZ patients were divided into two groups (high and low) by positive and negative syndrome scale (PANSS). To select features for classification, we used the sequential forward selection (SFS) method. The classification accuracy was evaluated using 10 by 10-fold cross-validation with the linear discriminant analysis (LDA) classifier. The best classification accuracy was 80.66% for estimating SZ patients from the NC group. The best classification accuracy between low and high groups in positive, negative, and cognitive/disorganization symptoms were 88.10%, 75.25%, and 77.78%, respectively. The selected features well-represented the pathological brain regions of SZ. Our study suggested that resting-state EEG network features could successfully classify between SZ patients and the NC, and between low and high SZ groups in positive, negative, and cognitive/disorganization symptoms. Keywords: schizophrenia; subtypes; PANSS (positive and negative syndrome scale); EEG (electroencephalography); machine learning 1. Introduction Schizophrenia (SZ) has been primarily diagnosed based on diagnostic criteria from the Diagnostic and Statistical Manual of Mental Disorders (DSM-5) by asking patients a series of questions designed to elicit information, such as the duration of illness and presence of clinical symptoms [1]. Various diagnostic tools can aid psychiatrists and clinical psychologists in diagnosing SZ, but traditional clinical diagnoses might sometimes be inaccurate because SZ patients may intentionally obscure their symptoms, and even specialists often have difficulty distinguishing SZ from other psychoses due to similarities of symptoms [2–4]. Thus, several researchers have attempted to improve the overall accuracy of diagnosis by developing objective quantitative biomarkers using neuroimaging technologies. J. Clin. Med. 2020, 9, 3934; doi:10.3390/jcm9123934 www.mdpi.com/journal/jcm
Transcript of EEG Source Network for the Diagnosis of Schizophrenia and ...
Journal of
Clinical Medicine
Article
EEG Source Network for the Diagnosis ofSchizophrenia and the Identification of SubtypesBased on Symptom Severity—A MachineLearning Approach
Jeong-Youn Kim 1 , Hyun Seo Lee 2 and Seung-Hwan Lee 2,3,*1 Center for Bionics, Korea Institute of Science and Technology (KIST), Seoul 02792, Korea;
[email protected] Clinical Emotion and Cognition Research Laboratory, Inje University, Goyang 10380, Korea;
[email protected] Department of Psychiatry, Inje University, Ilsan-Paik Hospital, Goyang 10380, Korea* Correspondence: [email protected] or [email protected]
Received: 29 October 2020; Accepted: 2 December 2020; Published: 4 December 2020�����������������
Abstract: A precise diagnosis and a comprehensive assessment of symptom severity are importantclinical issues in patients with schizophrenia (SZ). We investigated whether electroencephalography(EEG) features obtained from EEG source network analyses could be effectively applied to classifythe SZ subtypes based on symptom severity. Sixty-four electrode EEG signals were recorded from119 patients with SZ (53 males and 66 females) and 119 normal controls (NC, 51 males and 68 females)during resting-state with closed eyes. Brain network features (global and local clustering coefficientand global path length) were calculated from EEG source activities. According to positive, negative,and cognitive/disorganization symptoms, the SZ patients were divided into two groups (high andlow) by positive and negative syndrome scale (PANSS). To select features for classification, we usedthe sequential forward selection (SFS) method. The classification accuracy was evaluated using 10 by10-fold cross-validation with the linear discriminant analysis (LDA) classifier. The best classificationaccuracy was 80.66% for estimating SZ patients from the NC group. The best classification accuracybetween low and high groups in positive, negative, and cognitive/disorganization symptoms were88.10%, 75.25%, and 77.78%, respectively. The selected features well-represented the pathologicalbrain regions of SZ. Our study suggested that resting-state EEG network features could successfullyclassify between SZ patients and the NC, and between low and high SZ groups in positive, negative,and cognitive/disorganization symptoms.
Keywords: schizophrenia; subtypes; PANSS (positive and negative syndrome scale); EEG(electroencephalography); machine learning
1. Introduction
Schizophrenia (SZ) has been primarily diagnosed based on diagnostic criteria from the Diagnosticand Statistical Manual of Mental Disorders (DSM-5) by asking patients a series of questionsdesigned to elicit information, such as the duration of illness and presence of clinical symptoms [1].Various diagnostic tools can aid psychiatrists and clinical psychologists in diagnosing SZ, but traditionalclinical diagnoses might sometimes be inaccurate because SZ patients may intentionally obscure theirsymptoms, and even specialists often have difficulty distinguishing SZ from other psychoses dueto similarities of symptoms [2–4]. Thus, several researchers have attempted to improve the overallaccuracy of diagnosis by developing objective quantitative biomarkers using neuroimaging technologies.
J. Clin. Med. 2020, 9, 3934; doi:10.3390/jcm9123934 www.mdpi.com/journal/jcm
J. Clin. Med. 2020, 9, 3934 2 of 13
Electroencephalography (EEG) is considered the most effective neuroimaging modality among thevarious neuroimaging methods due to its high time resolution and low cost. A number of studiesreported disruption of cortical information processing in SZ, based on distorted functional connectivitynetworks [5,6] and decreased source activity [7–10].
SZ is perceived as a complex illness portrayed by heterogeneous symptoms. Over recent decades,it has been perceived that schizophrenic symptoms in fact go beyond the dichotomous divisionsof positive versus negative domains [11]. The Positive and Negative Syndrome Scale (PANSS) isone of the most broadly utilized measures to assess the severity of positive symptoms and negativesymptoms in SZ research [12]. Other clinical tools, such as the Brief Negative Symptom Scale(BNSS) [13,14] and Schedule for the Deficit Syndrome (SDS) [15], can be used to assess negativesymptoms. Cognitive deficits have been emphasized as one of the important features of SZ [16].The Consortium to Establish a Registry for Alzheimer’s Disease (CERAD) [17] and Mini-Mental StateExamination (MMSE) [18] could be used to assess such cognitive symptoms. This cognitive impairmentis a broader concept than specific clinical disorganization symptoms. The clinical/disorganizationdomain is also one of the fundamental aspects of SZ [19]. The cognitive disorganization could beassessed by the PANSS with a five-factor model, which was created based on several factor analysisstudies [20,21]. The cognitive/disorganization factor delineates a cognitive dimension, as evidencedby the expression of the constituent symptoms, including conceptual disorganization, difficulty inabstract thinking, poor attention, disorientation, and preoccupation [21].
Thus far, the psychiatric symptom severity of SZ has generally been assessed using psychologicalmeasures, such as the PANSS [22], based on interview-based assessments conducted by trainedinterviewers. Although these assessments have been reported to provide high inter-rater reliability ortest/retest reliability [12,23], the results might be highly affected by original diagnosis [24] or biasedviews on the part of the psychiatrists [4]. In addition, the negative symptoms of SZ are more difficultto evaluate [2,4], because negative symptoms may have no clear signs or common behaviors thatoverlap with other mental diseases [25], and the negative symptoms are divided into two sub-domains:expressive deficits and social amotivation [26]. The assessment of symptom severity in SZ is critical inestablishing successful treatment strategies or evaluating the effectiveness of treatments. However,only few quantitative diagnosis tools exist to evaluate the symptom severity of individual patientswith SZ [27].
Previous studies reported that, compared to normal control (NC) groups, patients with SZ havedisruption of small-world networks during a resting-state based on EEG [28–30] and fMRI results [6,31].Disruptions in the small world network were found in several cortical regions, including the prefrontal,parietal, and temporal lobes [6,28,30,31]. Several fMRI studies have suggested significant correlationsbetween psychotic symptoms and decreased efficiency of brain networks. The negative symptomscore on the PANSS has a negative correlation with global efficiency and a positive correlationwith mean path length [32]. A decrease in connectivity between the cerebellum and dorsolateralprefrontal cortex was found to correlate with increased negative symptoms [33]. Positive symptomshave shown a positive correlation with functional connectivity in the posterior cingulate and middletemporal regions [34]. At the same time, disorganization symptoms may be correlated with impairedfunctioning of frontoparietal networks [35]. However, these correlation tendencies between thetopological indicators of brain networks and the clinical severity of SZ have not replicated in otherstudies [29,31,36].
In this study, we aimed to diagnose SZ compared to NC by brain network connectivity features ofEEG during a resting-state. In addition, we tried to classify patients with SZ into high vs. low symptomgroups for positive, negative, and cognitive/disorganization symptoms.
J. Clin. Med. 2020, 9, 3934 3 of 13
2. Materials and Methods
2.1. Participants
A total of 119 SZ patients (male: 53, female: 66, age: 36.26± 12.40 (range: 16–61)) were recruited forthis study; they underwent the Structured Clinical Interview for DSM-V Axis I disorders (SCID-I) [37].The PANSS was used to evaluate patients’ psychiatric symptoms [12]. Patients with a lifetime historyof central nervous system disease, alcohol or drug abuse, mental retardation, or head injury with lossof consciousness, and patients with current Axis II disorders were excluded from the study. Among the119 SZ patients, 25 were drug naive and 94 were taking antipsychotic medications (aripiprazole: n = 11,amisulpride: n = 10, blonanserin: n = 6, clozapine: n = 5, haloperidol: n = 1, olanzapine: n = 16,paliperidone: n = 11, quetiapine: n = 10, risperidone: n = 22, ziprasidone: n = 1, zotepine: n = 1)during the course of the study.
A total of 119 NC participants (male: 51, female: 68, age: 36.67 ± 11.66 (range: 20–61)) wererecruited from local community advertising. They underwent an initial screening interview and wereexcluded if they had shown any identifiable neurological disorder, head injury, or any personal orfamily history of psychiatric illness. The further exclusion was processed through the StructuredClinical Interview for DSM V for Axis I Psychiatric Disorders [37]. All procedures followed wereapproved by the Institutional Review Board (IRB) at Inje University Ilsan Paik Hospital, Republic ofKorea (2018-12-012-002), and were executed following the guidelines and regulations of the board.All participants provided written informed consent, and legal guardians provided informed consent ifthe participants were under the age of 18. Demographic data of the SZ and NC groups and the meanand standard deviation (SD) of psychiatric symptom severity scores in the SZ group are reported inTable 1.
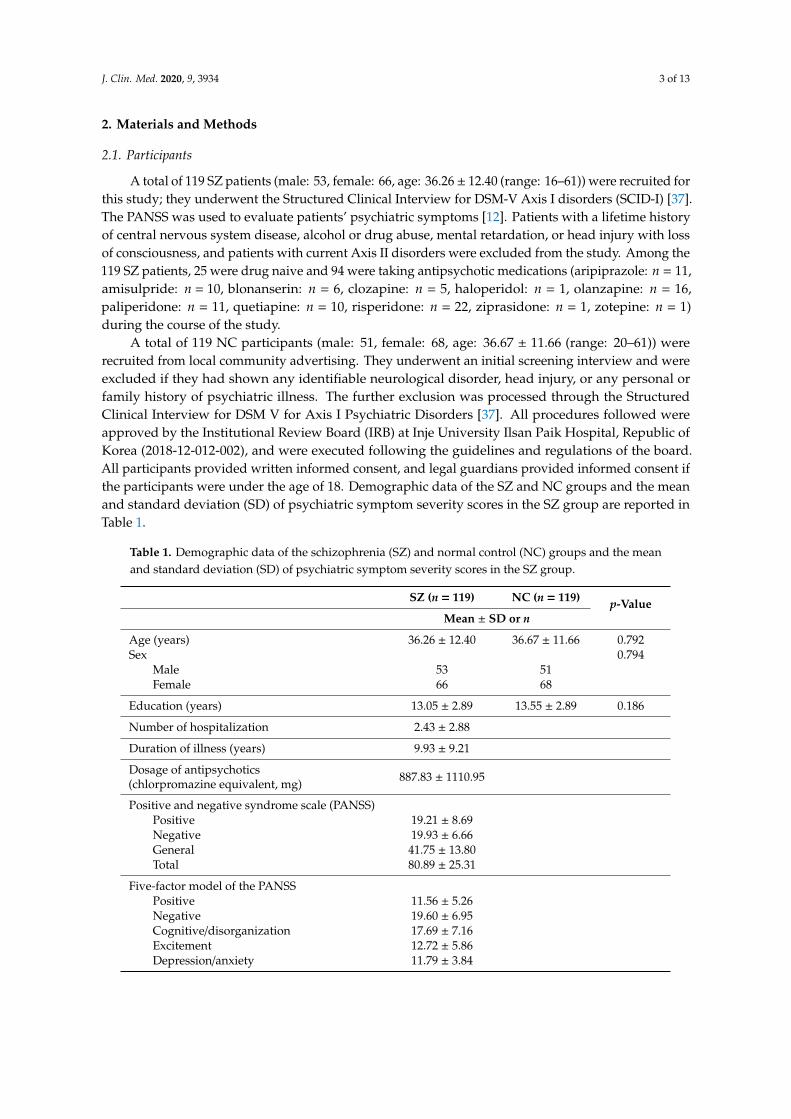
Table 1. Demographic data of the schizophrenia (SZ) and normal control (NC) groups and the meanand standard deviation (SD) of psychiatric symptom severity scores in the SZ group.
SZ (n = 119) NC (n = 119) p-ValueMean ± SD or n
Age (years) 36.26 ± 12.40 36.67 ± 11.66 0.792Sex 0.794
Male 53 51Female 66 68
Education (years) 13.05 ± 2.89 13.55 ± 2.89 0.186
Number of hospitalization 2.43 ± 2.88
Duration of illness (years) 9.93 ± 9.21
Dosage of antipsychotics(chlorpromazine equivalent, mg) 887.83 ± 1110.95
Positive and negative syndrome scale (PANSS)Positive 19.21 ± 8.69Negative 19.93 ± 6.66General 41.75 ± 13.80Total 80.89 ± 25.31
Five-factor model of the PANSSPositive 11.56 ± 5.26Negative 19.60 ± 6.95Cognitive/disorganization 17.69 ± 7.16Excitement 12.72 ± 5.86Depression/anxiety 11.79 ± 3.84
J. Clin. Med. 2020, 9, 3934 4 of 13
2.2. SZ Subtype Classification according to Symptom Severities
The PANSS [12,38] assesses the severity of the two common types of symptoms (positive andnegative) of SZ and the general psychopathology of the patient based on the interview and reportsof family members. To assess the cognitive/disorganization symptoms, a five-factor model of thePANSS was used based on evidence from the factor analysis studies [20,21]. Each symptom wasmeasured by several items, positive (P1, P3, P5, P6), negative (N1, N2, N3, N4, N6, G7, G16),cognition/disorganization (P2, N5, G9, G10, G11, G13, G15), excitement (P4, P7, G8, G12, G14),and depression/anxiety (G2, G3, G4, G6) [21].
The general PANSS positive score of the SZ group was 19.21 ± 12.40 (a negative score was19.93 ± 6.66), and the general score was 41.75 ± 13.80. The five-factor model of the PANSS positivescore was 11.56 ± 5.26, and a negative score was 19.60 ± 6.95. The cognitive/disorganization score was17.69 ± 7.16, excitement score was 12.72 ± 5.86, and depression/anxiety score was 11.79 ± 3.84.
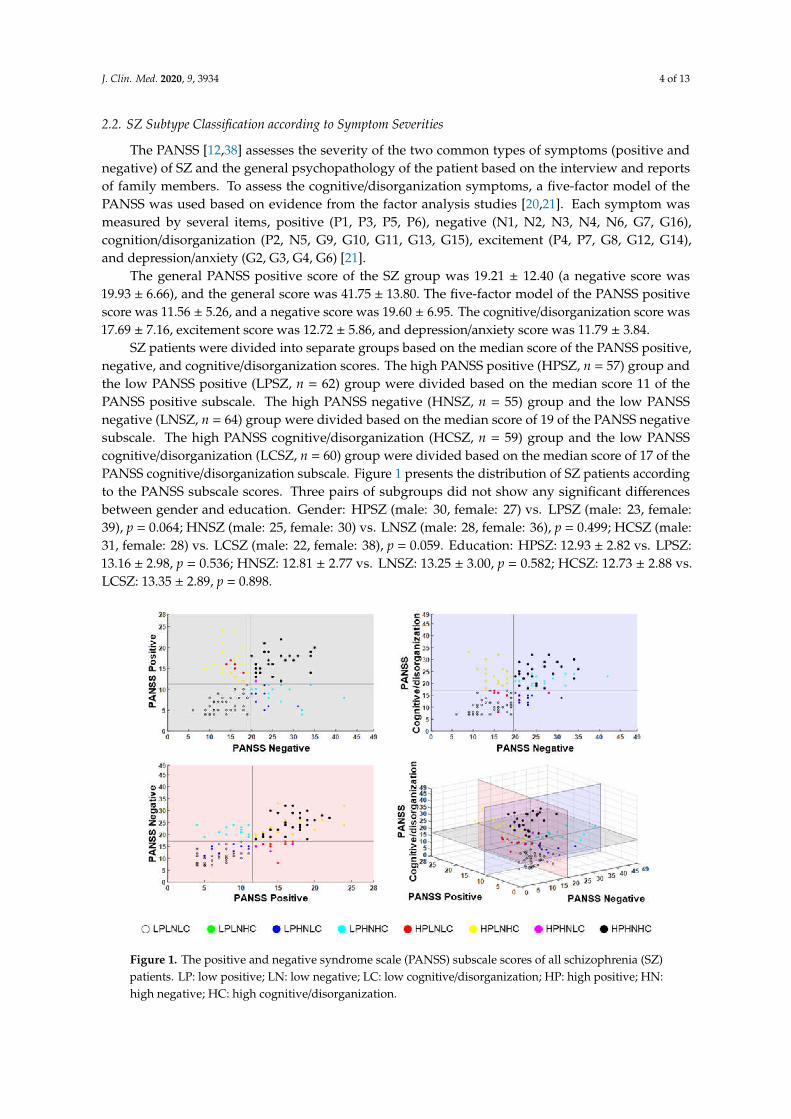
SZ patients were divided into separate groups based on the median score of the PANSS positive,negative, and cognitive/disorganization scores. The high PANSS positive (HPSZ, n = 57) group andthe low PANSS positive (LPSZ, n = 62) group were divided based on the median score 11 of thePANSS positive subscale. The high PANSS negative (HNSZ, n = 55) group and the low PANSSnegative (LNSZ, n = 64) group were divided based on the median score of 19 of the PANSS negativesubscale. The high PANSS cognitive/disorganization (HCSZ, n = 59) group and the low PANSScognitive/disorganization (LCSZ, n = 60) group were divided based on the median score of 17 of thePANSS cognitive/disorganization subscale. Figure 1 presents the distribution of SZ patients accordingto the PANSS subscale scores. Three pairs of subgroups did not show any significant differencesbetween gender and education. Gender: HPSZ (male: 30, female: 27) vs. LPSZ (male: 23, female:39), p = 0.064; HNSZ (male: 25, female: 30) vs. LNSZ (male: 28, female: 36), p = 0.499; HCSZ (male:31, female: 28) vs. LCSZ (male: 22, female: 38), p = 0.059. Education: HPSZ: 12.93 ± 2.82 vs. LPSZ:13.16 ± 2.98, p = 0.536; HNSZ: 12.81 ± 2.77 vs. LNSZ: 13.25 ± 3.00, p = 0.582; HCSZ: 12.73 ± 2.88 vs.LCSZ: 13.35 ± 2.89, p = 0.898.
Figure 1. The positive and negative syndrome scale (PANSS) subscale scores of all schizophrenia (SZ)patients. LP: low positive; LN: low negative; LC: low cognitive/disorganization; HP: high positive; HN:high negative; HC: high cognitive/disorganization.
J. Clin. Med. 2020, 9, 3934 5 of 13
2.3. EEG Data Acquisition and Analysis
Participants sat on a chair in a room where the ambient noise was blocked. The resting-statequantitative EEG was recorded with participants’ eyes closed for four minutes. EEG signals wererecorded using a Quick Cap with 62 Ag-AgCl electrodes, which were placed according to theextended 10–20 system, and NeuroScan SynAmps (Compumedics USA, El Paso, TX, USA). The verticalelectrooculogram (EOG) was recorded with the electrodes attached above and below the left eye,while the horizontal EOG was recorded with the electrodes attached to the outer canthus of each eye.We recorded EEG data with a 0.1–100 Hz band-pass filter at a sampling rate of 1000 Hz and removed60 Hz noise using a notch filter. We analyzed the resting EEG data during the eyes closed session usingCURRY 7 (Compumedics USA, Charlotte, NC, USA), a commonly used neuroimaging and analysistool for EEG pre-processing. A trained inspector identified and manually removed the gross artifacts.The removal of the artifacts caused by eye movement and blinks was conducted using the covarianceanalysis of CURRY 7 [39]. The pre-processed EEG data were divided into two-second long epochs.Any epochs containing artifacts with the amplitude exceeding ±100 µV at any site, overall 62 electrodes,or a theta power/alpha power ratio > 1 were excluded from the analysis. In the power spectralanalysis, we employed the periodogram function in MATLAB R2017b (MathWorks, Natick, MA, USA)to estimate the power spectral density of each epoch. After artifact rejection, 30 epochs were randomlyselected for the following analysis.
2.4. Feature Extraction
In the study, the source-level cortical functional connectivity network was obtained. We estimatedthe time series of source activity using minimum norm estimation (MNE), and the synchronizationbetween each pair of cortical sources measuring the phase-locking value (PLV). Values of the clusteringcoefficient (CC) and path length were evaluated for individual cortical functional networks during theresting-state with eyes closed.
Source localization was performed using Brainstorm [40], an open-source brain imagingtool (http://neuroimage.usc.edu/brainstorm). A three-layer boundary element method (BEM) modelexpressed in anatomical MNI template Colin 27 was used to compute the lead field matrix. We obtainedcortical current density values at 15,002 cortical vertices for all time points of each epoch and extracted148 dipole sources as evenly as possible from the original cortical surface model based on the Destrieuxatlas [41]. The 148 sub-regions of the Destrieux atlas could be categorized into seven regions: the frontallobe, insula, temporal lobe, occipital lobe, tempo-occipital lobe, parietal lobe, and the limbic lobe.The time series data at each of the 148 cortical locations were band-pass filtered and grouped into elevenfrequency bands (delta (1–4 Hz), theta (4–8 Hz), alpha (8–12 Hz), alpha1 (8–10 Hz), alpha2 (10–12 Hz),beta (12–30 Hz), beta1 (12–18 Hz), beta2 (18–22 Hz), beta3 (22–30 Hz), beta4 (18–30 Hz) and gamma(30–55 Hz)) [42,43].
A network is essentially several nodes connected at their edges. The nodes are the brain sub-regions,and the PLV quantifies the edges among the potential pairs of cortical regions of interest [44]. The PLVmeasures phase synchronization between two different electrode locations but were recorded duringthe same time interval and the same frequency band [44]. Even when their amplitudes are notcorrelated, these phases can be synchronized [45]. Stationarity-independent, the PLV focuses purelyon phase and ranges from 0 to 1. Values close to 1 mean the two signals are synchronized and show aconstant time lag. Signals with values close to zero are temporally independent. The PLV was chosenas the measure of synchronization, since it ranges from 0 to 1 and consequently requires no additionalmodifications to reflect connection strength in weighted network analysis.
In this study, we applied graph theory to perform weighted network analysis. As aforementioned,a network is composed of several nodes, which are connected by edges. The CC indicates the degreeto which a node is clustered with its neighboring nodes. The CC was calculated for the entire network.The path length indicates the overall connectedness of the whole network, and is calculated as the sumof the lengths between two nodes in the entire network. The weighted CC indicates the functional
J. Clin. Med. 2020, 9, 3934 6 of 13
segregation of a network, while the path length refers to the functional integration [46]. For therespective nodes, the CC was first calculated (described as local level results), and then an average wascreated for all of the cortical regions concerned (i.e., global level). Given that it is defined purely at theglobal level, no values of path length at the local level were available [47].
2.5. Feature Selection and Classification
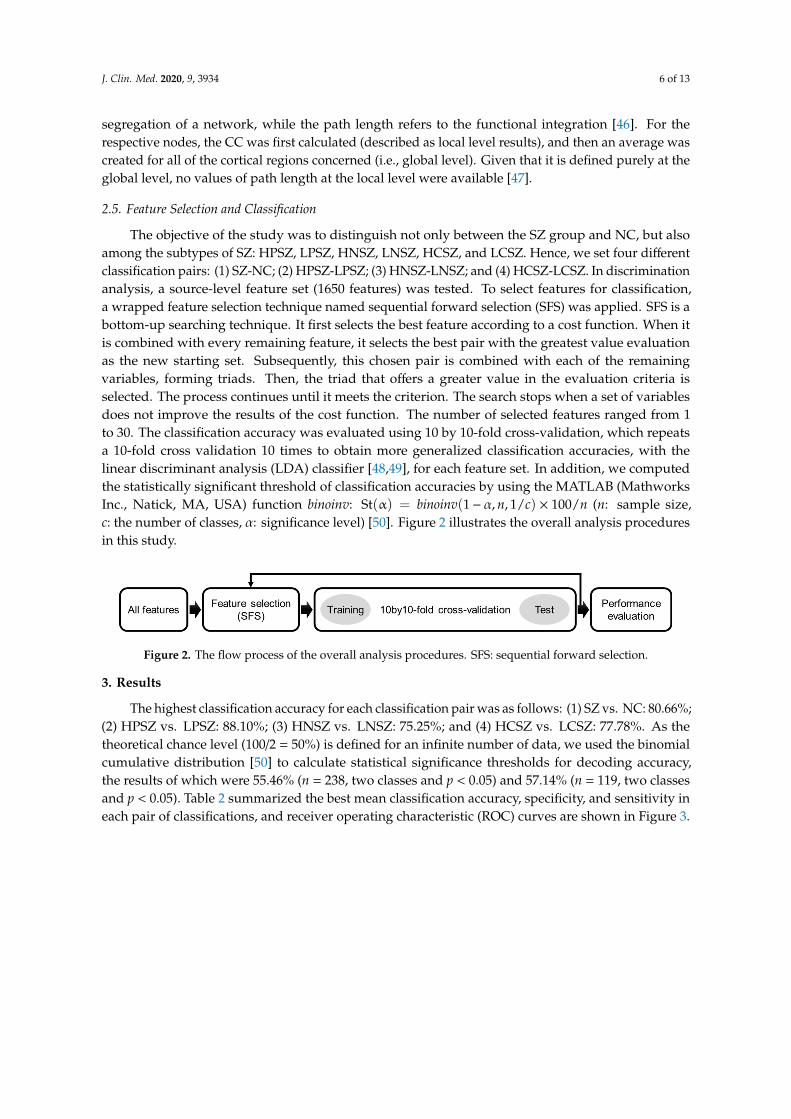
The objective of the study was to distinguish not only between the SZ group and NC, but alsoamong the subtypes of SZ: HPSZ, LPSZ, HNSZ, LNSZ, HCSZ, and LCSZ. Hence, we set four differentclassification pairs: (1) SZ-NC; (2) HPSZ-LPSZ; (3) HNSZ-LNSZ; and (4) HCSZ-LCSZ. In discriminationanalysis, a source-level feature set (1650 features) was tested. To select features for classification,a wrapped feature selection technique named sequential forward selection (SFS) was applied. SFS is abottom-up searching technique. It first selects the best feature according to a cost function. When itis combined with every remaining feature, it selects the best pair with the greatest value evaluationas the new starting set. Subsequently, this chosen pair is combined with each of the remainingvariables, forming triads. Then, the triad that offers a greater value in the evaluation criteria isselected. The process continues until it meets the criterion. The search stops when a set of variablesdoes not improve the results of the cost function. The number of selected features ranged from 1to 30. The classification accuracy was evaluated using 10 by 10-fold cross-validation, which repeatsa 10-fold cross validation 10 times to obtain more generalized classification accuracies, with thelinear discriminant analysis (LDA) classifier [48,49], for each feature set. In addition, we computedthe statistically significant threshold of classification accuracies by using the MATLAB (MathworksInc., Natick, MA, USA) function binoinv: St(α) = binoinv(1− α, n, 1/c) × 100/n (n: sample size,c: the number of classes, α: significance level) [50]. Figure 2 illustrates the overall analysis proceduresin this study.
Figure 2. The flow process of the overall analysis procedures. SFS: sequential forward selection.
3. Results
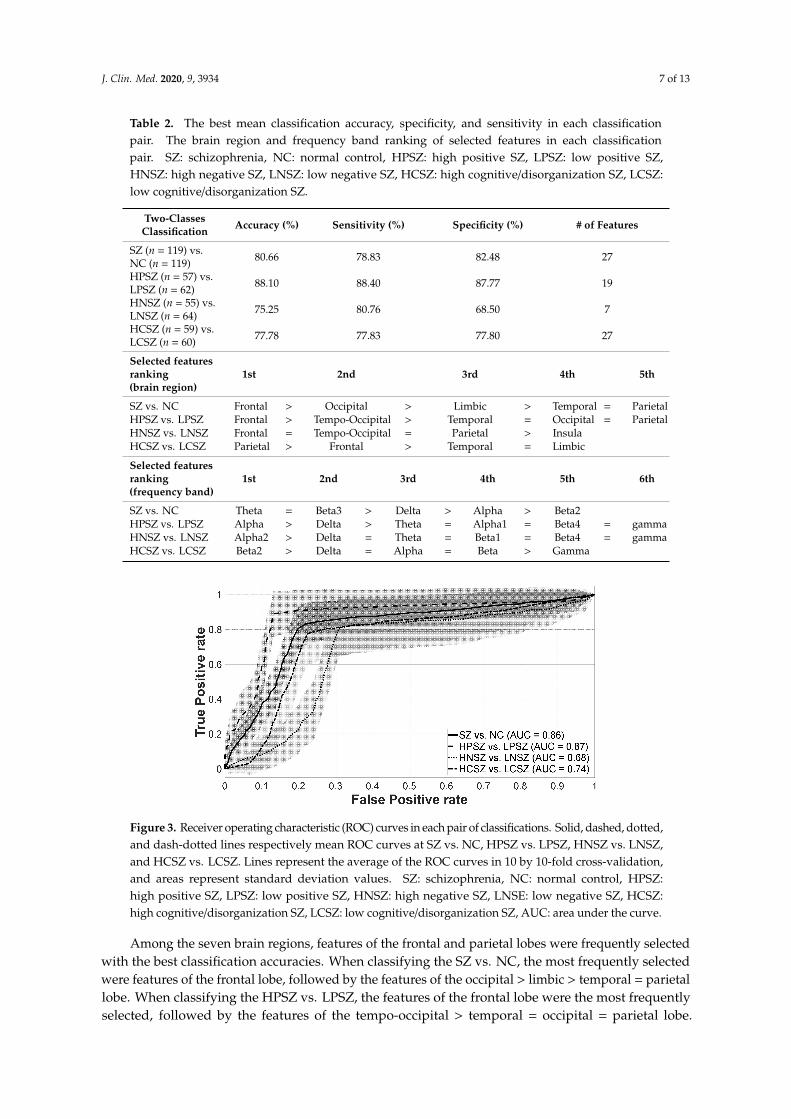
The highest classification accuracy for each classification pair was as follows: (1) SZ vs. NC: 80.66%;(2) HPSZ vs. LPSZ: 88.10%; (3) HNSZ vs. LNSZ: 75.25%; and (4) HCSZ vs. LCSZ: 77.78%. As thetheoretical chance level (100/2 = 50%) is defined for an infinite number of data, we used the binomialcumulative distribution [50] to calculate statistical significance thresholds for decoding accuracy,the results of which were 55.46% (n = 238, two classes and p < 0.05) and 57.14% (n = 119, two classesand p < 0.05). Table 2 summarized the best mean classification accuracy, specificity, and sensitivity ineach pair of classifications, and receiver operating characteristic (ROC) curves are shown in Figure 3.
J. Clin. Med. 2020, 9, 3934 7 of 13
Table 2. The best mean classification accuracy, specificity, and sensitivity in each classificationpair. The brain region and frequency band ranking of selected features in each classificationpair. SZ: schizophrenia, NC: normal control, HPSZ: high positive SZ, LPSZ: low positive SZ,HNSZ: high negative SZ, LNSZ: low negative SZ, HCSZ: high cognitive/disorganization SZ, LCSZ:low cognitive/disorganization SZ.
Two-ClassesClassification Accuracy (%) Sensitivity (%) Specificity (%) # of Features
SZ (n = 119) vs.NC (n = 119) 80.66 78.83 82.48 27
HPSZ (n = 57) vs.LPSZ (n = 62) 88.10 88.40 87.77 19
HNSZ (n = 55) vs.LNSZ (n = 64) 75.25 80.76 68.50 7
HCSZ (n = 59) vs.LCSZ (n = 60) 77.78 77.83 77.80 27
Selected featuresranking(brain region)
1st 2nd 3rd 4th 5th
SZ vs. NC Frontal > Occipital > Limbic > Temporal = ParietalHPSZ vs. LPSZ Frontal > Tempo-Occipital > Temporal = Occipital = ParietalHNSZ vs. LNSZ Frontal = Tempo-Occipital = Parietal > InsulaHCSZ vs. LCSZ Parietal > Frontal > Temporal = Limbic
Selected featuresranking(frequency band)
1st 2nd 3rd 4th 5th 6th
SZ vs. NC Theta = Beta3 > Delta > Alpha > Beta2HPSZ vs. LPSZ Alpha > Delta > Theta = Alpha1 = Beta4 = gammaHNSZ vs. LNSZ Alpha2 > Delta = Theta = Beta1 = Beta4 = gammaHCSZ vs. LCSZ Beta2 > Delta = Alpha = Beta > Gamma
Figure 3. Receiver operating characteristic (ROC) curves in each pair of classifications. Solid, dashed, dotted,and dash-dotted lines respectively mean ROC curves at SZ vs. NC, HPSZ vs. LPSZ, HNSZ vs. LNSZ,and HCSZ vs. LCSZ. Lines represent the average of the ROC curves in 10 by 10-fold cross-validation,and areas represent standard deviation values. SZ: schizophrenia, NC: normal control, HPSZ:high positive SZ, LPSZ: low positive SZ, HNSZ: high negative SZ, LNSE: low negative SZ, HCSZ:high cognitive/disorganization SZ, LCSZ: low cognitive/disorganization SZ, AUC: area under the curve.
Among the seven brain regions, features of the frontal and parietal lobes were frequently selectedwith the best classification accuracies. When classifying the SZ vs. NC, the most frequently selectedwere features of the frontal lobe, followed by the features of the occipital > limbic > temporal = parietallobe. When classifying the HPSZ vs. LPSZ, the features of the frontal lobe were the most frequentlyselected, followed by the features of the tempo-occipital > temporal = occipital = parietal lobe.
J. Clin. Med. 2020, 9, 3934 8 of 13
When classifying the HNSZ vs. LNSZ, the features of the frontal, tempo-occipital, and parietal lobeswere the most frequently selected, followed by the features of the insula. When classifying the HCSZvs. LCSZ, the features of the parietal lobe were the most selected, followed by the features of the frontallobe > temporal lobe = limbic. The selected features of the brain regions in each classification pair aresummarized in Table 2.
Among 11 frequency bands, when classifying the SZ vs. NC, the features of the theta andbeta3 bands were the most frequently selected, followed by the features of the delta > alpha > beta2band. When classifying the HPSZ vs. LPSZ, the features of the alpha band were the most frequentlyselected, followed by the features of the delta > theta = alpha1 = beta4 = gamma. When classifyingthe HNSZ vs. LNSZ, the features of the alpha2 band were the most frequently selected, followedby the features of the delta = theta = beta1 = beta4 = gamma band. When classifying the HCSZ vs.LCSZ, the features of the beta2 band were the most frequently selected, followed by the features of thedelta = alpha = beta > gamma band. Table 2 shows a summary of the selected features of frequencybands in each classification pair.
Interestingly, the least number of features were selected to classify HNSZ vs. LNSZ groups.The best classification accuracy was 75.25% when using the seven features (CC of the right supramarginalgyrus, left anterior transverse collateral sulcus, right precuneus, left inferior segment of the circularsulcus of the insula, left posterior transverse collateral sulcus, left triangular part of the inferior frontalgyrus, and the marginal branch of the cingulate sulcus). The best classification accuracy, specificity,sensitivity, and selected features in each step of the classification of the HNSZ vs. LNSZ groups aresummarized in Table 3.
Table 3. The best classification accuracy, specificity, sensitivity, and selected features in each step of theclassification of the negative symptom (HNSZ vs. LNSZ). HNSZ: high negative schizophrenia (SZ),LNSZ: low negative SZ, R: right, L: left.
# Accuracy (%) Sensitivity (%) Specificity (%) Frequency Band Brain Region
1 63.69 70.52 56.03 Delta Supramarginal gyrus R2 69.83 75.98 62.60 Alpha2 Anterior transverse collateral sulcus L3 71.99 76.38 66.90 Gamma Precuneus (medial part of P1) R4 73.90 80.05 67.10 Beta1 Inferior segment of the circular sulcus of the insula L5 74.67 80.81 67.33 Theta Posterior transverse collateral sulcus L6 75.13 80.33 68.93 Alpha2 Triangular part of the inferior frontal gyrus L7 75.25 80.76 68.50 Beta4 Marginal branch (or part) of the cingulate sulcus R
4. Discussion
In this study, we aimed to diagnose SZ compared to NC and classify the subtypes of SZ accordingto symptom severity. Source-level brain network analysis of resting-state EEG was used as the featurein the machine learning classification. Classification of SZ and NC and symptom-based SZ subgroupsof SZ classification showed sufficiently high classification accuracies. Features from the frontoparietalregions were frequently selected for the best classification of SZ patients compared to NC.
Classification of SZ and NC and symptom-based SZ subgroups of SZ classification were completedwith sufficiently high classification accuracies. A growing number of studies has sought to differentiateSZ patients and NC by using machine learning approaches with brain signal biomarkers during aresting-state. Some fMRI and EEG studies used functional alterations in resting-state brain signals asfeatures for classification [51–54]. The classification accuracies of SZ were about 92.86% (n = 28) withresting-state fMRI [53], 91.0% (n = 18) with fMRI [52], 97.1% (n = 26) with fMRI [51], and 92.0% (n = 45)with EEG [54]. However, larger sample-based diagnostic models tend to demonstrate classificationaccuracies that fall below 80% [55–58]. Many have observed the phenomenon that “smaller-n studiesreach higher prediction accuracy of SZ with neuroimaging data” [59]. The higher cross-validatedaccuracy obtained from smaller samples may fail to detect the existing heterogeneity of the disorder.
Among the symptomatic classifications, positive symptoms showed the highest classificationaccuracy (88.10%). The brain network connectivity features in the frontal lobe were selected as the best
J. Clin. Med. 2020, 9, 3934 9 of 13
features. It has already been well-known that positive symptoms are the major symptoms of SZ andare easier to recognize than other symptoms [60]. SZ presents a range of functional changes in thefrontal lobe. Within the SZ group, the gray matter volume in the bilateral frontal lobe shows a negativecorrelation with hallucination [61]. SZ groups also tend to show a deficient dopamine release capacityin the dorsolateral prefrontal cortex [62]. Therefore, obvious pathological symptoms and their robustunderlying brain network abnormality may contribute to the highest classification accuracy of positivesymptoms compared to other symptoms of SZ.
Negative symptom severity showed the lowest classification accuracy (75.25%). However,the number of selected features was the lowest at seven when the highest classification accuracy wasachieved. The selected features were mainly located in the frontal (triangular part of the inferior frontalgyrus and marginal branch of the cingulate sulcus), tempo-occipital (the anterior transverse collateralsulcus and posterior transverse collateral sulcus), parietal (the supramarginal gyrus and precuneus),and insula (the inferior segment of the circular sulcus of the insula) regions. Negative symptoms areusually considered as stable traits in the pathology of SZ [63–69], and respond poorly to medication [70].It may be difficult for novice physicians with a limited number of sessions with the patient to recognizenegative symptoms. The smallest number of features (n = 7) were used to classify negative symptoms(high vs. low). This supports that negative symptoms could be a trait and core pathology of SZ.
Features in the frontoparietal regions were frequently selected for the best classification of patientswith SZ compared to NC. Altered functional neural circuits, rather than the dysfunction of a singlebrain structure, are involved in SZ [71]. The frontal and parietal regions are known as importantpathological regions related to SZ [72–75]. The frontal lobe is critical for social-emotional and insightprocessing. Furthermore, there is greater hypofrontality in SZ than in NC [76], and changes inoxygenated hemoglobin in the frontal cortex are positively correlated to the severity of psychoticsymptoms in SZ patients [76–79]. The parietal lobe is associated with a wide range of cognitivefunctions [80].
Our study has some limitations that need to be addressed. Most of the SZ patients involvedwere taking medications. We could not control for the possible effects of all psychotropic medications.Participants in our study were mostly chronic patients. First onset schizophrenia patients may showcharacteristics of brain EEG networks that differ from chronic SZ patients. Lastly, there is a lack ofspecific negative symptomatology analysis, and we did not use a specific neurocognitive screeningtool for cognitive measurement when creating SZ subgroups.
Our research is the first attempt to diagnose SZ compared to NC and classify the subtypes ofSZ according to symptom severity. We achieved acceptable classification accuracies by simply usingresting-state EEG. Our method could be a promising approach in the computer-assisted diagnosisof SZ.
Author Contributions: Conceptualization, S.-H.L. and J.-Y.K.; methodology, J.-Y.K.; software, J.-Y.K.; validation,J.-Y.K.; formal analysis, J.-Y.K.; investigation, J.-Y.K.; resources, S.-H.L.; data curation, J.-Y.K.; writing—originaldraft preparation, J.-Y.K.; writing—review and editing, S.-H.L. and H.S.L.; visualization, J.-Y.K.; supervision,S.-H.L.; project administration, S.-H.L.; funding acquisition, S.-H.L. and J.-Y.K. All authors have read and agreedto the published version of the manuscript.
Funding: This research was funded by Basic Science Research Program through the National Research Foundationof Korea (NRF) funded by the Ministry of Education, grant number NRF-2019R1A6A3A01096980 and bya grant from the Korea Science and Engineering Foundation (KOSEF), funded by the Korean government(NRF-2018R1A2A2A05018505).
Conflicts of Interest: The authors declare no conflict of interest.
J. Clin. Med. 2020, 9, 3934 10 of 13
References
1. American Psychiatric Association. Diagnostic and Statistical Manual of Mental Disorders (DSM-5®);American Psychiatric Publishing: Arlington, VA, USA, 2013.
2. Lindström, E.; Wieselgren, I.M.; Von Knorring, L. Interrater reliability of the Structured Clinical Interviewfor the Positive and Negative Syndrome Scale for schizophrenia. Acta Psychiatr. Scand. 1994, 89, 192–195.[CrossRef] [PubMed]
3. McGorry, P.D.; Mihalopoulos, C.; Henry, L.; Dakis, J.; Jackson, H.J.; Flaum, M.; Harrigan, S.; McKenzie, D.;Kulkarni, J.; Karoly, R. Spurious precision: Procedural validity of diagnostic assessment in psychoticdisorders. Am. J. Psychiatry 1995, 152, 220–223. [CrossRef] [PubMed]
4. Norman, R.M.; Malla, A.K.; Cortese, L.; Diaz, F. A study of the interrelationship between and comparativeinterrater reliability of the SAPS, SANS and PANSS. Schizophr. Res. 1996, 19, 73–85. [CrossRef]
5. Winterer, G.; Coppola, R.; Egan, M.F.; Goldberg, T.E.; Weinberger, D.R. Functional and effective frontotemporalconnectivity and genetic risk for schizophrenia. Biol. Psychiatry 2003, 54, 1181–1192. [CrossRef]
6. Lynall, M.-E.; Bassett, D.S.; Kerwin, R.; McKenna, P.J.; Kitzbichler, M.; Muller, U.; Bullmore, E.Functional connectivity and brain networks in schizophrenia. J. Neurosci. 2010, 30, 9477–9487. [CrossRef]
7. Pae, J.S.; Kwon, J.S.; Youn, T.; Park, H.-J.; Kim, M.S.; Lee, B.; Park, K.S. LORETA imaging of P300 inschizophrenia with individual MRI and 128-channel EEG. Neuroimage 2003, 20, 1552–1560. [CrossRef]
8. Kawasaki, Y.; Sumiyoshi, T.; Higuchi, Y.; Ito, T.; Takeuchi, M.; Kurachi, M. Voxel-based analysis ofP300 electrophysiological topography associated with positive and negative symptoms of schizophrenia.Schizophr. Res. 2007, 94, 164–171. [CrossRef]
9. Wang, J.; Tang, Y.; Li, C.; Mecklinger, A.; Xiao, Z.; Zhang, M.; Hirayasu, Y.; Hokama, H.; Li, H. Decreased P300current source density in drug-naive first episode schizophrenics revealed by high density recording. Int. J.Psychophysiol. 2010, 75, 249–257. [CrossRef]
10. Kim, D.-W.; Shim, M.; Kim, J.-I.; Im, C.-H.; Lee, S.-H. Source activation of P300 correlates with negativesymptom severity in patients with schizophrenia. Brain Topogr. 2014, 27, 307–317. [CrossRef]
11. Kay, S.R.; Sevy, S. Pyramidical model of schizophrenia. Schizophr. Bull. 1990, 16, 537–545. [CrossRef]12. Kay, S.R.; Fiszbein, A.; Opler, L.A. The positive and negative syndrome scale (PANSS) for schizophrenia.
Schizophr. Bull. 1987, 13, 261–276. [CrossRef] [PubMed]13. Strauss, G.P.; Nuñez, A.; Ahmed, A.O.; Barchard, K.A.; Granholm, E.; Kirkpatrick, B.; Gold, J.M.; Allen, D.N.
The latent structure of negative symptoms in schizophrenia. JAMA Psychiatry 2018, 75, 1271–1279. [CrossRef][PubMed]
14. Mucci, A.; Vignapiano, A.; Bitter, I.; Austin, S.F.; Delouche, C.; Dollfus, S.; Erfurth, A.; Fleischhacker, W.W.;Giordano, G.M.; Gladyshev, I.; et al. A large European, multicenter, multinational validation study of theBrief Negative Symptom Scale. Eur. Neuropsychopharmacol. 2019, 29, 947–959. [CrossRef] [PubMed]
15. Kirkpatrick, B.; Buchanan, R.W.; McKenny, P.D.; Alphs, L.D.; Carpenter, W.T., Jr. The schedule for the deficitsyndrome: An instrument for research in schizophrenia. Psychiatry Res. Neuroimaging 1989, 30, 119–123.[CrossRef]
16. Bowie, C.R.; Harvey, P.D. Cognitive deficits and functional outcome in schizophrenia. Neuropsych. Dis. Treat.2006, 2, 531–536. [CrossRef] [PubMed]
17. Morris, J.C.; Edland, S.; Clark, C.; Galasko, D.; Koss, E.; Mohs, R.; Van Belle, G.; Fillenbaum, G.; Heyman, A.The Consortium to Establish a Registry for Alzheimer’s Disease (CERAD): Part IV. Rates of cognitive changein the longitudinal assessment of probable Alzheimer’s disease. Neurology 1993, 43, 2457. [CrossRef]
18. Folstein, M.F.; Folstein, S.E.; McHugh, P.R. “Mini-mental state”: A practical method for grading the cognitivestate of patients for the clinician. J. Psychiatr. Res. 1975, 12, 189–198. [CrossRef]
19. Andreasen, N.C. A unitary model of schizophrenia: Bleuler’s fragmented phrene as schizencephaly.Arch. Gen. Psychiat. 1999, 56, 781–787. [CrossRef]
20. Marder, S.R.; Davis, J.M.; Chouinard, G. The effects of risperidone on the five dimensions of schizophreniaderived by factor analysis: Combined results of the North American trials. J. Clin. Psychiatry 1997. [CrossRef]
21. Kim, J.-H.; Kim, S.-Y.; Lee, J.; Oh, K.-J.; Kim, Y.-B.; Cho, Z.-H. Evaluation of the factor structure of symptomsin patients with schizophrenia. Psychiatry Res. 2012, 197, 285–289. [CrossRef]
22. Kay, S.R.; Opler, L.A.; Lindenmayer, J.-P. Reliability and validity of the positive and negative syndrome scalefor schizophrenics. Psychiatry Res. 1988, 23, 99–110. [CrossRef]
J. Clin. Med. 2020, 9, 3934 11 of 13
23. Bell, M.D.; Lysaker, P.H.; Milstein, R.M.; Beam-Goulet, J.L. Concurrent validity of the cognitive componentof schizophrenia: Relationship of PANSS scores to neuropsychological assessments. Psychiatry Res. 1994,54, 51–58. [CrossRef]
24. Mortimer, A.M. Symptom rating scales and outcome in schizophrenia. Br. J. Psychiatry 2007, 191, s7–s14.[CrossRef] [PubMed]
25. Andreasen, N.C. Negative symptoms in schizophrenia: Definition and reliability. Arch. Gen. Psychiatry 1982,39, 784–788. [CrossRef] [PubMed]
26. Liemburg, E.; Castelein, S.; Stewart, R.; van der Gaag, M.; Aleman, A.; Knegtering, H.; Outcome of Psychosis(GROUP) Investigators. Two subdomains of negative symptoms in psychotic disorders: Established andconfirmed in two large cohorts. J. Psychiatr. Res. 2013, 47, 718–725. [CrossRef]
27. Lakhan, S.E. Schizophrenia proteomics: Biomarkers on the path to laboratory medicine? Diagn. Pathol. 2006,1, 11. [CrossRef]
28. Micheloyannis, S.; Pachou, E.; Stam, C.J.; Breakspear, M.; Bitsios, P.; Vourkas, M.; Erimaki, S.; Zervakis, M.Small-world networks and disturbed functional connectivity in schizophrenia. Schizophr. Res. 2006, 87, 60–66.[CrossRef]
29. Rubinov, M.; Knock, S.A.; Stam, C.J.; Micheloyannis, S.; Harris, A.W.; Williams, L.M.; Breakspear, M.Small-world properties of nonlinear brain activity in schizophrenia. Hum. Brain Mapp. 2009, 30, 403–416.[CrossRef]
30. Jalili, M.; Knyazeva, M.G. EEG-based functional networks in schizophrenia. Comput. Biol. Med. 2011,41, 1178–1186. [CrossRef]
31. Liu, Y.; Liang, M.; Zhou, Y.; He, Y.; Hao, Y.; Song, M.; Yu, C.; Liu, H.; Liu, Z.; Jiang, T. Disrupted small-worldnetworks in schizophrenia. Brain 2008, 131, 945–961. [CrossRef]
32. Yu, Q.; Sui, J.; Rachakonda, S.; He, H.; Gruner, W.; Pearlson, G.; Kiehl, K.A.; Calhoun, V.D. Altered topologicalproperties of functional network connectivity in schizophrenia during resting state: A small-world brainnetwork study. PLoS ONE 2011, 6, e25423. [CrossRef] [PubMed]
33. Brady, R.O., Jr.; Gonsalvez, I.; Lee, I.; Öngür, D.; Seidman, L.J.; Schmahmann, J.D.; Eack, S.M.; Keshavan, M.S.;Pascual-Leone, A.; Halko, M.A. Cerebellar-prefrontal network connectivity and negative symptoms inschizophrenia. Am. J. Psychiatry 2019, 176, 512–520. [CrossRef] [PubMed]
34. Garrity, A.G.; Pearlson, G.D.; McKiernan, K.; Lloyd, D.; Kiehl, K.A.; Calhoun, V.D. Aberrant “default mode”functional connectivity in schizophrenia. Am. J. Psychiatry 2007, 164, 450–457. [CrossRef] [PubMed]
35. MacDonald, A.W., III; Carter, C.S.; Kerns, J.G.; Ursu, S.; Barch, D.M.; Holmes, A.J.; Stenger, V.A.; Cohen, J.D.Specificity of prefrontal dysfunction and context processing deficits to schizophrenia in never-medicatedpatients with first-episode psychosis. Am. J. Psychiatry 2005, 162, 475–484. [CrossRef]
36. Van den Heuvel, M.P.; Mandl, R.C.; Stam, C.J.; Kahn, R.S.; Pol, H.E.H. Aberrant frontal and temporalcomplex network structure in schizophrenia: A graph theoretical analysis. J. Neurosci. 2010, 30, 15915–15926.[CrossRef]
37. First, M.B.; Spitzer, R.L.; Gibbon, M.; Williams, J.B. Structured Clinical Interview for DSM-IV Clinical Version(SCID-I/CV); American Psychiatric Press: Washington, DC, USA, 1997.
38. Yi, J.S.; Ahn, Y.M.; Shin, H.K.; An, S.K.; Joo, Y.H.; Kim, S.H.; Yoon, D.J.; Jho, K.H.; Koo, Y.J.; Lee, J.Y.Reliability and Validity of the Korean Version of the Positive and Negative Syndrome Scale. J. KoreanNeuropsychiatr. Assoc. 2001, 40, 1090–1105.
39. Semlitsch, H.V.; Anderer, P.; Schuster, P.; Presslich, O. A solution for reliable and valid reduction of ocularartifacts, applied to the P300 ERP. Psychophysiology 1986, 23, 695–703. [CrossRef]
40. Tadel, F.; Baillet, S.; Mosher, J.C.; Pantazis, D.; Leahy, R.M. Brainstorm: A user-friendly application forMEG/EEG analysis. Comput. Intell. Neurosci. 2011, 2011, 879716. [CrossRef]
41. Destrieux, C.; Fischl, B.; Dale, A.; Halgren, E. Automatic parcellation of human cortical gyri and sulci usingstandard anatomical nomenclature. Neuroimage 2010, 53, 1–15. [CrossRef]
42. König, T.; Lehmann, D.; Saito, N.; Kuginuki, T.; Kinoshita, T.; Koukkou, M. Decreased functionalconnectivity of EEG theta-frequency activity in first-episode, neuroleptic-naıve patients with schizophrenia:Preliminary results. Schizophr. Res. 2001, 50, 55–60. [CrossRef]
43. Park, Y.-M.; Che, H.-J.; Im, C.-H.; Jung, H.-T.; Bae, S.-M.; Lee, S.-H. Decreased EEG synchronization andits correlation with symptom severity in Alzheimer’s disease. Neurosci. Res. 2008, 62, 112–117. [CrossRef][PubMed]
J. Clin. Med. 2020, 9, 3934 12 of 13
44. Lachaux, J.P.; Rodriguez, E.; Martinerie, J.; Varela, F.J. Measuring phase synchrony in brain signals.Hum. Brain Mapp. 1999, 8, 194–208. [CrossRef]
45. Pikovsky, A.; Rosenblum, M.; Kurths, J. Synchronization: A Universal Concept in Nonlinear Sciences;Cambridge University Press: Cambridge, UK, 2003; Volume 12.
46. Rubinov, M.; Sporns, O. Complex network measures of brain connectivity: Uses and interpretations.Neuroimage 2010, 52, 1059–1069. [CrossRef] [PubMed]
47. Watts, D.J.; Strogatz, S.H. Collective dynamics of ‘small-world’networks. Nature 1998, 393, 440–442.[CrossRef]
48. Kumar, S.; Sharma, A.; Tsunoda, T. An improved discriminative filter bank selection approach for motorimagery EEG signal classification using mutual information. BMC Bioinform. 2017, 18, 545. [CrossRef]
49. Amezquita-Garcia, J.A.; Bravo-Zanoguera, M.E.; González-Navarro, F.F.; Lopez-Avitia, R. Hand movementdetection from surface electromyography signals by machine learning techniques. In Proceedings of theLatin American Conference on Biomedical Engineering, Cancún, Mexico, 2–5 October 2019; pp. 218–227.
50. Combrisson, E.; Jerbi, K. Exceeding chance level by chance: The caveat of theoretical chance levels in brainsignal classification and statistical assessment of decoding accuracy. J. Neurosci. Methods 2015, 250, 126–136.[CrossRef]
51. Chyzhyk, D.; Grana, M.; Öngür, D.; Shinn, A.K. Discrimination of schizophrenia auditory hallucinators bymachine learning of resting-state functional MRI. Int. J. Neural Syst. 2015, 25, 1550007. [CrossRef]
52. Peters, H.; Shao, J.; Scherr, M.; Schwerthöffer, D.; Zimmer, C.; Förstl, H.; Bäuml, J.; Wohlschläger, A.; Riedl, V.;Koch, K. More consistently altered connectivity patterns for cerebellum and medial temporal lobes than foramygdala and striatum in schizophrenia. Front. Hum. Neurosci. 2016, 10, 55. [CrossRef]
53. Guo, W.; Liu, F.; Chen, J.; Wu, R.; Li, L.; Zhang, Z.; Zhao, J. Family-based case-control study of homotopicconnectivity in first-episode, drug-naive schizophrenia at rest. Sci. Rep. 2017, 7, 43312. [CrossRef]
54. Phang, C.-R.; Noman, F.; Hussain, H.; Ting, C.-M.; Ombao, H. A multi-domain connectome convolutionalneural network for identifying schizophrenia from EEG connectivity patterns. IEEE J. Biomed. Health Inform.2019, 24, 1333–1343. [CrossRef]
55. Anticevic, A.; Cole, M.W.; Repovs, G.; Murray, J.D.; Brumbaugh, M.S.; Winkler, A.M.; Savic, A.; Krystal, J.H.;Pearlson, G.D.; Glahn, D.C. Characterizing thalamo-cortical disturbances in schizophrenia and bipolar illness.Cereb. Cortex 2014, 24, 3116–3130. [CrossRef] [PubMed]
56. Watanabe, T.; Kessler, D.; Scott, C.; Angstadt, M.; Sripada, C. Disease prediction based on functionalconnectomes using a scalable and spatially-informed support vector machine. Neuroimage 2014, 96, 183–202.[CrossRef] [PubMed]
57. Cabral, C.; Kambeitz-Ilankovic, L.; Kambeitz, J.; Calhoun, V.D.; Dwyer, D.B.; Von Saldern, S.; Urquijo, M.F.;Falkai, P.; Koutsouleris, N. Classifying schizophrenia using multimodal multivariate pattern recognitionanalysis: Evaluating the impact of individual clinical profiles on the neurodiagnostic performance.Schizophr. Bull. 2016, 42, S110–S117. [CrossRef] [PubMed]
58. Iwabuchi, S.J.; Palaniyappan, L. Abnormalities in the effective connectivity of visuothalamic circuitry inschizophrenia. Psychol. Med. 2017, 47, 1300. [CrossRef]
59. Schnack, H.G.; Kahn, R.S. Detecting neuroimaging biomarkers for psychiatric disorders: Sample size matters.Front. Psychiatry 2016, 7, 50. [CrossRef]
60. Barabassy, A.; Szatmári, B.; Laszlovszky, I.; Németh, G. Negative symptoms of schizophrenia: Constructs,burden, and management. In Psychotic Disorders—An Update; Durbano, F., Ed.; Intech Open: London, UK,2018.
61. Sadock, B.; Sadock, V.; Ruiz, P. Kaplan and Sadock’s Synopsis of Psychiatry: Behavioral Sciences/Clinical Psychiatry;Wolters Kluwer: Philadelphia, PA, USA, 2014.
62. Slifstein, M.; Van De Giessen, E.; Van Snellenberg, J.; Thompson, J.L.; Narendran, R.; Gil, R.; Hackett, E.;Girgis, R.; Ojeil, N.; Moore, H. Deficits in prefrontal cortical and extrastriatal dopamine releasein schizophrenia: A positron emission tomographic functional magnetic resonance imaging study.JAMA Psychiatry 2015, 72, 316–324. [CrossRef]
63. Clementz, B.A.; Grove, W.M.; Katsanis, J.; Iacono, W.G. Psychometric detection of schizotypy: Perceptualaberration and physical anhedonia in relatives of schizophrenics. J. Abnorm. Psychol. 1991, 100, 607.[CrossRef]
J. Clin. Med. 2020, 9, 3934 13 of 13
64. Keefe, R.S.; Lobelc, D.S.; Mohs, R.C.; Silverman, J.M.; Harvey, P.D.; Davidson, M.; Losonczy, M.F.; Davis, K.L.Diagnostic issues in chronic schizophrenia: Kraepelinian schizophrenia, undifferentiated schizophrenia,and state-independent negative symptoms. Schizophr. Res. 1991, 4, 71–79. [CrossRef]
65. Berenbaum, H.; McGrew, J. Familial resemblance of schizotypic traits. Psychol. Med. 1993, 23, 327–333.[CrossRef]
66. Rey, E.R.; Bailer, J.; Bräuer, W.; Händel, M.; Laubenstein, D.; Stein, A. Stability trends and longitudinalcorrelations of negative and positive syndromes within a three-year follow-up of initially hospitalizedschizophrenics. Acta Psychiatr. Scand. 1994, 90, 405–412. [CrossRef]
67. Dollfus, S.; Petit, M. Negative symptoms in schizophrenia: Their evolution during an acute phase.Schizophr. Res. 1995, 17, 187–194. [CrossRef]
68. Lyons, M.J.; Toomey, R.; Faraone, S.V.; Kremen, W.S.; Yeung, A.S.; Tsuang, M.T. Correlates of psychosisproneness in relatives of schizophrenic patients. J. Abnorm. Psychol. 1995, 104, 390. [CrossRef] [PubMed]
69. Blanchard, J.J.; Mueser, K.T.; Bellack, A.S. Anhedonia, positive and negative affect, and social functioning inschizophrenia. Schizophr. Bull. 1998, 24, 413–424. [CrossRef] [PubMed]
70. Fusar-Poli, P.; Papanastasiou, E.; Stahl, D.; Rocchetti, M.; Carpenter, W.; Shergill, S.; McGuire, P. Treatmentsof negative symptoms in schizophrenia: Meta-analysis of 168 randomized placebo-controlled trials.Schizophr. Bull. 2015, 41, 892–899. [CrossRef] [PubMed]
71. Wang, L.; Zou, F.; Shao, Y.; Ye, E.; Jin, X.; Tan, S.; Hu, D.; Yang, Z. Disruptive changes of cerebellar functionalconnectivity with the default mode network in schizophrenia. Schizophr. Res. 2014, 160, 67–72. [CrossRef][PubMed]
72. Duan, H.-F.; Gan, J.-L.; Yang, J.-M.; Cheng, Z.-X.; Gao, C.-Y.; Shi, Z.-J.; Zhu, X.-Q.; Liang, X.-J.; Zhao, L.-M.A longitudinal study on intrinsic connectivity of hippocampus associated with positive symptom infirst-episode schizophrenia. Behav. Brain Res. 2015, 283, 78–86. [CrossRef]
73. Tang, Y.; Chen, K.; Zhou, Y.; Liu, J.; Wang, Y.; Driesen, N.; Edmiston, E.K.; Chen, X.; Jiang, X.; Kong, L.Neural activity changes in unaffected children of patients with schizophrenia: A resting-state fMRI study.Schizophr. Res. 2015, 168, 360–365. [CrossRef]
74. Xu, Y.; Zhuo, C.; Qin, W.; Zhu, J.; Yu, C. Altered spontaneous brain activity in schizophrenia: A meta-analysisand a large-sample study. BioMed Res. Int. 2015, 2015, 204628. [CrossRef]
75. Zhou, Y.; Ma, X.; Wang, D.; Qin, W.; Zhu, J.; Zhuo, C.; Yu, C. The selective impairment of resting-statefunctional connectivity of the lateral subregion of the frontal pole in schizophrenia. PLoS ONE 2015,10, e0119176. [CrossRef]
76. Fujiki, R.; Morita, K.; Sato, M.; Yamashita, Y.; Kato, Y.; Ishii, Y.; Shoji, Y.; Uchimura, N. Single event-relatedchanges in cerebral oxygenated hemoglobin using word game in schizophrenia. Neuropsychiatr. Dis. Treat2014, 10, 2353. [CrossRef]
77. Watanabe, A.; Kato, T. Cerebrovascular response to cognitive tasks in patients with schizophrenia measuredby near-infrared spectroscopy. Schizophr. Bull. 2004, 30, 435–444. [CrossRef] [PubMed]
78. Ehlis, A.-C.; Herrmann, M.J.; Plichta, M.M.; Fallgatter, A.J. Cortical activation during two verbal fluencytasks in schizophrenic patients and healthy controls as assessed by multi-channel near-infrared spectroscopy.Psychiatry Res. Neuroimaging 2007, 156, 1–13. [CrossRef] [PubMed]
79. Mitchell, A.C.; Jiang, Y.; Peter, C.; Akbarian, S. Transcriptional regulation of GAD1 GABA synthesis gene inthe prefrontal cortex of subjects with schizophrenia. Schizophr. Res. 2015, 167, 28–34. [CrossRef]
80. Culham, J.C.; Kanwisher, N.G. Neuroimaging of cognitive functions in human parietal cortex.Curr. Opin. Neurobiol. 2001, 11, 157–163. [CrossRef]
Publisher’s Note: MDPI stays neutral with regard to jurisdictional claims in published maps and institutionalaffiliations.
© 2020 by the authors. Licensee MDPI, Basel, Switzerland. This article is an open accessarticle distributed under the terms and conditions of the Creative Commons Attribution(CC BY) license (http://creativecommons.org/licenses/by/4.0/).