EEG SIGNAL CLASSIFICATION FOR WHEELCHAIR CONTROL ...
43
EEG SIGNAL CLASSIFICATION FOR WHEELCHAIR CONTROL APPLICATION ROZI ROSLINDA BINTI ABU HASSAN A thesis submitted in fulfillment of the requirement for the award of the Degree of Master of Electrical Faculty of Electric and Electronic Engineering Universiti Tun Hussein Onn Malaysia JANUARI 2015
Transcript of EEG SIGNAL CLASSIFICATION FOR WHEELCHAIR CONTROL ...
EEG SIGNAL CLASSIFICATION FOR WHEELCHAIR CONTROL
APPLICATION
ROZI ROSLINDA BINTI ABU HASSAN
A thesis submitted in
fulfillment of the requirement for the award of the
Degree of Master of Electrical
Faculty of Electric and Electronic Engineering
Universiti Tun Hussein Onn Malaysia
JANUARI 2015
v
ABSTRACT
Brain–Computer Interface (BCI) requires generating control signals for external
device by analyzing and processing the internal brain signal. Person with severe
impairment or spinal cord injury has loss of ability to do anything. This project about
the EEG signals classification for wheelchair control application. In this project, the
movement of wheelchair (left, right, forward and reverse) will classified by user
focusing based on four visible picture in various shape and colour also four non-
visible picture (used thought image) that represent the movement. EEG signal were
analyzed to find out the features by using Fast Fourier Transform (FFT). This project
used alpha and beta band to collect the data. The analysis have made based on the
peak and average value which then be compared to define the most significant
differentiation between signals. From the result, shows that the visible colour model
meet the most significant value based on the higher percentage than the other two
models.
vi
ABSTRAK
Brain Computer Interface (BCI) memerlukan penjana isyarat kawalan untuk peranti
luaran dengan menganalisis dan memproses isyarat otak dalaman. Orang yang
mempunyai kecacatan teruk atau kecederaan pada saraf tunjang mempunyai
kehilangan keupayaan untuk melakukan semua perkara. Projek ini berkaitan
klasifikasi isyarat Electroencephalogram (EEG) untuk aplikasi kawalan kerusi roda.
Berdasarkan projek ini, pergerakan kerusi roda (kiri, kanan, depan dan belakang)
akan ditentukan oleh pengguna dengan memberi tumpuan kepada empat gambar
yang dipaparkan dalam pelbagai bentuk dan warna dan juga empat imej maya
(menggunakan imiginasi) yang mana ia mewakili pergerakan tersebut. Isyarat EEG
dianalisis untuk mengetahui ciri-cirinya dengan menggunakan Fast Fourier
Transform (FFT). Projek ini menggunakan alfa dan beta band untuk mengumpul
data. Analisis ini telah dibuat berdasarkan kepada nilai puncak dan nilai purata yang
kemudian dibandingkan untuk menentukan perbezaan yang paling ketara di antara
isyarat . Daripada keputusan itu, menunjukkan bahawa model warna yang boleh
dilihat memenuhi kreteria yang paling penting berdasarkan peratusan yang lebih
tinggi berbanding model yang lain.

vii
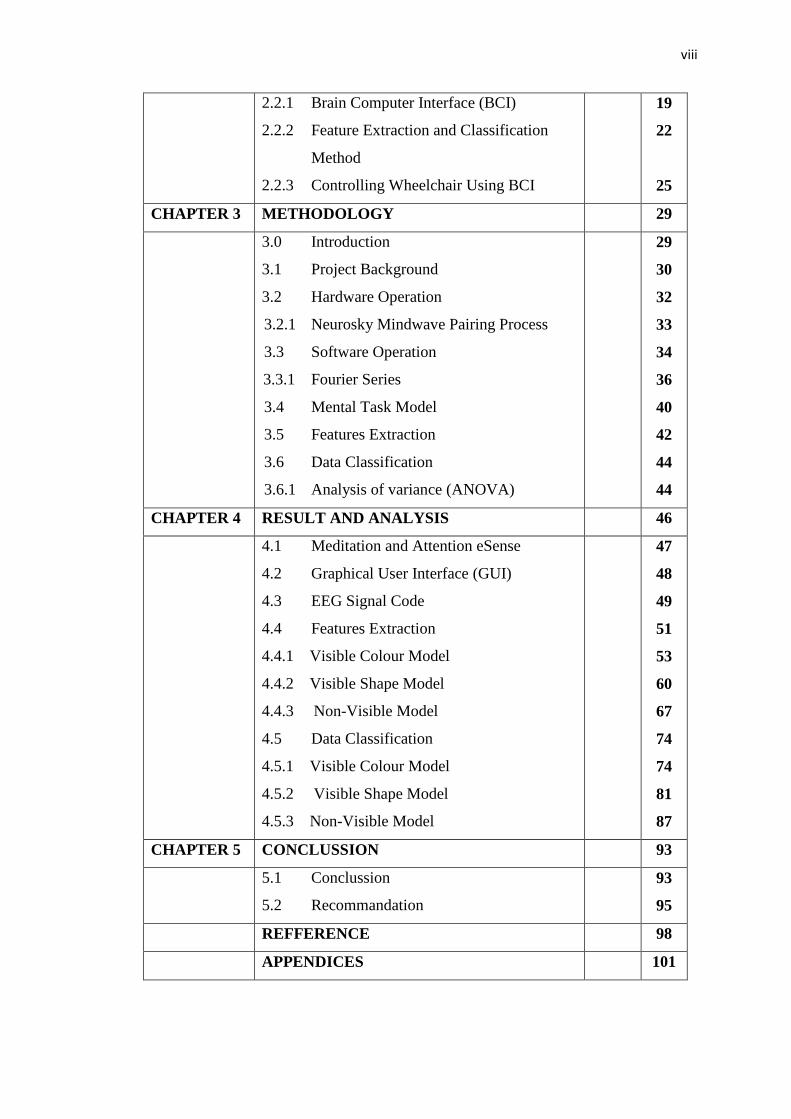
TABLE OF CONTENTS
TITLE i
DECLARATION ii
DEDICATION iii
ACKNOWLEDGEMENT iv
ABSTRACT v
CONTENTS vii
LIST OF TABLES ix
LIST OF FIGURES xii
LIST OF SYMBOLS AND ABBREVIATION xv
LIST OF APPENDIX xvii
CHAPTER 1 INTRODUCTION 1
1.1 Project Overview
1.2 Aim and Objective
1.3 Problem Statement
1.4 Scope
1
2
3
3
CHAPTER 2 LITERATURE REVIEW 4
2.1 Theoretical study
2.1.1 Brain Computer Interface (BCI)
2.1.2 Electroencephalography (EEG)
2.1.3 EEG Electrode Brain Channel
2.1.4 Data Acquisition
2.1.5 Features of EEG Signal
2.1.6 NeuroSky eSense Meter
2.1.7 EEG Signal Classification Tools
2.2 Previous Works
4
5
7
9
10
12
17
19
19
viii
2.2.1 Brain Computer Interface (BCI)
2.2.2 Feature Extraction and Classification
Method
2.2.3 Controlling Wheelchair Using BCI
19
22
25
CHAPTER 3 METHODOLOGY 29
3.0 Introduction
3.1 Project Background
3.2 Hardware Operation
3.2.1 Neurosky Mindwave Pairing Process
3.3 Software Operation
3.3.1 Fourier Series
3.4 Mental Task Model
3.5 Features Extraction
3.6 Data Classification
3.6.1 Analysis of variance (ANOVA)
29
30
32
33
34
36
40
42
44
44
CHAPTER 4 RESULT AND ANALYSIS 46
4.1 Meditation and Attention eSense
4.2 Graphical User Interface (GUI)
4.3 EEG Signal Code
4.4 Features Extraction
4.4.1 Visible Colour Model
4.4.2 Visible Shape Model
4.4.3 Non-Visible Model
4.5 Data Classification
4.5.1 Visible Colour Model
4.5.2 Visible Shape Model
4.5.3 Non-Visible Model
47
48
49
51
53
60
67
74
74
81
87
CHAPTER 5 CONCLUSSION 93
5.1 Conclussion
5.2 Recommandation
93
95
REFFERENCE 98
APPENDICES 101

ix
LIST OF TABLES
2.1 Control Algorithm Using EOG and EMG Signal 28
3.1 EEG Frequency Bands 42
4.1 Peak Value of Attention EEG Signal for Visible Colour
Model
54
4.2 Average Value of Attention EEG Signal for Visible Colour
Model
56
4.3 Peak Value of Meditation EEG Signal for Visible Colour
Model
57
4.4 Average Value of Meditation EEG Signal for Visible Colour
Model
59
4.5 Peak Value of Attention EEG Signal for Visible Shape Model 61
4.6 Average Value of Attention EEG Signal for Visible Shape
Model
63
4.7 Peak Value of Meditation EEG Signal for Visible Shape
Model
64
4.8 Average Value of Meditation EEG Signal for Visible Shape
Model
66
4.9 Peak Value of Attention EEG Signal for Non Visible Model 68
4.10 Average Value of Attention EEG Signal for Non Visible
Model
70
4.11 Peak Value of Meditation EEG Signal for Non Visible Model 71
4.12 Average Value of Meditation EEG Signal for Non Visible
Model
73
4.13 Peak Value Data Analysis of Visible Colour Model by
Manual Calculation
75

x
4.14 Peak Value Data Analysis of Visible Colour Model by
ANOVA
76
4.15 Average Value Data Analysis of Visible Colour Model by
Manual Calculation
76
4.16 Average Value Data Analysis of Visible Colour Model by
ANOVA
77
4.17 Peak Value Data Analysis of Visible Colour Model by
Manual Calculation
78
4.18 Peak Value Data Analysis of Visible Colour Model by
ANOVA
78
4.19 Average Value Data Analysis of Visible Colour Model by
Manual Calculation
79
4.20 Average Value Data Analysis of Visible Colour Model by
ANOVA
80
4.21 Peak Value Data Analysis of Visible Shape Model by Manual
Calculation
81
4.22 Peak Value Data Analysis of Visible Shape Model by
ANOVA
82
4.23 Average Value Data Analysis of Visible Shape Model by
Manual Calculation
82
4.24 Average Value Data Analysis of Visible Shape Model by
ANOVA
83
4.25 Peak Value Data Analysis of Visible Shape Model by Manual
Calculation
84
4.26 Peak Value Data Analysis of Visible Shape Model by ANOVA 84
4.27 Average Value Data Analysis of Visible Shape Model by
Manual Calculation
85
4.28 Peak Value Data Analysis of Visible Colour Model by Anova 86
4.29 Peak Value Data Analysis of Non-Visible Model by Manual
Calculation
87
4.30 Peak Value Data Analysis of Non-Visible Model by ANOVA 88
4.31 Average Value Data Analysis of Non-Visible Model by
Manual Calculation
88

xi
4.32 Average Value Data Analysis of Non-Visible Model by
ANOVAs
89
4.33 Peak Value Data Analysis of Non-Visible Model by Manual
Calculation
89
4.34 Peak Value Data Analysis of Non-Visible Model by ANOVA 90
4.35 Average Value Data Analysis of Non-Visible Model by
Manual Calculation
91
4.36 Average Value Data Analysis of Non-Visible Model by
ANOVAs
91

xii
LIST OF FIGURES
2.1 8x8 of Electrode Grid Placing On the Surface of Brain 6
2.2 The International 10/20 Systems of Electrode Placement 9
2.3 Data Acquisition Design Option 10
2.4 Neurosky Mindwave Mobile 11
2.5 The Technique To Put On Neurosky Mindwave 12
2.6 Delta Wave Pattern 13
2.7 Delta wave in Time Domain and Frequency Domain 13
2.8 Theta Wave Pattern 14
2.9 Theta wave in Time Domain and Frequency Domain 14
2.10 Alpha Wave Pattern 15
2.11 Alpha wave in Time Domain and Frequency Domain 15
2.12 Beta Wave Pattern 15
2.13 Beta wave in Time Domain and Frequency Domain 15
2.14 Gamma Wave Pattern 16
2.15 MU Wave Pattern 16
2.16 Mu wave in Time Domain and Frequency Domain 17
2.17 A Typical Brain Computer Interface System. Cursor
Control, Bio-Feedback or Control of a Robot Arm is
Examples of Output Applications.
21
2.18 The Block Diagram of The Wheelchair System 25
2.19 Wheelchair Controlling System Using Hybrid BCI 26
2.20 Wheelchair Control Using P300 BCI 27
3.1 Block Diagram of BCI System. 30
3.2 Implementation Phase of The Project 31
3.3 Neurosky Device 32
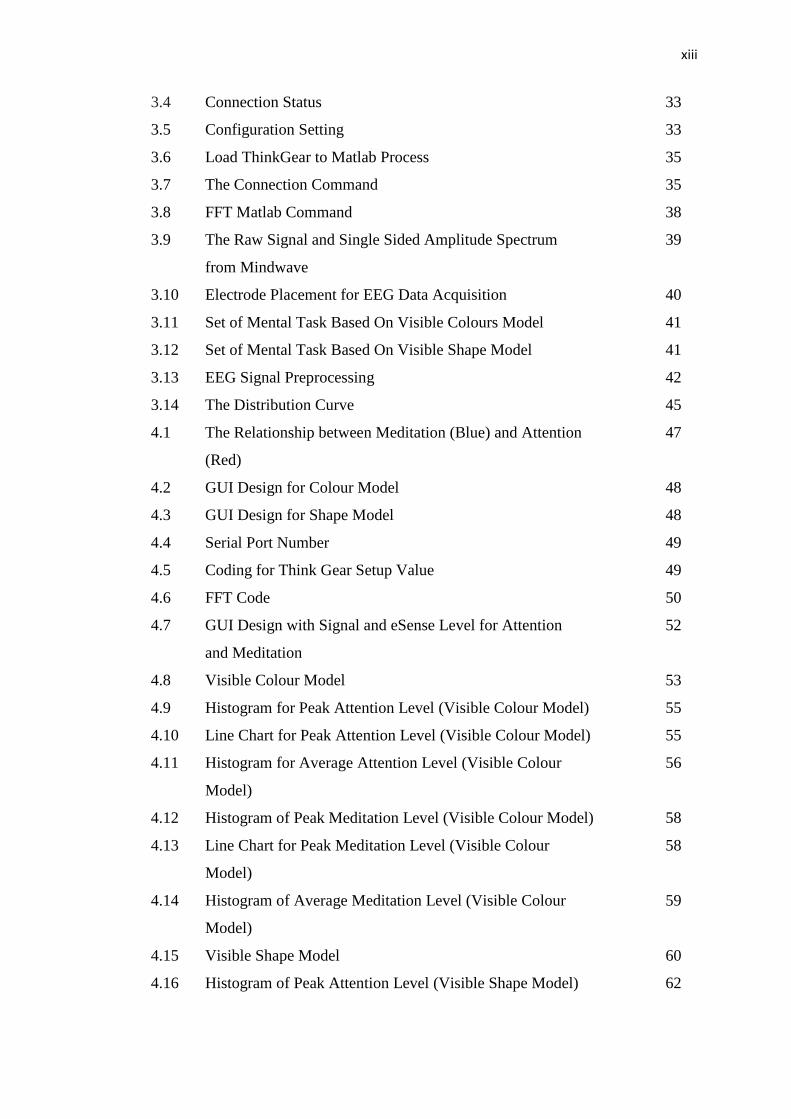
xiii
3.4 Connection Status 33
3.5 Configuration Setting 33
3.6 Load ThinkGear to Matlab Process 35
3.7 The Connection Command 35
3.8 FFT Matlab Command 38
3.9 The Raw Signal and Single Sided Amplitude Spectrum
from Mindwave
39
3.10 Electrode Placement for EEG Data Acquisition 40
3.11 Set of Mental Task Based On Visible Colours Model 41
3.12 Set of Mental Task Based On Visible Shape Model 41
3.13 EEG Signal Preprocessing 42
3.14 The Distribution Curve 45
4.1 The Relationship between Meditation (Blue) and Attention
(Red)
47
4.2 GUI Design for Colour Model 48
4.3 GUI Design for Shape Model 48
4.4 Serial Port Number 49
4.5 Coding for Think Gear Setup Value 49
4.6 FFT Code 50
4.7 GUI Design with Signal and eSense Level for Attention
and Meditation
52
4.8 Visible Colour Model 53
4.9 Histogram for Peak Attention Level (Visible Colour Model) 55
4.10 Line Chart for Peak Attention Level (Visible Colour Model) 55
4.11 Histogram for Average Attention Level (Visible Colour
Model)
56
4.12 Histogram of Peak Meditation Level (Visible Colour Model) 58
4.13 Line Chart for Peak Meditation Level (Visible Colour
Model)
58
4.14 Histogram of Average Meditation Level (Visible Colour
Model)
59
4.15 Visible Shape Model 60
4.16 Histogram of Peak Attention Level (Visible Shape Model) 62
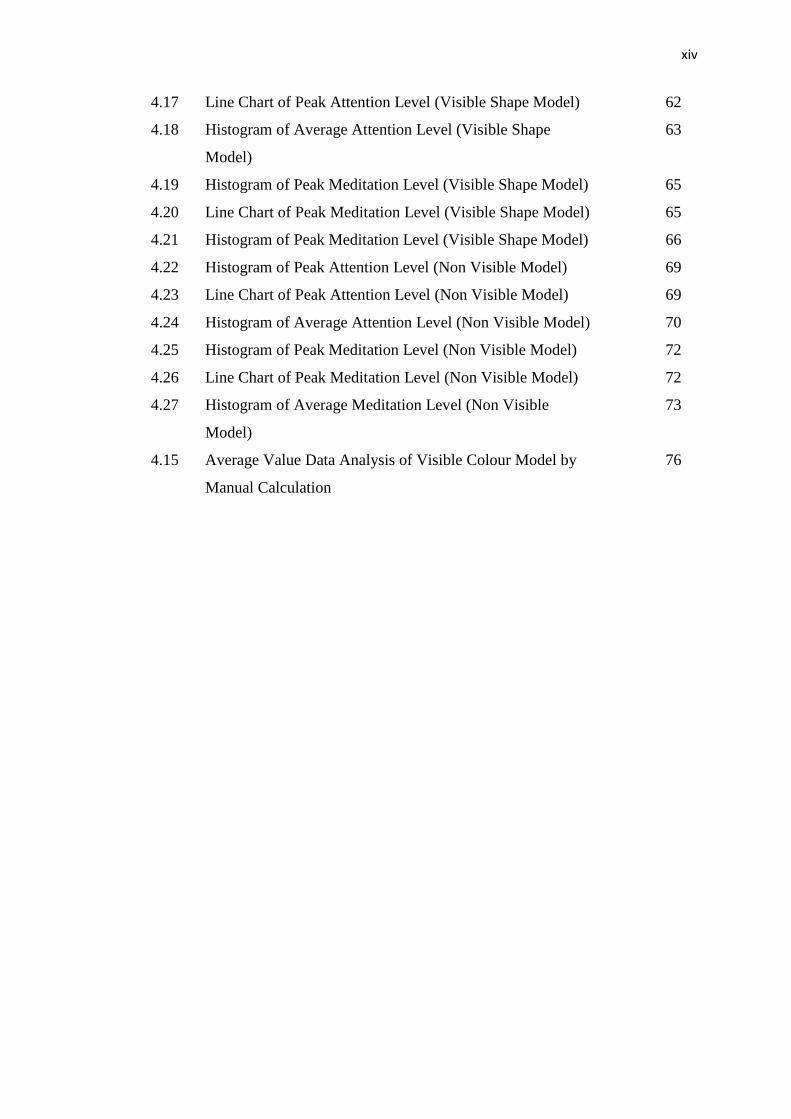
xiv
4.17 Line Chart of Peak Attention Level (Visible Shape Model) 62
4.18 Histogram of Average Attention Level (Visible Shape
Model)
63
4.19 Histogram of Peak Meditation Level (Visible Shape Model) 65
4.20 Line Chart of Peak Meditation Level (Visible Shape Model) 65
4.21 Histogram of Peak Meditation Level (Visible Shape Model) 66
4.22 Histogram of Peak Attention Level (Non Visible Model) 69
4.23 Line Chart of Peak Attention Level (Non Visible Model) 69
4.24 Histogram of Average Attention Level (Non Visible Model) 70
4.25 Histogram of Peak Meditation Level (Non Visible Model) 72
4.26 Line Chart of Peak Meditation Level (Non Visible Model) 72
4.27 Histogram of Average Meditation Level (Non Visible
Model)
73
4.15 Average Value Data Analysis of Visible Colour Model by
Manual Calculation
76

xv
LIST OF SYMBOLS AND ABBREVIATIONS
C - Central
F - Frontal
O - Occipital
P - Parietal
T - Temporal
T - Period
t - Time
V - Volt
µ - Mu
ω - Angular Frequency
H0 - Null Hypothesis
H1 - Alternative Hypothesis
Hz - Hertz
AEP - Auditory Evoked Potential
ANN - Artificial Neural Network
ANOVA - Analysis Of Variance
BCI - Brain-Computer Interfaces
BMI - Brain Machine Interface
BPS - Bits Per Second
CFT - Continuous Fourier Transform
DFT - Discrete Fourier Transform
DNI - Direct Neural Interface
ECoG - Electrocorticography
EEG - Electroencephalogram
EMG - Electromyographic
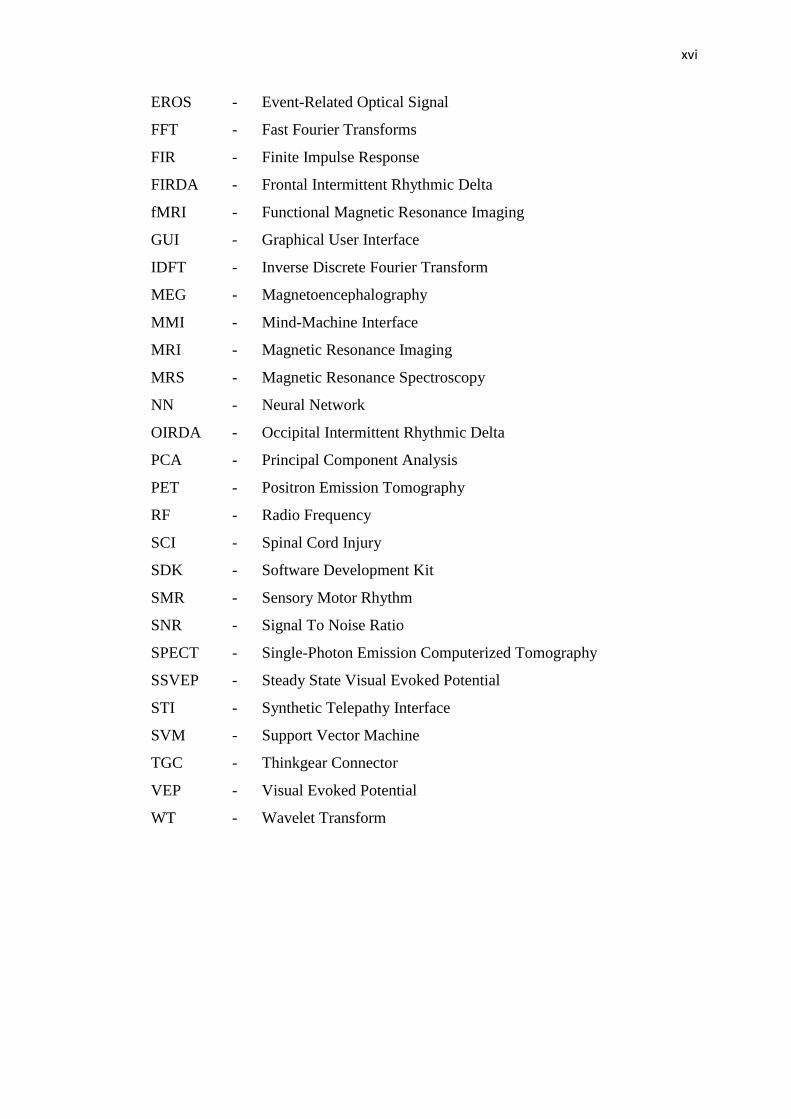
xvi
EROS - Event-Related Optical Signal
FFT - Fast Fourier Transforms
FIR - Finite Impulse Response
FIRDA - Frontal Intermittent Rhythmic Delta
fMRI - Functional Magnetic Resonance Imaging
GUI - Graphical User Interface
IDFT - Inverse Discrete Fourier Transform
MEG - Magnetoencephalography
MMI - Mind-Machine Interface
MRI - Magnetic Resonance Imaging
MRS - Magnetic Resonance Spectroscopy
NN - Neural Network
OIRDA - Occipital Intermittent Rhythmic Delta
PCA - Principal Component Analysis
PET - Positron Emission Tomography
RF - Radio Frequency
SCI - Spinal Cord Injury
SDK - Software Development Kit
SMR - Sensory Motor Rhythm
SNR - Signal To Noise Ratio
SPECT - Single-Photon Emission Computerized Tomography
SSVEP - Steady State Visual Evoked Potential
STI - Synthetic Telepathy Interface
SVM - Support Vector Machine
TGC - Thinkgear Connector
VEP - Visual Evoked Potential
WT - Wavelet Transform

xvii
LIST OF APPENDICES
APPENDIX TITLE PAGE
A EEG Signal Coding 101
B Visible Colour Model Trial Data 108
C Visible Shape Model Trial Data 110
D Non-Visible Model Trial Data 112

1
CHAPTER I
INTRODUCTION
1.1 Project Overview
Spinal or vertebral column is the most important part in our body where the major
functions are to protect the spinal cord, nerve root and also the internal organs.
Spinal cord injury occurs when there is any damage to the spinal cord that blocks
communication between the brain and the body. When the spinal cord injured, a
person’s sensory, motor and reflex messages are affected and may not be able to
function as usual. The higher the level of injury, the more dysfunction can occur [1].
This may result in partial or complete paralysis of the body as well as complete
paralysis of the arms and legs.
For persons with a highest level of Spinal Cord Injury (SCI), they are only able
to control a muscle movement from a neck and above. To gain an independent
mobility, a power electrical wheelchair with an alternative or hands free interface is
crucial since normal joystick is not viable anymore. The medium can be developed
by utilising information generated from eyes, tongue, voice and brainwave.
This kind of wheelchair can categorize as an intelligent wheelchair as it operate
base on computer interface. The information that collected from the action of eyes,
tongue, voice or brainwave then will be process to drive the movement of wheelchair
to left, right, forward or reverse. The possibility of moving in an autonomous way

2
gives user with severe impairment conditions a remarkable physical and
psychological sense of well-being.
In recent years, it can be observed a growing of interest in Brain-Computer
Interfaces (BCI) system for medical and multimedia applications. BCI is a device to
provide direct interface between human brain and computer [2]. The users just need
to think of movement in order to drive the system. Therefore the usage of BCI is one
of the prominent devices for enabling the severe impairment user to control
wheelchair.
For this project an Electroencephalogram (EEG) signal generated from single
electrode that placed on the forehead will be used as a controller to initiate user-
intention command. The alpha and beta band are used as the EEG device has built in
chipset that detect the meditation and attention eSense. The analysis is done with
sufficient EEG sample data of user focussing on four visible objects in various
shapes, colours and thought image that constitute the wheelchair’s movement
command. Once analyzed, the model that gave highest accuracy in term of the means
and variance comparison within a model will be selected as the final prototype
controlling wheelchair movement via BCI.
1.2 Aim and Objectives
The aim of this project is to classify the EEG signal to control the basic wheelchair’s
movement which are left, right, forward and reverse. The specific objectives are:
i) To acquire and process the EEG signal from non-invasive BCI (Neurosky
Mindwave) device using Matlab Software.
ii) To analyze the EEG signal in term of attention and meditation level by using
their peak and average value.
iii) To classify the EEG signal into four basic movements based on various visible
and non visible user- input representations.
iv) To select the best between shapes’, colours’ and thought image’s model for
wheelchair control application.
3
1.3 Problem Statement
Every year, around the world, between 250 000 and 500 000 people suffer a spinal
cord injury (SCI) and severe impairments. The majority of spinal cord injuries are
due to preventable causes such as road traffic crashes, falls or violence [3]. The
damage of spinal cord and nerve root may effect from incomplete to total
dysfunction. Conventionally, most people with severe impairments conditions are
unable to control their electrical wheelchair using a standard joystick. A complete
paralysis of the body severe impairment people as well as complete paralysis of the
arms and legs cause the power wheelchair with alternative interface is needed.
Limited physical movement above the fourth cervical vertebra typically no single
alternative interface provides a comprehensive solution to the control wheelchair.
Therefore this project will develop the BCI system based on EEG signal
classification to control wheelchair so that the patients can use their brain to move
the wheelchair without any assistant.
1.4 Scope
The scopes of this study are:
i) Use the Neurosky Mindwave of single electrode EEG headset to capture the
brain signal.
ii) Constraint of four basic wheelchair’s movement which are left, right, forward
and reverse.
iii) Use Matlab software to analyse the collected data.
CHAPTER 2
LITERATURE REVIEW
In this chapter, there are two main subtopics will be discussed which are theoretical
study and previous works that related to this project. The former will be discussing
on some related theories and the explanation on each component used in this project
while the latter is review recent works that related to this project to make better
understanding in term of the procedure and technique used in each successful
projects.
2.1 Theoretical study
The theoretical study discussed about the study of the Brain Computer Interface
system including the types of device, electrode channel and the signal acquisition.

5
2.1.1 Brain Computer Interface (BCI)
A Brain Computer Interface (BCI) often called a Mind-Machine Interface (MMI) or
sometimes called a Direct Neural Interface (DNI), Synthetic Telepathy Interface
(STI) or a Brain Machine Interface (BMI) is a direct communication pathway
between the brain and an external device. BCIs are often directed at assisting,
augmenting or repairing human cognitive or sensory-motor functions [4].
Humans’ brain is filled with neurons, individual nerve cells connected to one
another by dendrites and axons. Every action like think, move, feel or remember
something make neurons are at work. That work is carried out by small electric
signals that zip from neuron to neuron as fast as 250 mph [5]. The signals are
generated based on the differences in electric potential carried by ions on the
membrane of each neuron. The signals then can be detected, interpreted to what they
mean and use them to direct a device of some purpose.
Therefore, BCI is a system that provides direct interface between the human
brain and the computer [2]. In order to develop the BCI system, the feasible
technique should be studied. BCI systems are broadly classified into invasive and
non-invasive techniques.
2.1.1.1 Invasive BCI
Invasive BCI are Neuroprosthetics where electrode arrays heads are buried within the
brain during neurosurgery and left there on a permanent basis. Invasive devices
produce the highest quality signals of BCI device because they lie in the grey matter
of brain. They have by far the best signal to noise ratio and accuracy of any BCI
method. Unfortunately invasive BCI is costly and require complex surgery to implant.
They are require a permanent hole in the skull, build-up prone to scar-tissue, causing
the signal to become weaker or even non-existent, as the body reacts to a foreign
object in the brain.

6
Electrocorticography (ECoG) is one of the invasive BCI. It also known as
partially invasive as the device is implanted inside the skull but rest outside the brain
rather than within the grey matter. ECoG is a very promising intermediate BCI
modality because it has higher spatial resolution, better signal-to-noise ratio, wider
frequency range, and less training requirements than scalp-recorded EEG, and at the
same time has lower technical difficulty, lower clinical risk, and probably superior
long-term stability than intracortical single-neuron recording [6]. This feature profile
shows potential for real world application for people with motor disabilities.
Unfortunately ECoG is also costly and required dangerous nature of surgeries for
such system. Figure 2.1 shows the 8x8 electrode grid that place on the brain surface.
Figure 2.1: 8x8 of Electrode Grid Placing On the Surface of Brain
2.1.1.2 Non-Invasive BCI
Non-invasive BCI is the most popular technique where the electrodes need to be
placed outside of the skull or on the scalp. Non-invasive methods are limited in that
they are often susceptible to noise, have worse signal resolution due to distance from
the brain, and have difficulty recording the inner workings of the brain [7]. However
they have the advantages that can combat these difficulties by lower cost, greater
portability and the fact that they do not require any special surgery.

7
Most non-invasive BCI systems use electroencephalogram (EEG) signals. EEG
is the first non-invasive neuron imaging technique discovered which is used for
measuring the electrical activity of the brain. Besides electrical activity, neural
activity also produces other types of signals such as magnetic and metabolic that
could be used in a BCI. Magnetic fields can be recorded by using
magnetoencephalography (MEG), while brain metabolic activity which is reflected
in changes in blood flow can be observed by using positron emission tomography
(PET), functional magnetic resonance imaging (fMRI), and optical imaging [8].
Unfortunately, such alternative techniques require sophisticated devices that
can be operated only in special facilities. Moreover, techniques for measuring blood
flow have long latencies and thus are less appropriate for interaction [8].
2.1.2 Electroencephalography (EEG)
EEG is the first non-invasive neuron imaging technique discovered which is used for
measuring the electrical activity of the brain. EEG signals are detected from the scalp
and contain noise as a result of electrical interference and movement of electrodes [9].
Applying a large number of EEG channels may include noisy and redundant signals
that degrade the BCI performance and also involve a prolonged preparation time that
directly impacts the convenience in the use of the BCI. Therefore, selecting the least
number of channels that yield the best or required accuracy can balance both needs
for performance and convenience [10]. Due to its ease of use, cost and high temporal
resolution this method is the most widely used one in BCIs nowadays [11].
The advantages of using EEG technique are:
a) Hardware costs are significantly lower than those of most other
techniques.
b) EEG sensors can be used in more places than fMRI, SPECT, PET, MRS,
or MEG, as these techniques require bulky and immobile equipment. For
example, MEG requires equipment consisting of liquid helium-cooled
detectors that can be used only in magnetically shielded rooms,

8
altogether costing upwards of several million dollars and fMRI requires
the use of a 1-ton magnet in, again, a shielded room.
c) EEG has very high temporal resolution, on the order of milliseconds
rather than seconds. EEG is commonly recorded at sampling rates
between 250 and 2000 Hz in clinical and research settings, but modern
EEG data collection systems are capable of recording at sampling rates
above 20,000 Hz if desired. MEG and EROS are the only other non-
invasive cognitive neuroscience techniques that acquire data at this level
of temporal resolution.
d) EEG is silent, which allows for better study of the responses to auditory
stimuli.
e) EEG does not aggravate claustrophobia, unlike fMRI, PET, MRS,
SPECT, and sometimes MEG.
f) EEG does not involve exposure to high-intensity (>1 Tesla) magnetic
fields, as in some of the other techniques, especially MRI and MRS.
These can cause a variety of undesirable issues with the data, and also
prohibit use of these techniques with participants that have metal
implants in their body, such as metal-containing pacemakers.
g) Extremely non-invasive, unlike ECoG which actually requires electrodes
to be placed on the surface of the brain.
The characteristics of EEG that compare favorably with behavioral testing:
a) EEG can detect covert processing (i.e., processing that does not require a
response)
b) EEG can be used in subjects who are incapable of making a motor
response.
c) EEG is a powerful tool for tracking brain changes during different phases
of life. EEG sleep analysis can indicate significant aspects of the timing
of brain development, including evaluating adolescent brain maturation.
h) In EEG there is a better understanding of what signal is measured as
compared to other research techniques, i.e. the BOLD response in MRI.
9
2.1.3 EEG Electrode Brain Channel
Typically, in BCI study, electrode locations are selected arbitrarily from scalp area
corresponding to the motor cortical region to record the electrical activity of the brain.
It is well known that the variation of the surface potential distribution on the scalp
reflects functional activities emerging from the underlying brain [12]. This surface
potential variation then can be record and the voltage of electrodes can be measure,
which are then filter, amplify, and record.
Electrodes conduct voltage potentials as microvolt level signals, and carry
them into amplifiers that magnify the signals approximately ten thousand times. The
use of this technology depends strongly on the electrodes positioning and the
electrodes contact [12]. For this reason, electrodes are usually constructed from
conductive materials, such as gold or silver chloride including a conductive gel that
will apply between electrode and scalp to maintain an acceptable signal to noise ratio.
The gel based electrode system however have difficulties on the need of long
montage time and the need to wash the user’s hair after the recording. Therefore, the
dry electrode system will be use to reduce the electrode- skin impedance.
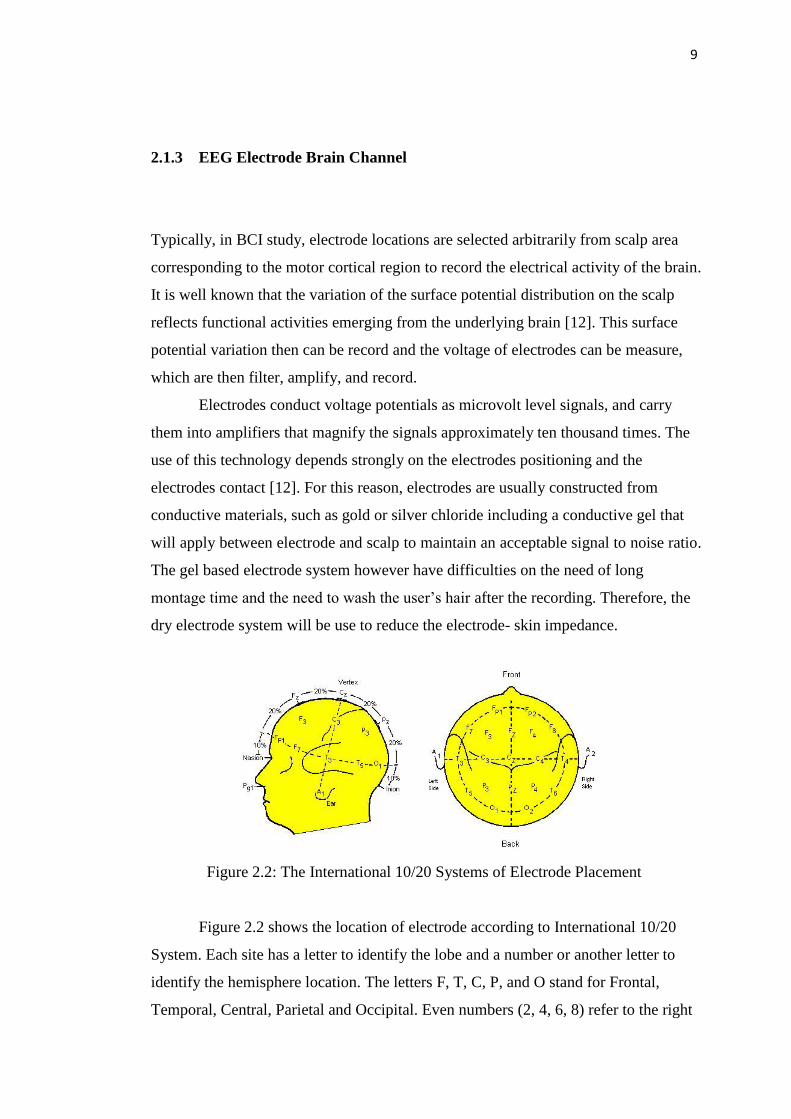
Figure 2.2: The International 10/20 Systems of Electrode Placement
Figure 2.2 shows the location of electrode according to International 10/20
System. Each site has a letter to identify the lobe and a number or another letter to
identify the hemisphere location. The letters F, T, C, P, and O stand for Frontal,
Temporal, Central, Parietal and Occipital. Even numbers (2, 4, 6, 8) refer to the right
10
hemisphere and odd numbers (1, 3, 5, 7) refer to the left hemisphere. The z refers to
an electrode placed on the midline.
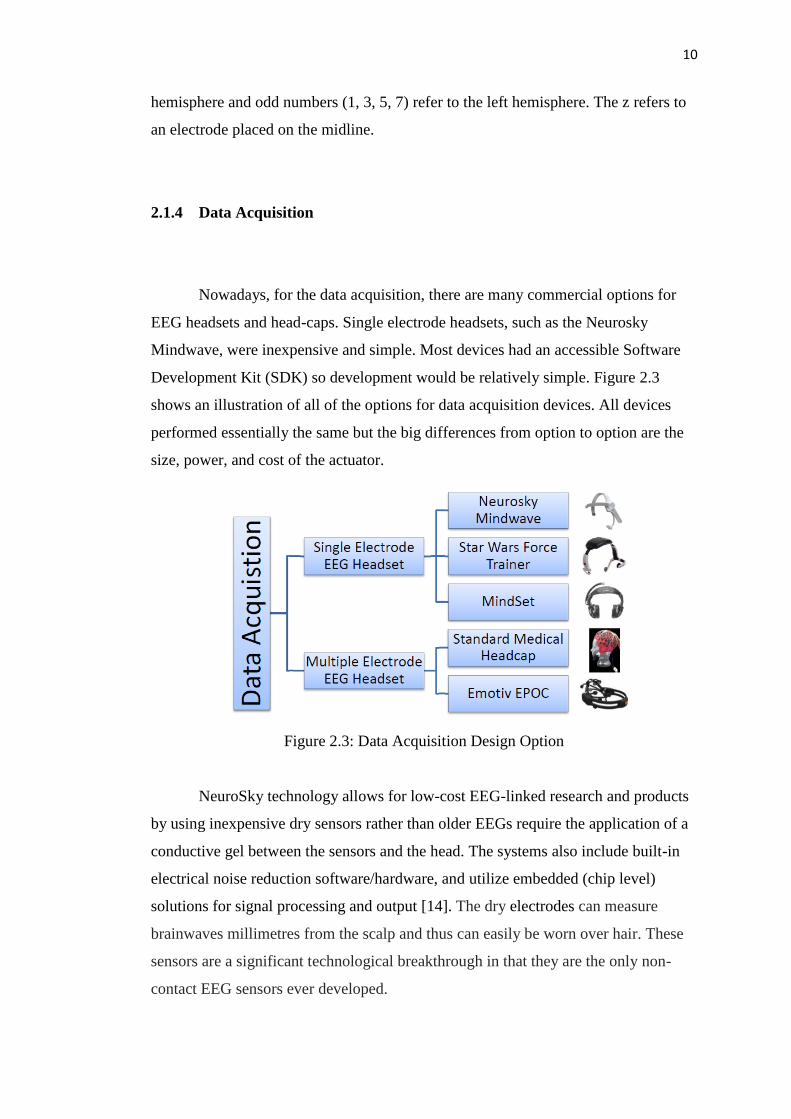
2.1.4 Data Acquisition
Nowadays, for the data acquisition, there are many commercial options for
EEG headsets and head-caps. Single electrode headsets, such as the Neurosky
Mindwave, were inexpensive and simple. Most devices had an accessible Software
Development Kit (SDK) so development would be relatively simple. Figure 2.3
shows an illustration of all of the options for data acquisition devices. All devices
performed essentially the same but the big differences from option to option are the
size, power, and cost of the actuator.
Figure 2.3: Data Acquisition Design Option
NeuroSky technology allows for low-cost EEG-linked research and products
by using inexpensive dry sensors rather than older EEGs require the application of a
conductive gel between the sensors and the head. The systems also include built-in
electrical noise reduction software/hardware, and utilize embedded (chip level)
solutions for signal processing and output [14]. The dry electrodes can measure
brainwaves millimetres from the scalp and thus can easily be worn over hair. These
sensors are a significant technological breakthrough in that they are the only non-
contact EEG sensors ever developed.
11
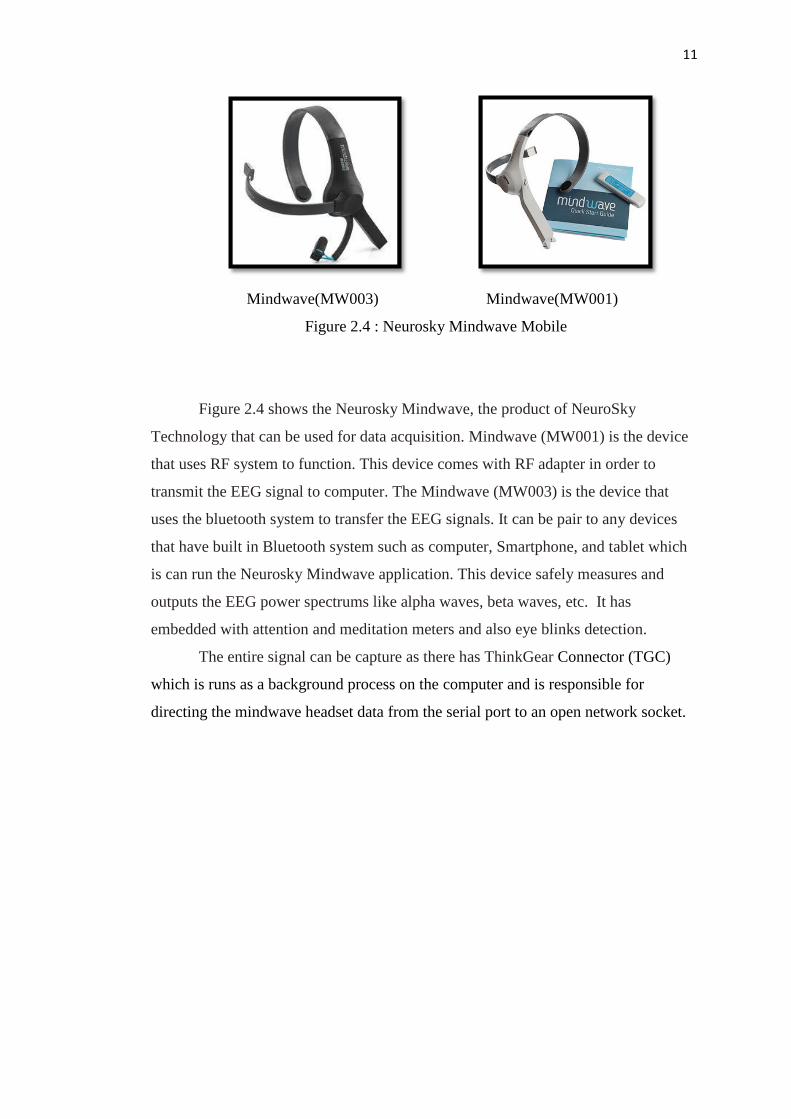
Mindwave(MW003) Mindwave(MW001)
Figure 2.4 : Neurosky Mindwave Mobile
Figure 2.4 shows the Neurosky Mindwave, the product of NeuroSky
Technology that can be used for data acquisition. Mindwave (MW001) is the device
that uses RF system to function. This device comes with RF adapter in order to
transmit the EEG signal to computer. The Mindwave (MW003) is the device that
uses the bluetooth system to transfer the EEG signals. It can be pair to any devices
that have built in Bluetooth system such as computer, Smartphone, and tablet which
is can run the Neurosky Mindwave application. This device safely measures and
outputs the EEG power spectrums like alpha waves, beta waves, etc. It has
embedded with attention and meditation meters and also eye blinks detection.
The entire signal can be capture as there has ThinkGear Connector (TGC)
which is runs as a background process on the computer and is responsible for
directing the mindwave headset data from the serial port to an open network socket.
12
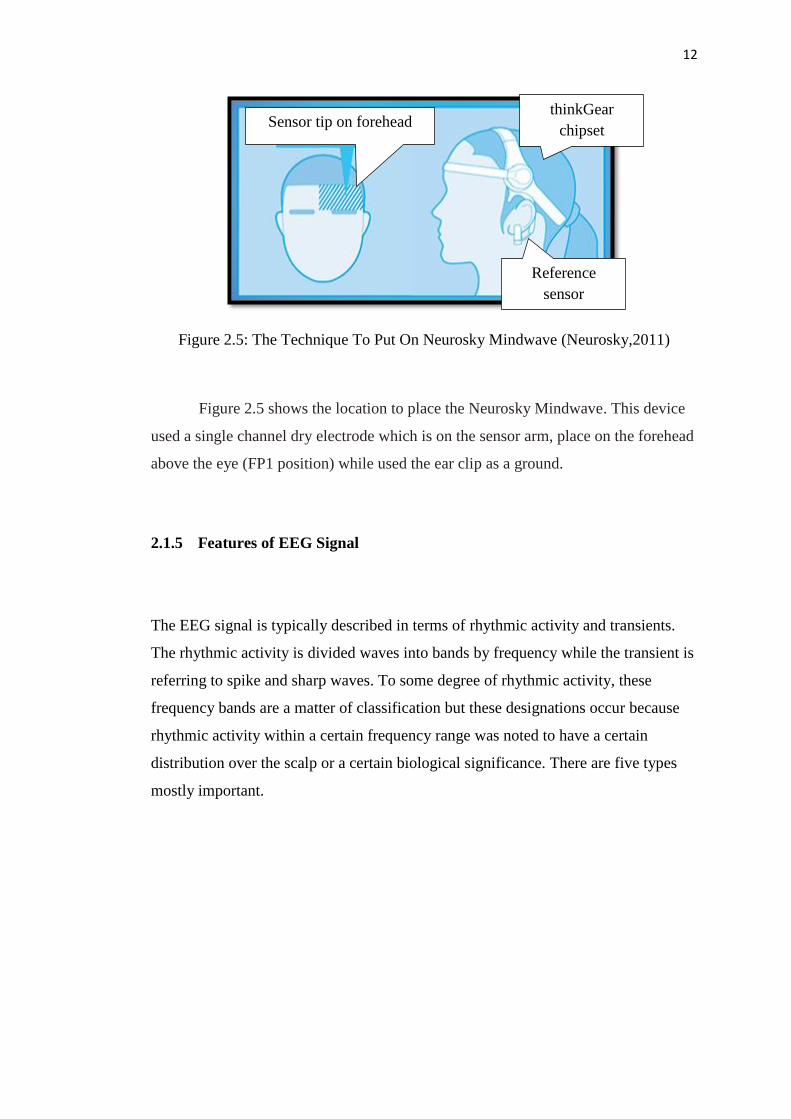
Figure 2.5: The Technique To Put On Neurosky Mindwave (Neurosky,2011)
Figure 2.5 shows the location to place the Neurosky Mindwave. This device
used a single channel dry electrode which is on the sensor arm, place on the forehead
above the eye (FP1 position) while used the ear clip as a ground.
2.1.5 Features of EEG Signal
The EEG signal is typically described in terms of rhythmic activity and transients.
The rhythmic activity is divided waves into bands by frequency while the transient is
referring to spike and sharp waves. To some degree of rhythmic activity, these
frequency bands are a matter of classification but these designations occur because
rhythmic activity within a certain frequency range was noted to have a certain
distribution over the scalp or a certain biological significance. There are five types
mostly important.
thinkGear
chipset Sensor tip on forehead
Reference
sensor
13
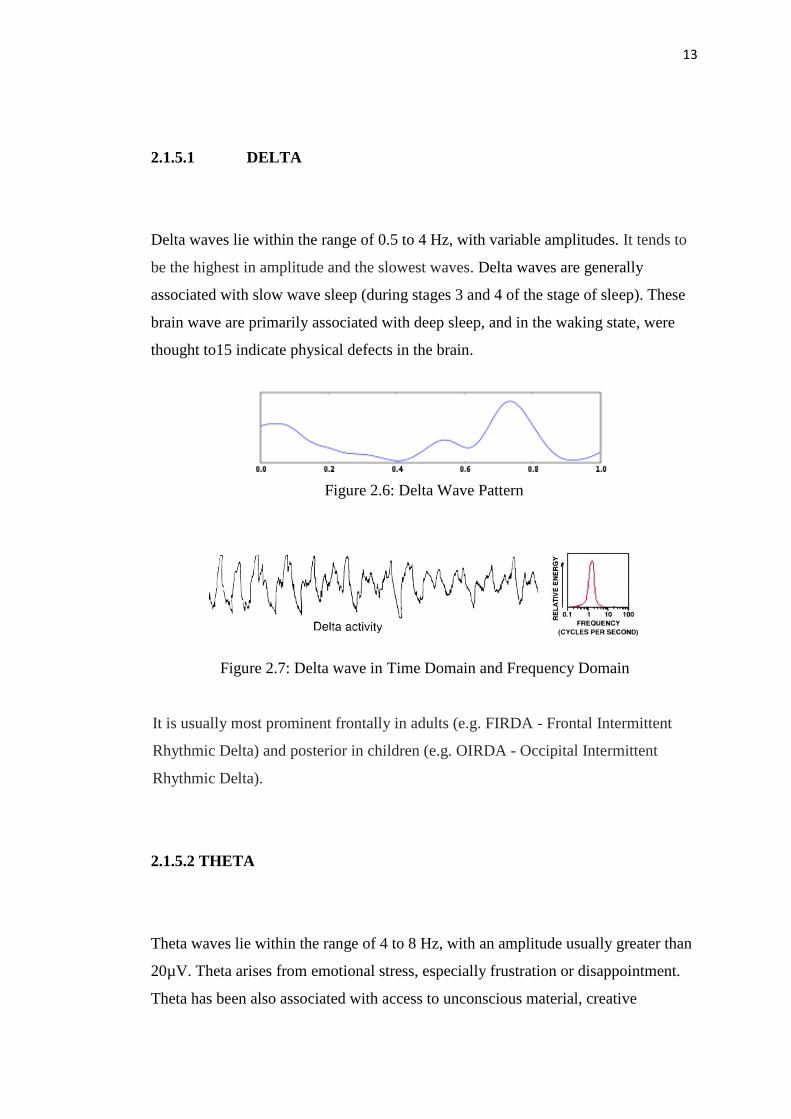
2.1.5.1 DELTA
Delta waves lie within the range of 0.5 to 4 Hz, with variable amplitudes. It tends to
be the highest in amplitude and the slowest waves. Delta waves are generally
associated with slow wave sleep (during stages 3 and 4 of the stage of sleep). These
brain wave are primarily associated with deep sleep, and in the waking state, were
thought to15 indicate physical defects in the brain.
Figure 2.6: Delta Wave Pattern
Figure 2.7: Delta wave in Time Domain and Frequency Domain
It is usually most prominent frontally in adults (e.g. FIRDA - Frontal Intermittent
Rhythmic Delta) and posterior in children (e.g. OIRDA - Occipital Intermittent
Rhythmic Delta).
2.1.5.2 THETA
Theta waves lie within the range of 4 to 8 Hz, with an amplitude usually greater than
20µV. Theta arises from emotional stress, especially frustration or disappointment.
Theta has been also associated with access to unconscious material, creative
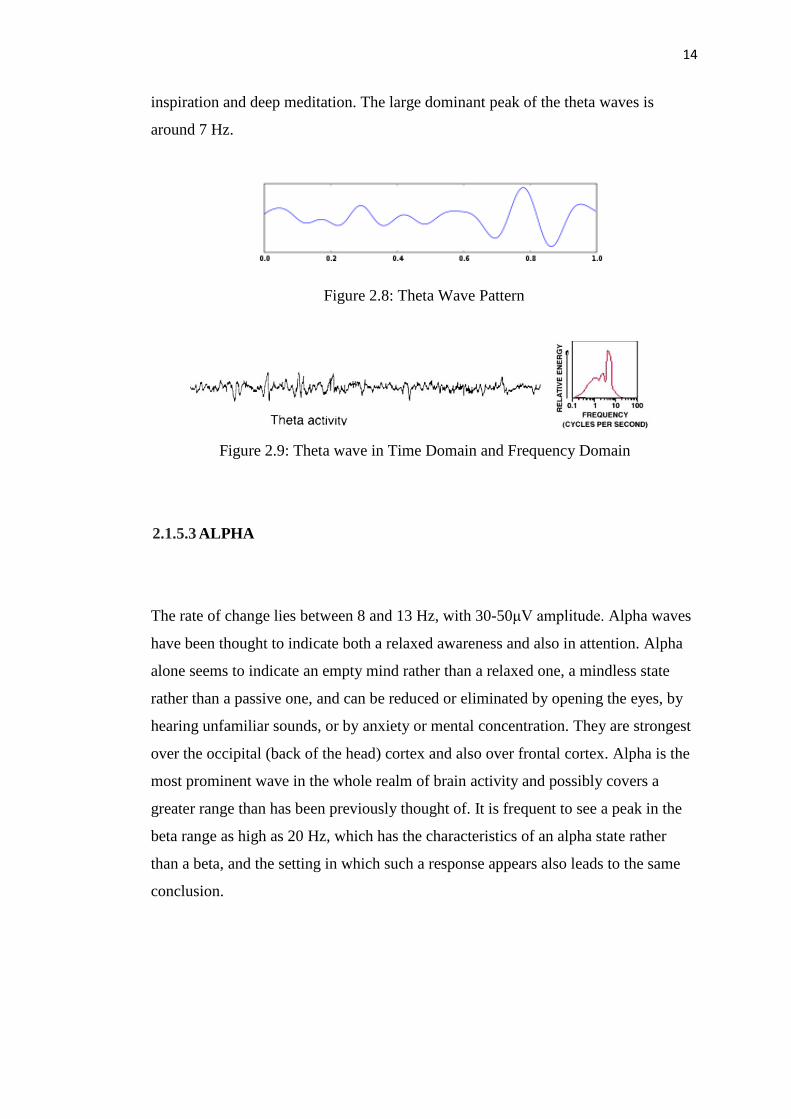
14
inspiration and deep meditation. The large dominant peak of the theta waves is
around 7 Hz.
Figure 2.8: Theta Wave Pattern
Figure 2.9: Theta wave in Time Domain and Frequency Domain
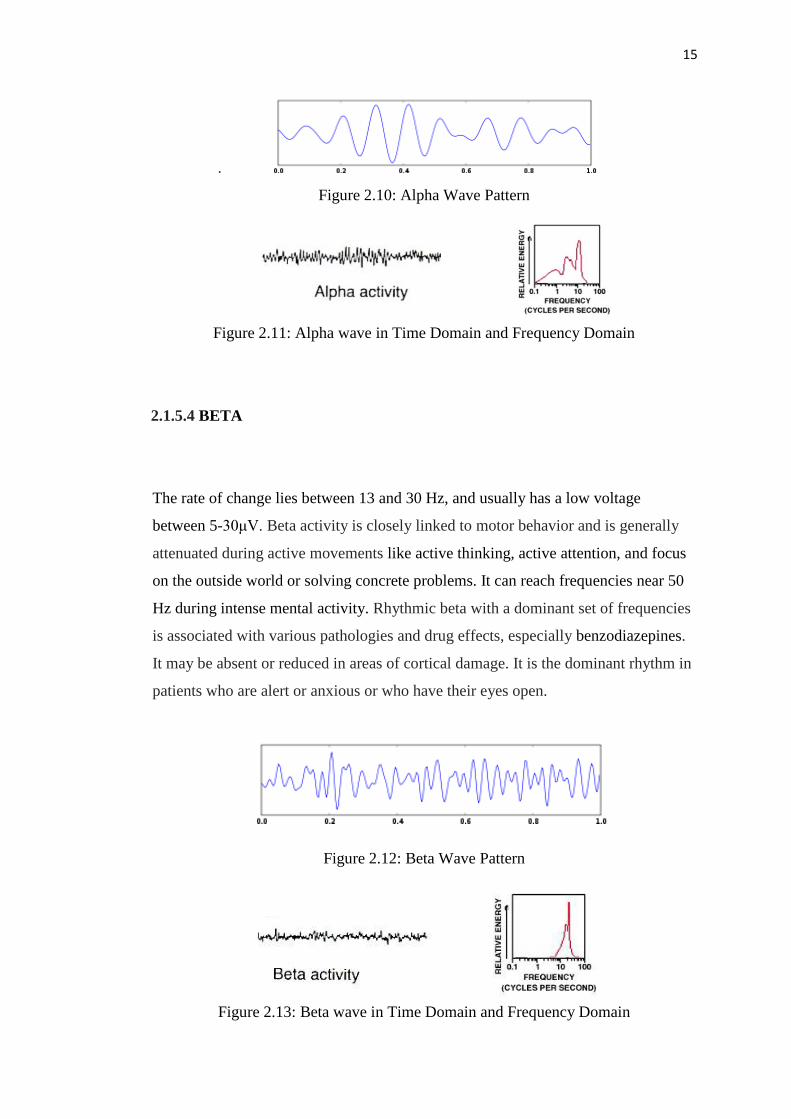
2.1.5.3 ALPHA
The rate of change lies between 8 and 13 Hz, with 30-50μV amplitude. Alpha waves
have been thought to indicate both a relaxed awareness and also in attention. Alpha
alone seems to indicate an empty mind rather than a relaxed one, a mindless state
rather than a passive one, and can be reduced or eliminated by opening the eyes, by
hearing unfamiliar sounds, or by anxiety or mental concentration. They are strongest
over the occipital (back of the head) cortex and also over frontal cortex. Alpha is the
most prominent wave in the whole realm of brain activity and possibly covers a
greater range than has been previously thought of. It is frequent to see a peak in the
beta range as high as 20 Hz, which has the characteristics of an alpha state rather
than a beta, and the setting in which such a response appears also leads to the same
conclusion.
15
.
Figure 2.10: Alpha Wave Pattern
Figure 2.11: Alpha wave in Time Domain and Frequency Domain
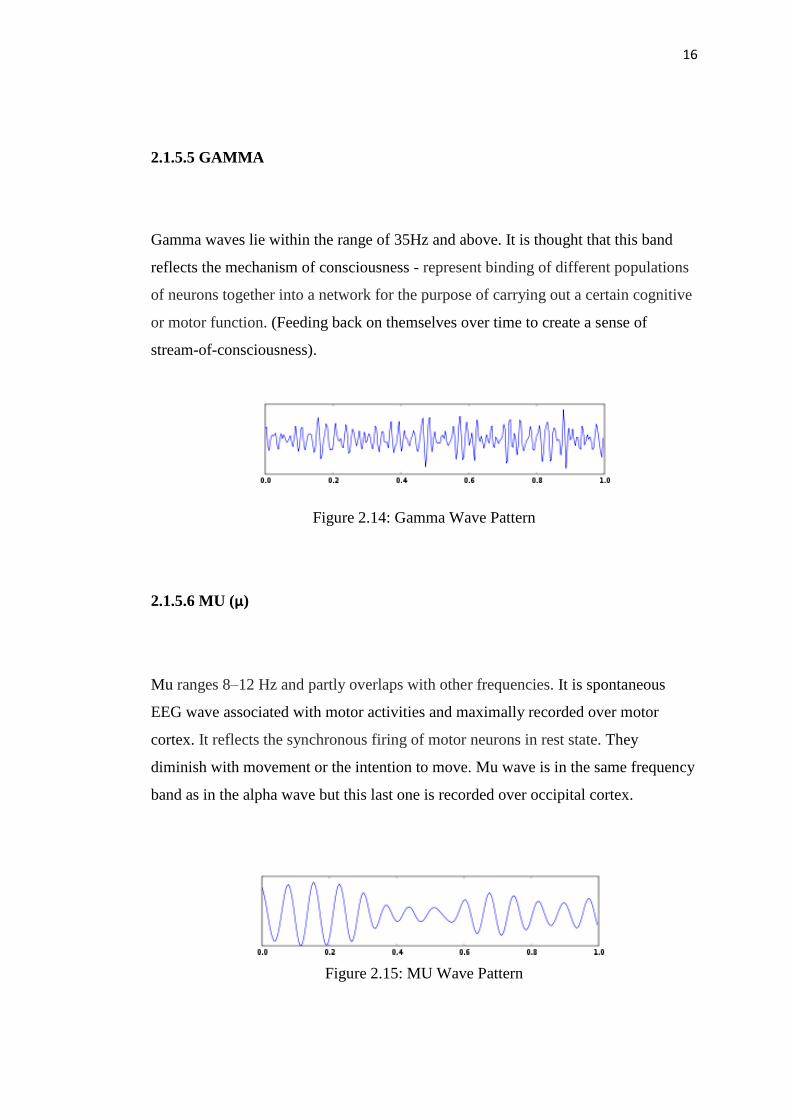
2.1.5.4 BETA
The rate of change lies between 13 and 30 Hz, and usually has a low voltage
between 5-30μV. Beta activity is closely linked to motor behavior and is generally
attenuated during active movements like active thinking, active attention, and focus
on the outside world or solving concrete problems. It can reach frequencies near 50
Hz during intense mental activity. Rhythmic beta with a dominant set of frequencies
is associated with various pathologies and drug effects, especially benzodiazepines.
It may be absent or reduced in areas of cortical damage. It is the dominant rhythm in
patients who are alert or anxious or who have their eyes open.
Figure 2.12: Beta Wave Pattern
Figure 2.13: Beta wave in Time Domain and Frequency Domain
16
2.1.5.5 GAMMA
Gamma waves lie within the range of 35Hz and above. It is thought that this band
reflects the mechanism of consciousness - represent binding of different populations
of neurons together into a network for the purpose of carrying out a certain cognitive
or motor function. (Feeding back on themselves over time to create a sense of
stream-of-consciousness).
Figure 2.14: Gamma Wave Pattern
2.1.5.6 MU (µ)
Mu ranges 8–12 Hz and partly overlaps with other frequencies. It is spontaneous
EEG wave associated with motor activities and maximally recorded over motor
cortex. It reflects the synchronous firing of motor neurons in rest state. They
diminish with movement or the intention to move. Mu wave is in the same frequency
band as in the alpha wave but this last one is recorded over occipital cortex.
Figure 2.15: MU Wave Pattern

17
Figure 2.16: Mu wave in Time Domain and Frequency Domain
Most attempt to control a computer with continuous EEG measurements
work by monitoring Alpha or Mu waves, because people can learn to change the
amplitude of these two waves by making the appropriate mental effort. A person
might accomplish this result, for instance, by recalling some strongly stimulating
image or by raising his or her level of attention [13]. The normal EEG varies by age.
The neonatal EEG is quite different from the adult EEG. The EEG in childhood
generally has slower frequency oscillations than the adult EEG.
2.1.6 NeuroSky eSense Meter
ESense Attention meter indicates the intensity of a user's level of mental focus or
concentration while eSense Meditation meter indicates the level of a user's mental
calmness or relaxation. Note that Meditation is a measure of a person's mental levels,
not physical levels, so simply relaxing all the muscles of the body may not
immediately result in a heightened Meditation level. However, for most people in
most normal circumstances, relaxing the body often helps the mind to relax as well.
Meditation is related to reduce activity by the active mental processes in the brain,
and it has long been an observed effect that closing one's eyes turns off the mental
activities which process images from the eyes, so closing the eyes is often an
effective method for increasing the Meditation meter level. Distractions, wandering
thoughts, anxiety, agitation, and sensory stimuli may lower the Attention and
Meditation meter levels.
18
A relative eSense scale is 1 to 100. On this scale, a value between 40 to 60 at
any given moment in time is considered “neutral”, and is similar in notion to
“baselines” that are established in conventional EEG measurement techniques
(though the method for determining a ThinkGear baseline is proprietary and may
differ from conventional EEG). A value from 60 to 80 is considered “slightly
elevated”, and may be interpreted as levels being possibly higher than normal (levels
of Attention or Meditation that may be higher than normal for a given person).
Values from 80 to 100 are considered “elevated”, meaning they are strongly
indicative of heightened levels of that eSense.
Similarly, on the other end of the scale, a value between 20 to 40 indicates
“reduced” levels of the eSense, while a value between 1 to 20 indicates “strongly
lowered” levels of the eSense. These levels may indicate states of distraction,
agitation, or abnormality, according to the opposite of each eSense. An eSense meter
value of 0 is a special value indicating the ThinkGear is unable to calculate an eSense
level with a reasonable amount of reliability. This may be (and usually is) due to
excessive noise as described in the POOR_SIGNAL Quality section above.
The reason for the somewhat wide ranges for each interpretation is that some
parts of the eSense algorithm are dynamically learning, and at times employ some
“slow-adaptive” algorithms to adjust to natural fluctuations and trends of each user,
accounting for and compensating for the fact that EEG in the human brain is subject
to normal ranges of variance and fluctuation. This is part of the reason why
ThinkGear sensors are able to operate on a wide range of individuals under an
extremely wide range of personal and environmental conditions while still giving
good accuracy and reliability. Developers are encouraged to further interpret and
adapt these guideline ranges to be fine-tuned for their application (as one example,
an application could disregard values below 60 and only react to values between 60-
100, interpreting them as the onset of heightened attention levels).

19
2.1.7 EEG Signal Classification Tools
MATLAB software provides tools to acquire, analyze, and visualize data, enable to
gain insight into the data in a fraction of the time using spreadsheets or traditional
programming languages. The data from hardware devices, such as computer's serial
port or sound card, as well as stream live can be acquire and measure directly into
MATLAB for analysis and visualization by using MATLAB with add-on products
such as Neurosky Mindwave. This software also can communicate with instruments
such as oscilloscopes, function generators, and signal analyzers.
Furthermore, MATLAB enable to manage, filter, and pre-process data.
MATLAB provides functions for filtering and smoothing, interpolation, convolution,
and fast Fourier transforms (FFTs). It also can perform exploratory data analysis to
uncover trends, test assumptions, and build descriptive models such as using Neural
Network.
2.2 Previous Works
This previous works are discussed about the paper that related to this project in term
of their devices, tools for data analyzing and technique used.
2.2.1 Brain Computer Interface (BCI)
Brain Computer Interface (BCI) systems are broadly classified into invasive and non-
invasive techniques. Theoretically, the invasive BCI need the surgical performance
to implant the electrode to grey matter of brain and it will result by produce the
highest quality signals of BCI device.
20
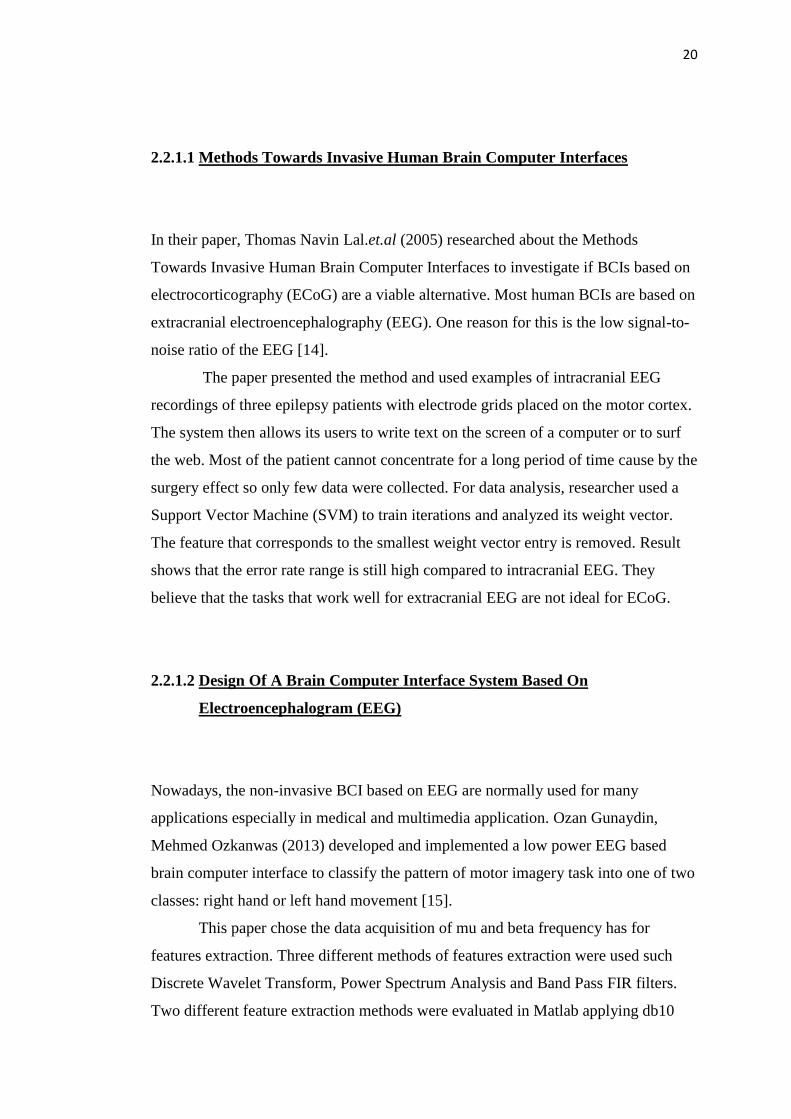
2.2.1.1 Methods Towards Invasive Human Brain Computer Interfaces
In their paper, Thomas Navin Lal.et.al (2005) researched about the Methods
Towards Invasive Human Brain Computer Interfaces to investigate if BCIs based on
electrocorticography (ECoG) are a viable alternative. Most human BCIs are based on
extracranial electroencephalography (EEG). One reason for this is the low signal-to-
noise ratio of the EEG [14].
The paper presented the method and used examples of intracranial EEG
recordings of three epilepsy patients with electrode grids placed on the motor cortex.
The system then allows its users to write text on the screen of a computer or to surf
the web. Most of the patient cannot concentrate for a long period of time cause by the
surgery effect so only few data were collected. For data analysis, researcher used a
Support Vector Machine (SVM) to train iterations and analyzed its weight vector.
The feature that corresponds to the smallest weight vector entry is removed. Result
shows that the error rate range is still high compared to intracranial EEG. They
believe that the tasks that work well for extracranial EEG are not ideal for ECoG.
2.2.1.2 Design Of A Brain Computer Interface System Based On
Electroencephalogram (EEG)
Nowadays, the non-invasive BCI based on EEG are normally used for many
applications especially in medical and multimedia application. Ozan Gunaydin,
Mehmed Ozkanwas (2013) developed and implemented a low power EEG based
brain computer interface to classify the pattern of motor imagery task into one of two
classes: right hand or left hand movement [15].
This paper chose the data acquisition of mu and beta frequency has for
features extraction. Three different methods of features extraction were used such
Discrete Wavelet Transform, Power Spectrum Analysis and Band Pass FIR filters.
Two different feature extraction methods were evaluated in Matlab applying db10
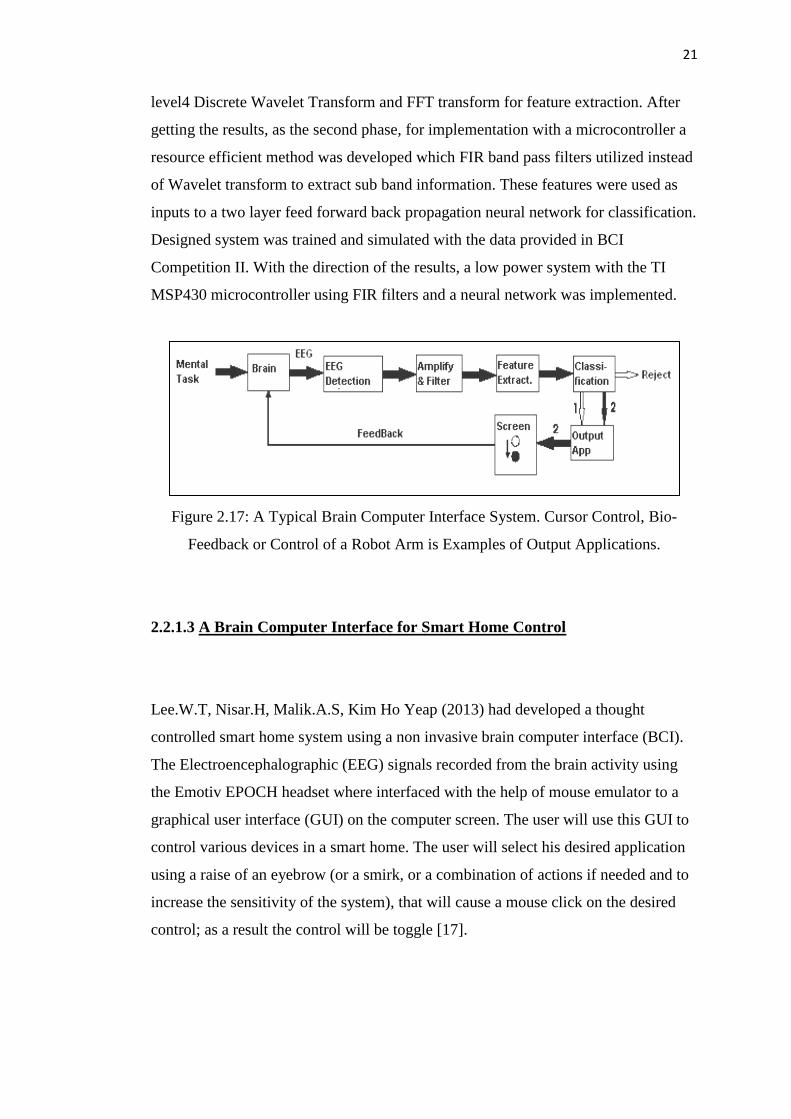
21
level4 Discrete Wavelet Transform and FFT transform for feature extraction. After
getting the results, as the second phase, for implementation with a microcontroller a
resource efficient method was developed which FIR band pass filters utilized instead
of Wavelet transform to extract sub band information. These features were used as
inputs to a two layer feed forward back propagation neural network for classification.
Designed system was trained and simulated with the data provided in BCI
Competition II. With the direction of the results, a low power system with the TI
MSP430 microcontroller using FIR filters and a neural network was implemented.
Figure 2.17: A Typical Brain Computer Interface System. Cursor Control, Bio-
Feedback or Control of a Robot Arm is Examples of Output Applications.
2.2.1.3 A Brain Computer Interface for Smart Home Control
Lee.W.T, Nisar.H, Malik.A.S, Kim Ho Yeap (2013) had developed a thought
controlled smart home system using a non invasive brain computer interface (BCI).
The Electroencephalographic (EEG) signals recorded from the brain activity using
the Emotiv EPOCH headset where interfaced with the help of mouse emulator to a
graphical user interface (GUI) on the computer screen. The user will use this GUI to
control various devices in a smart home. The user will select his desired application
using a raise of an eyebrow (or a smirk, or a combination of actions if needed and to
increase the sensitivity of the system), that will cause a mouse click on the desired
control; as a result the control will be toggle [17].
22
2.2.2 Features Extraction and Classification Method
The raw data signals that captured from the brain were in time domain. Time domain
analysis is mainly based on the voltage – time plot or current – time plot. In time
domain analysis, the variable is always measured against time. In order to extract the
features which are separated by bands of frequency, the method for conversion of
time domain into frequency domain should be applied. The features then will train
and test to get the signal classification.
2.2.2.1 A Brain Computer Interface Based on FFT and Multilayer Neural
Network - Feature Extraction and Generalization
Kenji Nakayama, Yasuaki Kaneda and Akihiro Hirano (2007) [19] had been
worked on BCI feature extraction and generalization by FFT and multilayer Neural
Network. In this paper, a multilayer neural network is applied to BCI, which is one
of hopeful interface technologies between humans and machines. Amplitude of the
FFT of the brain waves is used for the input data. Several techniques have been
introduced for pre-processing the brain waves. They include segmentation along the
time axis for fast response, nonlinear normalization to emphasize important
information, averaging samples of the brain waves to suppress noise effects and
reduction in the number of the samples to realize a small size network.
This paper used a multilayer neural network having a single hidden layer. In
the testing phase, the maximum output becomes the winner and the corresponding
mental task is assigned. However, when the winner has small value, estimation
becomes incorrect. Therefore, the answer of the neural network is rejected, that is
any mental task cannot be estimated. The error back-propagation algorithm is
employed for adjusting the connection weights. Two kinds of generalization
techniques, including adding small random noises to the input data and decaying
23
connection weight magnitude, are applied. The simulation was carried out and the
accuracy was improved.
2.2.2.2 Investigating Advantages And Disadvantages Of The Analysis Of A
Geometrical Surface Structure With The Use Of Fourier And Wavelet
Transform
Stanisław Adamczak, Włodzimierz Makieła and Krzysztof Stępień (2010) [20]
investigated about the advantages and disadvantages between Fast Fourier Transform
and Wavelet Transform. This paper discussed that The Fourier transform is
extremely useful when analyzing periodic signals. Therefore it is a very useful tool
for evaluation of roundness or cylindricity profiles. It usually allows obtaining
accurate information on the analyzed surface. Wavelet transform does not provide
such accurate information. However, because it is well localized in the time and
frequency domains it can detect irregularities of the profile such as cracks or
scratches of the surfaces. Wavelet transform is also a very convenient tool for
demonising the measuring signal.
2.2.2.3 EEG Signal Processing For Controlling a Robotic Arm
Howida A.Shedeed, Mohamed F.Issa and Salah M.El-Sayed (2013) had utilized the
technique of Wavelet Transform (WT), Fast Fourier Transform (FFT) and Principal
Component Analysis (PCA) to extract features for the project of Brain EEG Signal
Processing for Controlling a Robotic Arm. EEG signals associated with 3 arm
movements (close, open arm and close hand) [18]. Classification rates of 91.1%, 86.7%
and 85.6% were achieved with the three used features extraction techniques
respectively. Multi-layer Perceptron Neural Network trained by a standard back
propagation algorithm was used for classifying the three considered tasks.
24
2.2.2.4 EEG Signal Classification using Principal Component Analysis with
Neural Network in Brain Computer Interface Applications
Classification method should be applied to the set of extracted features to acquire a
final model of analysis. Kottaimalai R, Pallikonda Rajasekaran M, Selvam V and
Kannapiran B (2013)[21] presented an Artificial Neural Network (ANN) which is a
functional pattern classification technique, trained all the way through the error Back
Propagation algorithm.
In this paper, in order to classify the mental tasks, the brain signals are trained
using neural network and also using Principal Component Analysis (PCA) with
Artificial Neural Network. PCA is use to eliminate the redundant data in the dataset
while Neural Network (NN) use as data trainer. During the classification of the
mental tasks using Neural Network classifier, the data is misclassified at the output
where the percentage of correct classification is low. Similarly during the
classification of the mental tasks using Principal Component Analysis with Neural
Network classifier, the data is perfectly classified at the output. The percentage of
correct classification is good because of the reduction of the redundant variables in
the dataset. Finally it is observed that the correctly classified percentage of data is
better in Principal Component Analysis with Neural Network compared to Neural
Network alone.

REFFERENCES
1. Shepherd Center and KPK Interactive (2014), Understanding Spinal Cord
Injury,Peactree Road NW, Atlanta: Shepherd Center.
2. Marcin Ko Odziej, Andrzej Majkowski, Remigiusz J. Rak (2010), A New
Method Of Feature Extraction From EEG Signal For Brain Computer
Interface Design, Warsaw University of Technology, Przegl D
Elektrotechniczny (Electrical Review), ISSN 0033-2097, R. 86 NR 9/2010
3. World Health Organization (2013), Spinal Cord Injury, Geneva: World Health
Organization
4. Laerd Statistics (2013), Hypothesis Testing, UK: Lunch Research Ltd.
5. Ed Grabianowski (2007), How Brain-computer Interfaces Work, How Stuff
Works 6. J. Vidal (1977). Real-Time Detection of Brain Events in EEG. IEEE
Proceedings 65 (5): 633–641doi:10.1109/PROC.1977.10542.
7. Daniel J. Szafir (2009), Non-Invasive BCI through EEG an Exploration of the
Utilization of Electroencephalography to Create Thought-Based Brain-
Computer Interfaces, Computer Science Department Boston College: Senior
Honors Thesis
8. José del R. Millán, Pierre W. Ferrez, Anna Buttfield (2009), Non Invasive
Brain-Machine Interfaces, IDIAP Research Institute
9. Ozan Gunaydin, Mehmed Ozkan. Design Of A Brain Computer Interface
System Based On Electroencephalogram(EEG). Proceedings Of The 4th
European Dsp In Education And Research Conference.
10. Mahnaz Arvaneh, Cuntai Guan, Kai Keng Ang, Chai Quek (2011), Optimizing
The Channel Selection And Classification Accuracy In EEG-Based BCI, IEEE
Transactions On Biomedical Engineering, Vol. 58, No. 6, pp.1865
97
11. Md. Ibrahim Arafat, Brain Computer Interface: Past, Present & Future, Dept.
of Computer Science & Engineering, International Islamic University
Chittagong (IIUC) Chittagong, Bangladesh .
12. Jorge Baztarrica Ochoa, Gary Garcia Molina (2002), EEG Signal
Classification for Brain Computer Interface Applications, March 28th, 2002
13. Eller, Evan (2007). NeuroSky ThinkGear Mind-Controlled Toys With
Sega. gamrFeed.com. Retrieved 2010-08-31.14
14. Thomas Navin Lal, Thilo Hinterberger,, Guido Widman, Michael Schroder,
Jeremy Hill, Wolfgang Rosenstiel, Christian E. Elger, Bernhard Scholkopf, and
Niels Birbaumer (2005), Methods Towards Invasive Human Brain Computer
Interfaces.
15. Ozan Gunaydin, Mehmed Ozkan, Design of a Brain Computer Interface
System Based On Electroencephalogram (EEG), Proceedings of the 4th
European DSP in Education and Research Conference Institute of Biomedical
Engineering, Bogazici University Kandilli Kampus, Istanbul, Turkey,
16. Rithun. Raj Krishna, Manoj. Katta Venkata, Ajithesh. Gupta B V, Tatikonda.
Uday Dutt (2013), Thought Controlled Wheelchair Using EEG Acquisition
Device, presented at the 3rd International Conference on Advancements in
Electronics and Power Engineering (ICAEPE'2013), Kuala Lumpur
(Malaysia), 8-9 January, 2013.
17. Wei Tuck Lee, Humaira Nisar, Aamir S. Malik, Kim Ho Yeap (2013), A Brain
Computer Interface for Smart Home Control, IEEE 17th International
Symposium on Consumer Electronics (ISCE), Universiti Tunku Abdul
Rahman, University Technology PETRONAS, Perak, Malaysia
18. Howaida A.Shedeed, Mohamed F.Issa, Salah M.El-sayed (2013), Brain EEG
Signal Processing For Controlling a Robotic Arm, 8th International
Conference on Computer Engineering & Systems (ICCES), 11566, 978-1-
4799-0080-0/13©2013 IEEE, Faculty of Computer and Information Scientific
Computing Dep Ain Shams University Cairo, EGYPT
19. Kenji Nakayama, Yasuaki Kaneda, Akihiro Hirano(2007) A Brain Computer
Interface Based on FFT and Multilayer Neural Network - Feature Extraction
and Generalization, Proceedings of 2007 International Symposium on
Intelligent Signal Processing and Communication Systems Nov.28-Dec.1, 2007
98
Xiamen, China, Graduate School of Natural Science and Technology,
Kanazawa Univ.
20. Stanisław Adamczak, Włodzimierz Makieła, Krzysztof Stępień (2010)
Investigating Advantages And Disadvantages Of The Analysis Of A
Geometrical Surface Structure With The Use Of Fourier And Wavelet
Transform, Kielce University of Technology, Faculty of Mechatronics and
Machinery Design, Metrology and Measurement Systems. Volume 17, Issue 2,
Pages 233–244, ISSN (Print) 0860-8229, DOI: 10.2478/v10178-010-0020-
x, November 2010
21. Kottaimalai R, Pallikonda Rajasekaran M, Selvam V, Kannapiran B (2013),
EEG Signal Classification using Principal Component Analysis with Neural
Network in Brain Computer Interface Applications, Kalasalingam University
Srivilliputtur, India presented at 2013 IEEE International Conference on
Emerging Trends in Computing, Communication and Nanotechnology
(ICECCN 2013)
22. Md. Abu Baker Siddique Akhanda, Shaon Md. Arkanul Islam and Md.
Mostafizur Rahman (2013), Detection of Cognitive State for Brain-Computer
Interfaces, International Conference on Electrical Information and
Communication Technology (EICT), Department of Electronics &
Communication Engineering Khulna University of Engineering & Technology,
Khulna-9203, Bangladesh, 2013
23. Min-Feng Lee, Guey-Shya Chen, Backpropagation Neural Network Model For
Detecting Artificial Emotion With Color, Graduate Institute of Educational
Measurement and Statistics National Taichung University of Education
Taichung, Taiwan
24. Erik Andreas Larsen (2011), Classification of EEG Signals in a Brain-
Computer Interface System, Norwegian University of Science and Technology
Department of Computer and Information Science, June 2011
25. Guoqiang Peter Zhang (2000), Neural Networks for Classification: A Survey,
IEEE Transactions On Systems, Man, And Cybernetics—Part C: Applications
And Reviews, Vol. 30, No. 4, November 2000, J. Mack Robinson College Of
Business, Georgia State University
99
26. P. Geethanjali, Y. Krishna Mohan and Jinisha Sen (2012), Time domain
Feature extraction and classification of EEG data for Brain Computer
Interface, 2012 9th International Conference on Fuzzy Systems and
Knowledge Discovery (FSKD 2012), School of Electrical Engineering VIT
University Vellore, Tamil Nadu, India,
27. Abdul Bary Raouf Suleiman, Toka Abdul Hameed Fatehi, Features Extraction
Techniqes Of EEG Signal For BCI Applications, Computer And Information
Engineering Department, College of Electronics Engineering University of
Mosul.
28. Marcin Kołodziej, Andrzej Majkowski, Remigiusz J. Rak, Matlab
FE_Toolbox - an universal utility for feature extraction of EEG signals for BCI
realization, Warsaw University of Technology
29. Irene McClay (1983), Electric Wheelchair Propulsion Using a Hand Control
in C4 Quadriplegia: A Case Report, PHYS THER. 1983; 63:221-223.
30. M. Kamrunnahar, N. S. Dias, and S. J. Schiff (2009), Optimization of
Electrode Channels in Brain Computer Interfaces, Conf Proc IEEE Eng Med
Biol Soc. 2009; 2009: 6477–6480, Center for Neural Engineering, Dept. of
Engineering Science and Mechanics, The Pennsylvania State University,
31. Qibin Zhao and Liqing Zhang, Temporal and Spatial Features of Single-Trial
EEG for Brain-Computer Interface, Hindawi Publishing Corporation
Computational Intelligence and Neuroscience Volume 2007, Article ID 37695,
14 pages doi:10.1155/2007/37695 Department of Computer Science and
Engineering, Shanghai Jiao Tong University,
32. Stefan W¨orner, Fast Fourier Transform, Numerical Analysis Seminar, Swiss
Federal Institute of Technology Zurich
33. Xiao Guixian, Yan Wei, Achieve Single-Channel BCI: The Choice Of
Electrode Position And Signal Characteristics, Huangshi Institute of
Technology, Huangshi, China
35. Benjamin C. Wedro, MD, FAAEM, Melissa Conrad Stöppler, MD (2014),
Spinal Cord Injury: C4 Is a Crucial Level, MedicineNet.Inc
36. Apparalyzed.Co.(2012),Spinal Cord Injury Levels - Functionality of C4 Spinal
Cord Injury, London: Apparalyzed.com
100
37. Yunyong Punsawad, and Yodchanan Wongsawat,(2013). A study Hybrid
SSVEP-Motion Visual Stimulus based BCI System for Intelligent
Wheelchair.35th Annual International Conference of the IEEE EMBS Osaka,
Japan
38. Brice Rebsamen, Cuntai Guan,Haihong Zhang Chuanchu Wang, Cheeleong
Teo, Marcelo H. Ang, Jr.,and Etienne Burdet (2010) . A study A Brain
Controlled Wheelchair to Navigation Familiar Environments, IEEE
Transactions On Neural Systems And Rehabilitation Engineering, Vol 18,No6.
39. Hashimoto, M. ; Fac. of Sci. & Eng., Doshisha Univ., Kyotanabe, Japan;
Takahashi, K. ; Shimada, M.(2009), Wheelchair Control Using An EOG- And
EMG-Based Gesture Interface, Conference on Advanced Intelligent
Mechatronics, 2009. AIM 2009. IEEE/ASME International