EEG-EMG features extraction for brain computer interface
27
HAL Id: hal-01063815 https://hal.inria.fr/hal-01063815 Submitted on 13 Sep 2014 HAL is a multi-disciplinary open access archive for the deposit and dissemination of sci- entific research documents, whether they are pub- lished or not. The documents may come from teaching and research institutions in France or abroad, or from public or private research centers. L’archive ouverte pluridisciplinaire HAL, est destinée au dépôt et à la diffusion de documents scientifiques de niveau recherche, publiés ou non, émanant des établissements d’enseignement et de recherche français ou étrangers, des laboratoires publics ou privés. EEG-EMG features extraction for brain computer interface Rahima Sidi Boulenouar, Mitsuhiro Hayashibe, Anirban Dutta To cite this version: Rahima Sidi Boulenouar, Mitsuhiro Hayashibe, Anirban Dutta. EEG-EMG features extraction for brain computer interface. [Research Report] Université de Montpellier 2. 2014. hal-01063815
Transcript of EEG-EMG features extraction for brain computer interface
HAL Id: hal-01063815https://hal.inria.fr/hal-01063815
Submitted on 13 Sep 2014
HAL is a multi-disciplinary open accessarchive for the deposit and dissemination of sci-entific research documents, whether they are pub-lished or not. The documents may come fromteaching and research institutions in France orabroad, or from public or private research centers.
L’archive ouverte pluridisciplinaire HAL, estdestinée au dépôt et à la diffusion de documentsscientifiques de niveau recherche, publiés ou non,émanant des établissements d’enseignement et derecherche français ou étrangers, des laboratoirespublics ou privés.
EEG-EMG features extraction for brain computerinterface
Rahima Sidi Boulenouar, Mitsuhiro Hayashibe, Anirban Dutta
To cite this version:Rahima Sidi Boulenouar, Mitsuhiro Hayashibe, Anirban Dutta. EEG-EMG features extraction forbrain computer interface. [Research Report] Université de Montpellier 2. 2014. �hal-01063815�
Under the responsibility of
M. Anirban DUTTA & M. Mitsuhiro HAYASHIBE
In team :
Université Montpellier 2
Master 2 – STIC et Santé, Spécialité Technologie pour la Santé
EEG-EMG FEATURES EXTRACTION
FOR BRAIN COMPUTER INTERFACE Report of project
BY Rahima SIDI BOULENOUAR
28/02/2014
Master 2 technologie pour la santé Rahima SIDIBOULENOUAR 2014
Page | 2
Contents
Abstract ..........................................................................................................................................................................4
DEambulation et Mouvement ARtificiel (DEMAR) team ..................................................................................4
Introduction ...................................................................................................................................................................5
General context .......................................................................................................................................................5
Motivation .................................................................................................................................................................5
Objective of project ................................................................................................................................................6
Management of project ..........................................................................................................................................6
Chapter1: Brain Computer Interface system ........................................................................................................7
1) Description of BCI .........................................................................................................................................7
2) Neurophysiologic concepts..........................................................................................................................8
a. Brain ..............................................................................................................................................................8
b. Motor cortex ..............................................................................................................................................8
3) Operation of BCI ............................................................................................................................................9
a. Measuring brain activity (Technical noninvasive) ...............................................................................9
b. Features extraction ................................................................................................................................ 10
c. Classification ............................................................................................................................................ 11
d. The electrophysiological signals .......................................................................................................... 11
e. Classification of types of physiological signals .................................................................................. 13
f. Applications .............................................................................................................................................. 13
Chapter 2: Methods of features extraction and classification for BCI ......................................................... 15
1) Introduction .................................................................................................................................................. 15
2) Temporal methods ...................................................................................................................................... 15
Among the methods for extracting temporal characteristics, we can name: ........................................ 15
a. Hjorth parameters .................................................................................................................................. 15
b. Autoregressive parameters .................................................................................................................. 15
3) Frequency methods..................................................................................................................................... 15
a. The power spectral density (PSD) ...................................................................................................... 16
b. Bandpower ............................................................................................................................................... 16
4) Classification ................................................................................................................................................. 16
a. The descriminant linear ......................................................................................................................... 16
5) Current issues and problems of BCI choosing appropriate methods ............................................ 16
Chapter 3: Experimental protocol and environment work ............................................................................ 18
Master 2 technologie pour la santé Rahima SIDIBOULENOUAR 2014
Page | 3
1) Acquisition system ...................................................................................................................................... 18
2) Description of the experience ................................................................................................................. 18
3) Process ........................................................................................................................................................... 18
a. Environment working: EEGlab .................................................................................................................. 19
a. Protocol followed for the extraction ..................................................................................................... 20
b. Protocol followed for the classification ................................................................................................. 20
4) Extraction results ........................................................................................................................................ 21
a. For EEG data ................................................................................................................................................ 21
Results of classification with LDA .................................................................................................................... 22
b. For EEG data ................................................................................................................................................ 24
c. For EEG+EMG data .................................................................................................................................... 25
5) Discussion ..................................................................................................................................................... 25
Conclusion and perspective .................................................................................................................................... 26
Master 2 technologie pour la santé Rahima SIDIBOULENOUAR 2014
Page | 4
Abstract
The brain-computer interface (BCI) is a communication system and direct control. It
relies solely on the cerebral activity of a person and an electrical or mechanical system
without muscular response. In our project, we contribute to the optimization of certain
steps and particularly the features extraction of the electroencephalogram (EEG) and the
classification of mental tasks in BCI.
The BCI is based on the measurement and analysis of signals get crops on the scalp of an
individual using surface electrodes, it operates asynchronously since the voluntary
production of cerebral activity. In indeed, this activity recorded represents the motor cortex
changes during motor activity at the completion of the movement or when the subject
imagines a movement.
From the methodological point of view, we proposed a technique for extracting
characteristics for EEG signals. This method will allow us put in evidence the power in the
sensorimotor rhythms when the subject imagines a movement. In addition, the same method
will apply for electromyogram (EMG) for more precision.
Finally, we implement with MATLAB a model that allows Online translate all of these
methods to decode the mental state of the subject.
Key words: Brain -Machine Interface, EEG processing, feature extraction, classification signal.
DEambulation et Mouvement ARtificiel (DEMAR) team
DEMAR is a team that is interested in several aspects of functional electrical stimulation
(FES): modeling, control, synthesis and motion analysis, patient interface, pacemakers implanted sensors. This project is hosted at LIRMM, it is common with the CNRS, University
of Montpellier 2 and 1.
My project manager within the team is M.Anirban DUTTA, talented young researcher
who is already over 9 years of experience in:
Health care encompassing research and clinical work in neurorehabilitation.
Neural engineering for electrical neuromodulation to alleviate movement disorders.
Design control phases to medical device development.
Regulatory processes in USA, Europe, and India for conducting clinical studies on
medical device
Figure 1: Batiment Galera Montpellier

Introduction
General context
For generations, man studied and imagined the ability to communication between the
machines and thought. these studies has fed the imagination of mankind under the ancient
form of ancient myths and more modern stories of science fiction but now all this has
become a reality with systems Brain Computer Interface (BCI).
This approach has become possible through the use of a set of technologies and
mathematical approaches describing some physical processes that occur in the brain that
correspond to specific mental tasks. This idea is old, since 1960, researchers [1] introduced the term cyborg 1 in scientific
work, and the idea is to control an electronic system by means of cerebral activity. It is then
in 1973 researcher Vidal [2] tests the first real experimentation on humans .This helped to
control an electronic system via the cerebral activity measured by Electroencephalography
(EEG).
BCI is a system of communication and control based solely on the cerebral activity
without muscle action between a person and a machine. Scientific research in this field has
developed so spectacular and several key applications including assistance to persons
partially or completely paralyzed the field of robotics and manipulating multimedia games
while moving in a virtual reality environment.
In recent years, researchers worldwide have developed such interface to give back to
people who suffer from severe disabilities autonomy in active life.
Motivation
Medicine and more precisely the area of disability is one of the major applications of BCI
since many patients are concerned. It affects more than 150000 people in France and is the
leading cause of paralysis.
In some cases, there are patients who possess cognitive faculties but who are no longer
able to communicate or move due to such a stroke.
Stroke occurs when part of the brain is suddenly deprived of blood. There are ischemic
stroke and hemorrhagic stroke.
Ischemic stroke :
In 80 % of cases, strokes are ischemic stroke: the interruption of blood flow is caused
by a clot (coagulated blood) that blocks an artery to the brain.
Hemorrhagic stroke : They are uncommon. It cause by stopping the flow of blood is due to the rupture of
an artery in the brain.
Help these patients overcome their deficiencies is the major motivation for this project
in the field of BCI. The work presented in this manuscript is under BCI design. We focus
more precisely to the study of the various stages that make up the cycle of BCI by focusing
on the field of EEG signal processing, extraction of various features and classification
methods.
Although BCI is nowadays a field of research in full expansion given the number of
achievements and research done in the literature, this area still presents limitations and
difficulties due to the complexity of the analysis of cerebral activity.
Master 2 technologie pour la santé Rahima SIDIBOULENOUAR 2014
Page | 6
Objective of project
This project aims to extract the characteristics of EEG-EMG physiological signals of people with stroke. The goal is to use these features to create the man-machine interfaces (BCI) that allows
detecting the intent to move in a severely paralyzed people and to communicate with computers only thanks to their brain activity to perform tasks.
Indeed, the EEG signals recorded on the surface of the scalp result from the superposition of the
electric activities of several neurons and therefore their treatment is very complex. To improve the
quality of the EEG signal, we will use several technical approaches. At first, it is necessary to pretreat
the signal namely the elimination of artifacts and improvement of signal to noise ratio. Then we
propose an extraction approach features vectors.
In our research, we focus more specifically to extract the signal power in the frequency bands of
sensorimotor rhythms made by the subject that will be merged with the features vectors of a
electromyogramm (EMG).
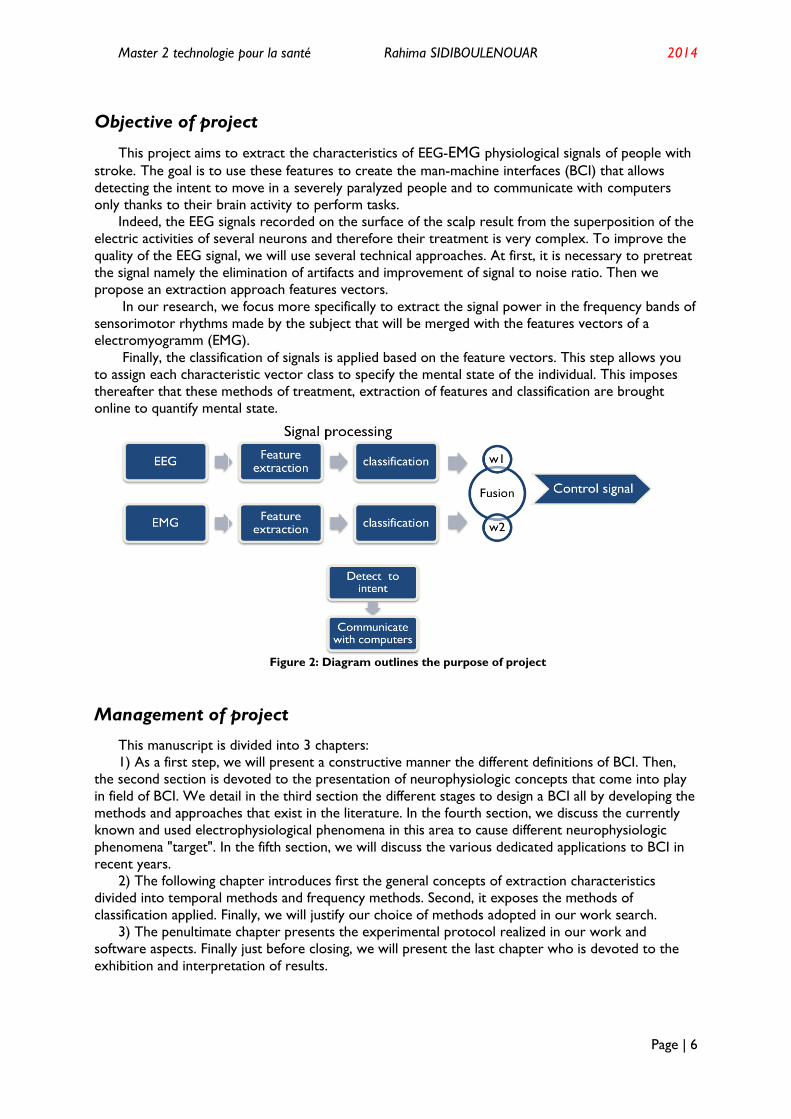
Finally, the classification of signals is applied based on the feature vectors. This step allows you
to assign each characteristic vector class to specify the mental state of the individual. This imposes
thereafter that these methods of treatment, extraction of features and classification are brought
online to quantify mental state.
Figure 2: Diagram outlines the purpose of project
Management of project
This manuscript is divided into 3 chapters:
1) As a first step, we will present a constructive manner the different definitions of BCI. Then,
the second section is devoted to the presentation of neurophysiologic concepts that come into play
in field of BCI. We detail in the third section the different stages to design a BCI all by developing the
methods and approaches that exist in the literature. In the fourth section, we discuss the currently
known and used electrophysiological phenomena in this area to cause different neurophysiologic
phenomena "target". In the fifth section, we will discuss the various dedicated applications to BCI in
recent years.
2) The following chapter introduces first the general concepts of extraction characteristics
divided into temporal methods and frequency methods. Second, it exposes the methods of
classification applied. Finally, we will justify our choice of methods adopted in our work search.
3) The penultimate chapter presents the experimental protocol realized in our work and
software aspects. Finally just before closing, we will present the last chapter who is devoted to the
exhibition and interpretation of results.
Master 2 technologie pour la santé Rahima SIDIBOULENOUAR 2014
Page | 7
Chapter1: Brain Computer Interface system
1) Description of BCI
Ever since Hans Berger demonstrated the electroencephalography technique for the first time in
1929, it has been one of the basic tools doctors and scientists have used to investigate how the brain
works. There has also been speculation about the possibility of using electroencephalograms (EEGs)
to decode people’s intentions, such that people could use their brain activity to control devices
directly.
A BCI is a communication system in which messages or commands that an individual sends to the
external world do not pass through the brain’s normal output pathways of peripheral nerves and
muscles. Like any communication or control system, a BCI has input (e.g. electrophysiological activity
from the user), output (i.e. device commands), components that translate input into output, and a
protocol that determines the onset, offset, and timing of operation.
In the BCIs discussed here, the input is EEG recorded from the scalp or the surface of the brain
or neuronal activity recorded within the brain. BCI systems can be classed as endogenous or
exogenous depending on the nature of the input signal:
Endogenous BCI systems depend on the user’s ability to control their
electrophysiological activity, such as the EEG amplitude in a specific frequency band on a
specific area of the cerebral cortex
Exogenous BCI systems depend on the electrophysical activity evoked by external stimuli
and do not require intensive training
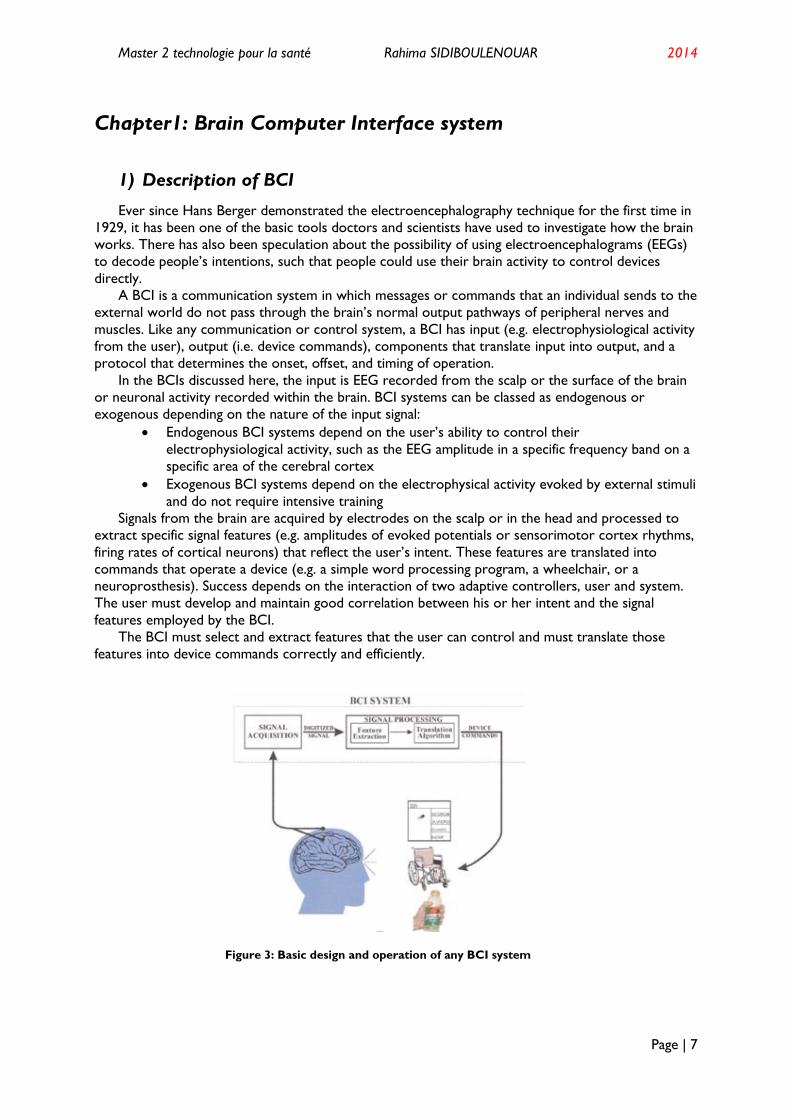
Signals from the brain are acquired by electrodes on the scalp or in the head and processed to
extract specific signal features (e.g. amplitudes of evoked potentials or sensorimotor cortex rhythms,
firing rates of cortical neurons) that reflect the user’s intent. These features are translated into
commands that operate a device (e.g. a simple word processing program, a wheelchair, or a
neuroprosthesis). Success depends on the interaction of two adaptive controllers, user and system.
The user must develop and maintain good correlation between his or her intent and the signal
features employed by the BCI.
The BCI must select and extract features that the user can control and must translate those
features into device commands correctly and efficiently.
Figure 3: Basic design and operation of any BCI system
Master 2 technologie pour la santé Rahima SIDIBOULENOUAR 2014
Page | 8
2) Neurophysiologic concepts
a. Brain
The brain is the general area of the central nervous system. It consists several billion cells to
transmit and receive messages different parts of the body. These cells are called neurons.
Whole brain outer layer is constituted by a thin layer of tissue called nervous cerebral cortex.
The brain is divided into two halves relatively called symmetrical hemispheres (left and right ) that
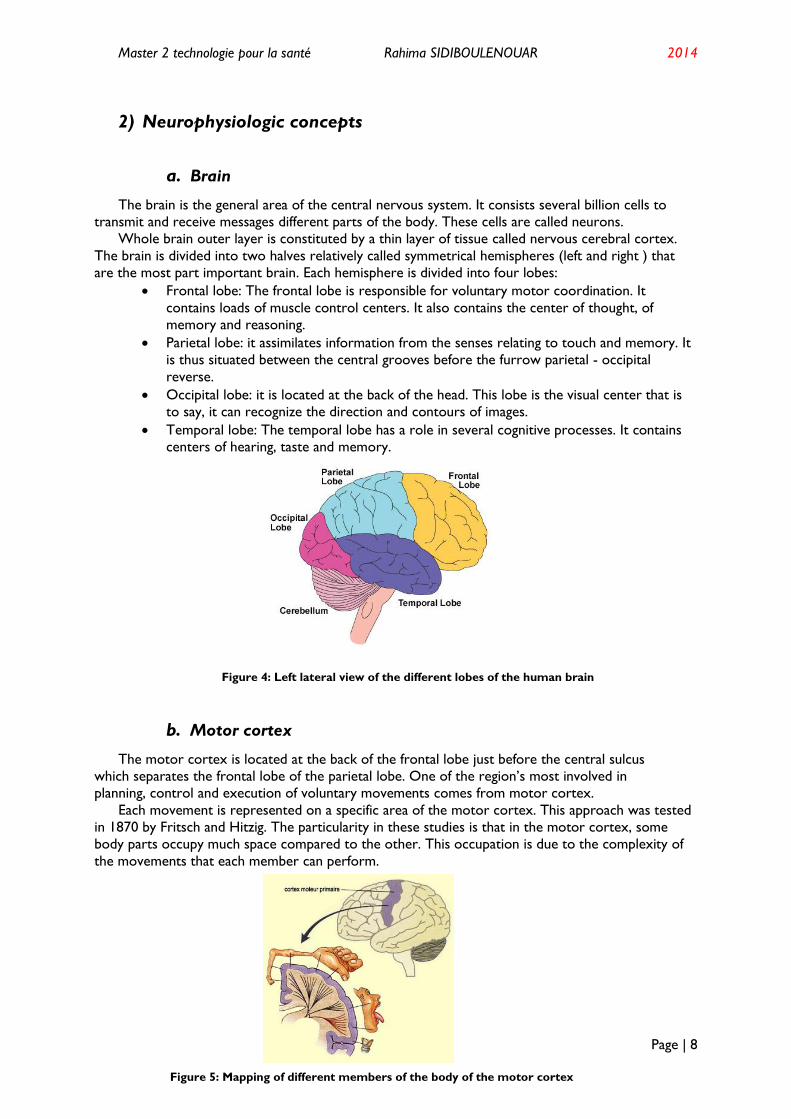
are the most part important brain. Each hemisphere is divided into four lobes:
Frontal lobe: The frontal lobe is responsible for voluntary motor coordination. It
contains loads of muscle control centers. It also contains the center of thought, of
memory and reasoning.
Parietal lobe: it assimilates information from the senses relating to touch and memory. It
is thus situated between the central grooves before the furrow parietal - occipital
reverse.
Occipital lobe: it is located at the back of the head. This lobe is the visual center that is
to say, it can recognize the direction and contours of images.
Temporal lobe: The temporal lobe has a role in several cognitive processes. It contains
centers of hearing, taste and memory.
Figure 4: Left lateral view of the different lobes of the human brain
b. Motor cortex
The motor cortex is located at the back of the frontal lobe just before the central sulcus
which separates the frontal lobe of the parietal lobe. One of the region’s most involved in
planning, control and execution of voluntary movements comes from motor cortex.
Each movement is represented on a specific area of the motor cortex. This approach was tested
in 1870 by Fritsch and Hitzig. The particularity in these studies is that in the motor cortex, some
body parts occupy much space compared to the other. This occupation is due to the complexity of
the movements that each member can perform.
Figure 5: Mapping of different members of the body of the motor cortex
Master 2 technologie pour la santé Rahima SIDIBOULENOUAR 2014
Page | 9
3) Operation of BCI
The operation of BCI boils down to a system in closed loop consists of six main and
essential steps. Each step has been owned by a well field and requires specific assembly of
several basic concepts to work.
In our research work, the cerebral activity that we study corresponds to a set of
physiological characteristics when a subject imagines or makes a voluntary movement.
The operation of such a system is based on a device for measuring the activity
cerebral when the individual performs a motor imagery following a stimulus.
Once the signals are amplified and recorded, treatment is then carried out: first, a
pretreatment to improve the quality of the signal, then a extraction of features to keep the
most relevant information in the signal which corresponds to the imaging engine for
assigning a classification then each class mental state. Finally, when the mental state is
identified, the system may then be the result of a command to control a machine or send a
visual or audible feedback (feedback) for the subject leads to monitor and improve its
cerebral activity.
a. Measuring brain activity (Technical noninvasive)
Before starting with present how to measure cerebral activity, we will firstly present the
origin of this activity and how it is formed in the brain of the human being.
Neurons are the elementary functional units of nervous tissue. Their excitable membrane
that is to say it can cause a nerve impulse or action potential, created by ionic displacements.
Neurons while maintaining a potential difference of the order of 50 to 80 mV between the
middle intra-and extra -cellular due to a difference in ionic concentration through active
mechanisms .It is also possible to record an image of the activity of nerve cells thanks to the
spread of electric or magnetic fields induced at the surface of the scalp . Surface so we can
collect the spontaneous activity of brain or activities mentioned by stimulation or a
particular task.
In the field of BCI, we will look at several criteria for the measurement of cerebral activity
The measurement technique: this is the way to save the cerebral activity invasive /
non- invasive or direct / indirect.
Spatial resolution: the ability of the system to discriminate between two or more spatially close mental tasks.
The temporal resolution: the frequency of the temporal coverage of system
acquisition. This criterion is very important in the field of BCI.
In the remainder of this section, we will present the latest techniques in BCI
to measure cerebral activity according to the criterion of registration (invasive, non-
invasive) (see annex 1), although our work using only EEG signals.
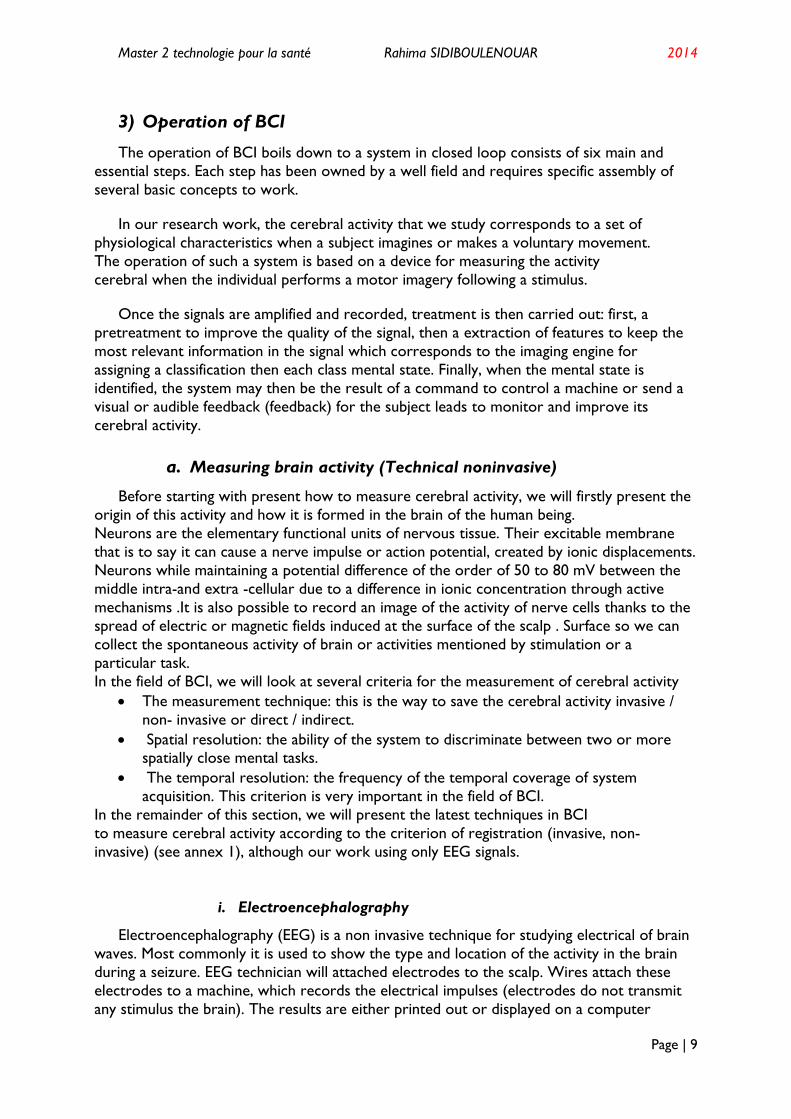
i. Electroencephalography
Electroencephalography (EEG) is a non invasive technique for studying electrical of brain
waves. Most commonly it is used to show the type and location of the activity in the brain
during a seizure. EEG technician will attached electrodes to the scalp. Wires attach these
electrodes to a machine, which records the electrical impulses (electrodes do not transmit
any stimulus the brain). The results are either printed out or displayed on a computer
Master 2 technologie pour la santé Rahima SIDIBOULENOUAR 2014
Page | 10
screen. It also is used to evaluate people who are having problems associated with brain
function include coma, tumors, stroke…When the EEG is finished, the results are
interpreted by a specialist in the nervous system ( neurologist). Each area produces a
different brain wave strip for the neurologist to interpret.
This method presents both advantages and disadvantages, we can mention:
Its high temporal resolution: rapid electrical phenomena or relatively high frequency.
Easy set up and noninvasive: possibility to study the activity of valid and invalid subjects without any surgical intervention several environments.
Reduced cost: cost of EEG relatively reduced compared to other techniques
existing measure of cerebral activity.
However, the EEG is limited in its spatial resolution and its range of frequency. The EEG
signal consists of different frequency bands defined by their wave to characterize and identify
psychological states Neuroscience:
b. Features extraction
Extraction of features is a fundamental step in the process of a BCI, prior to the
classification. The analysis of this type of signals is very complicated due to the nature of the signal and very important in the reasoning scientific design which leads to the BCI system.
Below, we present the features and properties of EEG signal will be extracted in
this phase.
i. Properties of the EEG signal
The cerebral activity is considered as a dynamic stochastic process, and this is due to
biological and technical factors. Regarding factors biological, the cerebral activity changes due
to fatigue and the subject's attention, has the disease progression and of training process.
Figure 6: Brain waves of EEG signal
Master 2 technologie pour la santé Rahima SIDIBOULENOUAR 2014
Page | 11
Technical factors are generally related to the noise produced by the amplifier, the ambient
noise, and the variation of the impedance of the electrodes. We must not also forget that
the temporal variation generated by the series of time EEG signal must be taken into account
during the extraction of features. For this, we used a very well known for extracting timing
information approach: ‘extraction of features in several segments over time and concatenate
into a single characteristic vector’.
c. Classification
We arrive at the stage of classification that defines how to from the characteristics,
already selected in the previous step, recognizing the mental state of a patient. In the last
two decades, the field of machine learning is become one of the most fecund scientific fields.
The purpose of this stage in the cycle of a BCI is to classify or assign a class has a
characteristic vector constructed previously.
d. The electrophysiological signals
Nowadays, the BCI systems on electro physiological signals are classes in two main
groups: endogenous and exogenous system.
For exogenous system we have for example:
i. Evoked potential P300
The P300 is an evoked potential produced by the nervous system and more precisely
in the parietal cortex in response to visual stimulation is (or hearing) is has a set of frequent
stimuli. This potential corresponds to an increase potential 300 ms after the presentation of
a rare and surprising stimulus.
Thanks to this response, researchers have created a BCI with which the subject can
communicate by choosing letters on a screen. (Five letters by minute)
ii. Steady state visually evoked potentials (SSVP)
Another neurological phenomenon called steady state visual evoked potential (SSVEP) is utilized in exogenous BCI system. It is an electrical potential-difference, which can be derived
from the scalp after a visual stimulus. They are called “steady state” VEPs because the
individual responses overlap and result a quasi-sinusoid oscillation with the same frequency
as the stimulus. The goal is to detect this frequency reliably with high accuracy and
furthermore to detect when the frequency is not present, thus when the person does not
look at the stimulus.
The most common application in which this signal is used is the control of robots.
Limitations of exegenous system are:
- We need feedback - In practise, it is not faisable
For these reasons, in our project we will focus on the following category
For endogenous system we have :
Master 2 technologie pour la santé Rahima SIDIBOULENOUAR 2014
Page | 12
iii. Slow cortical potential (SCP)
Slow cortical potentials are defined as the positive or negative polarizations of the
electroencephalogram (EEG) that last from 300ms to several seconds with magnitudes up to
50 µV. They originate in depolarizations of the apical dendritic tree in the upper cortical
layers that are caused by synchrounous firing, mainly from thalamocortical afferents.
SCP amplitudes are regulated within tight limits by a negative feedback-loop consisting of
a cortical-basal ganglia threshold regulation system that maintains cortical activation within
acceptable medium limits (Birbaumer et al. 1990).
Functionally, they constitute a threshold regulation mechanism for local excitatory
mobilization (negative slow potentials) or inhibition (positive slow potentials) of cortical
networks. Thus, in humans, a reliable methodology to induce stable SCP recordings in both
directions, positive and negative, consists of extensive training of self-regulation and
voluntary control of SCPs (Birbaumer et al. 1990; Birbaumer 1999).
Surface-negative slow cortical potentials (SCPs) originating in the apical dendritic layers
of the neocortex reflect synchronized depolarization of large groups of neuronal assemblies.
They are recorded during states of behavioral or cognitive preparation and during
motivational states of apprehension and fear. Surface positive SCPs are thought to indicate
reduction of cortical excitation of the underlying neural networks and appear during
behavioural inhibition and motivational inertia[3].
Negative SCPs are typically associated with movement and other functions that imply
cortex activity. It has been demonstrated that people are able to learn to control these
potentials.
Humans can learn to voluntary regulate these potentials after operant training using
immediate feedback and positive reinforcement for self generated slow potentials shifts.
Combined recordings from the cortical surface and from single cortical cells at different
depths and from different cortical layers (Caspers 1974; Rebert 1973; Requin et al. 1984;
Stamm et al. 1975; Mitzdorf 1985).
The learned self regulation of slow cortical potentials is based on a redistribution of
attentional resources and depends critically on a prefrontal and thalamic attention system.
Finally, a thought translation device uses the slow potential self regulation skill in totally
paralysed locked in patients for communication with a language shaping computer system.
After learned self regulation of negative slow cortical potentials, motor cognitive
performance of various tasks improves, depending upon the specific cortical location of the
learned response. Individuals can learn to voluntarily control SCPs through feedback and
operant learning procedures.
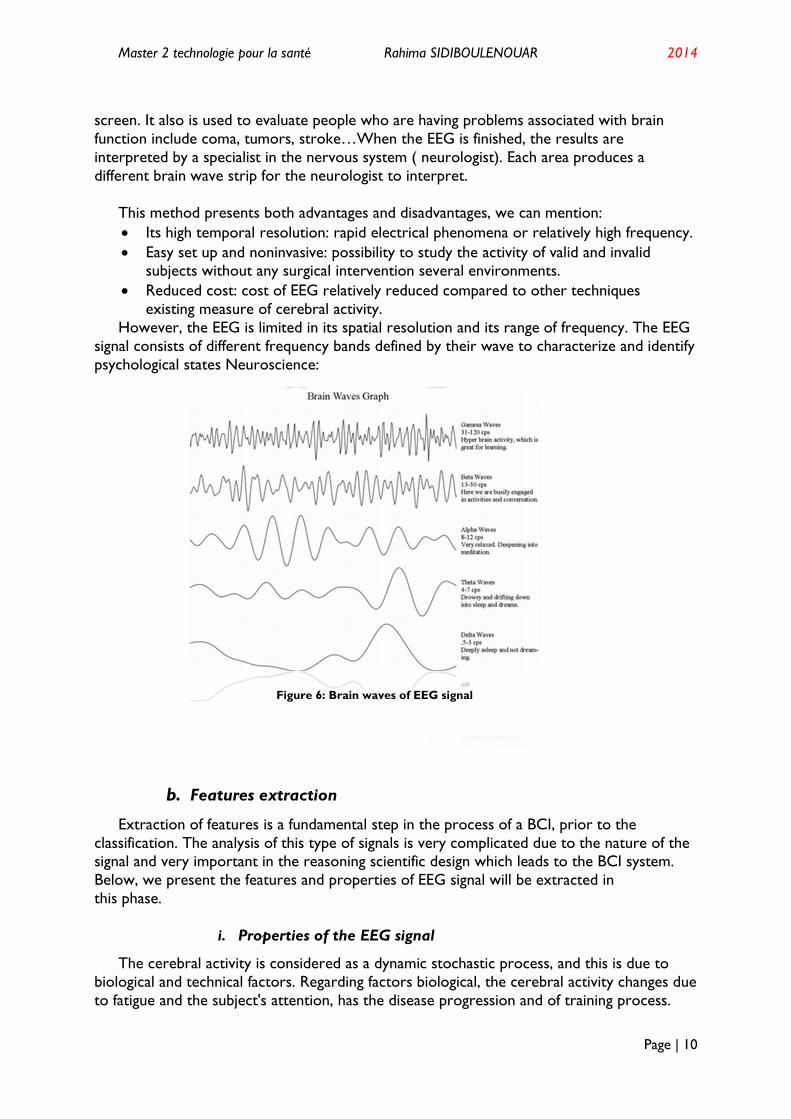
iv. Even related resynchronization (ERD)/ synchronization (ERS)
The ERD/ERS are different responses of neuronal structures in the brain. It is not phase-
locked to the event. The ERD/ERS is reaction time of movement come after slow cortical
potential and it is characterize by highly frequency band-specific, whereby either the same or
different locations on the scalp can display ERD and ERS simultaneously. Quantification of
ERD/ERS in time and space is demonstrated on data from a number of movement
experiments.
Figure 7: spectrogram of EEG signal with ERD and ERS
Master 2 technologie pour la santé Rahima SIDIBOULENOUAR 2014
Page | 13
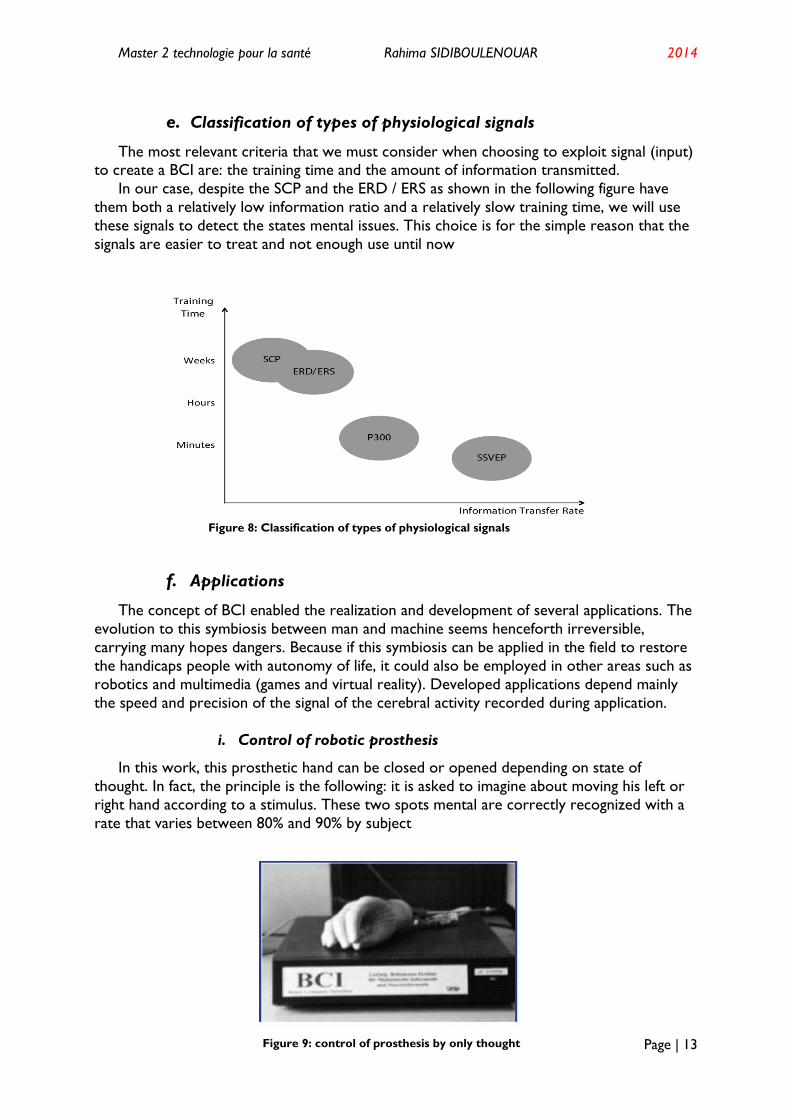
e. Classification of types of physiological signals
The most relevant criteria that we must consider when choosing to exploit signal (input) to create a BCI are: the training time and the amount of information transmitted.
In our case, despite the SCP and the ERD / ERS as shown in the following figure have
them both a relatively low information ratio and a relatively slow training time, we will use
these signals to detect the states mental issues. This choice is for the simple reason that the
signals are easier to treat and not enough use until now
f. Applications
The concept of BCI enabled the realization and development of several applications. The
evolution to this symbiosis between man and machine seems henceforth irreversible,
carrying many hopes dangers. Because if this symbiosis can be applied in the field to restore
the handicaps people with autonomy of life, it could also be employed in other areas such as
robotics and multimedia (games and virtual reality). Developed applications depend mainly
the speed and precision of the signal of the cerebral activity recorded during application.
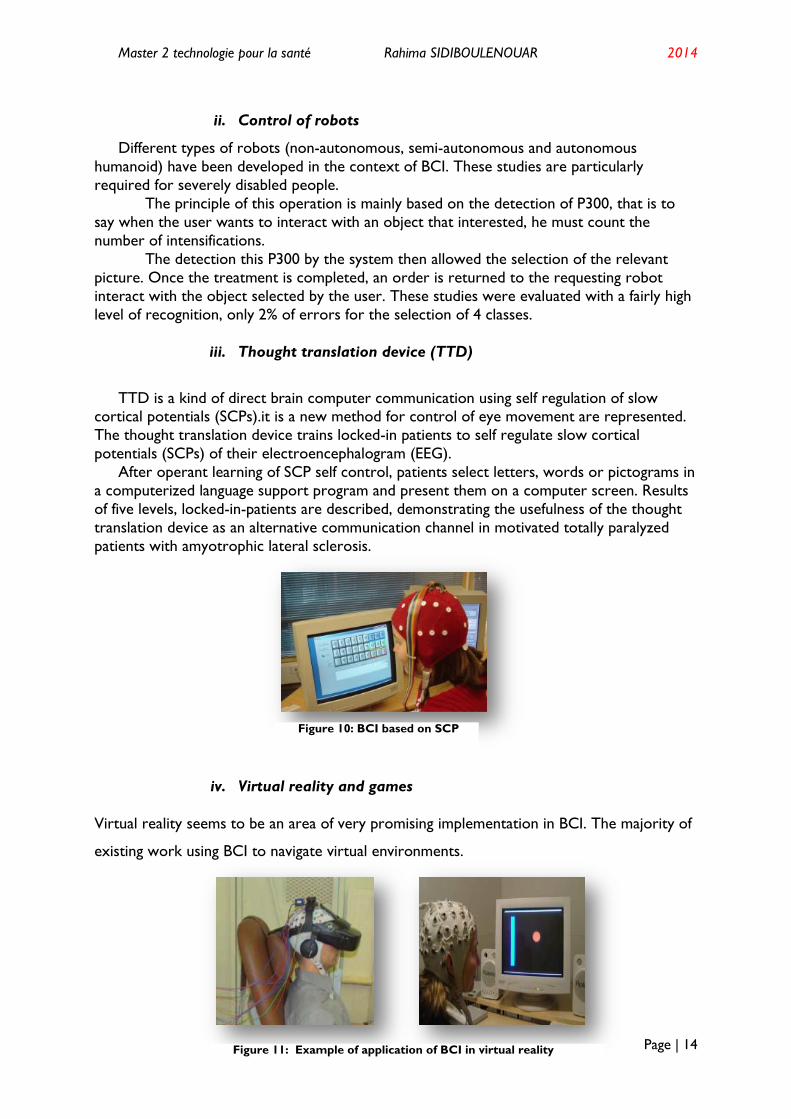
i. Control of robotic prosthesis
In this work, this prosthetic hand can be closed or opened depending on state of
thought. In fact, the principle is the following: it is asked to imagine about moving his left or
right hand according to a stimulus. These two spots mental are correctly recognized with a
rate that varies between 80% and 90% by subject
Figure 9: control of prosthesis by only thought
Figure 8: Classification of types of physiological signals
Master 2 technologie pour la santé Rahima SIDIBOULENOUAR 2014
Page | 14
ii. Control of robots
Different types of robots (non-autonomous, semi-autonomous and autonomous
humanoid) have been developed in the context of BCI. These studies are particularly
required for severely disabled people.
The principle of this operation is mainly based on the detection of P300, that is to
say when the user wants to interact with an object that interested, he must count the
number of intensifications.
The detection this P300 by the system then allowed the selection of the relevant
picture. Once the treatment is completed, an order is returned to the requesting robot
interact with the object selected by the user. These studies were evaluated with a fairly high
level of recognition, only 2% of errors for the selection of 4 classes.
iii. Thought translation device (TTD)
TTD is a kind of direct brain computer communication using self regulation of slow cortical potentials (SCPs).it is a new method for control of eye movement are represented.
The thought translation device trains locked-in patients to self regulate slow cortical
potentials (SCPs) of their electroencephalogram (EEG).
After operant learning of SCP self control, patients select letters, words or pictograms in
a computerized language support program and present them on a computer screen. Results
of five levels, locked-in-patients are described, demonstrating the usefulness of the thought
translation device as an alternative communication channel in motivated totally paralyzed
patients with amyotrophic lateral sclerosis.
iv. Virtual reality and games
Virtual reality seems to be an area of very promising implementation in BCI. The majority of
existing work using BCI to navigate virtual environments.
Figure 10: BCI based on SCP
Figure 11: Example of application of BCI in virtual reality
Master 2 technologie pour la santé Rahima SIDIBOULENOUAR 2014
Page | 15
Chapter 2: Methods of features extraction and classification for
BCI
1) Introduction
Extraction of features is a fundamental step in the process BCI, prior to the classification.
The analysis of this type of signals is very complicated due to the nature of the signal and
very important in the reasoning science that leads to design the system ICM. Below, we
present the characteristics and properties of the EEG signal that will be taken in
this phase and the different temporal methods and frequency methods.
2) Temporal methods
Among the methods for extracting temporal characteristics, we can name:
a. Hjorth parameters
In 1970, Hjorth has proposed a method to characterize measures EEG, it is possible to
calculate three parameters namely the activity, mobility and complexity. Conscripts Hjorth
parameters are calculated from the dispersion EEG signal and its first and second derivation. They characterize the temporal dynamics of
the signal. - Activity: This parameter represents the variance of the EEG signal or measurement the average power of the EEG signal X (X variance (var (x)). - Mobility: This parameter represents the average frequency of a signal. - Complexity: This parameter is considered as a measure of variability signal.
With the method of Hjorth, we get three values for each sample describing the EEG
signal.The main advantages of the method of Hjorth there are only three values represent
the EEG each time step and it is done without the description of frequencies domain conventional. But there is a lack of clarity, if the input signal has more of a peak in the power
spectrum. This problem can be suppressed if EEG was filtered using a bandpass before being
transmitted to the algorithm.
b. Autoregressive parameters
The determination of the autoregressive parameters (AR) is used to analyze EEG signals
in the time domain. The data are therefore divided into several small segments or AR
parameters are estimated. These parameters quantities are then time-domain signal that
assume current is a linear combination of its previous values.
The method of parameters adaptive AR (ARA) is evolves weights combination time. The
principle of this method is to divide the data into small segments and estimate from each
segment the parameters (AR).
The result is then represented by the parameters in AR a given period. These describe
the characteristics that vary over time
3) Frequency methods

Master 2 technologie pour la santé Rahima SIDIBOULENOUAR 2014
Page | 16
In the frequency domain, the EEG signal is represented as a function of the statistical
distribution of its frequency and its amplitude
a. The power spectral density (PSD)
The power spectral density (PSD) is one of the most used in the extraction of characteristics
of BCI methods. She represented by the distribution of power on the axis of frequencies.
The characteristics are defined as the square modulus of the Fourier transform, divided by
the integration time T or the calculation of the Fourier transform the auto correlation
function.
b. Bandpower
One of the best known frequency methods in the BCI for the extraction the
characteristics is the method of "bandpower" (BP). This method is based on the variability of
certain rhythms obtained. The method of BP is first of all a filter (bandpass) signal in the
frequency band already studied then squaring the signal filter. Finally, a sum the values
obtained by a sliding window. The frequency bands vary from one topic to another is for this reason that the method of BP is always preceded by a study offline for study the variability
of these frequencies. The characteristics computed by the method of BP have been used
successfully in the field of BCIs.
4) Classification
a. The descriminant linear
Linear Discriminant Analysis (LDA) initiated analysis by Fisher (1936) assumes the
knowledge of the distribution in classes individuals of a population. It seeks the linear
combinations of variables describing individuals which lead to the better discrimination
between these classes. In other words, this method returns a fit a linear discriminant
function in the space of data has a Gaussian probabilistic model in order to determine the
most likely class.
5) Current issues and problems of BCI choosing appropriate methods
As we have seen in previous sections, many methods and approaches have been applied in the design of BCI. But it appears nevertheless that the BCI are quite far from being robust
to their development is possible in everyday life.
Many people are directly or indirectly affect a disease the brain. Moreover, these serious
neurodegenerative diseases become soon one of the first causes of mortality in the world.
Unfortunately, the use of such a system as BCI intended for people with of these
diseases remains extremely limited. However, we could put the developed a system of
acquisition much more efficient that captures brain activity on each area of the brain while
maintaining resolution very accurate time and design a BCI reading each of our thoughts
without delay?
The answer to this question remains nevertheless a bit difficult because the use
BCI is a so far has faced several constraints.
The signal to noise ratio of EEG signals is usually small and difficult to interpret correctly.
In addition, the design of a BCI several key areas such as the various signal processing,
Master 2 technologie pour la santé Rahima SIDIBOULENOUAR 2014
Page | 17
neurophysiology and machine learning. For many master a system must collect the
knowledge of several experts and experts in each field. Nothing is less certain, the study of
the brain and its functioning we are still relatively not very clear, more precisely signal
analysis that the product faces several challenges: e.g. succeed in translating exactly motor
imagery produced by the subject. Furthermore, it is difficult for a subject realizes stable
mental stain over time.
This study is done by choosing the best features extraction and classification methods to
better reflect the neurophysiologic phenomenon in low-level control.
Master 2 technologie pour la santé Rahima SIDIBOULENOUAR 2014
Page | 18
Chapter 3: Experimental protocol and environment work
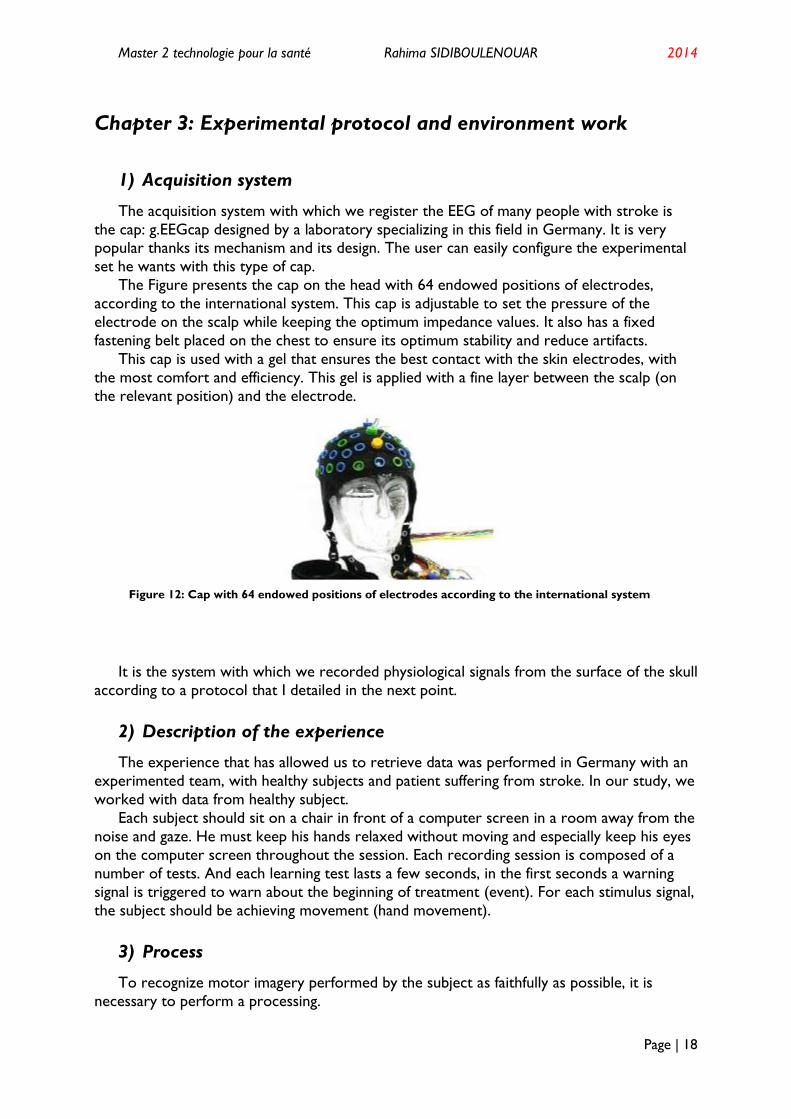
1) Acquisition system
The acquisition system with which we register the EEG of many people with stroke is
the cap: g.EEGcap designed by a laboratory specializing in this field in Germany. It is very popular thanks its mechanism and its design. The user can easily configure the experimental
set he wants with this type of cap.
The Figure presents the cap on the head with 64 endowed positions of electrodes,
according to the international system. This cap is adjustable to set the pressure of the
electrode on the scalp while keeping the optimum impedance values. It also has a fixed
fastening belt placed on the chest to ensure its optimum stability and reduce artifacts.
This cap is used with a gel that ensures the best contact with the skin electrodes, with
the most comfort and efficiency. This gel is applied with a fine layer between the scalp (on
the relevant position) and the electrode.
It is the system with which we recorded physiological signals from the surface of the skull
according to a protocol that I detailed in the next point.
2) Description of the experience
The experience that has allowed us to retrieve data was performed in Germany with an
experimented team, with healthy subjects and patient suffering from stroke. In our study, we
worked with data from healthy subject.
Each subject should sit on a chair in front of a computer screen in a room away from the
noise and gaze. He must keep his hands relaxed without moving and especially keep his eyes
on the computer screen throughout the session. Each recording session is composed of a
number of tests. And each learning test lasts a few seconds, in the first seconds a warning
signal is triggered to warn about the beginning of treatment (event). For each stimulus signal,
the subject should be achieving movement (hand movement).
3) Process
To recognize motor imagery performed by the subject as faithfully as possible, it is
necessary to perform a processing.
Figure 12: Cap with 64 endowed positions of electrodes according to the international system
Master 2 technologie pour la santé Rahima SIDIBOULENOUAR 2014
Page | 19
As a first step, we will make a pretreatment with EEGLAB software that will allow us to
reduce the noise
In the next step we begin to study for each subject appropriate frequency bands of the
EEG. Once the bands are known, then we'll go to the feature extraction and classification.
The autoregressive method is a method for extracting features which allowed us to
reconstruct a database (matrix) with the most relevant information related to motor
imagery made based on the frequency bands that occurred before and after event.
The new database will be rebuilt later classified by the LDA method for assigning each
class a mental task; finally, we calculate the rate of recognition found.
The last step is to apply the same methods of extraction and classification with a matrix
that combines the most EMG + EEG data, then we find optimal vector. The recognition rate
will be found and will be compared with that of comparing the EEG.
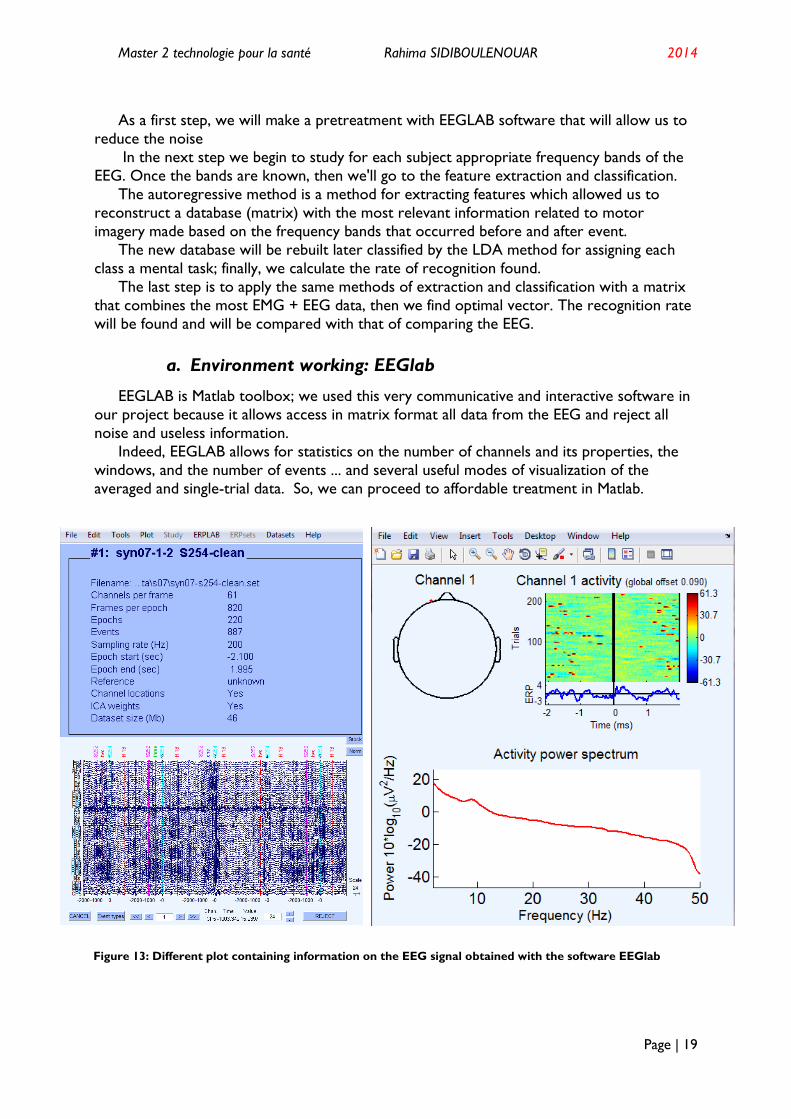
a. Environment working: EEGlab
EEGLAB is Matlab toolbox; we used this very communicative and interactive software in
our project because it allows access in matrix format all data from the EEG and reject all
noise and useless information.
Indeed, EEGLAB allows for statistics on the number of channels and its properties, the
windows, and the number of events ... and several useful modes of visualization of the
averaged and single-trial data. So, we can proceed to affordable treatment in Matlab.
Figure 13: Different plot containing information on the EEG signal obtained with the software EEGlab

Master 2 technologie pour la santé Rahima SIDIBOULENOUAR 2014
Page | 20
Information about data obtained with EEGLAB:
Data is :syn07-1-2 S254 clean
Frames per epoch 820
DATA(61*820*220)
Epochs : 220
Event : 202
F=200hz
We work with channel 16
a. Protocol followed for the extraction
We will interest in detail in the autoregressive extraction discussed in Chapter 2 method
and we will translate later into a Matlab code.
The autoregressive model (AR) describes the stationary EEG signal with few coefficients.
The values of these properties describe the temporal variation of the signal.
The parameters (AR) estimated on several small segments of the EEG signal are
magnitudes of the time domain while assuming that the current signal is a linear combination
of its previous values .
The representation of a measured value has a precise time is represented by the
weighted sum of all the values of the past and a random component represented as follows:
X (t) represents the signal at time t, Ai, i = 1,.. , p the parameters (AR) using generally as
features in the field of BCI
This model is not adaptive , we must determine the degree of the polynomial before
creating.
Summarized the steps for extraction is:
Begin
1. Calculate the two states matrix (false: matrix before event, true matrix after the event
which is the slow cortical potential)
2. Find the appropriate degree of polynomial to be the coefficients of autoregressive model
3. Calculate the average of the coefficients of all epochs to obtain the optimal coefficients
4. Plot the autoregressive model
end.
b. Protocol followed for the classification
We will interest in detail a method of classification LDA discussed in Chapter 2, and we
will translate later into a Matlab code.
Linear discriminant analysis assumes the knowledge of the distribution in classes of
individuals in a population. It seeks the linear combinations of variables describing individuals
that lead to the best discrimination between classes. In other words, this method returns a
fit a linear discriminant function in the space of data has a Gaussian probabilistic model in
order to determine the most likely class.
The idea of LDA is to find the orthogonal vector wT so that the projection two groups (
clusters) C1 and C2 features vectors {x1, x2, ..., xn1 } and {x1, x2, ..., Xn} w are well separated by hyperplanes , while keeping a low variance for each group.

Master 2 technologie pour la santé Rahima SIDIBOULENOUAR 2014
Page | 21
In its simplest formulation, LDA assumes a normal distribution data identical with
conditional covariance matrices. Consequently, the hyperplane is obtained by seeking the
projection that maximizes both the mean and minimizes the variance between the two
classes, provided that the samples are well separated.
These distances are measured using matrices dispersion (scatter matrix) inter and intra
groups.
With the matrix Sb is inter-class variance:
And Sw is the matrix of intra-class variance:
mc1, mc2 represent the mean vectors of each cluster c1 and c2 classes. The optimal
weight vector w is the vector of eigenvalue corresponding to the largest eigenvalue. Once
this vector is obtained from the set of learning data xi, then the classification can be
established by projecting the vectors corresponding to the characteristic data of tests.
Summarized the steps for classification is:
Begin
1. Calculate the mean vectors of instances in each class.
2. Calculate the dispersion matrices of each class Sq 3. Calculate the variance
4. Calculate the line of best management
5. Calculate for each class projected vectors in a reduced space
6. Calculate centers projected instances in each class
end
4) Results of extraction with autoregressive method
a. For EEG data
Plot of channel 16:
0 20 40 60 80 100 120 140 160 180 200-60
-40
-20
0
20
40
60
0 100 200 300 400 500 600 700 800 900-20
-15
-10
-5
0
5
10
15
20
Figure15: Plot of channel 16 with one epoch Figure 15: Plot of channel 16 with all epochs Figure 14: Plot of channel 16 with one epoch

Master 2 technologie pour la santé Rahima SIDIBOULENOUAR 2014
Page | 22
Figure 14 and 15 shows the signals obtained by Channel 16, we recall that the choice of
channel and linked to signal that we want to explore in this case slow cortical potential. This
signal represents the variation of the electrical activity at all along the acquisition time.
In Figure 14 shows a single channel with a single window (epoch).
In Figure 15, the signal is the result of windowing the complete signal (the signal is
divided into 220 epoch lasting 820 s each).
Windowing this is thanks to EEGLAB and we will subsequently treated first by part and
then a generalization.
Plot the average of signal before and after event:
In figure 16 and 17 are shown the signals before and after the event calculated from the average
of all the epochs (event = 202ms).
Figure 16 represents the average of all the epoch of [202.786 ms], we thus obtain a matrix 1 *
586, which describes the state or the patient begins to plan the movement.
Figure 17 represents the average of all the epoch of [1.202 ms], we thus obtain a matrix 1 * 586,
which describes the state or the patient is at rest.
Thanks to the process we obtained two matrices states that serve as input to the BCI.
Plot of polynomial degree and autoregressive model
0 50 100 150 200 250-4
-3
-2
-1
0
1
2
3
0 100 200 300 400 500 600-3
-2
-1
0
1
2
3
4
Figure 17: Plot of channel 16 before event (202ms) Figure 16: Plot of channel after event (202ms)
1 2 3 4 5 6 7 8 9 100
0.5
1
1.5
2
2.5
3
3.5
4
Polynomial degree
Err
or
square
s (
J)
0 100 200 300 400 500 600-20
-15
-10
-5
0
5
10
15
20
Sample time
Sig
nal valu
e
Original signal
Signal estimate
Figure 19: Degree polynomial as a function of the error Figure 18: plot of model autoregressive VS original
signal (channel 16 and 1 epoch)
Master 2 technologie pour la santé Rahima SIDIBOULENOUAR 2014
Page | 23
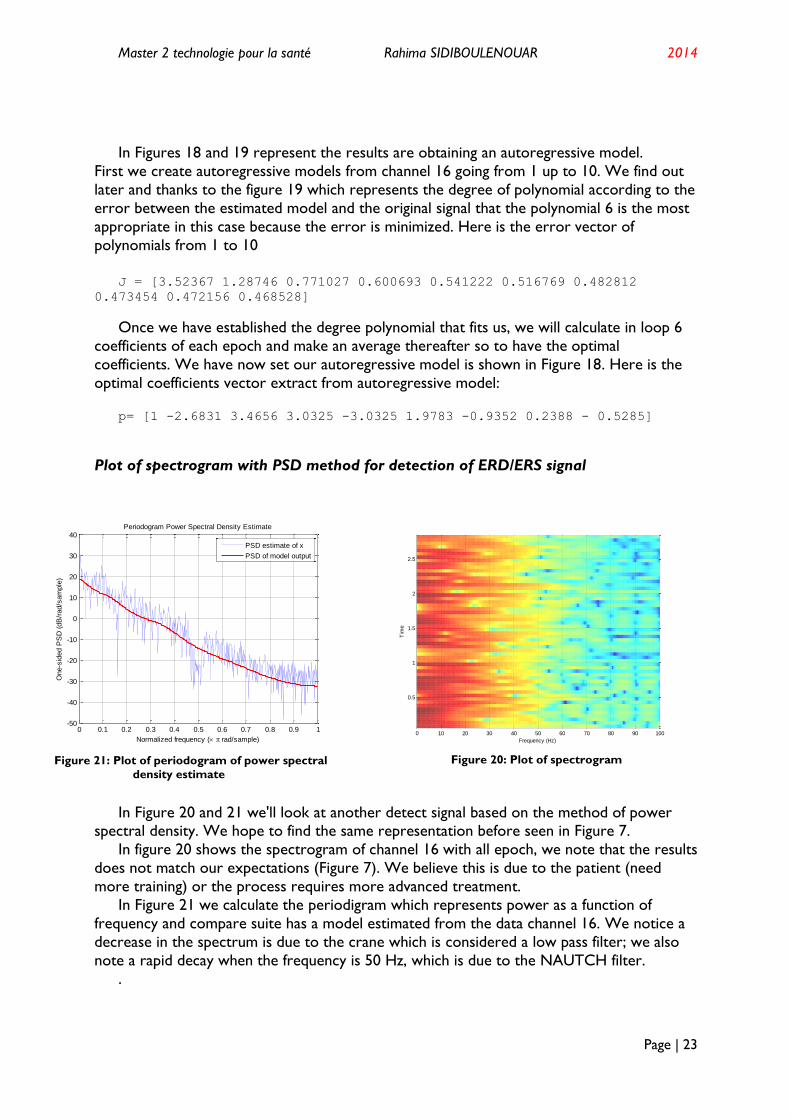
In Figures 18 and 19 represent the results are obtaining an autoregressive model.
First we create autoregressive models from channel 16 going from 1 up to 10. We find out
later and thanks to the figure 19 which represents the degree of polynomial according to the
error between the estimated model and the original signal that the polynomial 6 is the most
appropriate in this case because the error is minimized. Here is the error vector of
polynomials from 1 to 10
J = [3.52367 1.28746 0.771027 0.600693 0.541222 0.516769 0.482812
0.473454 0.472156 0.468528]
Once we have established the degree polynomial that fits us, we will calculate in loop 6
coefficients of each epoch and make an average thereafter so to have the optimal
coefficients. We have now set our autoregressive model is shown in Figure 18. Here is the
optimal coefficients vector extract from autoregressive model:
p= [1 -2.6831 3.4656 3.0325 -3.0325 1.9783 -0.9352 0.2388 - 0.5285]
Plot of spectrogram with PSD method for detection of ERD/ERS signal
In Figure 20 and 21 we'll look at another detect signal based on the method of power
spectral density. We hope to find the same representation before seen in Figure 7.
In figure 20 shows the spectrogram of channel 16 with all epoch, we note that the results
does not match our expectations (Figure 7). We believe this is due to the patient (need
more training) or the process requires more advanced treatment.
In Figure 21 we calculate the periodigram which represents power as a function of
frequency and compare suite has a model estimated from the data channel 16. We notice a
decrease in the spectrum is due to the crane which is considered a low pass filter; we also
note a rapid decay when the frequency is 50 Hz, which is due to the NAUTCH filter.
.
0 0.1 0.2 0.3 0.4 0.5 0.6 0.7 0.8 0.9 1-50
-40
-30
-20
-10
0
10
20
30
40
Normalized frequency ( rad/sample)
One-s
ided P
SD
(dB
/rad/s
am
ple
)
Periodogram Power Spectral Density Estimate
PSD estimate of x
PSD of model output
0 10 20 30 40 50 60 70 80 90 100
0.5
1
1.5
2
2.5
Frequency (Hz)
Tim
e
Figure 21: Plot of periodogram of power spectral
density estimate
Figure 20: Plot of spectrogram
Master 2 technologie pour la santé Rahima SIDIBOULENOUAR 2014
Page | 24
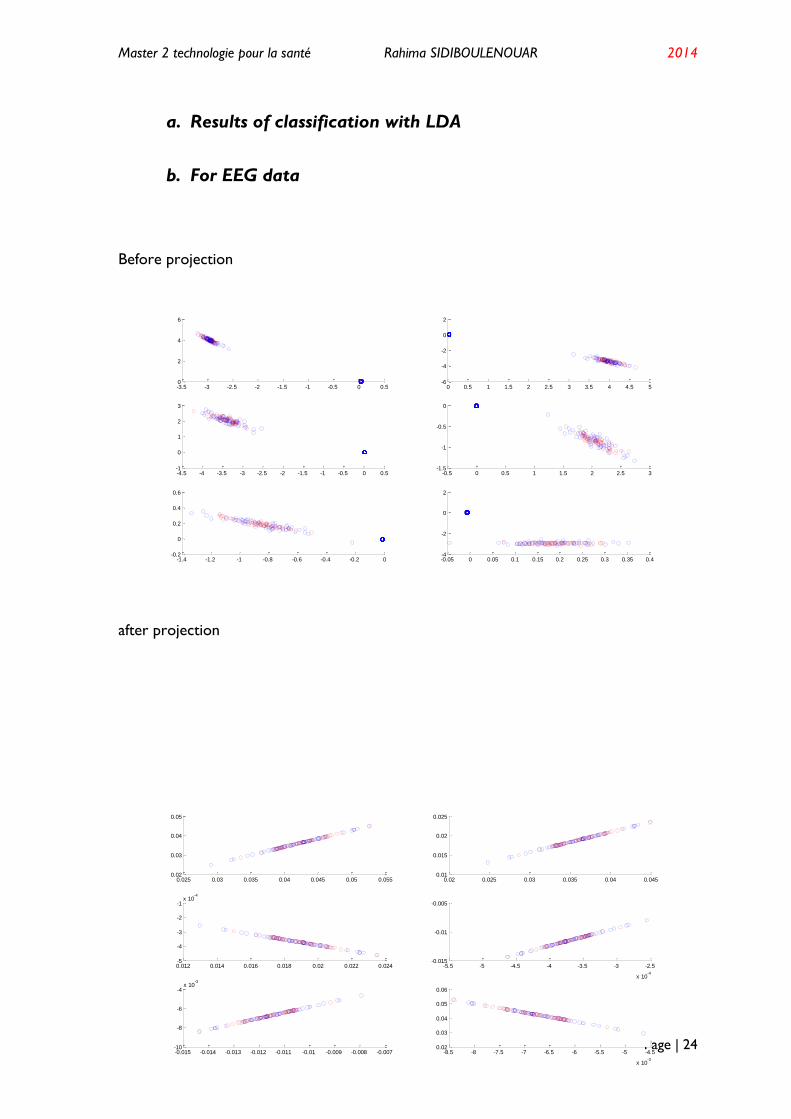
a. Results of classification with LDA
b. For EEG data
Before projection
after projection
-3.5 -3 -2.5 -2 -1.5 -1 -0.5 0 0.50
2
4
6
0 0.5 1 1.5 2 2.5 3 3.5 4 4.5 5-6
-4
-2
0
2
-4.5 -4 -3.5 -3 -2.5 -2 -1.5 -1 -0.5 0 0.5-1
0
1
2
3
-0.5 0 0.5 1 1.5 2 2.5 3-1.5
-1
-0.5
0
-1.4 -1.2 -1 -0.8 -0.6 -0.4 -0.2 0-0.2
0
0.2
0.4
0.6
-0.05 0 0.05 0.1 0.15 0.2 0.25 0.3 0.35 0.4-4
-2
0
2
0.025 0.03 0.035 0.04 0.045 0.05 0.0550.02
0.03
0.04
0.05
0.02 0.025 0.03 0.035 0.04 0.0450.01
0.015
0.02
0.025
0.012 0.014 0.016 0.018 0.02 0.022 0.024-5
-4
-3
-2
-1x 10
-4
-5.5 -5 -4.5 -4 -3.5 -3 -2.5
x 10-4
-0.015
-0.01
-0.005
-0.015 -0.014 -0.013 -0.012 -0.011 -0.01 -0.009 -0.008 -0.007-10
-8
-6
-4x 10
-3
-8.5 -8 -7.5 -7 -6.5 -6 -5.5 -5 -4.5
x 10-3
0.02
0.03
0.04
0.05
0.06

Master 2 technologie pour la santé Rahima SIDIBOULENOUAR 2014
Page | 25
c. For EEG+EMG data
Before projection
After projection
5) Discussion
After the application of these different classifiers, it turned out that the discrimination
between the two states studied motor imagery is done successfully for our subject.
-3.2 -3 -2.8 -2.6 -2.43
3.5
4
4.5
5
3 3.5 4 4.5 5-4.5
-4
-3.5
-3
-2.5
-4.5 -4 -3.5 -3 -2.51
1.5
2
2.5
3
1 1.5 2 2.5 3-1.5
-1
-0.5
0
-1.5 -1 -0.5 0-0.2
0
0.2
0.4
0.6
-0.1 0 0.1 0.2 0.3 0.4-5
0
5
10
-2 0 2 4 6-4
-2
0
2
4
-4 -2 0 2 4-5
0
5
-1 0 1 2 3 4 5-3.2
-3
-2.8
-2.6
-2.4
-1.5 -1 -0.5 0 0.5-1
-0.5
0
0.5
-1 -0.5 0 0.5-0.1
-0.05
0
0.05
0.1
-0.1 -0.05 0 0.05 0.1-0.2
0
0.2
0.4
0.6
-0.2 0 0.2 0.4 0.6-0.2
0
0.2
0.4
0.6
-0.2 0 0.2 0.4 0.6-0.1
-0.05
0
0.05
0.1
-0.06 -0.04 -0.02 0 0.02 0.04-1
-0.5
0
0.5
-0.04 -0.02 0 0.02 0.04-1
-0.5
0
0.5
-0.04 -0.02 0 0.02 0.04-1
-0.5
0
0.5
-0.04 -0.02 0 0.02 0.04 0.06 0.08-1.5
-1
-0.5
0
0.5
Master 2 technologie pour la santé Rahima SIDIBOULENOUAR 2014
Page | 26
All results obtained by the classification highlights the use of the new method of
classifying features proposed in our work based on the combination of features of the EEG
and EMG. It is clear that the recognition rate by find this proposed method are better than
those found by the classification of EEG.
Conclusion and perspective
The experimental process of a BCI is an essential step that requires a thorough study of
several concepts in the areas of neurophysiology and signal processing.
Once the data are recorded, it only remains to analyze and apply the general concepts of
the different features extraction and classification methods proposed in our project.
We present in this project a non-adaptive method for decomposition of nonlinear and non-
stationary signals, such as the case of EEG signals.
The first specific objective of this experiment was therefore to analyze these different
phenomena and characteristics that appear in the decomposition and as a measure of the
signal when a subject performs a movement. We found that introducing new markers
relating to the EMG we increase dramatically in the recognition rate.
One of the most important limitations of this method is that it need a prior study for
each subject in order to specify the frequency bands to keep. Indeed, once the treatment is
done, the method proposed in this project can be easily implemented for treatment
automatic real-time EEG signals.

![A motion-classification strategy based on sEMG-EEG signal ... · trol [13, 14], where some non-EMG signals are combined to sEMG signals to realize a more precise extraction of motor](https://static.fdocuments.net/doc/165x107/5ec6b980e9f89714fb635aa7/a-motion-classification-strategy-based-on-semg-eeg-signal-trol-13-14-where.jpg)