EEG-based depth of anesthesia measurement : separating...
80
UNIVERSITATIS OULUENSIS ACTA C TECHNICA OULU 2011 C 385 Jukka Kortelainen EEG-BASED DEPTH OF ANESTHESIA MEASUREMENT SEPARATING THE EFFECTS OF PROPOFOL AND REMIFENTANIL UNIVERSITY OF OULU, FACULTY OF TECHNOLOGY, DEPARTMENT OF COMPUTER SCIENCE AND ENGINEERING; INFOTECH OULU C 385 ACTA Jukka Kortelainen
Transcript of EEG-based depth of anesthesia measurement : separating...
ABCDEFG
UNIVERS ITY OF OULU P.O.B . 7500 F I -90014 UNIVERS ITY OF OULU F INLAND
A C T A U N I V E R S I T A T I S O U L U E N S I S
S E R I E S E D I T O R S
SCIENTIAE RERUM NATURALIUM
HUMANIORA
TECHNICA
MEDICA
SCIENTIAE RERUM SOCIALIUM
SCRIPTA ACADEMICA
OECONOMICA
EDITOR IN CHIEF
PUBLICATIONS EDITOR
Senior Assistant Jorma Arhippainen
Lecturer Santeri Palviainen
Professor Hannu Heusala
Professor Olli Vuolteenaho
Senior Researcher Eila Estola
Director Sinikka Eskelinen
Professor Jari Juga
Professor Olli Vuolteenaho
Publications Editor Kirsti Nurkkala
ISBN 978-951-42-9484-6 (Paperback)ISBN 978-951-42-9485-3 (PDF)ISSN 0355-3213 (Print)ISSN 1796-2226 (Online)
U N I V E R S I TAT I S O U L U E N S I SACTAC
TECHNICA
U N I V E R S I TAT I S O U L U E N S I SACTAC
TECHNICA
OULU 2011
C 385
Jukka Kortelainen
EEG-BASED DEPTH OF ANESTHESIA MEASUREMENTSEPARATING THE EFFECTS OF PROPOFOL AND REMIFENTANIL
UNIVERSITY OF OULU,FACULTY OF TECHNOLOGY,DEPARTMENT OF COMPUTER SCIENCE AND ENGINEERING;INFOTECH OULU
C 385
ACTA
Jukka Kortelainen
C385etukansi.fm Page 1 Wednesday, July 6, 2011 9:47 AM

A C T A U N I V E R S I T A T I S O U L U E N S I SC Te c h n i c a 3 8 5
JUKKA KORTELAINEN
EEG-BASED DEPTH OF ANESTHESIA MEASUREMENTSeparating the effects of propofol and remifentanil
Academic dissertation to be presented with the assent ofthe Faculty of Technology of the University of Oulu forpublic defence in OP-sali (Auditorium L10), Linnanmaa, on26 August 2011, at 12 noon
UNIVERSITY OF OULU, OULU 2011
Copyright © 2011Acta Univ. Oul. C 385, 2011
Supervised byProfessor Tapio Seppänen
Reviewed byProfessor Jamie SleighProfessor Tarmo Lipping
ISBN 978-951-42-9484-6 (Paperback)ISBN 978-951-42-9485-3 (PDF)http://herkules.oulu.fi/isbn9789514294853/ISSN 0355-3213 (Printed)ISSN 1796-2226 (Online)http://herkules.oulu.fi/issn03553213/
Cover DesignRaimo Ahonen
JUVENES PRINTTAMPERE 2011
Kortelainen, Jukka, EEG-based depth of anesthesia measurement. Separating theeffects of propofol and remifentanilUniversity of Oulu, Faculty of Technology, Department of Computer Science and Engineering;Infotech Oulu, P.O. Box 4500, FI-90014 University of Oulu, FinlandActa Univ. Oul. C 385, 2011Oulu, Finland
AbstractWithin the last few decades, electroencephalogram (EEG) has become a widely used tool for theautomatic assessment of depth of anesthesia. The EEG-based depth of anesthesia measurementhas been associated with several advantages, such as a decreased incidence of intraoperativeawareness and recall, faster recovery, and reduced consumption of anesthetics. However, themeasurement is challenged by simultaneous administration of different types of anesthetics, whichis the common practice in the operating rooms today. Especially, the assessment of depth ofanesthesia induced by supplementing the primary anesthetic drug, i.e. the hypnotic agent, with anopioid has been raised as one of the major problems in the field.
In this thesis, the EEG-based depth of anesthesia measurement during multidrug infusion withpropofol (hypnotic agent) and remifentanil (opioid) is addressed. The problem is approached byfirst giving a quantitative description for the EEG changes occurring during propofol infusion.Two different methods, both utilizing the spectral properties of EEG, for this are presented. Next,the effects of remifentanil on the clinical signs and EEG changes during propofol infusion areinvestigated by applying the first one of the presented methods. Coadministration of opioid isshown to significantly modify the mutual relations of the EEG changes and the clinical signs ofthe patient. Furthermore, remifentanil is found to significantly affect the EEG itself, morespecifically, the power spectrum and derived quantitative parameters during propofol infusion.This effect is strongly dependent on the level of anesthesia. Finally, by utilizing the results on theeffects of remifentanil, a technology is developed for the assessment of depth of propofol-remifentanil anesthesia. The technology is based on improving the determination of the anestheticstate of the patient by EEG-based separation of the effects of propofol and remifentanil.
The thesis provides a framework for the depth of anesthesia measurement during multidrugadministration with propofol and remifentanil. Due to the similar mechanisms of action, the resultsare likely to be generalizable to other hypnotic-opioid drug combinations. The study thus offerspotential for the development of more advanced systems for automatic monitoring of depth ofanesthesia.
Keywords: hypnotic, monitoring, opioid, pattern recognition, signal processing

Kortelainen, Jukka, EEG-pohjainen anestesian syvyyden mittaus. Propofolin jaremifentaniilin vaikutusten erotteluOulun yliopisto, Teknillinen tiedekunta, Tietotekniikan osasto; Infotech Oulu, PL 4500, 90014Oulun yliopistoActa Univ. Oul. C 385, 2011Oulu
TiivistelmäViime vuosikymmeninä elektroenkefalogrammista (EEG) on tullut suosittu apuväline anestesi-an syvyyden automaattisessa seurannassa. EEG-pohjaisella anestesian syvyyden mittauksella onsaavutettu useita hyötyjä: sillä on pystytty esimerkiksi vähentämään leikkauksen aikaista hereilläoloa, pienentämään anesteettien kulutusta sekä nopeuttamaan anestesiasta palautumista. Mittauson kuitenkin haasteellista yhdistelmäanestesiassa, jossa useampaa erityyppistä anesteettia käyte-tään samanaikaisesti. Erityisesti nykyisin yleisesti käytössä oleva tapa täydentää pääasiallistaanesteettia eli hypnoottia opioidilla on nostettu yhdeksi merkittävimmistä haasteista automaatti-sessa anestesian syvyyden mittauksessa.
Väitöskirja käsittelee EEG-pohjaista anestesian syvyyden mittausta käytettäessä propofolin(hypnootti) ja remifentaniilin (opioidi) yhdistelmää. Ongelmaa lähestytään antamalla aluksikvantitatiivinen kuvaus propofoli-induktion aikana ilmeneville EEG-muutoksille. Tähän tarkoi-tukseen esitetään kaksi menetelmää, joista molemmat hyödyntävät EEG:n taajuussisältöä. Seu-raavaksi remifentaniilin vaikutusta potilaan kliinisiin merkkeihin sekä EEG-muutoksiin propofo-li-infuusion aikana tutkitaan soveltamalla ensimmäistä esitetyistä menetelmistä. Opioidin osoite-taan vaikuttavan merkittävästi EEG-muutosten ja kliinisten merkkien väliseen yhteyteen. Lisäksiremifentaniilin todetaan vaikuttavan merkittävästi myös propofoli-infuusion aikana ilmeneviinEEG-muutoksiin. Vaikutus heijastuu signaalin tehotiheysspektriin sekä siitä johdettuihin kvanti-tatiivisiin parametreihin ja on vahvasti riippuvainen anestesian syvyydestä. Lopuksi, hyödyntä-mällä tuloksia remifentaniilin vaikutuksista, esitetään teknologia propofoli-remifentanilli-yhdis-telmäanestesian syvyyden mittaukseen. Teknologia perustuu propofolin ja remifentaniilin vaiku-tusten EEG-pohjaiseen erotteluun ja tätä hyödyntäen potilaan anestesian syvyyden tarkempaanmäärittämiseen.
Väitöskirja tarjoaa tarvittavan tutkimustiedon sekä teknologian propofoli-remifentanilli-yhdistelmäanestesian syvyyden mittaukseen. Samankaltaisten vaikutusmekanismien vuoksitulokset on mahdollista yleistää myös muille hypnootti-opioidi-lääkeyhdistelmille. Tutkimusavaa näin uusia mahdollisuuksia kehittää edistyneempiä anestesian syvyyttä automaattisesti seu-raavia järjestelmiä.
Asiasanat: hahmontunnistus, hypnootti, monitorointi, opioidi, signaalinkäsittely

Acknowledgements
This work was carried out during the years 2006–2011 at the Biosignal Processing
Team of the Department of Electrical and Information Engineering, University of Oulu,
Finland.
I would like to express my sincere gratitude to my supervisor Professor Tapio Seppä-
nen for his support and guidance throughout this project. I also wish to thank Professor
Jamie Sleigh and Professor Tarmo Lipping for prereviewing the thesis. The co-authors
Dr. Miika Koskinen, Dr. Seppo Mustola, and M.Sc. Eero Väyrynen are gratefully ac-
knowledged for providing essential contribution to the original publications. I would
also like to thank the whole Biosignal Processing Team for creating an inspiring and
warm working environment. For proofreading the manuscript, I wish to thank Dr. Pertti
Väyrynen. Furthermore, I am indebted to Professor Nitish Thakor for giving me the op-
portunity to visit his laboratory at Johns Hopkins University in summer 2009 and Dr.
Xiaofeng Jia for his help and guidance during this visit.
For the financial support, I am grateful to Graduate School in Electronics, Telecom-
munication, and Automation (GETA), Walter Ahlström Foundation, Tauno Tönning
Foundation, Instrumentarium Science Foundation, Finnish Foundation for Economic
and Technology Sciences – KAUTE, The Finnish Medical Foundation, Orion-Farmos
Research Foundation, Oulu University Scholarship Foundation, and Ulla Tuominen
Foundation.
Finally, I would like to thank my family, especially my wife Terhi, for the continu-
ous support, patience, and encouragement during all these years.
Jukka Kortelainen
Oulu, 2011
7

8
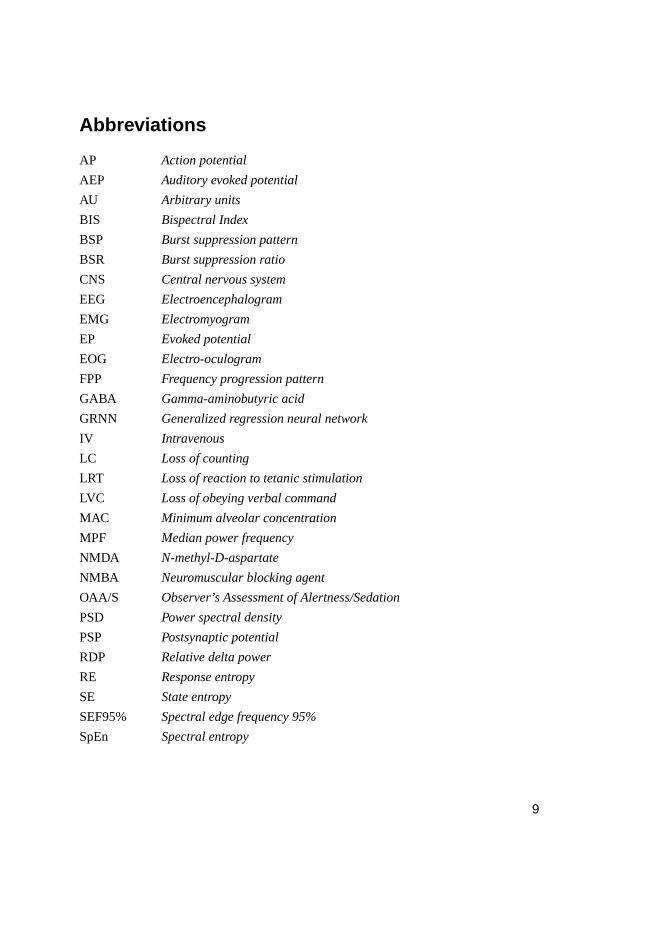
Abbreviations
AP Action potential
AEP Auditory evoked potential
AU Arbitrary units
BIS Bispectral Index
BSP Burst suppression pattern
BSR Burst suppression ratio
CNS Central nervous system
EEG Electroencephalogram
EMG Electromyogram
EP Evoked potential
EOG Electro-oculogram
FPP Frequency progression pattern
GABA Gamma-aminobutyric acid
GRNN Generalized regression neural network
IV Intravenous
LC Loss of counting
LRT Loss of reaction to tetanic stimulation
LVC Loss of obeying verbal command
MAC Minimum alveolar concentration
MPF Median power frequency
NMDA N-methyl-D-aspartate
NMBA Neuromuscular blocking agent
OAA/S Observer’s Assessment of Alertness/Sedation
PSD Power spectral density
PSP Postsynaptic potential
RDP Relative delta power
RE Response entropy
SE State entropy
SEF95% Spectral edge frequency 95%
SpEn Spectral entropy
9

10
List of original articles
This thesis is based on the following five publications, which are referred to in the text
by their Roman numerals (I–V):
I Kortelainen J, Koskinen M, Mustola S & Seppänen T (2007) EEG frequency progression dur-ing induction of anesthesia: from start of infusion to onset of burst suppression pattern. Pro-ceedings of the 29th Annual International Conference of the IEEE Engineering in Medicineand Biology Society, Lyon, France: 1570–1573.
II Kortelainen J, Koskinen M, Mustola S & Seppänen T (2008) Remifentanil modifies the rela-tion of electroencephalographic spectral changes and clinical endpoints in propofol anesthesia.Anesthesiology 109: 198–205.
III Kortelainen J, Koskinen M, Mustola S & Seppänen T (2009) Effects of remifentanil on thespectrum and quantitative parameters of electroencephalogram in propofol anesthesia. Anes-thesiology 111: 574–583.
IV Kortelainen J, Väyrynen E & Seppänen T (2011) Depth of anesthesia during multidrug infu-sion: separating the effects of propofol and remifentanil using the spectral features of EEG.IEEE Transactions on Biomedical Engineering 58: 1216–1223.
V Kortelainen J, Väyrynen E & Seppänen T (2011) Isomap approach to EEG-based assessmentof neurophysiological changes during anesthesia. IEEE Transactions on Neural Systems andRehabilitation Engineering 19: 113–120.
11

12
Contents
Abstract
Tiivistelmä
Acknowledgements 7
Abbreviations 9
List of original articles 11
Contents 13
1 Introduction 15
1.1 Background . . . . . . . . . . . . . . . . . . . . . . . . . . . . . . . . . . . . . . . . . . . . . . . . . . . . . . . . . 15
1.2 Research problem and objectives . . . . . . . . . . . . . . . . . . . . . . . . . . . . . . . . . . . . . . 16
1.3 Research scope and approach . . . . . . . . . . . . . . . . . . . . . . . . . . . . . . . . . . . . . . . . . 17
1.4 Original publications and authors’ contributions. . . . . . . . . . . . . . . . . . . . . . . . .18
2 Literature review 19
2.1 General anesthesia . . . . . . . . . . . . . . . . . . . . . . . . . . . . . . . . . . . . . . . . . . . . . . . . . . . 19
2.1.1 Definition of anesthesia . . . . . . . . . . . . . . . . . . . . . . . . . . . . . . . . . . . . . . . . 19
2.1.2 Propofol . . . . . . . . . . . . . . . . . . . . . . . . . . . . . . . . . . . . . . . . . . . . . . . . . . . . . . 22
2.1.3 Remifentanil . . . . . . . . . . . . . . . . . . . . . . . . . . . . . . . . . . . . . . . . . . . . . . . . . . 22
2.1.4 Measuring depth of anesthesia . . . . . . . . . . . . . . . . . . . . . . . . . . . . . . . . . . 23
2.2 EEG . . . . . . . . . . . . . . . . . . . . . . . . . . . . . . . . . . . . . . . . . . . . . . . . . . . . . . . . . . . . . . . . 26
2.2.1 Origin of EEG . . . . . . . . . . . . . . . . . . . . . . . . . . . . . . . . . . . . . . . . . . . . . . . . 26
2.2.2 Measurement of EEG . . . . . . . . . . . . . . . . . . . . . . . . . . . . . . . . . . . . . . . . . . 28
2.2.3 Spontaneous rhythmic EEG activity . . . . . . . . . . . . . . . . . . . . . . . . . . . . . 30
2.3 EEG-based depth of anesthesia measurement . . . . . . . . . . . . . . . . . . . . . . . . . . . 32
2.3.1 EEG changes during anesthesia . . . . . . . . . . . . . . . . . . . . . . . . . . . . . . . . . 32
2.3.2 Measures of depth of anesthesia. . . . . . . . . . . . . . . . . . . . . . . . . . . . . . . . .33
2.3.3 Multidrug administration . . . . . . . . . . . . . . . . . . . . . . . . . . . . . . . . . . . . . . . 39
2.3.4 Evoked potentials . . . . . . . . . . . . . . . . . . . . . . . . . . . . . . . . . . . . . . . . . . . . . 44
3 Research contributions 47
3.1 Quantification of EEG changes during induction of anesthesia . . . . . . . . . . . . 47
3.1.1 The advancedr scale. . . . . . . . . . . . . . . . . . . . . . . . . . . . . . . . . . . . . . . . . . .47
3.1.2 Isomap-based approach . . . . . . . . . . . . . . . . . . . . . . . . . . . . . . . . . . . . . . . . 48
13
3.2 Effects of remifentanil on EEG-based depth of anesthesia
measurement during propofol infusion . . . . . . . . . . . . . . . . . . . . . . . . . . . . . . . . . 51
3.2.1 Clinical endpoints and FPP . . . . . . . . . . . . . . . . . . . . . . . . . . . . . . . . . . . . . 51
3.2.2 Spectral properties of EEG . . . . . . . . . . . . . . . . . . . . . . . . . . . . . . . . . . . . . 52
3.3 Assessment of depth of propofol-remifentanil anesthesia . . . . . . . . . . . . . . . . . 52
3.4 Summary of research contributions . . . . . . . . . . . . . . . . . . . . . . . . . . . . . . . . . . . . 54
4 Discussion 57
4.1 Significance of results . . . . . . . . . . . . . . . . . . . . . . . . . . . . . . . . . . . . . . . . . . . . . . . . 57
4.1.1 Quantification of anesthetic EEG changes . . . . . . . . . . . . . . . . . . . . . . . . 57
4.1.2 Description of the opioid effects . . . . . . . . . . . . . . . . . . . . . . . . . . . . . . . . 57
4.1.3 Technology to separate drug effects . . . . . . . . . . . . . . . . . . . . . . . . . . . . . 58
4.2 Limitations and generalizability . . . . . . . . . . . . . . . . . . . . . . . . . . . . . . . . . . . . . . . 59
5 Summary and conclusions 61
References 63
Original articles 75
14
1 Introduction
1.1 Background
The invention of general anesthesia in the 19th century undoubtedly represents a quan-
tum leap in the history of medicine. Before this, surgery had remained a treatment of
last resort largely because of the unwillingness of the patients to undergo an operation.
The operations themselves, when performed, were done in a hurry to minimize the
agony of the patient but compromising the quality of the procedure. The unawareness
and unresponsiveness provided by anesthetics fundamentally changed this arrangement.
It is therefore justifiable to say that general anesthesia has made the transition to modern
surgery possible.
While the exact definition of general anesthesia varies to some extent, it is mostly
agreed that this drug-induced reversible condition comprises of multiple behavioral
states originating from different neural mechanisms. The states are generally associ-
ated with different anesthetic components, most commonly either hypnosis or analgesia.
Hypnosis represents the state of consciousness, whereas analgesia relates to manage-
ment of pain. High quality anesthesia requires a careful balance of these components.
In today’s clinical practice, this is usually attained by supplementing a hypnotic drug
with an opioid, a centrally acting analgesic drug.
Ever since the invention of general anesthesia, the measurement of its depth has
provided a challenge for the clinicians. While too deep anesthesia leads to numerous
complications, such as hemodynamic instability and prolonged recovery, too light anes-
thesia has catastrophic consequences from the patient’s point of view as well. The
classic approach to assess the anesthetic state has been to observe the patient’s clinical
signs (e.g. a response to verbal command or reaction to a painful stimulation). Later,
the estimation of drug concentration in the exhaled gas and in the blood using mathe-
matical models has provided an alternative way to approximate the effect of anesthetic
drugs.
Already in the early 20th century, electroencephalogram (EEG), the measure of the
electrical activity of the brain, was shown to react to the administration of anesthetic
drugs (Berger 1931, 1933). The findings spawned a whole branch of research inves-
tigating the relation of EEG changes and depth of anesthesia. The advantage of this
15
approach is that, unlike the above-presented methods, it is adirect measurement from
the main effect-site of anesthetics, the brain. However, it was not before the late 1990s
that the technological development made the automatic assessment of depth of anes-
thesia possible. The first commercial monitor, Bispectral Index (BIS), for this purpose
was introduced in 1996 by Aspect Medical Systems. Soon after the introduction of
BIS, several other commercial indices were launched. The EEG-based depth of anes-
thesia measurement has been associated with a decreased incidence of intraoperative
awareness and recall (Ekmanet al.2004, Myleset al.2004), faster recovery (Ganet al.
1997, Yli-Hankalaet al. 1999, Johansen & Sebel 2000, Droveret al. 2002, Vakkuri
et al.2005), and reduced postoperative vomiting (Nelskyläet al.2001). In addition, the
monitoring reduces the consumption of anesthetics (Yli-Hankalaet al.1999, Guignard
et al.2001, Kreueret al.2003a, Vakkuriet al.2005, Aiméet al.2006).
The EEG-based depth of anesthesia measurement has faced, however, some signif-
icant challenges. One of these is that many different classes of anesthetic drugs, all
of which affect EEG, are used nowadays simultaneously in the operating rooms. Espe-
cially, the assessment of depth of multidrug anesthesia induced by combining an opioid
to a hypnotic agent has been raised as one of the major problems in the field. The mech-
anisms of action of these drugs are different resulting in distinct neurophysiological
changes and thereby challenging the EEG-based depth of anesthesia indices generally
developed to measure the effect of a single hypnotic agent. Even though a large body of
literature addresses this problem, the results presented are somewhat controversial and
cannot be used to draw clear-cut conclusions about the reliability of the indices during
hypnotic-opioid anesthesia.
1.2 Research problem and objectives
This thesis concentrates on investigating the effect of coadministration of opioids on
the EEG-based depth of anesthesia measurement. Thus far, the papers published on this
topic represent a heterogeneous group of studies, in which the application of different
drug combinations, EEG measures, and clinical protocols fundamentally complicate the
interpretation of results. It therefore remains unclear, how supplementing the hypnotic
drug with an opioid affects the EEG-based depth of anesthesia measurement. The main
objective of the thesis is to answer this question. Furthermore, the aim is to develop
a technology for a more reliable measurement of depth of anesthesia during hypnotic-
opioid anesthesia.
16
1.3 Research scope and approach
The objectives of the thesis are approached by investigating the EEG changes and depth
of anesthesia in terms of clinical signs during induction of multidrug anesthesia with
propofol and remifentanil. Both drugs, representing a hypnotic agent and an opioid,
respectively, are widely used in the clinical practice and have typical mechanisms of
action making the results generalizable to some extent to other anesthetics. The analysis
is restricted to the induction of anesthesia excluding the emergence phase.
The original publications are all based on one data set recorded in 2000 and 2001.
The data originally included 45 patients, but due to variation in the technical details
related to EEG measurement protocol, only 27 were approved to the studies. Further-
more, the data of one more patient were later excluded because of the measurement
artifact. The patients were randomly assigned to one of three groups: R0 (9 patients),
R1 (8 patients), and R2 (9 patients). Depending on the group, patients received either
saline (R0), low-dose remifentanil (R1, 7.5µg× kg−1 × h−1) or high-dose remifen-
tanil (R2, 30µg× kg−1 × h−1) during the induction of anesthesia with propofol (30
mg× kg−1×h−1). Both drugs were infused at a fixed rate until the burst suppression
pattern (BSP) was detected in an EEG monitor. During the induction, different clinical
signs were observed. During the induction process, EEG was recorded from 17 differ-
ent electrode locations. However, the analysis was performed using only one frontal
montage (Fz) with a common average reference.
The work can be divided into three separate tasks. The first is the quantification
of EEG phenomenon during induction of anesthesia. Two different methods are devel-
oped to describe the continuum of EEG changes related to propofol infusion. In these
methods, spectral features are used to delineate the EEG changes due to their intuitive
interpretation and computational simplicity. The commercial indices are intentionally
not used as they present the depth of anesthesia usually with only one variable, whose
algorithm is often not revealed, and therefore do not sufficiently give information about
the changes in the EEG itself. The second task is to describe the effect of coadmin-
istration of remifentanil on the EEG-based depth of anesthesia measurement during
propofol infusion. The first of the methods developed in task one is utilized to attain
this goal. The effects of remifentanil on both the clinical signs and the EEG changes are
investigated separately. The third and final task is to develop a technology for depth of
anesthesia measurement during multidrug infusion with propofol and remifentanil. The
technology is based on improving the determination of the anesthetic state of the patient
17
by EEG-based separation of the effects of propofol and remifentanil. Also in this task,
the same method developed for quantification of EEG changes during propofol infusion
is utilized.
1.4 Original publications and authors’ contributions
Publications I and V focus on a quantitative description of the EEG changes during
induction of anesthesia with propofol. In Publications II and III, the effects of coad-
ministration of remifentanil on the EEG-based depth of anesthesia measurement during
propofol infusion are investigated. A technology for depth of anesthesia measurement
during multidrug infusion with propofol and remifentanil using EEG is presented in
Paper IV. Papers II–V utilize the method presented in Publication I.
In all five original publications, the author was primarily responsible for the study
design, development and implementation of algorithms, analysis of results, and manu-
script’s production. Professor Tapio Seppänen contributed to all publications as a super-
visor providing valuable ideas and comments, as well as revision of the manuscripts. In
Papers I–III, Dr. Miika Koskinen participated in the study design and preparation of the
manuscripts, whereas, in Papers IV and V, a similar contribution was given by M.Sc.
Eero Väyrynen. Dr. Seppo Mustola participated to the revision of Papers I–III. The
study data, whose collection the author did not attend, were also provided by Dr. Seppo
Mustola.
18
2 Literature review
The chapter provides an overview of the literature related to the topic of the study. It
comprises three parts. Whereas Section 2.1 and Section 2.2 concentrate on giving funda-
mental background information pertaining to general anesthesia and EEG, respectively,
Section 2.3 deals with the EEG-based depth of anesthesia measurement focusing on
multidrug administration.
2.1 General anesthesia
"The state should, I think, be called "Anesthesia". This signifies insensibility."
Oliver W. Holmes
2.1.1 Definition of anesthesia
General anesthesia is a drug-induced reversible condition that can be defined with five
behavioral states: unconsciousness, amnesia, antinociception, immobility, and hemo-
dynamic stability (Evers & Crowder 2006). Even though some anesthetic drugs may
induce most of the states, usually a combination of hypnotic agent, analgesic agent,
and neuromuscular blocking agent (NMBA) is nowadays used to improve the quality
of anesthesia (van Gilset al. 2002). With these drugs, the anesthesia is attained by
affecting the neural transmission in brain, spinal cord, and peripheral neuromuscular
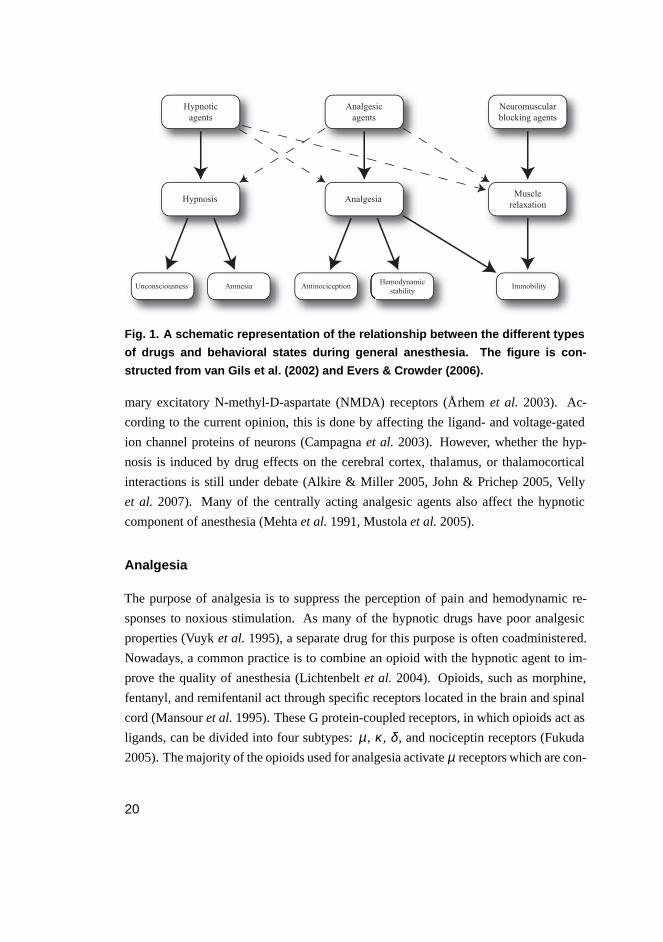
junctions. Fig. 1 illustrates the relationship between the different types of drugs and
behavioral states during general anesthesia.
Hypnosis
Hypnosis is a crucial component of general anesthesia guaranteeing the patient to be
unaware of the ongoing events and have no memories of the intraoperative period. It
can be induced by affecting the neural activity of the brain using either intravenous (IV)
anesthetics, such as propofol, or inhaled anesthetics like isoflurane, sevoflurane, and
desflurane. Most of the hypnotic agents act in the central nervous system (CNS) by
either increasing the transmission of the primary inhibitory neurotransmitter gamma-
aminobutyric acid (GABA) or by decreasing the activity of the glutamate-driven pri-
19
Hypnotic
agents
Analgesic
agents
Neuromuscular
blocking agents
Hypnosis AnalgesiaMuscle
relaxation
Unconsciousness AmnesiaHemodynamic
stabilityAntinociception Immobility
Fig. 1. A schematic representation of the relationship between the d ifferent types
of drugs and behavioral states during general anesthesia. The figure is con-
structed from van Gils et al. (2002) and Evers & Crowder (2006).
mary excitatory N-methyl-D-aspartate (NMDA) receptors (Århemet al. 2003). Ac-
cording to the current opinion, this is done by affecting the ligand- and voltage-gated
ion channel proteins of neurons (Campagnaet al. 2003). However, whether the hyp-
nosis is induced by drug effects on the cerebral cortex, thalamus, or thalamocortical
interactions is still under debate (Alkire & Miller 2005, John & Prichep 2005, Velly
et al. 2007). Many of the centrally acting analgesic agents also affect the hypnotic
component of anesthesia (Mehtaet al.1991, Mustolaet al.2005).
Analgesia
The purpose of analgesia is to suppress the perception of pain and hemodynamic re-
sponses to noxious stimulation. As many of the hypnotic drugs have poor analgesic
properties (Vuyket al. 1995), a separate drug for this purpose is often coadministered.
Nowadays, a common practice is to combine an opioid with the hypnotic agent to im-
prove the quality of anesthesia (Lichtenbeltet al. 2004). Opioids, such as morphine,
fentanyl, and remifentanil act through specific receptors located in the brain and spinal
cord (Mansouret al.1995). These G protein-coupled receptors, in which opioids act as
ligands, can be divided into four subtypes:µ , κ , δ , and nociceptin receptors (Fukuda
2005). The majority of the opioids used for analgesia activateµ receptors which are con-
20
sidered to produce analgesia via GABAergic neural transmission (Christieet al.2000).
The analgesic effects of opioids arise from their ability to inhibit the transmission of no-
ciceptive information from the spinal cord to the brain, as well as their direct influence
on the pain perception in the brain (Fukuda 2005). Numerous reports have demon-
strated that a major benefit of opioids is also the hemodynamic stability they provide
during anesthesia (Bovillet al.1984). This results from the attenuated nociception, but
also from the direct effects of opioids on the neurologic and cardiac mechanisms regu-
lating the blood pressure and heart contraction (Fukuda 2005). Due to the suppression
of pain perception, a well-produced analgesia also induces immobility.
Muscle relaxation
Intraoperative muscle relaxation is necessary for several reasons. It facilitates endotra-
cheal intubation in the beginning of anesthesia (Kaur & Heard 2008, Naguib & Lien
2005). Adequate muscle relaxation also contributes to the anesthesia by guaranteeing
immobility during the operation, which is beneficial to the surgeon (van Gilset al.2002).
Even though a sufficient combination of hypnotic and analgesic drug often provides sat-
isfactory muscle relaxation (Merk & Goudsouzian 1995), a separate drug dedicated to
this purpose is often used to assure optimal conditions for the operation (Naguib & Lien
2005). There exist two major groups of muscle relaxants: NMBAs and spasmolytics (i.e.
centrally acting muscle relaxants). In practice, the effective intraoperative muscle relax-
ation is restricted to the usage of NMBAs (Erkola & Rautoma 1999). NMBAs, such
as succinylcholine and rocuronium, block neuromuscular transmission at the peripheral
neuromuscular junctions by binding to the acetylcholine receptors located postsynapti-
cally in the membrane of skeletal muscle cells (Erkola & Rautoma 1999). Because of
this peripheral mechanism of action, NMBAs do not contribute to the other behavioral
states of anesthesia besides immobility. Therefore, to avoid unintentional awareness
during operation, they should be administered only to appropriately anesthetized indi-
viduals. NMBAs are nowadays routinely used in combination with hypnotic and anal-
gesic drugs to facilitate endotracheal intubation and to maintain immobility through
different surgical procedures (Naguib & Lien 2005).
21
2.1.2 Propofol
Propofol is the most frequently used IV anesthetic today (Reveset al. 2005). It is uti-
lized in the operating room and intensive care unit (ICU) for both induction and mainte-
nance of anesthesia. These are carried out using either repeated boluses or continuous
drug infusion. When delivered to the circulation, propofol is rapidly metabolized in the
liver to water-soluble compounds, which are then excreted in the kidneys (Simonset al.
1985). Propofol is primarily a hypnotic agent resulting in unconsciousness and amnesia
swiftly after beginning of administration. Evidence suggests that a significant portion of
propofol’s hypnotic action is mediated by potentiation of the GABAergic neural trans-
mission (Krasowskiet al.2001, Jurdet al.2003). The drug also results in widespread
inhibition of NMDA receptors, which may contribute to its CNS effects (Lingamaneni
et al. 2001). Even though propofol’s main effect-site is the brain, studies have demon-
strated its direct depressant effect on the neurons of the spinal cord (Antogniniet al.
2000). Despite this, propofol has poor analgetic properties as the concentration sup-
pressing the reactions to surgical stimulation is much higher than the one needed in
the hypnotic point of view (Scheinin & Valtonen 1999). The major disadvantage of
propofol is the decrease of blood pressure it induces (Scheinin & Valtonen 1999). To
avoid high concentrations of propofol during an operation, an analgesic drug is often
combined with it (Lichtenbeltet al.2004).
2.1.3 Remifentanil
Remifentanil is an opioid increasingly used in the operating room and intensive care
(Fodaleet al.2008). Intraoperatively, it is given to patients as a supplement to hypnotic
drug, or alone in high-dose opioid anesthesia (Servin 2003, Coda 2009). The phar-
macodynamic properties of remifentanil are similar to all opioids representing strong
µ receptor agonism (Jameset al. 1991). By this mechanism, it selectively decreases
the amount of pain and discomfort during surgical procedure (Laitinen & Salomäki
1999). When compared with propofol, remifentanil provides significantly better anal-
gesia (Coda 2009). The drug also has hypnotic effects. However, clinical investigations
have found that loss of consciousness is not reliably achieved with remifentanil alone
(Coda 2009, Jhaveriet al. 1997). The real advantage of remifentanil is in its pharma-
cokinetic properties. After administration, the drug is rapidly distributed throughout
the body (Battershill & Keating 2006). Unlike other intraoperative opioids, remifen-
22
tanil is metabolized via blood- and tissue-nonspecific esterases (Beers & Camporesi
2004, Fukuda 2005). This organ-independent elimination guarantees rapid metabolism
leading to the lack of accumulation and rapid emergence even after long infusion time
(Hoffman et al. 1993, Battershill & Keating 2006). Remifentanil thus constitutes the
first "ultra-short"-acting opioid for general anesthesia (Fukuda 2005). Due to the rapid
metabolism, remifentanil is usually administered using continuous drug infusion. The
favorable pharmacodynamic and pharmacokinetic properties of remifentanil have made
it a popular supplement to propofol for total IV anesthesia (TIVA) (Coda 2009, Grund-
mannet al. 1998). This kind of multidrug infusion decreases the amount of propofol
needed to reach a certain depth of anesthesia when defined using clinical signs (Mustola
et al.2005).
2.1.4 Measuring depth of anesthesia
Literature presents several ways to measure the depth of anesthesia. In this subsection,
the most common approaches will be introduced. The EEG-based depth of anesthesia
measurement is not discussed here, as it is explained in detail in Section 2.3.
Clinical signs
Clinical signs can be defined as the physiological signals readily measured by observing
the patient (van Gilset al.2002). These provide a gold standard for the assessment of
depth of anesthesia. For example, the breathing pattern, muscle tone, heart rate, and
ocular signs of the patient have traditionally been used to give information about the
adequacy of anesthesia. Commonly, the state of the patient is determined by observing
the occurrence of different endpoints representing the beginning or ending of a certain
clinical sign. This approach is exceptionally favorable from the research point of view,
as the occurrence of such a clinical endpoint provides a discrete moment that can be
associated with a particular depth of anesthesia. The endpoints are roughly divided into
hypnotic and analgesic, depending on whether they reflect more the patient’s awareness
or reaction to painful stimulation, respectively.
The hypnotic endpoints give information about the patient’s state in terms of con-
sciousness and memory formation. Historically, the ocular signs, such as pupillary light
reflex (Belaniet al.1993) and eyelash reflex (Cruccuet al.1991, Mourisseet al.2003),
have provided a popular approach to assess the hypnosis of the patient. However, the
23
ocular signs are driven by spinal reflexes and are thus considered to reflect also the anal-
gesic state of the patient. Therefore, the endpoints like loss of counting (LC) and loss
of obeying a verbal command (LVC) involving higher central areas are thought to be
more adequate for the measurement of the hypnotic component of anesthesia. In LC,
the patient is asked to count slowly as long as he/she can from the beginning of infu-
sion of anesthetic drug and the moment the patient stops counting defines the endpoint.
The LVC is defined as the moment the patient stops obeying a verbal command like
"squeeze my hand" or "open your eyes". The command is given continuously every
10-20 seconds from the beginning of drug infusion. LVC has been shown to represent
a deeper level of anesthesia than LC (Dunnetet al.1994, de Groodet al.1985).
The analgesic endpoints are used to assess the patient’s response (movement or
hemodynamic changes) to painful stimulation. Traditionally, reactions to skin incision,
laryngoscopy and intubation have been used for this purpose. However, the trapez-
ius squeeze and tetanic stimulation provide good alternatives to those stimulations
(Zbindenet al. 1994a,b). The advantages of the latter ones are that they are repro-
ducible and noninvasive. The electrical tetanic stimulation may nowadays be the most
commonly used pain stimulus (Mustola 2004). It is applied by conducting a current via
self-adhesive or needle electrodes to the upper or lower limb. The moment the purpose-
ful somatic movement ceases defines the endpoint, i.e. the loss of reaction to tetanic
stimulation (LRT).
Even though the clinical signs provide a traditional and intuitive approach to depth
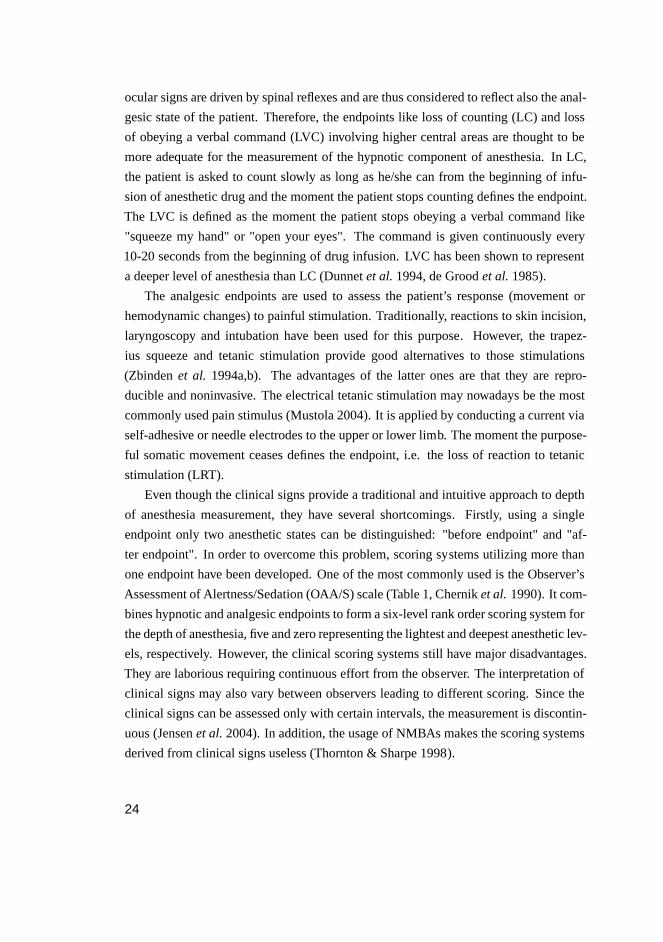
of anesthesia measurement, they have several shortcomings. Firstly, using a single
endpoint only two anesthetic states can be distinguished: "before endpoint" and "af-
ter endpoint". In order to overcome this problem, scoring systems utilizing more than
one endpoint have been developed. One of the most commonly used is the Observer’s
Assessment of Alertness/Sedation (OAA/S) scale (Table 1, Cherniket al. 1990). It com-
bines hypnotic and analgesic endpoints to form a six-level rank order scoring system for
the depth of anesthesia, five and zero representing the lightest and deepest anesthetic lev-
els, respectively. However, the clinical scoring systems still have major disadvantages.
They are laborious requiring continuous effort from the observer. The interpretation of
clinical signs may also vary between observers leading to different scoring. Since the
clinical signs can be assessed only with certain intervals, the measurement is discontin-
uous (Jensenet al.2004). In addition, the usage of NMBAs makes the scoring systems
derived from clinical signs useless (Thornton & Sharpe 1998).
24
Table 1. The Observer’s Assessment of Alertness/Sedation Scale.
Score Responsiveness
5 Responds readily to a name spoken in normal tone
4 Lethargic response to a name spoken in normal tone
3 Responds only after a name is called loudly and/or repeatedly
2 Responds only after mild prodding or shaking
1 Responds only after a painful trapezius squeeze
0 No response after a painful trapezius squeeze
Drug concentration
At population level, the effect of anesthetic drugs can be predicted from their concen-
tration in the blood. For examples, concentrations required for loss of consciousness,
amnesia, and unresponsiveness to painful stimulation have been reported for propofol
(Reveset al.2005). The pharmacologic effect and blood concentration of the anesthetic
are, however, usually not linearly related (Olkkola 1999). Therefore, different nonlinear
pharmacodynamic models have been developed to give a mathematical description of
the relationship between the drug concentration and its pharmacologic effects (Shafer
& Schwinn 2005).
When using inhaled anesthetics, the estimation of drug concentration in the blood
is rather easy. Modern patient monitors are able to measure the concentration of anes-
thetic drug in both inhaled and exhaled gases. Exhaled drug concentration in the end
of expirium represents the alveolar concentration, which is an adequate estimate for the
concentration of anesthetic in the blood and brain (i.e. effect-site) during the steady
state (van Gilset al. 2002). Minimum alveolar concentration (MAC) is a value devel-
oped to measure the potency of different anesthetic drugs (Koblin 2005). It is defined
as the alveolar concentration producing immobility in 50% of subjects exposed to a
noxious stimulus (Quashaet al. 1980). The MAC values for all commonly used in-
haled anesthetics have been presented (Nickalls & Mapleson 2003). The MAC concept
can also be used with other endpoints like LVC (MAC awake) and lack of response to
endotracheal intubation (MAC intubation) (Koblin 2005).
With IV anesthetics, the determination of drug concentration in real time is more
complicated. Today, the measurement of the concentration in exhaled gas is not yet pos-
sible, even though the recently published results on this are promising (Perlet al.2009,
25
Gonget al. 2009, Miekischet al. 2008). As a solution, pharmacokinetic models have
been developed to mathematically describe the relationship between a given dose of
the IV anesthetic and the resulting drug concentration (Shafer & Schwinn 2005). Such
models for both propofol and remifentanil, for example, have been proposed (Adam
et al. 1983, Westmorelandet al. 1993). The introduction of pharmacokinetic models
has led to the development of target controlled infusion (TCI) systems, in which the ad-
ministration of the anesthetic is automatically adjusted to achieve and maintain certain
drug concentration (Glasset al.2005).
Despite the extensive use of drug concentration in the estimation of depth of anes-
thesia, this approach has some major disadvantages. There is a wide variation in the
pharmacokinetic and pharmacodynamic responses between individuals (Avramov &
White 1995, Heier & Steen 1996, Høymorket al. 2000, van Gilset al. 2002). This
means that the same amount of drug given to a different patient may not lead to the
same drug concentration in the blood or effect-site and, on the other hand, certain drug
concentration does not induce the same effect in all patients. For example, age and gen-
der have been shown to affect these properties significantly (Reveset al. 2005, Shafer
& Schwinn 2005). Hence, the models, even though suitable for studying the behavior
of the drug in a subject, cannot be reliably used for the depth of anesthesia monitoring
(van Gilset al.2002).
2.2 EEG
"If the brain were simple enough for us to understand it, we would be too simple to
understand it."
Ken Hill
2.2.1 Origin of EEG
The CNS generally consists of neural cells, or neurons and glia cells, which surround
neurons providing support for them and insulation between them (Sanei & Chambers
2007). Neurons are electrically excitable cells processing and transmitting information
by electrical and chemical signaling (Pocock & Richards 1999). Each neuron has a
cell body, an axon, and at least one dendrite. The cell body contains a nucleus and is
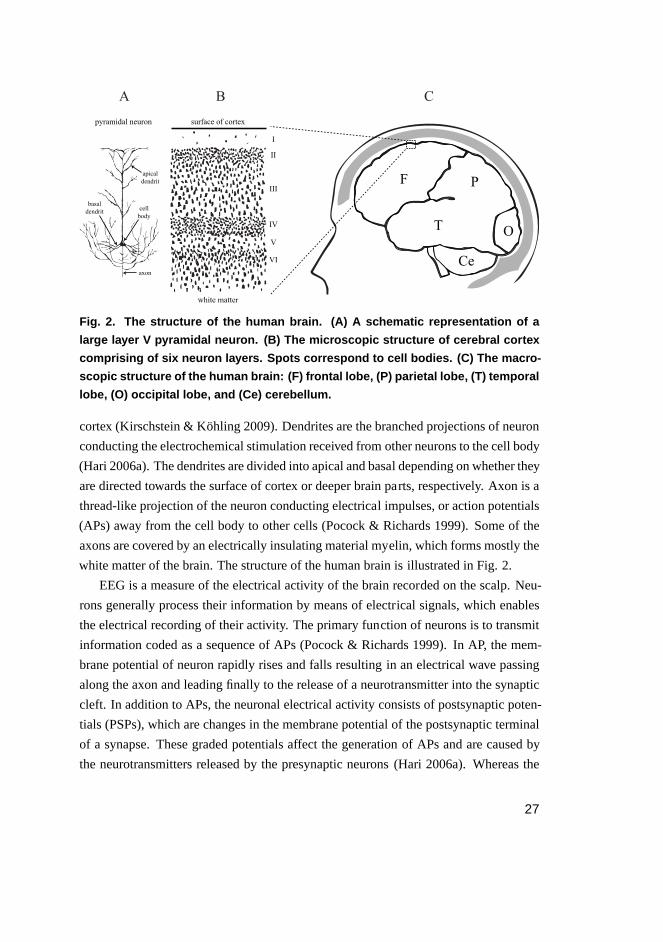
responsible for the most of the cell’s metabolism. In the surface of human brain, the
neuronal cell bodies have been aligned into horizontal layers constituting the cerebral
26
A
F P
T O
Ce
I
II
III
IV
V
VI
surface of cortex
white matter
pyramidal neuron
B C
apical
dendrit
cell
body
axon
basal
dendrit
Fig. 2. The structure of the human brain. (A) A schematic represen tation of a
large layer V pyramidal neuron. (B) The microscopic structure of cerebral cortex
comprising of six neuron layers. Spots correspond to cell bodies. (C) The macro-
scopic structure of the human brain: (F) frontal lobe, (P) parietal lobe, (T) temporal
lobe, (O) occipital lobe, and (Ce) cerebellum.
cortex (Kirschstein & Köhling 2009). Dendrites are the branched projections of neuron
conducting the electrochemical stimulation received from other neurons to the cell body
(Hari 2006a). The dendrites are divided into apical and basal depending on whether they
are directed towards the surface of cortex or deeper brain parts, respectively. Axon is a
thread-like projection of the neuron conducting electrical impulses, or action potentials
(APs) away from the cell body to other cells (Pocock & Richards 1999). Some of the
axons are covered by an electrically insulating material myelin, which forms mostly the
white matter of the brain. The structure of the human brain is illustrated in Fig. 2.
EEG is a measure of the electrical activity of the brain recorded on the scalp. Neu-
rons generally process their information by means of electrical signals, which enables
the electrical recording of their activity. The primary function of neurons is to transmit
information coded as a sequence of APs (Pocock & Richards 1999). In AP, the mem-
brane potential of neuron rapidly rises and falls resulting in an electrical wave passing
along the axon and leading finally to the release of a neurotransmitter into the synaptic
cleft. In addition to APs, the neuronal electrical activity consists of postsynaptic poten-
tials (PSPs), which are changes in the membrane potential of the postsynaptic terminal
of a synapse. These graded potentials affect the generation of APs and are caused by
the neurotransmitters released by the presynaptic neurons (Hari 2006a). Whereas the
27
APs are too short in duration to sufficiently sum up, PSPs having a duration of up to sev-
eral tens of ms are able to produce potential changes that can be recorded on the scalp
(Huttunenet al.2006). EEG is thus considered to result mainly from PSPs. According
to the current knowledge, the large cortical pyramidal neurons in deep cortical layers
play a major role in the generation of the EEG due to their unique orientation with their
long apical dendrites perpendicular to the cortical surface (Fisch 1999, Kirschstein &
Köhling 2009).
2.2.2 Measurement of EEG
EEG is recorded on the scalp and represents generally, depending on the location of
electrodes, small potential fluctuations around 10–100µV (Niedermeyer 1999). If the
recording is made on the surface of the cortex, it is called electrocorticogram (ECoG).
In this case, the potential fluctuations are generally around 500–1500µV (Niedermeyer
1999). As the EEG originates mainly from the summated electrical activity of neurons
in the underlying cortex, the slow and simultaneous potential changes generated in large
cortical areas are favored (Fisch 1999). The tissues lying between the neurons and the
recording electrode, such as dura, skull, and skin, form an electrical volume conductor,
which greatly modifies the cortical signal before it reaches the recording electrode. In
addition to the attenuation, the signal spreads spatially so that the recording picked by
a single electrode represents the neural activity in a wide area. Simulations have shown
that about 50% of the measured scalp potential comes from sources within a 3 cm radius
of the electrode center, whereas a radius of 6 cm covers 95% of the potetial (Nunez
et al.1997). EEG thus reflects the summation of the synchronous activity of thousands
or millions of neurons with a similar spatial orientation (Huttunenet al.2006).
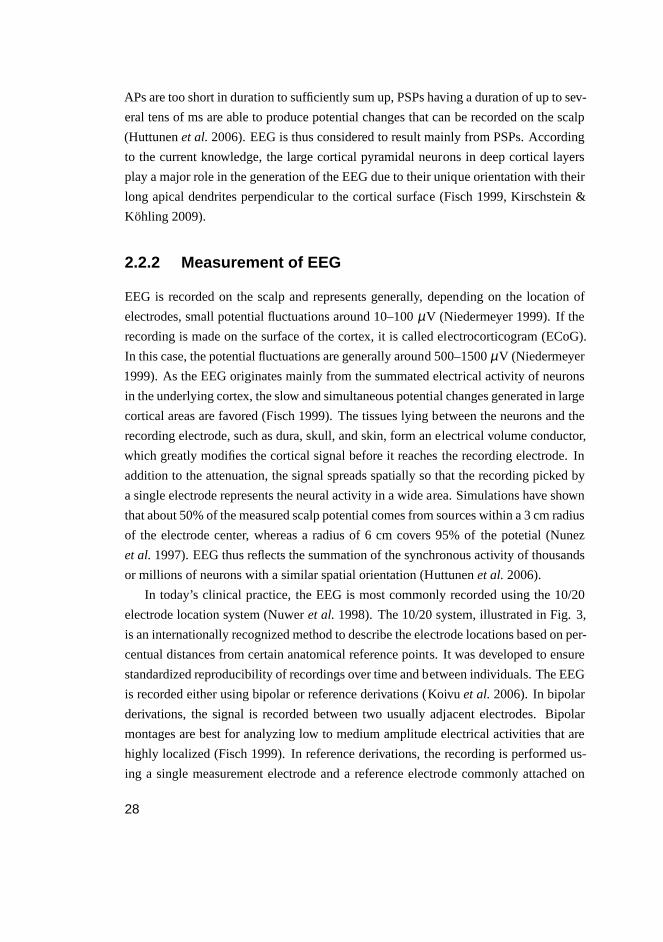
In today’s clinical practice, the EEG is most commonly recorded using the 10/20
electrode location system (Nuweret al.1998). The 10/20 system, illustrated in Fig. 3,
is an internationally recognized method to describe the electrode locations based on per-
centual distances from certain anatomical reference points. It was developed to ensure
standardized reproducibility of recordings over time and between individuals. The EEG
is recorded either using bipolar or reference derivations (Koivuet al.2006). In bipolar
derivations, the signal is recorded between two usually adjacent electrodes. Bipolar
montages are best for analyzing low to medium amplitude electrical activities that are
highly localized (Fisch 1999). In reference derivations, the recording is performed us-
ing a single measurement electrode and a reference electrode commonly attached on
28
Nasion
Inion
10%
10%
20%
20%
20%
20%
F3 F4Fz
Cz
Pz
F7 F8
Fp1
C4C3
P4P3
Fp2
T5 T6
T3 T4
O1 O2
Nasion
Inion
Vertex
F3 C3
CzFz
Fp1
O1
Pz
P3
T5T3
F7
10%
20%
20%
20%20%
10%
Fig. 3. The international 10/20 electrode location system.
mastoids or ear lobes (Koskinen 2006). Reference montages can be used to detect
widespread, high amplitude potentials that form similar and coherent waveforms in ad-
jacent electrodes (Fisch 1999). Sometimes, a common average is used as a reference.
In this approach, the reference is calculated by averaging the signals from all electrodes
to minimize the contribution of any single electrode to the total reference output (Fisch
1999).
Due to its low amplitude, EEG is highly sensitive to different kinds of artifacts.
These are signals recorded on the EEG that do not originate from the brain and can be
divided into physiological and nonphysiological artifacts. One of the major sources of
physiological contamination is the eye. The retina, lining the inner surface of the eye,
acts as a dipole in which the anterior pole is positive and the posterior pole is nega-
tive (Forresteret al. 2002). Eye movements and blinking thus result in a measurable
electrical signal called electro-oculogram (EOG) that often contaminates EEG record-
ings, especially in the frontal montages (Hari 2006b). The electrical activity of facial
muscles and heart may also distort the EEG by electromyogram (EMG) and electrocar-
diogram (ECG) artifacts, respectively. Nonphysiological artifacts are generated by the
patient’s surroundings. These distortions may originate from, for example, power lines,
monitoring devices, or insufficient electrode contacts.
29
0 1 2 3
−0.02
0
0.02
EEG (mV)
0 1 2 3−0.01
0
0.01
0 1 2 3−0.01
0
0.01
0 1 2 3−0.01
0
0.01
0 1 2 3−0.02
0
0.02
Time (s)
Beta (> 12 Hz)
Alpha (8−12 Hz)
Theta (4−8 Hz)
Delta (< 4 Hz)
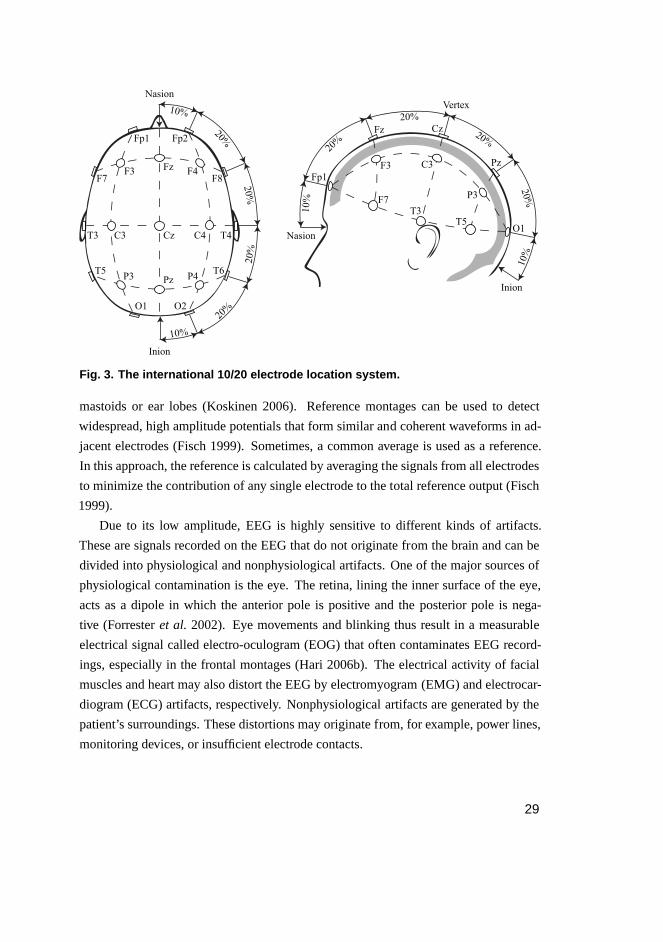
Fig. 4. The rhythmic components separated from waking state EEG.
2.2.3 Spontaneous rhythmic EEG activity
Despite the complex structure of human cortex, the neuronal activity of the brain does
not result in merely irregular EEG waves. Instead, a rhythmic EEG activity is often
observed (Huttunenet al.2006). The rhythmicity is considered to arise from the diverse
interactions between thalamus and cortex (Fisch 1999, Huttunenet al. 2006). Many
of the thalamic, thalamocortical, and cortical neurons have intrinsic oscillatory firing
properties allowing them to participate in the generation of a spontaneous rhythmic
EEG activity. Even though the frequency range of EEG has a fuzzy lower and upper
limit, the clinically relevant information is considered to lie between 0.3 Hz and 70
Hz (Niedermeyer 1999). Based on the frequency of oscillations, the EEG activity has
traditionally been divided into four classes: alpha, beta, theta, and delta. These rhythmic
components of EEG are illustrated in Fig. 4.
Alpha activity
Alpha waves are oscillations in the frequency range of 8–12 Hz. They arise from the
synchronous activity of thalamic pacemaker cells and are best observable during re-
30
laxed wakefulness (Hughes & Crunelli 2005). Strictly speaking, the term alpha activity
refers to the occipital around 10 Hz oscillation appearing with eyes closed (Berger 1929,
Kirschfeld 2005). Eye opening, drowsiness, and sleep suppress this activity (Tolonen &
Lehtinen 2006, Huttunenet al.2006). However, it has been shown that activity in alpha
frequency range can also be detected in other cortical areas (Niedermeyer 1997, Hughes
& Crunelli 2005). A common characteristic of all alpha waves is that they disappear
when the subject is exposed to an appropriate sensory stimulation or concentrates on
a mental task (Kirschfeld 2005, Huttunenet al. 2006). Certain neurological disorders
have also been shown to reduce the spontaneous alpha oscillations (Spiegelet al.2006,
Hughes & Crunelli 2005).
Beta activity
The high frequency EEG oscillations containing the frequencies above 12 Hz are called
beta activity. They can be observed in healthy adults in waking state, especially when
cognitively demanding tasks are performed and during excitement (Tolonen & Lehtinen
2006). Beta rhythms are most prominent in the frontal regions. GABAergic cortical in-
hibition is considered to have a significant role in the generation of beta oscillations.
This is because beta activity has been shown to be increased by GABA-agonistic drugs
(Huttunenet al.2006). The upper beta range (> 30 Hz) is sometimes called as gamma
range. As with alpha activity, suppression of beta activity can be related to some neuro-
logical disorders, such as cognitive impairment (Spiegelet al.2006).
Theta activity
Theta activity refers to frequency components in the 4–8 Hz range. Occipital cortical
theta activity is often observed in young children, before it changes to normal adult
background alpha activity (Huttunenet al. 2006). In older children and adults, theta
rhythms occur during drowsiness and light sleep, but not in the deepest stages of sleep
(Tolonen & Lehtinen 2006). The increase of spontaneous theta activity in waking state
is considered to indicate cortical deafferentation from subcortical structures and is char-
acteristic of, for example, certain mental diseases such as Alzheimer’s disease and vas-
cular dementia (Spiegelet al.2006).
31
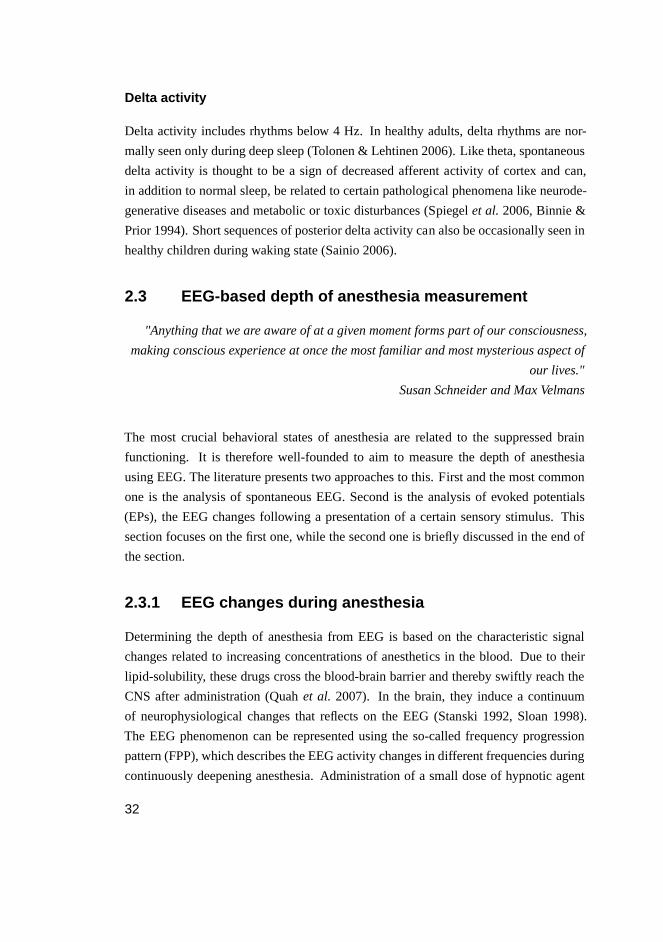
Delta activity
Delta activity includes rhythms below 4 Hz. In healthy adults, delta rhythms are nor-
mally seen only during deep sleep (Tolonen & Lehtinen 2006). Like theta, spontaneous
delta activity is thought to be a sign of decreased afferent activity of cortex and can,
in addition to normal sleep, be related to certain pathological phenomena like neurode-
generative diseases and metabolic or toxic disturbances (Spiegelet al. 2006, Binnie &
Prior 1994). Short sequences of posterior delta activity can also be occasionally seen in
healthy children during waking state (Sainio 2006).
2.3 EEG-based depth of anesthesia measurement
"Anything that we are aware of at a given moment forms part of our consciousness,
making conscious experience at once the most familiar and most mysterious aspect of
our lives."
Susan Schneider and Max Velmans
The most crucial behavioral states of anesthesia are related to the suppressed brain
functioning. It is therefore well-founded to aim to measure the depth of anesthesia
using EEG. The literature presents two approaches to this. First and the most common
one is the analysis of spontaneous EEG. Second is the analysis of evoked potentials
(EPs), the EEG changes following a presentation of a certain sensory stimulus. This
section focuses on the first one, while the second one is briefly discussed in the end of
the section.
2.3.1 EEG changes during anesthesia
Determining the depth of anesthesia from EEG is based on the characteristic signal
changes related to increasing concentrations of anesthetics in the blood. Due to their
lipid-solubility, these drugs cross the blood-brain barrier and thereby swiftly reach the
CNS after administration (Quahet al. 2007). In the brain, they induce a continuum
of neurophysiological changes that reflects on the EEG (Stanski 1992, Sloan 1998).
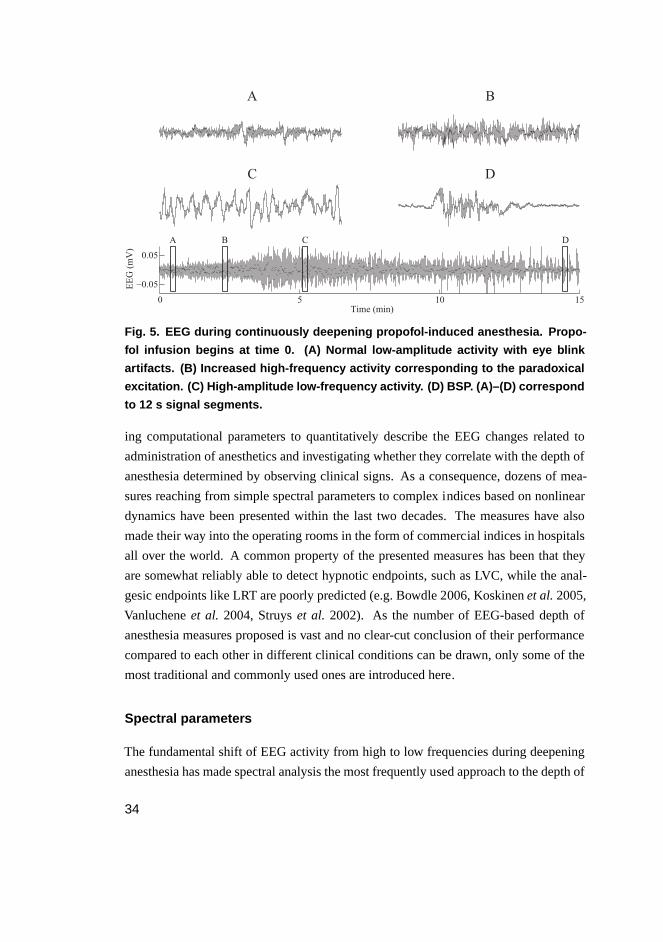
The EEG phenomenon can be represented using the so-called frequency progression
pattern (FPP), which describes the EEG activity changes in different frequencies during
continuously deepening anesthesia. Administration of a small dose of hypnotic agent
32
like propofol induces a state of sedation in which the EEG betaactivity is increased
(Brownet al.2010, McCarthyet al.2008). The state is called as paradoxical excitation
because the drug intended to induce unconsciousness induces EEG changes normally
related to excitement. As more of the drug is administered, a progressive slowing to
alpha, theta, and finally to delta frequencies is seen (Kuizengaet al.2001, Guginoet al.
2001, Kortelainenet al. 2008b). Simultaneously, the amplitude of EEG increases. In
very deep anesthesia, the EEG changes to BSP, in which low amplitude suppression
periods and high amplitude bursts take turns (Sonkajärviet al.2008). If the dose is still
increased, the occurrence of bursts decreases and the periods of suppressions become
longer until finally an isoelectric tracing is reached (Koskinen 2006, Brownet al.2010).
During emergence, the EEG patterns proceed in approximately reverse order compared
to the induction (Brownet al. 2010, Breshearset al. 2010). The propofol-induced
EEG changes are illustrated in Fig. 5. Similar phenomenon is seen when using other
GABAergic IV or inhaled hypnotic agents, such as barbiturates, etomidate, sevoflurane,
isoflurane, or desflurane (Mahlaet al.2005, Brownet al.2010). With some anesthetics
like ketamine and nitrous oxide, which primarily act through the excitatory NMDA
receptors, the EEG does not follow the basic FPP and BSP is not attained (Hirota 2006,
Mahlaet al.2005).
The effects of anesthetics in the brain are widespread affecting the topographic char-
acteristics of EEG. Most hypnotic drugs decrease the posterior alpha activity, normally
present during relaxed wakefulness, soon after beginning of administration (Dierkset al.
1992, Mahlaet al.2005). Guginoet al. (2001) showed that, with propofol and sevoflu-
rane, the FPP is most prominently seen in frontal montages as the activity is highest
in anterior cortex during anesthesia. This "frontal predominance" or "anteriorization"
(Tinkeret al.1977), in addition to the convenience in terms of electrode placement, has
led to the common practice of using frontal EEG for the depth of anesthesia estimation.
The practice is supported by the fact that the hypnotic components of anesthesia are
considered to arise from the functional suppression of prefrontal cortex, which is the
most anterior part of frontal lobes (John & Prichep 2005).
2.3.2 Measures of depth of anesthesia
The fundamental idea of the EEG-based depth of anesthesia measurement is to be able
to reliably relate the observed changes in the signal characteristics to the altered anes-
thetic state of the patient. Generally, the problem has been approached by develop-
33
0 5 10 15
−0.05
0.05
EEG (mV)
Time (min)
A B
C D
C DBA
Fig. 5. EEG during continuously deepening propofol-induced anesth esia. Propo-
fol infusion begins at time 0. (A) Normal low-amplitude activity with eye blink
artifacts. (B) Increased high-frequency activity corresponding to the paradoxical
excitation. (C) High-amplitude low-frequency activity. (D) BSP. (A)–(D) correspond
to 12 s signal segments.
ing computational parameters to quantitatively describe the EEG changes related to
administration of anesthetics and investigating whether they correlate with the depth of
anesthesia determined by observing clinical signs. As a consequence, dozens of mea-
sures reaching from simple spectral parameters to complex indices based on nonlinear
dynamics have been presented within the last two decades. The measures have also
made their way into the operating rooms in the form of commercial indices in hospitals
all over the world. A common property of the presented measures has been that they
are somewhat reliably able to detect hypnotic endpoints, such as LVC, while the anal-
gesic endpoints like LRT are poorly predicted (e.g. Bowdle 2006, Koskinenet al.2005,
Vanlucheneet al. 2004, Struyset al. 2002). As the number of EEG-based depth of
anesthesia measures proposed is vast and no clear-cut conclusion of their performance
compared to each other in different clinical conditions can be drawn, only some of the
most traditional and commonly used ones are introduced here.
Spectral parameters
The fundamental shift of EEG activity from high to low frequencies during deepening
anesthesia has made spectral analysis the most frequently used approach to the depth of
34
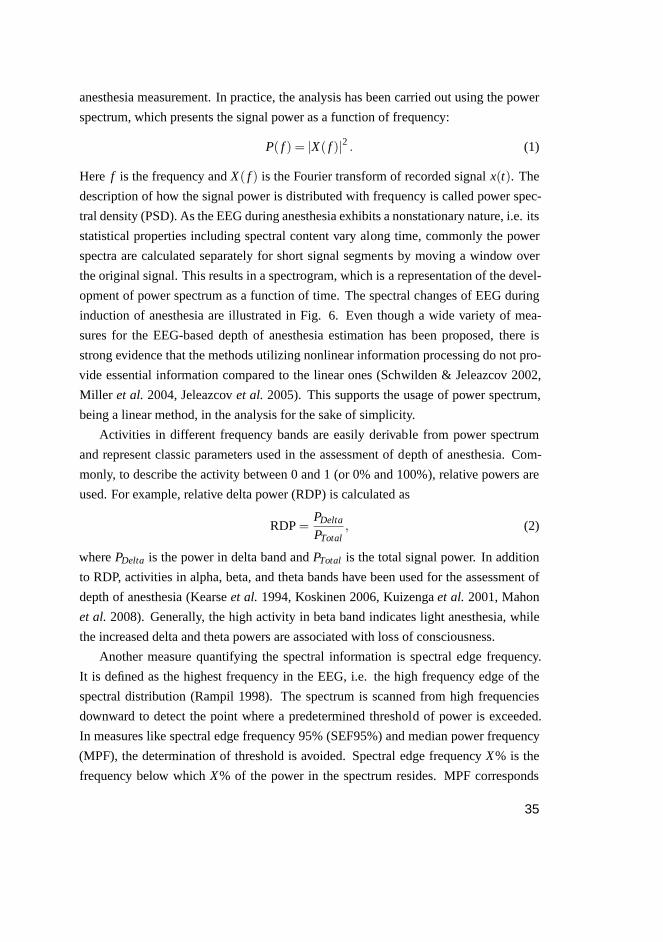
anesthesia measurement. In practice, the analysis has been carried out using the power
spectrum, which presents the signal power as a function of frequency:
P( f ) = |X( f )|2 . (1)
Here f is the frequency andX( f ) is the Fourier transform of recorded signalx(t). The
description of how the signal power is distributed with frequency is called power spec-
tral density (PSD). As the EEG during anesthesia exhibits a nonstationary nature, i.e. its
statistical properties including spectral content vary along time, commonly the power
spectra are calculated separately for short signal segments by moving a window over
the original signal. This results in a spectrogram, which is a representation of the devel-
opment of power spectrum as a function of time. The spectral changes of EEG during
induction of anesthesia are illustrated in Fig. 6. Even though a wide variety of mea-
sures for the EEG-based depth of anesthesia estimation has been proposed, there is
strong evidence that the methods utilizing nonlinear information processing do not pro-
vide essential information compared to the linear ones (Schwilden & Jeleazcov 2002,
Miller et al. 2004, Jeleazcovet al. 2005). This supports the usage of power spectrum,
being a linear method, in the analysis for the sake of simplicity.
Activities in different frequency bands are easily derivable from power spectrum
and represent classic parameters used in the assessment of depth of anesthesia. Com-
monly, to describe the activity between 0 and 1 (or 0% and 100%), relative powers are
used. For example, relative delta power (RDP) is calculated as
RDP=PDelta
PTotal, (2)
wherePDelta is the power in delta band andPTotal is the total signal power. In addition
to RDP, activities in alpha, beta, and theta bands have been used for the assessment of
depth of anesthesia (Kearseet al. 1994, Koskinen 2006, Kuizengaet al. 2001, Mahon
et al. 2008). Generally, the high activity in beta band indicates light anesthesia, while
the increased delta and theta powers are associated with loss of consciousness.
Another measure quantifying the spectral information is spectral edge frequency.
It is defined as the highest frequency in the EEG, i.e. the high frequency edge of the
spectral distribution (Rampil 1998). The spectrum is scanned from high frequencies
downward to detect the point where a predetermined threshold of power is exceeded.
In measures like spectral edge frequency 95% (SEF95%) and median power frequency
(MPF), the determination of threshold is avoided. Spectral edge frequencyX% is the
frequency below whichX% of the power in the spectrum resides. MPF corresponds
35
A
Fre
qu
ency
(H
z)
0 1 2 3 4 5 60
5
10
15
20
25
B
Fre
qu
ency
(H
z)
Time (min)
0 1 2 3 4 5 60
5
10
15
20
25
0 2 4 6
1
2
24−
28 H
z
A
U
C
0 2 4 6
1
2
20−
24 H
z
A
U
0 2 4 6
1
2
16−
20 H
z
A
U
0 2 4 6
1
2
12−
16 H
z
A
U
0 2 4 6
1
2
8−
12 H
z
A
U
0 2 4 6
1
2
4−
8 H
z
A
U
0 2 4 6
1
2
0.5
−4 H
z
A
U
Time (min)
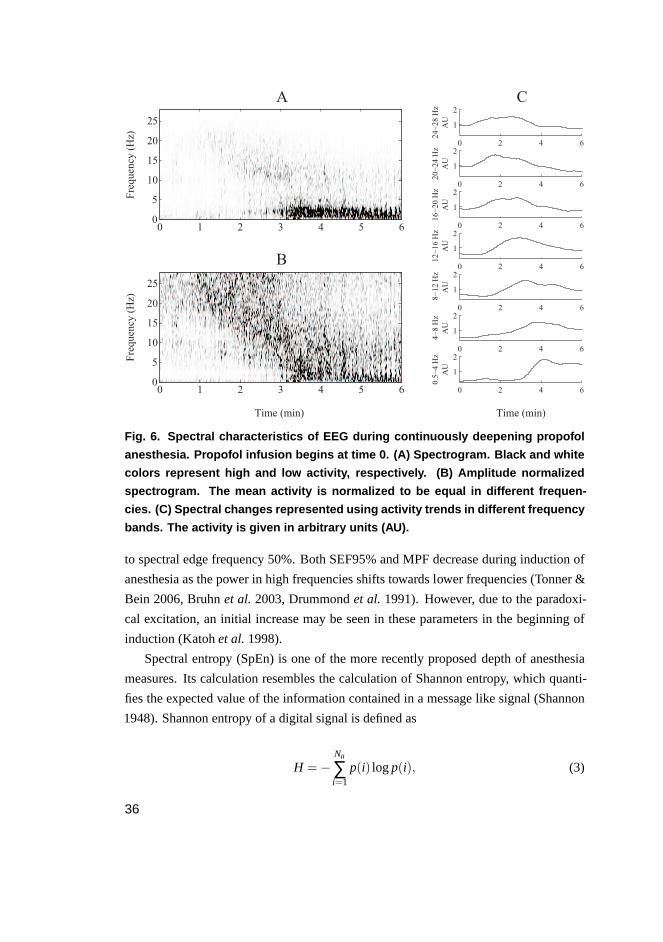
Fig. 6. Spectral characteristics of EEG during continuously deepe ning propofol
anesthesia. Propofol infusion begins at time 0. (A) Spectrogram. Black and white
colors represent high and low activity, respectively. (B) Amplitude normalized
spectrogram. The mean activity is normalized to be equal in different frequen-
cies. (C) Spectral changes represented using activity trends in different frequency
bands. The activity is given in arbitrary units (AU).
to spectral edge frequency 50%. Both SEF95% and MPF decrease during induction of
anesthesia as the power in high frequencies shifts towards lower frequencies (Tonner &
Bein 2006, Bruhnet al. 2003, Drummondet al. 1991). However, due to the paradoxi-
cal excitation, an initial increase may be seen in these parameters in the beginning of
induction (Katohet al.1998).
Spectral entropy (SpEn) is one of the more recently proposed depth of anesthesia
measures. Its calculation resembles the calculation of Shannon entropy, which quanti-
fies the expected value of the information contained in a message like signal (Shannon
1948). Shannon entropy of a digital signal is defined as
H =−Na
∑i=1
p(i) logp(i), (3)
36
whereNa is the number of all possible amplitude values in the signal andp(i) is the
probability for theith value. According to Eq. 3, Shannon entropy is low when the
signal samples are concentrated on a small set of amplitude values and increases the
more uniformly the samples spread to all possible values. In the calculation of SpEn,
the Shannon equation is applied to the PSD of the signal (Powell & Percival 1979,
Inouyeet al. 1991). Therefore, it can be seen as a measure of the flatness of signal’s
power spectrum and is calculated as
HS=−fh
∑i= fl
Pn(i) logPn(i), (4)
where fl and fh are the lower and higher limits of the used frequency band, respectively,
andPn is the normalized power spectrum (∑ fhi= fl
Pn(i) = 1) of the signal. Commonly,
SpEn is normalized to yield only values between 0 and 1 as follows:
SpEn=HS
logNf. (5)
HereNf is the number of frequency components in the range[ fl , fh]. During induction
of anesthesia, the wide-band EEG activity shifts to lower frequencies resulting in a more
spike-like power spectrum. In SpEn, this is seen as a decrease. SpEn has therefore been
suggested to indicate the changes in cortical neuronal interactions (Sleighet al.2004).
The usage of power spectrum and derived parameters for EEG analysis has also
some limitations. In this approach, the EEG is assumed to be composed of a set of sine-
like waves with different amplitudes and frequencies. However, this might not always
be the case. For example, the waves with low frequency are often sawtoothed and hence
may erroneously influence the relatively small amplitude high frequency activity in the
power spectral analysis.
Fig. 7 elucidates the behavior of RDP, SEF95%, and SpEn during induction of
anesthesia.
Commercial indices
Bispectral Index, known by the trademarked acronym BIS (Aspect Medical Systems
Inc., Newton, MA), is by far the most commonly used and studied commercial index
of depth of anesthesia. According to the manufacturer, the technology has been used
for more than 34 million patients and 3,300 scientific publications. BIS is a dimension-
less univariate parameter that varies between 100 and 0, lower values indicating deeper
37
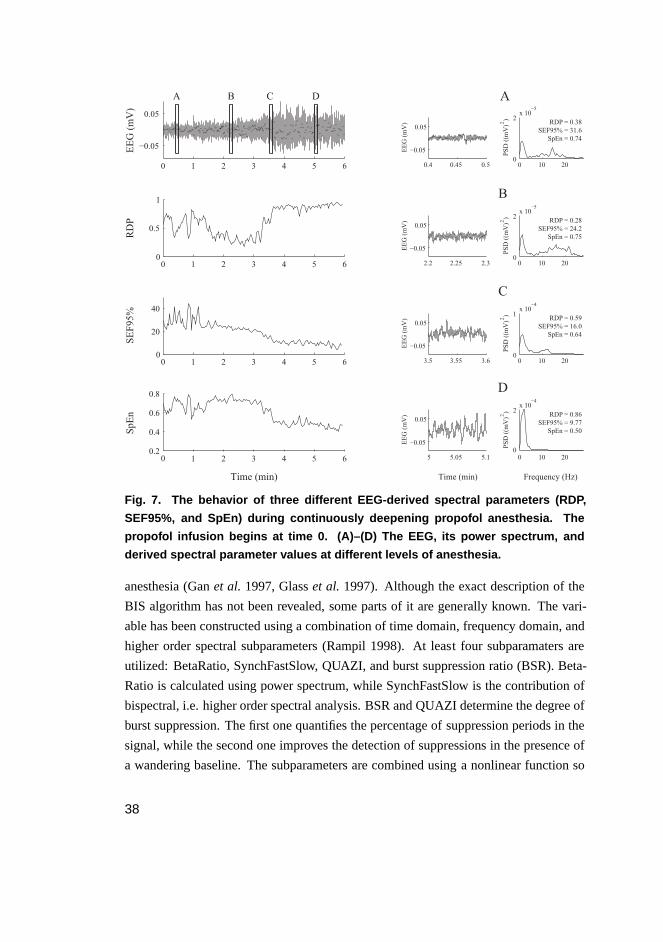
0 1 2 3 4 5 6
−0.05
0.05
EEG (mV)
00
0.5
1
RDP
00
20
40
SEF95%
00.2
0.4
0.6
0.8
Time (min)
SpEn
0.4 0.45 0.5
−0.05
0.05
EEG (mV)
2.2 2.25 2.3
−0.05
0.05
EEG (mV)
3.5 3.55 3.6
−0.05
0.05
EEG (mV)
5 5.05 5.1
−0.05
0.05
EEG (mV)
Time (min)
0 10 200
2x 10
−5
PSD ((mV) )
A
0 10 200
2x 10
−5
PSD ((mV) )
0 10 200
1x 10
−4
PSD ((mV) )
0 10 200
2x 10
−4
PSD ((mV) )
Frequency (Hz)
A B C D
22
22
B
C
D
RDP = 0.38
SEF95% = 31.6
SpEn = 0.74
RDP = 0.28
SEF95% = 24.2
SpEn = 0.75
RDP = 0.59
SEF95% = 16.0
SpEn = 0.64
RDP = 0.86
SEF95% = 9.77
SpEn = 0.50
1 2 3 4 5 6
1 2 3 4 5 6
1 2 3 4 5 6
Fig. 7. The behavior of three different EEG-derived spectral para meters (RDP,
SEF95%, and SpEn) during continuously deepening propofol anesthesia. The
propofol infusion begins at time 0. (A)–(D) The EEG, its power spectrum, and
derived spectral parameter values at different levels of anesthesia.
anesthesia (Ganet al. 1997, Glasset al. 1997). Although the exact description of the
BIS algorithm has not been revealed, some parts of it are generally known. The vari-
able has been constructed using a combination of time domain, frequency domain, and
higher order spectral subparameters (Rampil 1998). At least four subparamaters are
utilized: BetaRatio, SynchFastSlow, QUAZI, and burst suppression ratio (BSR). Beta-
Ratio is calculated using power spectrum, while SynchFastSlow is the contribution of
bispectral, i.e. higher order spectral analysis. BSR and QUAZI determine the degree of
burst suppression. The first one quantifies the percentage of suppression periods in the
signal, while the second one improves the detection of suppressions in the presence of
a wandering baseline. The subparameters are combined using a nonlinear function so
38
that their weighting varies at different anesthetic levels.Their calculation is preceded
by artifact removal, including elimination of ECG, EOG, wandering baseline, and high
variance noise contaminations.
M-ENTROPY (GE Healthcare Finland, Helsinki, Finland) is a depth of anesthesia
index based on calculation of SpEn. Unlike that of BIS, the full description of M-
ENTROPY algorithm has been published (Viertiö-Ojaet al. 2004). In M-ENTROPY,
the depth of anesthesia is expressed using three variables: state entropy (SE), response
entropy (RE), and BSR. SE and RE represent the SpEn calculated using frequency
bands of 0.8–32 Hz and 0.8–47 Hz, respectively. The frequency components for SpEn
are obtained using time windows of varying length: longer windows for lower frequen-
cies are used. The rational behind separating SE and RE into different variables is that
the EMG activity of facial muscles is considered to lie mostly between 32 and 47 Hz.
As the appearance of such a signal during surgery may indicate the response to painful
stimulation, the RE-SE-difference is considered to give information about the level of
analgesia. SE and RE are normalized in such a way that RE becomes equal to SE when
EMG power (sum of spectral power between 32 Hz and 47 Hz) is equal to zero. As
a consequence, RE ranges from 0 to 100, whereas SE varies between 0 and 91, low
values indicating deep anesthesia. The algorithm applied in the calculation of BSR is
presented in Särkeläet al. (2002). As with BIS, the calculation of parameters is pre-
ceded by extensive automatic removal of artifacts (electrocautery, ECG, EMG, EOG,
and movement).
In addition to BIS and M-ENTROPY, several other commercial indices, such as Nar-
cotrend (Schultzet al. 2002), Patient State Index (Prichepet al. 2004), Cerebral State
Index (Andersonet al.2005), and Index of Consciousness (Revueltaet al.2008), have
recently been proposed. All the indices rely more or less on the quantification of the
shift of EEG activity from high to low frequencies, which is a phenomenon seen with
GABAergic anesthetics like propofol (Voss & Sleigh 2007). The differences mainly
concern the details of how this is achieved and how, for example, various artifacts are
handled. None of the indices is able to measure the effect of anesthetics primarily acting
through NMDA receptors like ketamine.
2.3.3 Multidrug administration
One of the major reasons that the EEG has been difficult to use for assessing the depth
of anesthesia is that many different classes of anesthetic drugs, all of which significantly
39
influence EEG, are nowadays used simultaneously (Mahlaet al. 2005). While the ef-
fects of two different GABAergic hypnotic drugs on EEG and depth of anesthesia are
mainly additive, this might not be the case with the drugs representing different phar-
macodynamic profiles. Of major concern are the centrally acting analgesic drugs, such
as opioids and nitrous oxide, often given as a supplement to the hypnotic agents. The
mechanisms of action of these drugs differ from those of hypnotic agents resulting in
distinct neurophysiological changes and thereby challenging the EEG-based depth of
anesthesia measurement.
Opioids
Most of the opioids used during general anesthesia represent similar pharmacodynamic
properties, i.e.µ receptor agonism (Fukuda 2005). The EEG changes induced by these
drugs are therefore comparable. When opioids are administered as single agents, the
changes consist of decreasing frequency and increasing amplitude, culminating even-
tually in delta activity at maximal drug effect (Scottet al. 1985, Eganet al. 1996). In
contrast to the GABAergic hypnotic agents, a ceiling effect is seen with opioids. Once
this ceiling has been obtained, increasing opioid dosage does not further affect the EEG
(Chi et al. 1991). BSP and flat EEG are thus not attained with opioids. Furthermore,
opioids do not induce increased frontal beta activity related to paradoxical excitation
(Mahlaet al.2005). When high doses are given, the opioids do, however, induce muscle
rigidity and increase the EMG which sometimes is falsely interpreted as high frequency
EEG activity (Rennaet al.2002). Due to the difference between EEG changes induced
by opioids and hypnotic agents, EEG analysis is not routinely used for monitoring depth
of opioid anesthesia (Fukuda 2005), even though for example BIS has been stated to be
suitable for this purpose (e.g. Glasset al.1997).
When opioids are given as a supplement to hypnotic agents, which is the common
practice in the operating rooms today, the EEG-based depth of anesthesia measurement
becomes difficult. Intuitively, increasing the dosage of anesthetics by adding an opioid
to the hypnotic agent would result in deeper anesthesia. However, as the mechanisms
of action and thereby the induced neurophysiological changes of these two drugs differ,
an additive effect on EEG cannot be guaranteed. The effects of the drugs also focus on
different anesthetic components (hypnosis vs. analgesia) influencing the characteristics
of anesthesia, which further complicates the interpretation of EEG changes. Conse-
quently, the multidrug anesthesia induced by combining an opioid to a hypnotic agent
40
has been raised as one of the major problems in the field of EEG-based depth of anes-
thesia measurement (e.g. Sleigh 2010, Mahlaet al. 2005, Kissin 2000). The issue is
also frequently addressed in the recent studies. A total of 46 papers, published between
1996 and 2011, were found to more or less focus on investigating the effects of opi-
oids on depth of anesthesia assessment using EEG. No comprehensive review of this
large body of literature has appeared yet. Basically, the studies approach the problem
by selecting a reference measure (control variable) for depth of anesthesia and then
observe if another measure is affected by the coadministration of opioids compared to
this reference. The reference is generally chosen between clinical signs (e.g. separate
clinical endpoints or OAA/S scale), the administration of hypnotic drug (e.g. effect-site
concentration or MAC value), and EEG-based measure (e.g. BIS or activity in a cer-
tain frequency band). The observed measure is also usually chosen among these three
measures. The summarized results of the 46 papers are presented in Table 2 and Fig. 8.
In nine studies, clinical signs were used as a reference for depth of anesthesia. The
majority of these reported that the same anesthetic state in terms of clinical signs was
reached with lower doses of a hypnotic agent and the EEG-based measure referring
to lighter anesthesia when opioids were coadministrated. The results suggest that opi-
oids mainly affect the clinical state of the patient and not as much the EEG measure.
However, in two of the nine studies, the hypnotic agent and opioid showed an additive
effect on EEG-derived parameter, i.e. the clinical state and EEG measure correlated
well regardless of the hypnotic-opioid ratio.
The majority of the studies examined the effect of opioids by choosing the hypnotic
drug administration as the reference for depth of anesthesia. From the 27 publications,
14 reported that opioids affect the EEG or EEG-derived index when given with a hyp-
notic drug. On the other hand, 13 studies were unable to show such an effect. When
affected, EEG indices uniformly shifted towards deeper anesthesia suggesting an addi-
tive effect of the drugs. In four of the 27 studies, the coadministration of opioids was
also reported to result in deeper anesthesia in terms of clinical signs.
Ten studies used an EEG-based measure as a reference for depth of anesthesia.
Most of these investigated whether a coadministered opioid affects the consumption
of a hypnotic agent when anesthesia is titrated using an EEG-derived index (e.g. BIS
kept between 40 and 50). Seven out of eight showed an additive drug effect leading to
the reduced consumption of a hypnotic agent. In addition, two studies examined the
effect of coadministration of an opioid on the EEG measure itself during steady state
anesthesia. From these, one reported a significant shift towards deeper anesthesia.
41
Tabl
e2.
Effe
ctof
coad
min
istr
atio
nof
opio
ids
onE
EG
-bas
edde
pth
ofan
esth
esia
mea
sure
men
t.
Pub
licat
ion
Opi
oid
Hyp
notic
Ref
eren
ce/
Effe
ct
Pub
licat
ion
Opi
oid
Hyp
notic
Ref
eren
ce/
Effe
ctYu
fune
etal
.(20
11)
RP
H/E
–B
illar
det
al.(
2004
)R
DE
/H–
Lile
yet
al.(
2010
)R
PH
/E+
Fuj
iiet
al.(
2009
)F
PH
/E–
Büt
tner
etal
.(20
10)
RP
E/H
↑Yu
mur
aet
al.(
2009
)F
PH
/E–,
C↓
von
Din
ckla
geet
al.(
2010
)R
PH
/E↓
Mie
tal.
(200
4)F
PC
/E↑
Fer
enet
set
al.(
2007
)R
PH
/E+
Kod
aka
etal
.(20
04)
FP
C/E
↑,H↑
Man
yam
etal
.(20
07)
RP
H/E
–,C↓
Ant
unes
etal
.(20
03)
FP,
IH
/E+
Fer
reira
etal
.(20
06)
RP
H/E
↓M
ieta
l.(2
003)
FP
C/E
–,H↑
Mus
tola
etal
.(20
05)
RP
C/E
↑,H↑
Nak
ayam
aet
al.(
2002
)F
PH
/E–
Van
luch
ene
etal
.(20
04)
RP
H/E
+B
arr
etal
.(20
00)
FP
C/E
↑B
ouill
onet
al.(
2004
)R
PH
/E↓
Mie
tal.
(199
9)F
PC
/E↑,
H↑
Sch
mid
teta
l.(2
004)
RP
H/E
–W
erry
etal
.(19
96)
FP
C/E
–,H↑
Str
uys
etal
.(20
03)
RP
C/E
↑R
öpck
eet
al.(
1999
)F
IE
/H↑
Bar
vais
etal
.(20
03)
RP
H/E
–D
utto
net
al.(
1996
)F
IH
/E+
Fec
hner
etal
.(20
03)
RP
E/H
↑S
chw
ilden
etal
.(20
03)
AP
E/H
↑N
ieuw
enhu
ijset
al.(
2003
)R
PH
/E–
Isel
in-C
have
set
al.(
1998
)A
PH
/E–
Sch
mid
teta
l.(2
002)
RP
H/E
+N
atha
net
al.(
2004
)A
SH
/E–,
C↓
Koi
taba
shie
tal.
(200
2)R
PE
/E↓
Dah
anet
al.(
2001
)A
SH
/E–
Röp
cke
etal
.(20
01)
RP
E/H
↑F
ores
tier
etal
.(20
03)
SP
E/H
↑Ly
sako
wsk
ieta
l.(2
001)
R,F
,A,S
PC
/E↑,
H↑
Hen
tgen
etal
.(20
02)
SP
E/H
↑S
trac
han
&E
dwar
ds(2
000)
RP
H/E
↓,C↓
Hen
ao-G
uerr
ero
etal
.(20
09)
MI
H/E
–G
uign
ard
etal
.(20
00)
RP
H/E
–C
oetz
eeet
al.(
1996
)T
PH
/E+
Mun
cast
eret
al.(
2003
)R
SH
/E+
Fod
ale
etal
.(20
05)
TS
E/E
–O
lofs
enet
al.(
2002
)R
SH
/E+
Vau
ghan
etal
.(20
00)
TI
H/E
+
Opi
oid:
rem
ifent
anil
(R),
fent
anyl
(F),
alfe
ntan
il(A
),su
fent
anil
(S),
mor
phin
e(M
),tr
amad
ol(T
)
Hyp
notic
:pr
opof
ol(P
),se
voflu
rane
(S),
desfl
uran
e(D
),is
oflur
ane
(I)
Ref
eren
ce/E
ffect
isgi
ven
asX
/YZ,
whe
reX
isth
ere
fere
nce
agai
nstw
hich
Yis
com
pare
dan
dZ
isth
eef
fect
inY
indu
ced
byth
eco
adm
inis
trat
ion
ofop
ioid
.
Xan
dY
:cl
inic
alsi
gns
(C),
hypn
otic
drug
adm
inis
trat
ion
(H),
EE
Gor
EE
G-d
eriv
edin
dex
(E)
Z:
chan
ged
(+),
chan
ged
tow
ards
light
eran
esth
esia
(↑),
chan
ged
tow
ards
deep
eran
esth
esia
(↓),
did
notc
hang
e(–
)
42
+−
05
10
15
C+
−05
10
15
+−
05
10
15
+−
05
10
15
H
+−
05
10
15
+−
05
10
15
+−
05
10
15
E
C
+−
05
10
15
H
+−
05
10
15
E
↑↓
05
10
15
↑↓
05
10
15
↑↓
05
10
15
↑↓
05
10
15
↑↓
05
10
15
↑↓
05
10
15
↑↓
05
10
15
C
↑↓
05
10
15
H
↑↓
05
10
15
E
Effect
Reference
AB
Fig
.8.
Effe
cts
ofco
adm
inis
trat
ion
ofop
ioid
son
the
EE
G-b
ased
dept
hof
anes
thes
iam
easu
rem
ent.
Res
ults
sum
mar
ized
from
Tabl
e2.
Bar
sin
dica
teth
enu
mbe
rof
stud
ies.
(A)
Effe
cts
inte
rms
of"c
hang
ed"
/"di
dno
tcha
nge"
.H
ere,
+in
clud
es
allt
ypes
ofch
ange
s,i.e
.+
,↑,a
nd↓
ofTa
ble
2.(B
)T
hedi
rect
ion
ofef
fect
inte
rms
ofde
pth
ofan
esth
esia
.
43
Overall, the papers published on how opioids affect the EEG-based depth of anesthe-
sia measurement represent a heterogeneous group of studies, in which the application
of different drug combinations, EEG measures, and clinical protocols fundamentally
complicate the comparison of results. However, based on the findings presented above,
some conclusions can be drawn. Firstly, opioids clearly affect the depth of anesthesia in
terms of clinical signs when given with a hypnotic agent. There is strong evidence that
this shift in the anesthetic state is not adequately reflected on the EEG-derived measures,
which hinders the interpretation of commercial indices like BIS during hypnotic-opioid
anesthesia. Secondly, opioids seem to somehow affect the EEG when given with hyp-
notic agents. Even though some studies propose the effect of these drugs on the EEG to
be additive, the drugs’ pharmacodynamic profiles and a number of other studies suggest
otherwise. The opioids seem to somewhat uniquely change the EEG leading to altered
behavior of EEG-derived measures at different anesthetic levels. This further compli-
cates the usage of commercial indices during hypnotic-opioid anesthesia, as they have
been developed for GABAergic hypnotic drugs.
2.3.4 Evoked potentials
In addition to the analysis of spontaneous EEG, EPs have been used for depth of anes-
thesia measurement. EPs are the waveforms seen in the EEG following a presentation
of stimulus. Due to the low amplitude of EPs compared to spontaneous EEG, they are
typically constructed by averaging tens or hundreds of EEG epochs triggered by a con-
trolled stimulus (Koskinen 2006). EP waveforms contain peaks that are described in
terms of features like latency and amplitude (Mahlaet al. 2005). There are three ba-
sic types of EPs, auditory evoked potentials (AEPs), somatosensory evoked potentials,
and visual evoked potentials, distinguished by the sensory system the stimulus is given
through. All three types have been applied for depth of anesthesia monitoring, AEPs be-
ing by far the most used one (Plourde 2006). The monitoring is based on characteristic
changes in the EP waveforms related to increasing concentration of anesthetic drug in
the blood. For example, in AEPs, the most general anesthetics increase the latency and
decrease the amplitude of the peaks in a concentration-dependent manner (Thornton &
Sharpe 1998, Gotoet al.2001). A-Line ARX index (AAI) is a commercial index utiliz-
ing AEPs and autoregressive modeling for depth of anesthesia measurement (Plourde
2006, Jensenet al.1998).
Several studies comparing the analysis of spontaneous EEG and EPs in depth of
44
anesthesia measurement have been published. In practice, the comparison has been
usually carried out by evaluating the performance of different commercial indices like
BIS and AAI. Neither of the approaches has shown a clear-cut superiority (Struyset al.
2002, Kreueret al. 2003b, Iannuzziet al. 2007, Fahlenkampet al. 2010, Liaoet al.
2011). Both spontaneous EEG and EPs seem to reveal information on the loss of con-
sciousness but do not predict well the response to noxious stimulation (Struyset al.
2002, 2003). However, from the monitoring point of view, the analysis of spontaneous
EEG provides certain advantages. It does not need separate equipment for the genera-
tion of stimuli. In addition, it is less susceptible to the interindividual variation in the
functionality of sensory systems such as hearing impairment.
45

46
3 Research contributions
This chapter summarizes the research contributions of the original Publications I–V. In
Paper I, a method to quantitatively describe the EEG FPP related to induction of anes-
thesia is proposed. The method is utilized in all four subsequent Publications (II–V).
Paper II illustrates the effect of remifentanil on the relation of clinical endpoints and
EEG changes, i.e. FPP, during propofol anesthesia. In Paper III, the effects of remifen-
tanil on EEG during propofol-induced anesthesia are examined. Paper IV proposes an
EEG-based technology for the assessment of depth of anesthesia during multidrug in-
fusion with propofol and remifentanil. In Paper V, a novel approach to assess EEG
changes during anesthesia by exploiting a non-linear dimensionality reduction method,
Isomap, is presented. All papers utilize the same data set explained in Section 1.3,
although in some studies, only a subset of it is used.
3.1 Quantification of EEG changes during induction ofanesthesia
As explained in Section 2.3.1, hypnotics at low doses increase frequency of the EEG,
whereas at high doses the EEG is depressed. This biphasic response makes it difficult
to clearly distinguish the exact anesthetic state of a patient using simple measures like
MPF or SEF95%. A more adequate quantitative description of the EEG changes during
induction of anesthesia is therefore needed. In the original publications, two different
methods for this are proposed.
3.1.1 The advanced r scale
The first method, presented in Paper I, is based on the assumption that, for all patients,
the EEG goes through similar activity changes in different frequency bands, i.e. FPP,
during induction of anesthesia. Due to the interindividual variability in response to
the anesthetic agent, the duration of this pattern may vary between individuals, but a
certain phase of the pattern corresponds to the same depth of anesthesia regardless of
the patient. The pattern thus relates the EEG spectral changes to the depth of anesthesia.
In the presented method, activity trends calculated using eight different frequency bands
47
(0.5–4 Hz, 4–8 Hz, 8–12 Hz, 12–16 Hz, 16–20 Hz, 20–24 Hz, 24–28 Hz, and 0.5–28
Hz) are utilized to describe the spectral changes during a continuous fixed rate infusion
of propofol. An example of such activity trends was given in Fig. 6. Using linear time
scaling, the activity trends of different patients are iteratively superimposed with those
of other patients leading to a uniform representation of the FPP. The superimposed
trends cannot be given as a function of absolute time anymore because the trends of
each patient have been scaled in time with a different individual factor. Instead, a new
variable,r, for relative time is used. Ther scale, representing the phase of the FPP, is
defined using the beginning of propofol infusion (r = 0) and the occurrence of endpoint
LVC (r = 1). It can thus be considered to describe the continuum of EEG spectral
changes occurring during induction of anesthesia with propofol: the higher the value,
the deeper the anesthesia.
In its original form, presented in Koskinenet al. (2005), ther scale was used to de-
scribe only the FPP between the beginning of propofol infusion and LVC. At that time,
superimposing of the activity trends was performed by scaling the signals in time using
the time of the LVC. Ther values were thus strictly dependent on the occurrence of
LVC. In the above-presented advancedr scale, the shapes of the activity trends between
the beginning of infusion and the onset of BSP are used to find the optimal time scaling
factor for each individual. Hence,r represents the phase of the EEG FPP rather than
merely the relative time compared to the occurrence of a certain endpoint. However,
since LVC tends to occur at a certain location on the FPP, the endpoint is still utilized to
give a numerical representation for the time scaled activity trends. Because time scaling
results in a unique position of LVC on the FPP for each patient, the median of the LVC
locations is now used to indicater value 1. While the algorithm for the calculation of
FPP using iterative time scaling of activity trends is proposed in Paper I, the advanced
r scale is presented for the first time in Paper II. The method for the calculation of new
r scale was developed as our preliminary results showed that remifentanil affects the
relation of clinical endpoints and EEG FPP and we therefore did not want to bind the
calculation of FPP to the LVC. The determination of the original and advancedr scales
is illustrated in Fig. 9 using activity trends of one frequency band.
3.1.2 Isomap-based approach
In Paper V, a somewhat similar but more holistic approach to quantify EEG changes
during induction of anesthesia is taken. The approach consists in the fact that the contin-
48
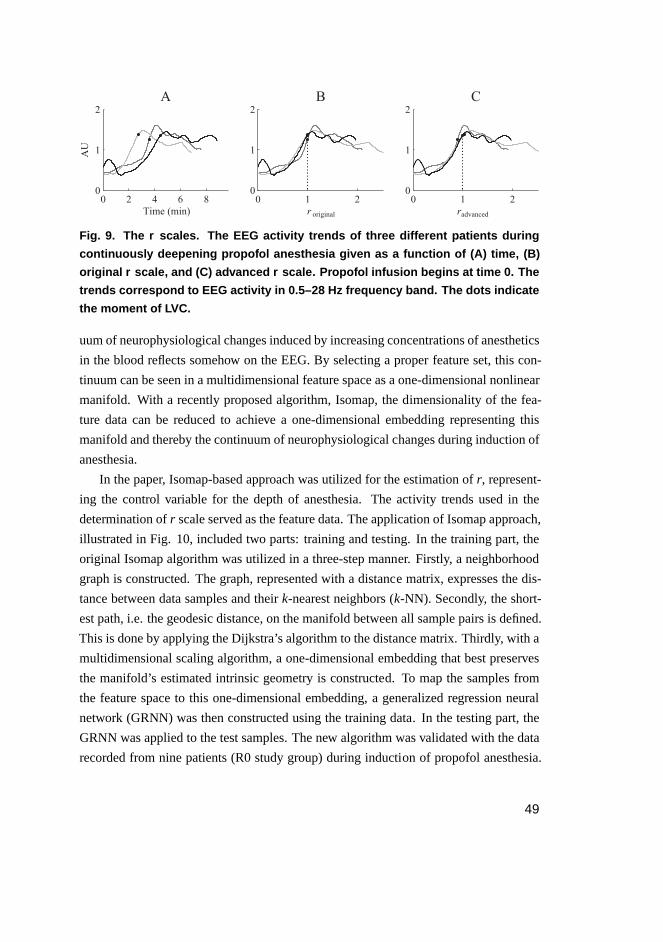
0 2 4 6 80
1
2
AU
A
Time (min)
1 20
1
2
B
r
1 20
1
2
C
r
0 0
original advanced
Fig. 9. The r scales. The EEG activity trends of three different patients during
continuously deepening propofol anesthesia given as a function of (A) time, (B)
original r scale, and (C) advanced r scale. Propofol infusion begins at time 0. The
trends correspond to EEG activity in 0.5–28 Hz frequency band. The dots indicate
the moment of LVC.
uum of neurophysiological changes induced by increasing concentrations of anesthetics
in the blood reflects somehow on the EEG. By selecting a proper feature set, this con-
tinuum can be seen in a multidimensional feature space as a one-dimensional nonlinear
manifold. With a recently proposed algorithm, Isomap, the dimensionality of the fea-
ture data can be reduced to achieve a one-dimensional embedding representing this
manifold and thereby the continuum of neurophysiological changes during induction of
anesthesia.
In the paper, Isomap-based approach was utilized for the estimation ofr, represent-
ing the control variable for the depth of anesthesia. The activity trends used in the
determination ofr scale served as the feature data. The application of Isomap approach,
illustrated in Fig. 10, included two parts: training and testing. In the training part, the
original Isomap algorithm was utilized in a three-step manner. Firstly, a neighborhood
graph is constructed. The graph, represented with a distance matrix, expresses the dis-
tance between data samples and theirk-nearest neighbors (k-NN). Secondly, the short-
est path, i.e. the geodesic distance, on the manifold between all sample pairs is defined.
This is done by applying the Dijkstra’s algorithm to the distance matrix. Thirdly, with a
multidimensional scaling algorithm, a one-dimensional embedding that best preserves
the manifold’s estimated intrinsic geometry is constructed. To map the samples from
the feature space to this one-dimensional embedding, a generalized regression neural
network (GRNN) was then constructed using the training data. In the testing part, the
GRNN was applied to the test samples. The new algorithm was validated with the data
recorded from nine patients (R0 study group) during induction of propofol anesthesia.
49
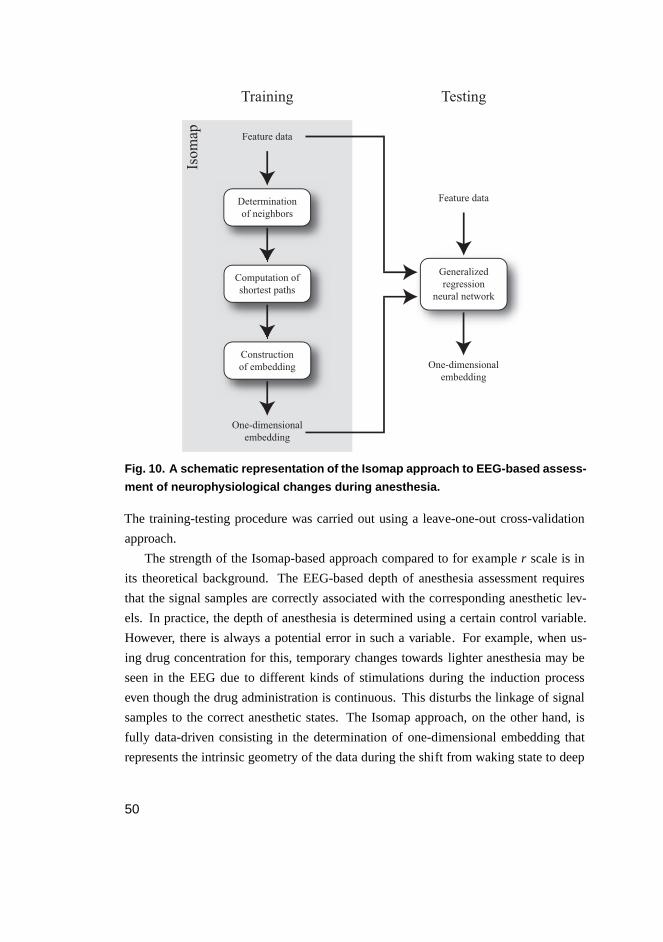
Determination
of neighbors
Feature data
Generalized
regression
neural network
Computation of
shortest paths
Construction
of embedding One-dimensional
embedding
Feature data
One-dimensional
embedding
Isom
ap
Training Testing
Fig. 10. A schematic representation of the Isomap approach to EEG- based assess-
ment of neurophysiological changes during anesthesia.
The training-testing procedure was carried out using a leave-one-out cross-validation
approach.
The strength of the Isomap-based approach compared to for exampler scale is in
its theoretical background. The EEG-based depth of anesthesia assessment requires
that the signal samples are correctly associated with the corresponding anesthetic lev-
els. In practice, the depth of anesthesia is determined using a certain control variable.
However, there is always a potential error in such a variable. For example, when us-
ing drug concentration for this, temporary changes towards lighter anesthesia may be
seen in the EEG due to different kinds of stimulations during the induction process
even though the drug administration is continuous. This disturbs the linkage of signal
samples to the correct anesthetic states. The Isomap approach, on the other hand, is
fully data-driven consisting in the determination of one-dimensional embedding that
represents the intrinsic geometry of the data during the shift from waking state to deep
50
anesthesia. It therefore is not susceptible to the error in the control variable. In fact, the
one-dimensional embedding provided by Isomap approach can itself be seen as a new
well-grounded control variable for the neurophysiological changes occurring during in-
duction of anesthesia.
3.2 Effects of remifentanil on EEG-based depth ofanesthesia measurement during propofol infusion
As presented in Section 2.3.3, the papers published on how opioids affect the EEG-
based depth of anesthesia measurement represent a heterogeneous group of studies,
in which the comparison of results is complicated. To fundamentally elucidate the
effects of remifentanil on the depth of anesthesia in terms of clinical signs and the
EEG changes during propofol anesthesia, two studies (II and III) were carried out. The
opioid’s influence on the onset of BSP and nonlinear entropy parameters was examined
as well (Kortelainenet al. 2008a, 2009). However, these papers were not included in
the thesis and the results are thus not reported here.
3.2.1 Clinical endpoints and FPP
In Paper II, the influence of remifentanil on the relation of clinical endpoints and the
spectral changes of EEG related to propofol infusion is evaluated. The patients of all
three study groups (R0, R1, and R2) were included in the study. The occurrence of LC,
LVC, and LRT in different groups were compared to the EEG spectral changes, i.e. the
FPP determined usingr scale. The administration of remifentanil during induction of
anesthesia with propofol led to an earlier occurrence of the clinical endpoints on the FPP.
A significant difference was observed between the saline (R0) and high-dose remifen-
tanil (R2) groups in all three endpoints. In these groups, the medianr value at LC, LVC,
and LRT decreased from 0.8, 1.0, and 1.94 to 0.51, 0.72, and 0.85, respectively. The
most prominent shift was seen in LRT. In all endpoints, the effect was proportional to
the infusion rate of remifentanil. The mutual relation of the EEG FPP and the endpoints
is thus significantly modified in a predictable and quantifiable manner by the infusion of
remifentanil during propofol anesthesia. The time scaling related to the determination
of r scale did not differ between groups indicating the propofol-induced fundamental
FPP to be independent of the coadministration of remifentanil.
51
3.2.2 Spectral properties of EEG
In Paper III, the effect of remifentanil on the spectrum and quantitative parameters of
EEG during induction of anesthesia with propofol was studied. Again, the data of all
three study groups (R0, R1, and R2) were used. The EEG spectrograms were com-
pared between groups after time normalized by applying ther scale. In addition, the
group differences in 14 quantitative spectral parameters used in the depth of anesthesia
estimation were examined. The following parameters were included: powers in differ-
ent frequency bands (total, delta, theta, alpha, and beta), relative powers in different
frequency bands (delta, theta, alpha, and beta), SpEn , BetaRatio, MPF, spectral edge
frequency 90% (SEF90%), and SEF95%. The spectrograms were found to be different
between groups. The high frequency (> 14 Hz) activity during light anesthesia (0 <r
< 1) was decreased in remifentanil groups, whereas, during deep anesthesia (1 <r <
2), increased activity in extended alpha band (7–14 Hz) and decreased activity in delta
band (0.5–4 Hz) was observed. Coadministration of remifentanil thus suppressed some
of the propofol-induced EEG changes and produced some of its own. Fig. 11 illustrates
the observed effect on the raw EEG and its power spectrum as a function ofr. Statisti-
cally significant changes were seen in all fourteen quantitative parameters derived from
spectrograms. The paper shows that the effect of remifentanil, when coadministered
with propofol, on the power spectrum and quantitative parameters of EEG is significant
and strongly dependent on the level of anesthesia.
3.3 Assessment of depth of propofol-remifentanilanesthesia
In Paper IV, a novel technology for the EEG-based measurement of depth of anesthesia
during multidrug infusion with propofol and remifentanil is proposed. The method is
based on the idea that while both propofol and remifentanil have a characteristic influ-
ence on the depth of anesthesia in terms of clinical signs, the EEG changes the drugs
induce are also somewhat different. These were the key findings in Papers II and III.
It was thus assumed that the effects of propofol and remifentanil would be possible to
detect from the EEG separately and, by utilizing this information, make a more accurate
decision about the anesthetic state of the patient. In the proposed method, the effect of
propofol is determined by estimating ther values of signal samples. Ther values were
previously shown to be independent of the coadministration of remifentanil (Paper II)
52
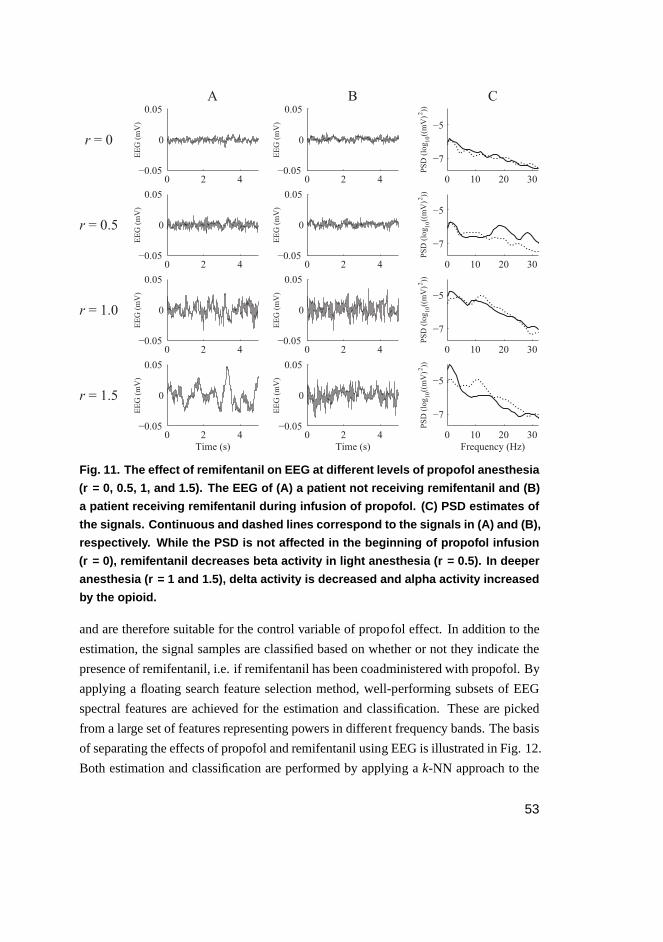
0 2 4−0.05
0
0.05
EEG (mV)
A
0 2 4−0.05
0
0.05
EEG (mV)
B
0 2 4−0.05
0
0.05
EEG (mV)
0 2 4−0.05
0
0.05
EEG (mV)
0 2 4−0.05
0
0.05
EEG (mV)
0 2 4−0.05
0
0.05EEG (mV)
0 2 4−0.05
0
0.05
EEG (mV)
Time (s)
0 2 4−0.05
0
0.05
EEG (mV)
Time (s)
0 10 20 30
−7
−5
C
PSD (log ((mV) ))
2
0 10 20 30
−7
−5
PSD (log ((mV) ))
2
0 10 20 30
−7
−5
PSD (log ((mV) ))
2
0 10 20 30
−7
−5
PSD (log ((mV) ))
2
Frequency (Hz)
10
10
10
r = 0
r = 0.5
r = 1.0
r = 1.5
10
Fig. 11. The effect of remifentanil on EEG at different levels of prop ofol anesthesia
(r = 0, 0.5, 1, and 1.5). The EEG of (A) a patient not receiving remifentanil and (B)
a patient receiving remifentanil during infusion of propofol. (C) PSD estimates of
the signals. Continuous and dashed lines correspond to the signals in (A) and (B),
respectively. While the PSD is not affected in the beginning of propofol infusion
(r = 0), remifentanil decreases beta activity in light anesthesia ( r = 0.5). In deeper
anesthesia (r = 1 and 1.5), delta activity is decreased and alpha activity increased
by the opioid.
and are therefore suitable for the control variable of propofol effect. In addition to the
estimation, the signal samples are classified based on whether or not they indicate the
presence of remifentanil, i.e. if remifentanil has been coadministered with propofol. By
applying a floating search feature selection method, well-performing subsets of EEG
spectral features are achieved for the estimation and classification. These are picked
from a large set of features representing powers in different frequency bands. The basis
of separating the effects of propofol and remifentanil using EEG is illustrated in Fig. 12.
Both estimation and classification are performed by applying ak-NN approach to the
53
signal samples in the feature space. Based on the estimation and classification results,
the EEG samples are related to certain depth of anesthesia defined by clinical signs, i.e.
LC, LVC, and LRT. In the paper, the technology was applied to the data of saline (R0)
and high-dose remifentanil (R2) groups. Including the information about the presence
of remifentanil to the estimated effect of propofol was shown to significantly improve
the prediction of the patient’s response to painful stimulation. The accuracy of deter-
mining the patient’s clinical state in terms of LRT increased from about 70% to about
80%.
3.4 Summary of research contributions
The research contributions of the thesis are:
1. Two methods for the quantification of EEG changes during propofol infusion.
– The advancedr scale.
– The Isomap-based approach.
2. Description of the effects of remifentanil on the EEG-based depth of anesthesia mea-
surement during propofol infusion.
– The effect on the relation of clinical endpoints and EEG changes.
– The effect on the EEG changes themselves at different levels of anesthesia.
3. A technology for the assessment of depth of propofol-remifentanil anesthesia.
54
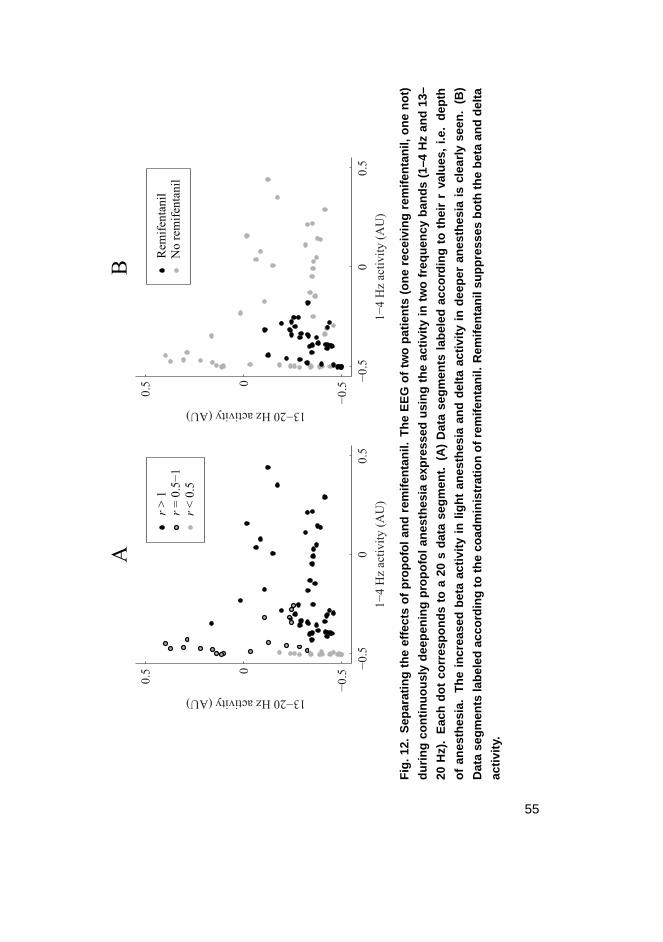
−0
.50
0.5
−0
.50
0.5
1−
4 H
z ac
tivit
y (
AU
)
13−20 Hz activity (AU)
−0
.50
0.5
−0
.50
0.5
1−
4 H
z ac
tiv
ity
(A
U)
13−20 Hz activity (AU)
AB
r <
0.5
r =
0.5
−1
r >
1N
o r
emif
enta
nil
Rem
ifen
tanil
Fig
.12.
Sep
arat
ing
the
effe
cts
ofpr
opof
olan
dre
mife
ntan
il.T
heE
EG
oftw
opa
tient
s(o
nere
ceiv
ing
rem
ifent
anil,
one
not)
durin
gco
ntin
uous
lyde
epen
ing
prop
ofol
anes
thes
iaex
pres
sed
usin
gth
eac
tivity
intw
ofr
eque
ncy
band
s(1
–4H
zan
d13
–
20H
z).
Eac
hdo
tco
rres
pond
sto
a20
sda
tase
gmen
t.(A
)D
ata
segm
ents
labe
led
acco
rdin
gto
thei
rr
valu
es,
i.e.
dept
h
ofan
esth
esia
.T
hein
crea
sed
beta
activ
ityin
light
anes
thes
iaan
dde
ltaac
tivity
inde
eper
anes
thes
iais
clea
rlyse
en.
(B)
Dat
ase
gmen
tsla
bele
dac
cord
ing
toth
eco
adm
inis
trat
ion
ofre
mife
ntan
il.R
emife
ntan
ilsu
ppre
sses
both
the
beta
and
delta
activ
ity.
55

56
4 Discussion
4.1 Significance of results
4.1.1 Quantification of anesthetic EEG changes
In the thesis, the EEG phenomenon during induction of anesthesia is described using
multidimensional feature data. Both of the presented methods (Paper I and V) rely
on the assumption that the continuum of neurophysiological changes induced by anes-
thetic drugs pose a similar multidimensional pattern of EEG changes in all patients.
By tracking this pattern the depth of anesthesia can be estimated. In the literature, the
main focus in the EEG-based depth of anesthesia estimation has lately been on compar-
ing the performance of different kinds of single mathematical measures, reaching from
simple spectral derivatives to recently proposed complexity parameters. The approach
of assessing the effect of anesthetic drugs with a single mathematical measure assumes
that the observed signal property changes somewhat monotonically, with a continuously
changing anesthetic level. However, as pointed out in Section 2.3.1, instead of causing
a simple suppressive effect in the cortex, the anesthetics induce a continuum of neu-
rophysiological changes reflecting diversely on the EEG. This challenges the usage of
single mathematical measures, or even a linear combination of them, for the assess-
ment of depth of anesthesia. Considering this, the methods proposed here provide a
more holistic approach in which the multidimensional dynamics of the data are taken
into account.
4.1.2 Description of the opioid effects
While the influence of opioids on the depth of anesthesia in terms of clinical signs is
clearly synergistic with hypnotic agents, the EEG changes induced by these drugs dif-
fer due to their distinct mechanisms of action. This complicates the description of the
effects of opioid on the EEG-based depth of anesthesia measurement. Consequently,
as described in Section 2.3.3, the papers published on this topic so far represent a het-
erogeneous group of studies, in which the generalization of results is challenging and
therefore clear-cut conclusions are hard to draw. Reporting, for example, the reaction
of BIS to the coadministration of opioids does not sufficiently describe the relation of
57
EEG changes and depth of anesthesia as the index is known to comprise of multiple
parameters whose contribution varies at different anesthetic levels. Since the algorithm
of the index has not been revealed, the results of these kinds of studies are restricted to
the specific version of BIS providing no useful long-term information.
Papers II and III present the effects of remifentanil on clinical endpoints and EEG
spectral properties as a function ofr. Since ther scale represents the continuum of
EEG changes related to propofol infusion and is not affected by the coadministrated
remifentanil, the approach provides a more convenient way to investigate the effects of
opioids. The mutual relation of the clinical endpoints and the propofol induced EEG
changes can be assessed. In addition, the observation of the detailed changes in the
spectral properties of EEG at different anesthetic levels is made possible. The results
attained are thus more general and applicable to future studies.
4.1.3 Technology to separate drug effects
An increasing body of literature documents the challenges related to the EEG-based
depth of anesthesia measurement when supplementing hypnotic agents with opioids. As
mentioned in Section 2.3.3 and also confirmed in Papers II and III, the coadministration
of opioids affects both clinical endpoints and EEG changes during anesthesia hindering
the interpretation of EEG-derived measures. However, very few attempts have been
reported to solve this problem. In Paper IV, a solution has been provided by detecting
the presence of opioids from EEG and then making a more informed decision about
the clinical state of the patient. The approach was shown to significantly improve the
prediction of the patient’s response to noxious stimulations, which is essential during a
surgical operation when the unresponsiveness to painful stimulations like skin incision
is required. Recently, Lileyet al. (2010) proposed a similar EEG-based method to
dissociate the effects of propofol and remifentanil in which a fixed-order autoregressive
moving-average model is applied. Paper IV is, however, the first study introducing
a technology shown to actually improve the determination of the clinical state of the
patient by separating the drug effects.
Measurement of analgesia using EEG is challenging. The spinal cord has the main
role in delivering the sensory information to the brain. The reaction to noxious stimula-
tion is also driven by spinal reflexes. This intuitively complicates the monitoring of pain
sensation from the cortex. In the literature, the EEG has shown to be a poor predictor
for analgesic endpoints (e.g. Struyset al. 2002). This has directed the monitoring of
58
analgesia to other modalities, such as heart rate and photoplethysmography (e.g. Huiku
et al. 2007). The results presented here, however, show that the EEG gives indirect
information about the analgesic state of the patient. The finding suggests that, at least
during hypnotic-opioid anesthesia, the performance of the current depth of anesthesia
monitors can be improved significantly.
4.2 Limitations and generalizability
The study was entirely based on a single data set, which poses some limitations. Firstly,
the number of patients in one group was rather small. Even though special attention
was paid to this by applying cross-validation, the results need to be validated with a
larger amount of data. For example, the feature set used in the detection of remifentanil
(Paper IV) might slightly change if the number of patients would be increased. A larger
amount of data, with varying doses of opioids, is also needed to change the assessment
of the effect of opioids from "on/off" to a continuous scale. Furthermore, the clinical
setup somewhat restricts the generalization of the results. The data included only the
induction of anesthesia, while the emergence phase was left out. The applicability of
the results to the recovery from anesthesia needs to be confirmed.
The findings are potentially generalizable to other hypnotic-opioid drug combi-
nations. The effect of hypnotic drugs generally arises from the potentiation of the
GABAergic neural transmission, while most of the intraoperative opioids act through
µ receptors. Due to the similar mechanisms of action, other hypnotic-opioid drug com-
binations are likely to produce results comparable to those presented here. However,
additional studies are required to confirm this.
The study also opens possibilities for future research related to totally new topics.
So far, the EEG changes during induction of anesthesia have been studied in healthy
brains. One interesting possibility would be to investigate how different brain injuries
affect the continuum of EEG changes related to induction of anesthesia. As the EEG
frequency changes seen during anesthesia result from the oscillatory activity of distinct
neural networks, it can be hypothesized that certain brain damages, such as diffuse is-
chemic and axonal injuries, would influence these changes. Due to the consistency of
the frequency progression and high-amplitude of the EEG during induction of anes-
thesia, the alteration in the characteristics of anesthetic EEG is supposedly easier to
observe compared to that of waking state EEG. In fact, some results indicating abnor-
mal behavior of the EEG in response to anesthetics after a brain injury has been reported
59
(Myles et al. 2009). Hence, the changes in the time-frequency properties of the EEG
during induction of anesthesia potentially provide a novel approach to study the cerebral
dysfunction.
The methods proposed here for the depth of anesthesia assessment can also poten-
tially be applied to measure other kinds of neurophysiological changes. There is evi-
dence that epileptic seizures, for instance, are preceded by characteristic EEG changes
that are detectable minutes before seizure onset (Sackellares 2008). The finding sug-
gests that, before the actual epileptic activity begins, the functionality of the brain
slowly shifts to abnormal. Similarly, although in a different time scale, the progress of a
wide spectrum of neurodegenerative diseases reflects on the EEG. This is the case with
for example Alzheimer’s and Parkinson’s disease (Jeong 2004, Fonsecaet al. 2009).
Compared to the anesthesia, these neurophysiological events provide a similar problem
characterized by the increasingly altered functionality of the brain. The approaches to
track EEG changes presented in this thesis could thus be possibly utilized in the predic-
tion of epileptic seizures or early diagnosis of neurodegenerative diseases.
60
5 Summary and conclusions
In this thesis, the EEG-based depth of anesthesia measurement during multidrug in-
fusion with a hypnotic agent and opioid is addressed. The studies, constituting five
original publications, were based on a data set recorded during induction of anesthesia
with propofol supplemented with varying doses of remifentanil. The work included the
following three steps:
1. Quantification of EEG changes during propofol infusion.
2. Description of the effect of remifentanil on clinical endpoints and EEG changes
during propofol anesthesia.
3. Development of a technology for the assessment of depth of propofol-remifentanil
anesthesia.
In the first step, two methods to quantitatively describe the EEG phenomenon related
induction of propofol anesthesia was developed. Both of the methods utilize the spec-
tral changes of EEG, i.e. the FPP, for this description. In the second step, the first of the
methods developed was used to describe the effects of coadministration of remifentanil
on the EEG-based depth of anesthesia measurement during propofol infusion. Coad-
ministration of opioid was shown to significantly modify the mutual relations of the
EEG changes and the clinical signs, which was seen as an earlier occurrence of the
endpoints on the FPP. Furthermore, remifentanil was found to significantly affect the
EEG, more specifically, the power spectrum and derived quantitative parameters during
propofol infusion. This effect was strongly dependent on the level of anesthesia. In step
three, an EEG-based technology to assess the depth of propofol-remifentanil anesthe-
sia was developed. The technology was designed to improve the determination of the
anesthetic state of the patient by detecting the presence of remifentanil from the EEG.
The thesis provides a framework for the depth of anesthesia measurement during
multidrug administration with propofol and remifentanil. Due to the similar mecha-
nisms of action, the results are likely to be generalizable to other hypnotic-opioid drug
combinations. The study thus offers potential for the development of more advanced
systems for automatic monitoring of depth of anesthesia.
61

62
References
Adam HK, Briggs LP, Bahar M, Douglas EJ & Dundee JW (1983) Pharmacokinetic evaluationof ICI 35 868 in man. Single induction doses with different rates of injection. Br J Anaesth55(2): 97–103.
Aimé I, Verroust N, Masson-Lefoll C, Taylor G, Laloë PA, Liu N & Fischler M (2006) Doesmonitoring bispectral index or spectral entropy reduce sevoflurane use? Anesth Analg 103(6):1469–1477.
Alkire MT & Miller J (2005) General anesthesia and the neural correlates of consciousness. ProgBrain Res 150: 229–244.
Anderson RE, Barr G & Jakobsson JG (2005) Cerebral state index during anaesthetic induction: acomparative study with propofol or nitrous oxide. Acta Anaesthesiol Scand 49(6): 750–753.
Antognini JF, Wang XW, Piercy M & Carstens E (2000) Propofol directly depresses lumbar dorsalhorn neuronal responses to noxious stimulation in goats. Can J Anaesth 47(3): 273–279.
Antunes LM, Roughan JV & Flecknell PA (2003) Excitatory effects of fentanyl upon the ratelectroencephalogram and auditory-evoked potential responses during anaesthesia. Eur JAnaesthesiol 20(10): 800–808.
Avramov MN & White PF (1995) Methods for monitoring the level of sedation. Crit Care Clin11(4): 803–826.
Barr G, Anderson RE, Owall A & Jakobsson JG (2000) Effects on the bispectral index duringmedium-high dose fentanyl induction with or without propofol supplement. Acta Anaesthe-siol Scand 44(7): 807–811.
Barvais L, Engelman E, Eba JM, Coussaert E, Cantraine F & Kenny GN (2003) Effect site con-centrations of remifentanil and pupil response to noxious stimulation. Br J Anaesth 91(3):347–352.
Battershill AJ & Keating GM (2006) Remifentanil: a review of its analgesic and sedative use inthe intensive care unit. Drugs 66(3): 365–385.
Beers R & Camporesi E (2004) Remifentanil update: clinical science and utility. CNS Drugs18(15): 1085–1104.
Belani KG, Sessler DI, Larson MD, Lopez MA, Washington DE, Ozaki M, McGuire J, MerrifieldB & Schroeder M (1993) The pupillary light reflex. Effects of anesthetics and hyperthermia.Anesthesiology 79(1): 23–27.
Berger H (1929) Über das Elektroenkephalogramm des Menschen. Archiv für Psychiatrie undNervenkrankheiten 87: 527–570.
Berger H (1931) Über das Elektroenkephalogramm des Menschen. Dritte Mitteilung. Archiv fürPsychiatrie und Nervenkrankheiten 94: 16–60.
Berger H (1933) Über das Elektroenkephalogramm des Menschen. Achte Mitteilung. Archiv fürPsychiatrie und Nervenkrankheiten 87: 452–469.
Billard V, Servin F, Guignard B, Junke E, Bouverne MN, Hédouin M & Chauvin M (2004)Desflurane-remifentanil-nitrous oxide anaesthesia for abdominal surgery: optimal concen-trations and recovery features. Acta Anaesthesiol Scand 48(3): 355–364.
Binnie CD & Prior PF (1994) Electroencephalography. J Neurol Neurosurg Psychiatry 57(11):1308–1319.
Bouillon TW, Bruhn J, Radulescu L, Andresen C, Shafer TJ, Cohane C & Shafer SL (2004) Phar-
63
macodynamic interaction between propofol and remifentanil regarding hypnosis, toleranceof laryngoscopy, bispectral index, and electroencephalographic approximate entropy. Anes-thesiology 100(6): 1353–1372.
Bovill JG, Sebel PS & Stanley TH (1984) Opioid analgesics in anesthesia: with special referenceto their use in cardiovascular anesthesia. Anesthesiology 61(6): 731–755.
Bowdle TA (2006) Depth of anesthesia monitoring. Anesthesiol Clin 24(4): 793–822.Breshears JD, Roland JL, Sharma M, Gaona CM, Freudenburg ZV, Tempelhoff R, Avidan MS &
Leuthardt EC (2010) Stable and dynamic cortical electrophysiology of induction and emer-gence with propofol anesthesia. Proc Natl Acad Sci U S A 107(49): 21170–21175.
Brown EN, Lydic R & Schiff ND (2010) General anesthesia, sleep, and coma. N Engl J Med363(27): 2638–2650.
Bruhn J, Bouillon TW, Radulescu L, Hoeft A, Bertaccini E & Shafer SL (2003) Correlation ofapproximate entropy, bispectral index, and spectral edge frequency 95 (SEF95) with clinicalsigns of "anesthetic depth" during coadministration of propofol and remifentanil. Anesthesi-ology 98(3): 621–627.
Büttner N, Schultz B, Grouven U & Schultz A (2010) [EEG-adjusted target-controlled infusion:propofol target concentration with different doses of remifentanil]. Anaesthesist 59(2): 126–134.
Campagna JA, Miller KW & Forman SA (2003) Mechanisms of actions of inhaled anesthetics.N Engl J Med 348(21): 2110–2124.
Chernik DA, Gillings D, Laine H, Hendler J, Silver JM, Davidson AB, Schwam EM & SiegelJL (1990) Validity and reliability of the Observer’s Assessment of Alertness/Sedation Scale:study with intravenous midazolam. J Clin Psychopharmacol 10(4): 244–251.
Chi OZ, Sommer W & Jasaitis D (1991) Power spectral analysis of EEG during sufentanil infu-sion in humans. Can J Anaesth 38(3): 275–280.
Christie MJ, Connor M, Vaughan CW, Ingram SL & Bagley EE (2000) Cellular actions of opioidsand other analgesics: implications for synergism in pain relief. Clin Exp Pharmacol Physiol27(7): 520–523.
Coda B (2009) Opioids. In: Barash P, Cullen B, Stoelting R, Cahalan M & Stock M (eds) ClinicalAnesthesia, 465–497. Lippincott Williams & Wilkins, Philadelphia, USA, 6th edition.
Coetzee JF, Maritz JS & du Toit JC (1996) Effect of tramadol on depth of anaesthesia. Br JAnaesth 76(3): 415–418.
Cruccu G, Ferracuti S, Leardi MG, Fabbri A & Manfredi M (1991) Nociceptive quality of the or-bicularis oculi reflexes as evaluated by distinct opiate- and benzodiazepine-induced changesin man. Brain Res 556(2): 209–217.
Dahan A, Nieuwenhuijs D, Olofsen E, Sarton E, Romberg R & Teppema L (2001) Responsesurface modeling of alfentanil-sevoflurane interaction on cardiorespiratory control and bis-pectral index. Anesthesiology 94(6): 982–991.
de Grood PM, Ruys AH, van Egmond J, Booij LH & Crul JF (1985) Propofol (’Diprivan’) emul-sion for total intravenous anaesthesia. Postgrad Med J 61 Suppl 3: 65–69.
Dierks T, Kullmann F, Engelhardt W & Maurer K (1992) Quantitative topographical analysisof effects of single thiopental bolus on human electroencephalogram. Pharmacopsychiatry25(5): 224–228.
Drover DR, Lemmens HJ, Pierce ET, Plourde G, Loyd G, Ornstein E, Prichep LS, Chabot RJ& Gugino L (2002) Patient State Index: titration of delivery and recovery from propofol,alfentanil, and nitrous oxide anesthesia. Anesthesiology 97(1): 82–89.
64
Drummond JC, Brann CA, Perkins DE & Wolfe DE (1991) A comparison ofmedian frequency,spectral edge frequency, a frequency band power ratio, total power, and dominance shift inthe determination of depth of anesthesia. Acta Anaesthesiol Scand 35(8): 693–699.
Dunnet JM, Prys-Roberts C, Holland DE & Browne BL (1994) Propofol infusion and the sup-pression of consciousness: dose requirements to induce loss of consciousness and to suppressresponse to noxious and non-noxious stimuli. Br J Anaesth 72(1): 29–34.
Dutton RC, Smith WD & Smith NT (1996) EEG Predicts movement response to surgical stimuliduring general anesthesia with combinations of isoflurane, 70J Clin Monit 12(2): 127–139.
Egan TD, Minto CF, Hermann DJ, Barr J, Muir KT & Shafer SL (1996) Remifentanil versusalfentanil: comparative pharmacokinetics and pharmacodynamics in healthy adult male vol-unteers. Anesthesiology 84(4): 821–833.
Ekman A, Lindholm ML, Lennmarken C & Sandin R (2004) Reduction in the incidence of aware-ness using BIS monitoring. Acta Anaesthesiol Scand 48(1): 20–26.
Erkola O & Rautoma P (1999) Lihasrelaksantit. In: Rosenberg P, Alahuhta S, Kanto J & Takala J(eds) Anestesiologia ja tehohoito, 125–133. Kustannus Oy Duodecim, Helsinki, Finland, 1stedition.
Evers A & Crowder M (2006) Cellular and molecular mechanisms of anesthsia. In: Barash P,Cullen B & Stoelting R (eds) Clinical Anesthesia, 111–132. Lippincott Williams & Wilkins,New York, USA, 5th edition.
Fahlenkamp AV, Peters D, Biener IA, Billoet C, Apfel CC, Rossaint R & Coburn M (2010)Evaluation of bispectral index and auditory evoked potentials for hypnotic depth monitoringduring balanced xenon anaesthesia compared with sevoflurane. Br J Anaesth 105(3): 334–341.
Fechner J, Hering W, Ihmsen H, Palmaers T, Schüttler J & Albrecht S (2003) Modelling thepharmacodynamic interaction between remifentanil and propofol by EEG-controlled dosing.Eur J Anaesthesiol 20(5): 373–379.
Ferenets R, Vanluchene A, Lipping T, Heyse B & Struys MMRF (2007) Behavior of en-tropy/complexity measures of the electroencephalogram during propofol-induced sedation:dose-dependent effects of remifentanil. Anesthesiology 106(4): 696–706.
Ferreira DA, Nunes CS, Antunes LM, Santos IA, Lobo F, Casal M, Ferreira L & Amorim P (2006)The effect of a remifentanil bolus on the bispectral index of the EEG (BIS) in anaesthetizedpatients independently from intubation and surgical stimuli. Eur J Anaesthesiol 23(4): 305–310.
Fisch B (1999) Fisch and Spehlmann’s EEG primer. Elsevier, Amsterdam, The Netherlands, 3rdedition.
Fodale V, Praticò C, Tescione M, Tanania S, Lucanto T & Santamaria LB (2005) Tramadol doesnot modify the Bispectral Index during anaesthesia with sevoflurane and remifentanil. Br JAnaesth 95(2): 212–215.
Fodale V, Schifilliti D, Praticò C & Santamaria LB (2008) Remifentanil and the brain. ActaAnaesthesiol Scand 52(3): 319–326.
Fonseca LC, Tedrus GMAS, Letro GH & Bossoni AS (2009) Dementia, mild cognitive impair-ment and quantitative EEG in patients with Parkinson’s disease. Clin EEG Neurosci 40(3):168–172.
Forestier F, Hirschi M, Rouget P, Rigal JC, Videcoq M, Girardet P, Durand M, Maitrasse B,Girard C, Lehot JJ, Grés BD, Sellin M, Depoix JP, Janvier G & Longrois D (2003) Propofoland sufentanil titration with the bispectral index to provide anesthesia for coronary artery
65
surgery. Anesthesiology 99(2): 334–346.Forrester J, Dick A, McMenamin P & Lee W (2002) The eye: basic sciences in practice. Elsevier,
2nd edition.Fujii K, Iranami H, Nakamura Y & Hatano Y (2009) Fentanyl added to propofol anesthesia
elongates sinus node recovery time in pediatric patients with paroxysmal supraventriculartachycardia. Anesth Analg 108(2): 456–460.
Fukuda K (2005) Intravenous opioid anesthetics. In: Miller R (ed) Miller’s Anesthesia, 379–438.Elsevier, Philadelphia, USA, 6th edition.
Gan TJ, Glass PS, Windsor A, Payne F, Rosow C, Sebel P & Manberg P (1997) Bispectral indexmonitoring allows faster emergence and improved recovery from propofol, alfentanil, andnitrous oxide anesthesia. BIS Utility Study Group. Anesthesiology 87(4): 808–815.
Glass P, Shafer S & Reves J (2005) Intravenous drug delivery system. In: Miller R (ed) Miller’sAnesthesia, 439–480. Elsevier, Philadelphia, USA, 6th edition.
Glass PS, Bloom M, Kearse L, Rosow C, Sebel P & Manberg P (1997) Bispectral analysismeasures sedation and memory effects of propofol, midazolam, isoflurane, and alfentanilin healthy volunteers. Anesthesiology 86(4): 836–847.
Gong Y, Li E, Xu G, Wang H, Wang C, Li P & He Y (2009) Investigation of propofol concentra-tions in human breath by solid-phase microextraction gas chromatography-mass spectrome-try. J Int Med Res 37(5): 1465–1471.
Goto T, Nakata Y, Saito H, Ishiguro Y, Niimi Y & Morita S (2001) The midlatency auditoryevoked potentials predict responsiveness to verbal commands in patients emerging from anes-thesia with xenon, isoflurane, and sevoflurane but not with nitrous oxide. Anesthesiology94(5): 782–789.
Grundmann U, Uth M, Eichner A, Wilhelm W & Larsen R (1998) Total intravenous anaesthesiawith propofol and remifentanil in paediatric patients: a comparison with a desflurane-nitrousoxide inhalation anaesthesia. Acta Anaesthesiol Scand 42(7): 845–850.
Gugino LD, Chabot RJ, Prichep LS, John ER, Formanek V & Aglio LS (2001) QuantitativeEEG changes associated with loss and return of consciousness in healthy adult volunteersanaesthetized with propofol or sevoflurane. Br J Anaesth 87(3): 421–428.
Guignard B, Coste C, Menigaux C & Chauvin M (2001) Reduced isoflurane consumption withbispectral index monitoring. Acta Anaesthesiol Scand 45(3): 308–314.
Guignard B, Menigaux C, Dupont X, Fletcher D & Chauvin M (2000) The effect of remifen-tanil on the bispectral index change and hemodynamic responses after orotracheal intubation.Anesth Analg 90(1): 161–167.
Hari R (2006a) Hermoston biosähköiset ja biomagneettiset perusilmiöt. In: Partanen J, Falck B,Hasan J, Jäntti V, Salmi T & Tolonen U (eds) Kliininen neurofysiologia, 26–34. KustannusOy Duodecim, Helsinki, Finland, 1st edition.
Hari R (2006b) Virtalähteen paikannus hermokudoksessa. In: Partanen J, Falck B, Hasan J, JänttiV, Salmi T & Tolonen U (eds) Kliininen neurofysiologia, 35–48. Kustannus Oy Duodecim,Helsinki, Finland, 1st edition.
Heier T & Steen PA (1996) Assessment of anaesthesia depth. Acta Anaesthesiol Scand 40(9):1087–1100.
Henao-Guerrero PN, McMurphy R, Kukanich B & Hodgson DS (2009) Effect of morphine onthe bispectral index during isoflurane anesthesia in dogs. Vet Anaesth Analg 36(2): 133–143.
Hentgen E, Houfani M, Billard V, Capron F, Ropars JM & Travagli JP (2002) Propofol-sufentanilanesthesia for thyroid surgery: optimal concentrations for hemodynamic and electroen-
66
cephalogram stability, and recovery features. Anesth Analg 95(3): 597–605, table of con-tents.
Hirota K (2006) Special cases: ketamine, nitrous oxide and xenon. Best Pract Res Clin Anaes-thesiol 20(1): 69–79.
Hoffman WE, Cunningham F, James MK, Baughman VL & Albrecht RF (1993) Effects ofremifentanil, a new short-acting opioid, on cerebral blood flow, brain electrical activity, andintracranial pressure in dogs anesthetized with isoflurane and nitrous oxide. Anesthesiology79(1): 107–113.
Hughes SW & Crunelli V (2005) Thalamic mechanisms of EEG alpha rhythms and their patho-logical implications. Neuroscientist 11(4): 357–372.
Huiku M, Uutela K, van Gils M, Korhonen I, Kymäläinen M, Meriläinen P, Paloheimo M, Ranta-nen M, Takala P, Viertiö-Oja H & Yli-Hankala A (2007) Assessment of surgical stress duringgeneral anaesthesia. Br J Anaesth 98(4): 447–455.
Huttunen J, Tolonen U & Partanen J (2006) EEG:n fysiologiaa ja patofysiologiaa. In: PartanenJ, Falck B, Hasan J, Jäntti V, Salmi T & Tolonen U (eds) Kliininen neurofysiologia, 50–64.Kustannus Oy Duodecim, Helsinki, Finland, 1st edition.
Høymork SC, Raeder J, Grimsmo B & Steen PA (2000) Bispectral index, predicted and measureddrug levels of target-controlled infusions of remifentanil and propofol during laparoscopiccholecystectomy and emergence. Acta Anaesthesiol Scand 44(9): 1138–1144.
Iannuzzi E, Iannuzzi M, Viola G, Sidro L, Cardinale A & Chiefari M (2007) BIS - AAI andclinical measures during propofol target controlled infusion with Schnider’s pharmacokineticmodel. Minerva Anestesiol 73(1-2): 23–31.
Inouye T, Shinosaki K, Sakamoto H, Toi S, Ukai S, Iyama A, Katsuda Y & Hirano M (1991)Quantification of EEG irregularity by use of the entropy of the power spectrum. Electroen-cephalogr Clin Neurophysiol 79(3): 204–210.
Iselin-Chaves IA, Flaishon R, Sebel PS, Howell S, Gan TJ, Sigl J, Ginsberg B & Glass PS (1998)The effect of the interaction of propofol and alfentanil on recall, loss of consciousness, andthe Bispectral Index. Anesth Analg 87(4): 949–955.
James MK, Feldman PL, Schuster SV, Bilotta JM, Brackeen MF & Leighton HJ (1991) Opioidreceptor activity of GI 87084B, a novel ultra-short acting analgesic, in isolated tissues. JPharmacol Exp Ther 259(2): 712–718.
Jeleazcov C, Fechner J & Schwilden H (2005) Electroencephalogram monitoring during anesthe-sia with propofol and alfentanil: the impact of second order spectral analysis. Anesth Analg100(5): 1365–9, table of contents.
Jensen EW, Litvan H, Struys M & Vazquez PM (2004) Pitfalls and challenges when assessing thedepth of hypnosis during general anaesthesia by clinical signs and electronic indices. ActaAnaesthesiol Scand 48(10): 1260–1267.
Jensen EW, Nygaard M & Henneberg SW (1998) On-line analysis of middle latency auditoryevoked potentials (MLAEP) for monitoring depth of anaesthesia in laboratory rats. Med EngPhys 20(10): 722–728.
Jeong J (2004) EEG dynamics in patients with Alzheimer’s disease. Clin Neurophysiol 115(7):1490–1505.
Jhaveri R, Joshi P, Batenhorst R, Baughman V & Glass PS (1997) Dose comparison of remifen-tanil and alfentanil for loss of consciousness. Anesthesiology 87(2): 253–259.
Johansen JW & Sebel PS (2000) Development and clinical application of electroencephalo-graphic bispectrum monitoring. Anesthesiology 93(5): 1336–1344.
67
John ER & Prichep LS (2005) The anesthetic cascade: a theory of how anesthesia suppressesconsciousness. Anesthesiology 102(2): 447–471.
Jurd R, Arras M, Lambert S, Drexler B, Siegwart R, Crestani F, Zaugg M, Vogt KE, LedermannB, Antkowiak B & Rudolph U (2003) General anesthetic actions in vivo strongly attenuatedby a point mutation in the GABA(A) receptor beta3 subunit. FASEB J 17(2): 250–252.
Katoh T, Suzuki A & Ikeda K (1998) Electroencephalographic derivatives as a tool for predictingthe depth of sedation and anesthesia induced by sevoflurane. Anesthesiology 88(3): 642–650.
Kaur S & Heard S (2008) Airway management and endotracheal intubation. In: Irwin R & RippeJ (eds) Irwin and Rippe’s Intensive Care Medicine, 3–18. Lippincott Williams & Wilkins,Philadelphia, USA, 6th edition.
Kearse LA, Manberg P, Chamoun N, deBros F & Zaslavsky A (1994) Bispectral analysis ofthe electroencephalogram correlates with patient movement to skin incision during propo-fol/nitrous oxide anesthesia. Anesthesiology 81(6): 1365–1370.
Kirschfeld K (2005) The physical basis of alpha waves in the electroencephalogram and the originof the "Berger effect". Biol Cybern 92(3): 177–185.
Kirschstein T & Köhling R (2009) What is the source of the EEG? Clin EEG Neurosci 40(3):146–149.
Kissin I (2000) Depth of anesthesia and bispectral index monitoring. Anesth Analg 90(5): 1114–1117.
Koblin D (2005) Mechanisms of action. In: Miller R (ed) Miller’s Anesthesia, 105–130. Elsevier,Philadelphia, USA, 6th edition.
Kodaka M, Okamoto Y, Handa F, Kawasaki J & Miyao H (2004) Relation between fentanyl doseand predicted EC50 of propofol for laryngeal mask insertion. Br J Anaesth 92(2): 238–241.
Koitabashi T, Johansen JW & Sebel PS (2002) Remifentanil dose/electroencephalogram bispec-tral response during combined propofol/regional anesthesia. Anesth Analg 94(6): 1530–3,table of contents.
Koivu M, Eskola H & Tolonen U (2006) EEG:n rekisteröinti, aktivaatio ja lausunto. In: PartanenJ, Falck B, Hasan J, Jäntti V, Salmi T & Tolonen U (eds) Kliininen neurofysiologia, 65–83.Kustannus Oy Duodecim, Helsinki, Finland, 1st edition.
Kortelainen J, Koskinen M, Mustola S & Seppänen T (2008a) EEG spectral changes and onsetof burst suppression pattern in propofol/remifentanil anesthesia. Proceedings of the 30thAnnual International Conference of the IEEE Engineering in Medicine and Biology Society,Vancouver, Canada: 4980–4983.
Kortelainen J, Koskinen M, Mustola S & Seppänen T (2008b) Time-frequency properties of elec-troencephalogram during induction of anesthesia. Neurosci Lett 446(2–3): 70–74.
Kortelainen J, Koskinen M, Mustola S & Seppänen T (2009) Effect of remifentanil on the non-linear electroencephalographic entropy parameters in propofol anesthesia. Proceedings ofthe 31st Annual International Conference of the IEEE Engineering in Medicine and BiologySociety, Minneapolis, USA: 4994–4997.
Koskinen M (2006) Automatic assessment of functional suppression of the central nervous sys-tem due to propofol anesthetic infusion: from EEG phenomena to a quantitative index. Ph.D.thesis, University of Oulu.
Koskinen M, Mustola S & Seppänen T (2005) Relation of EEG spectrum progression to lossof responsiveness during induction of anesthesia with propofol. Clin Neurophysiol 116(9):2069–2076.
Krasowski MD, Nishikawa K, Nikolaeva N, Lin A & Harrison NL (2001) Methionine 286 in
68
transmembrane domain 3 of the GABAA receptor beta subunit controls a binding cavity forpropofol and other alkylphenol general anesthetics. Neuropharmacology 41(8): 952–964.
Kreuer S, Biedler A, Larsen R, Altmann S & Wilhelm W (2003a) Narcotrend monitoring allowsfaster emergence and a reduction of drug consumption in propofol-remifentanil anesthesia.Anesthesiology 99(1): 34–41.
Kreuer S, Bruhn J, Larsen R, Hoepstein M & Wilhelm W (2003b) Comparison of Alaris AEPindex and bispectral index during propofol-remifentanil anaesthesia. Br J Anaesth 91(3):336–340.
Kuizenga K, Wierda JM & Kalkman CJ (2001) Biphasic EEG changes in relation to loss of con-sciousness during induction with thiopental, propofol, etomidate, midazolam or sevoflurane.Br J Anaesth 86(3): 354–360.
Laitinen J & Salomäki T (1999) Opioidit ja tulehduskipulääkkeet. In: Rosenberg P, AlahuhtaS, Kanto J & Takala J (eds) Anestesiologia ja tehohoito, 110–124. Kustannus Oy Duodecim,Helsinki, Finland, 1st edition.
Liao WW, Wang JJ, Wu GJ & Kuo CD (2011) The effect of cerebral monitoring on recovery aftersevoflurane anesthesia inaambulatory setting in children: a comparison among bispectralindex, A-line autoregressive index, and standard practice. J Chin Med Assoc 74(1): 28–36.
Lichtenbelt BJ, Mertens M & Vuyk J (2004) Strategies to optimise propofol-opioid anaesthesia.Clin Pharmacokinet 43(9): 577–593.
Liley DTJ, Sinclair NC, Lipping T, Heyse B, Vereecke HEM & Struys MMRF (2010) Propofoland remifentanil differentially modulate frontal electroencephalographic activity. Anesthesi-ology 113(2): 292–304.
Lingamaneni R, Birch ML & Hemmings HC (2001) Widespread inhibition of sodium channel-dependent glutamate release from isolated nerve terminals by isoflurane and propofol. Anes-thesiology 95(6): 1460–1466.
Lysakowski C, Dumont L, Pellegrini M, Clergue F & Tassonyi E (2001) Effects of fentanyl,alfentanil, remifentanil and sufentanil on loss of consciousness and bispectral index duringpropofol induction of anaesthesia. Br J Anaesth 86(4): 523–527.
Mahla M, Black S & Cucchiara R (2005) Neurologic monitoring. In: Miller R (ed) Miller’sAnesthesia, 1511–1550. Elsevier, Philadelphia, USA, 6th edition.
Mahon P, Greene BR, Greene C, Boylan GB & Shorten GD (2008) Behaviour of spectral entropy,spectral edge frequency 90%, and alpha and beta power parameters during low-dose propofolinfusion. Br J Anaesth 101(2): 213–221.
Mansour A, Fox CA, Akil H & Watson SJ (1995) Opioid-receptor mRNA expression in the ratCNS: anatomical and functional implications. Trends Neurosci 18(1): 22–29.
Manyam SC, Gupta DK, Johnson KB, White JL, Pace NL, Westenskow DR & Egan TD (2007)When is a bispectral index of 60 too low?: rational processed electroencephalographic targetsare dependent on the sedative-opioid ratio. Anesthesiology 106(3): 472–483.
McCarthy MM, Brown EN & Kopell N (2008) Potential network mechanisms mediating elec-troencephalographic beta rhythm changes during propofol-induced paradoxical excitation. JNeurosci 28(50): 13488–13504.
Mehta D, Bradley EL & Kissin I (1991) Effect of alfentanil on hypnotic and antinociceptivecomponents of thiopental sodium anesthesia. J Clin Anesth 3(4): 280–284.
Merk HJ & Goudsouzian NG (1995) Evaluation of different induction techniques for trachealintubation. Middle East J Anesthesiol 13(1): 23–35.
Mi W, Sakai T, Kudo T, Kudo M & Matsuki A (2003) The interaction between fentanyl and
69
propofol during emergence from anesthesia: monitoring with the EEG-Bispectral index. JClin Anesth 15(2): 103–107.
Mi WD, Sakai T, Kudo T, Kudo M & Matsuki A (2004) Performance of bispectral index andauditory evoked potential monitors in detecting loss of consciousness during anaesthetic in-duction with propofol with and without fentanyl. Eur J Anaesthesiol 21(10): 807–811.
Mi WD, Sakai T, Singh H, Kudo T, Kudo M & Matsuki A (1999) Hypnotic endpoints vs. the bis-pectral index, 95% spectral edge frequency and median frequency during propofol infusionwith or without fentanyl. Eur J Anaesthesiol 16(1): 47–52.
Miekisch W, Fuchs P, Kamysek S, Neumann C & Schubert JK (2008) Assessment of propofolconcentrations in human breath and blood by means of HS-SPME-GC-MS. Clin Chim Acta395(1-2): 32–37.
Miller A, Sleigh JW, Barnard J & Steyn-Ross DA (2004) Does bispectral analysis of the elec-troencephalogram add anything but complexity? Br J Anaesth 92(1): 8–13.
Mourisse J, Gerrits W, Lerou J, van Egmond J, Zwarts MJ & Booij L (2003) Electromyographicassessment of blink and corneal reflexes during midazolam administration: useful methodsfor assessing depth of anesthesia? Acta Anaesthesiol Scand 47(5): 593–600.
Muncaster ARG, Sleigh JW & Williams M (2003) Changes in consciousness, conceptual mem-ory, and quantitative electroencephalographical measures during recovery from sevoflurane-and remifentanil-based anesthesia. Anesth Analg 96(3): 720–5, table of contents.
Mustola S (2004) Measuring hypnosis, analgesia, and EEG burst suppression pattern during in-travenous anaesthesia. Ph.D. thesis, Tampere University.
Mustola ST, Baer GA, Neuvonen PJ & Toivonen KJ (2005) Requirements of propofol at differentend-points without adjuvant and during two different steady infusions of remifentanil. ActaAnaesthesiol Scand 49(2): 215–221.
Myles PS, Daly D, Silvers A & Cairo S (2009) Prediction of neurological outcome using bis-pectral index monitoring in patients with severe ischemic-hypoxic brain injury undergoingemergency surgery. Anesthesiology 110(5): 1106–1115.
Myles PS, Leslie K, McNeil J, Forbes A & Chan MTV (2004) Bispectral index monitoring toprevent awareness during anaesthesia: the B-Aware randomised controlled trial. Lancet363(9423): 1757–1763.
Naguib M & Lien C (2005) Pharmacology of muscle relaxants and their antagonists. In: MillerR (ed) Miller’s Anesthesia, 481–572. Elsevier, Philadelphia, USA, 6th edition.
Nakayama M, Ichinose H, Yamamoto S, Kanaya N & Namiki A (2002) The effect of fentanylon hemodynamic and bispectral index changes during anesthesia induction with propofol. JClin Anesth 14(2): 146–149.
Nathan N, Vandroux D, Benrhaiem M, Marquet P, Preux PM & Feiss P (2004) Low alfentaniltarget-concentrations improve hemodynamic and intubating conditions during induction withsevoflurane. Can J Anaesth 51(4): 382–387.
Nelskylä KA, Yli-Hankala AM, Puro PH & Korttila KT (2001) Sevoflurane titration using bis-pectral index decreases postoperative vomiting in phase II recovery after ambulatory surgery.Anesth Analg 93(5): 1165–1169.
Nickalls RWD & Mapleson WW (2003) Age-related iso-MAC charts for isoflurane, sevofluraneand desflurane in man. Br J Anaesth 91(2): 170–174.
Niedermeyer E (1997) Alpha rhythms as physiological and abnormal phenomena. Int J Psy-chophysiol 26(1-3): 31–49.
Niedermeyer E (1999) The normal EEG of the waking adult. In: Niedermeyer E & da Silva
70
FL (eds) Electroencephalography: basic principles, clinical applicationsand related fields,149–173. Lippincott Williams & Wilkins, Baltimore, USA, 4th edition.
Nieuwenhuijs DJF, Olofsen E, Romberg RR, Sarton E, Ward D, Engbers F, Vuyk J, Mooren R,Teppema LJ & Dahan A (2003) Response surface modeling of remifentanil-propofol interac-tion on cardiorespiratory control and bispectral index. Anesthesiology 98(2): 312–322.
Nunez PL, Srinivasan R, Westdorp AF, Wijesinghe RS, Tucker DM, Silberstein RB & CaduschPJ (1997) EEG coherency. I: Statistics, reference electrode, volume conduction, Laplacians,cortical imaging, and interpretation at multiple scales. Electroencephalogr Clin Neurophysiol103(5): 499–515.
Nuwer MR, Comi G, Emerson R, Fuglsang-Frederiksen A, Guérit JM, Hinrichs H, Ikeda A,Luccas FJ & Rappelsburger P (1998) IFCN standards for digital recording of clinical EEG.International Federation of Clinical Neurophysiology. Electroencephalogr Clin Neurophysiol106(3): 259–261.
Olkkola K (1999) Anestesiologinen kliininen farmakologia ja toksikologia. In: Rosenberg P,Alahuhta S, Kanto J & Takala J (eds) Anestesiologia ja tehohoito, 60–79. Kustannus OyDuodecim, Helsinki, Finland, 1st edition.
Olofsen E, Sleigh JW & Dahan A (2002) The influence of remifentanil on the dynamic relation-ship between sevoflurane and surrogate anesthetic effect measures derived from the EEG.Anesthesiology 96(3): 555–564.
Perl T, Carstens E, Hirn A, Quintel M, Vautz W, Nolte J & Jünger M (2009) Determinationof serum propofol concentrations by breath analysis using ion mobility spectrometry. Br JAnaesth 103(6): 822–827.
Plourde G (2006) Auditory evoked potentials. Best Pract Res Clin Anaesthesiol 20(1): 129–139.Pocock G & Richards C (1999) Human physiology: the basis of medicine. Oxford University
Press Inc., New York, USA.Powell GE & Percival IC (1979) A spectral entropy method for distinguishing regular and irreg-
ular motion of Hamiltonian systems. Journal of Physics A 12: 2053–2071.Prichep LS, Gugino LD, John ER, Chabot RJ, Howard B, Merkin H, Tom ML, Wolter S, Rausch
L & Kox WJ (2004) The Patient State Index as an indicator of the level of hypnosis undergeneral anaesthesia. Br J Anaesth 92(3): 393–399.
Quah C, Gelb A & Talke P (2007) Central nervous system disease. In: Stoelting R & Miller R(eds) Basics of Anesthesia, 453–462. Elsevier, Philadelphia, USA, 5th edition.
Quasha AL, Eger EI & Tinker JH (1980) Determination and applications of MAC. Anesthesiol-ogy 53(4): 315–334.
Rampil IJ (1998) A primer for EEG signal processing in anesthesia. Anesthesiology 89(4): 980–1002.
Renna M, Wigmore T, Mofeez A & Gillbe C (2002) Biasing effect of the electromyogram onBIS: a controlled study during high-dose fentanyl induction. J Clin Monit Comput 17(6):377–381.
Reves J, Glass P, Lubarsky D & McEvoy M (2005) Intravenous nonopioid anesthetics. In: MillerR (ed) Miller’s Anesthesia, 317–378. Elsevier, Philadelphia, USA, 6th edition.
Revuelta M, Paniagua P, Campos JM, Fernández JA, Martínez A, Jospin M & Litvan H (2008)Validation of the index of consciousness during sevoflurane and remifentanil anaesthesia: acomparison with the bispectral index and the cerebral state index. Br J Anaesth 101(5): 653–658.
Århem P, Klement G & Nilsson J (2003) Mechanisms of anesthesia: towards integrating network,
71
cellular, and molecular level modeling. Neuropsychopharmacology 28 Suppl 1: S40–S47.Röpcke H, Könen-Bergmann M, Cuhls M, Bouillon T & Hoeft A (2001) Propofol and remifen-
tanil pharmacodynamic interaction during orthopedic surgical procedures as measured byeffects on bispectral index. J Clin Anesth 13(3): 198–207.
Röpcke H, Lier H, Hoeft A & Schwilden H (1999) Isoflurane, nitrous oxide, and fentanyl phar-macodynamic interactions in surgical patients as measured by effects on median power fre-quency. J Clin Anesth 11(7): 555–562.
Sackellares JC (2008) Seizure prediction. Epilepsy Curr 8(3): 55–59.Sainio K (2006) Lapsen normaali EEG. In: Partanen J, Falck B, Hasan J, Jäntti V, Salmi T
& Tolonen U (eds) Kliininen neurofysiologia, 136–143. Kustannus Oy Duodecim, Helsinki,Finland, 1st edition.
Sanei S & Chambers J (2007) EEG signal processing. John Wiley & Sons Ltd, West Sussex,England.
Scheinin H & Valtonen M (1999) Laskimoanestesia ja sedaatio. In: Rosenberg P, Alahuhta S,Kanto J & Takala J (eds) Anestesiologia ja tehohoito, 95–109. Kustannus Oy Duodecim,Helsinki, Finland, 1st edition.
Schmidt GN, Bischoff P, Standl T, Lankenau G, Hilbert M & Esch JSA (2004) Comparativeevaluation of Narcotrend, Bispectral Index, and classical electroencephalographic variablesduring induction, maintenance, and emergence of a propofol/remifentanil anesthesia. AnesthAnalg 98(5): 1346–53.
Schmidt GN, Bischoff P, Standl T, Voigt M, Papavero L & am Esch JS (2002) Narcotrend, bis-pectral index, and classical electroencephalogram variables during emergence from propo-fol/remifentanil anesthesia. Anesth Analg 95(5): 1324–30.
Schultz B, Grouven U & Schultz A (2002) Automatic classification algorithms of the EEG moni-tor Narcotrend for routinely recorded EEG data from general anaesthesia: a validation study.Biomed Tech (Berl) 47(1-2): 9–13.
Schwilden H, Fechner J, Albrecht S, Hering W, Ihmsen H & Schüttler J (2003) Testing andmodelling the interaction of alfentanil and propofol on the EEG. Eur J Anaesthesiol 20(5):363–372.
Schwilden H & Jeleazcov C (2002) Does the EEG during isoflurane/alfentanil anesthesia differfrom linear random data? J Clin Monit Comput 17(7-8): 449–457.
Scott JC, Ponganis KV & Stanski DR (1985) EEG quantitation of narcotic effect: the comparativepharmacodynamics of fentanyl and alfentanil. Anesthesiology 62(3): 234–241.
Servin FS (2003) Remifentanil: an update. Curr Opin Anaesthesiol 16(4): 367–372.Shafer S & Schwinn D (2005) Basic principles of pharmacology related to anesthesia. In: Miller
R (ed) Miller’s Anesthesia, 67–104. Elsevier, Philadelphia, USA, 6th edition.Shannon CE (1948) A mathematical theory of communication. The Bell System Technical Jour-
nal 27(379–423): 623–656.Simons P, Cockshott I & Douglas E (1985) Blood concentrations, metabolism and elimination
after a subanesthetic intravenous dose of (14)C-propofol (Diprivan) to male volunteers [ab-stract]. Postgrad Med J 61: 64.
Sleigh J (2010) Disentangling Hypnos from his poppies. Anesthesiology 113(2): 271–272.Sleigh JW, Steyn-Ross DA, Steyn-Ross ML, Grant C & Ludbrook G (2004) Cortical entropy
changes with general anaesthesia: theory and experiment. Physiol Meas 25(4): 921–934.Sloan TB (1998) Anesthetic effects on electrophysiologic recordings. J Clin Neurophysiol 15(3):
217–226.
72
Sonkajärvi E, Puumala P, Erola T, Baer GA, Karvonen E, Suominen K & Jäntti V (2008) Burstsuppression during propofol anaesthesia recorded from scalp and subthalamic electrodes: re-port of three cases. Acta Anaesthesiol Scand 52(2): 274–279.
Spiegel A, Tonner PH & Renna M (2006) Altered states of consciousness: processed EEG inmental disease. Best Pract Res Clin Anaesthesiol 20(1): 57–67.
Särkelä M, Mustola S, Seppänen T, Koskinen M, Lepola P, Suominen K, Juvonen T, Tolvanen-Laakso H & Jäntti V (2002) Automatic analysis and monitoring of burst suppression in anes-thesia. J Clin Monit Comput 17(2): 125–134.
Stanski DR (1992) Pharmacodynamic modeling of anesthetic EEG drug effects. Annu Rev Phar-macol Toxicol 32: 423–447.
Strachan AN & Edwards ND (2000) Randomized placebo-controlled trial to assess the effect ofremifentanil and propofol on bispectral index and sedation. Br J Anaesth 84(4): 489–490.
Struys MMRF, Jensen EW, Smith W, Smith NT, Rampil I, Dumortier FJE, Mestach C & MortierEP (2002) Performance of the ARX-derived auditory evoked potential index as an indicatorof anesthetic depth: a comparison with bispectral index and hemodynamic measures duringpropofol administration. Anesthesiology 96(4): 803–816.
Struys MMRF, Vereecke H, Moerman A, Jensen EW, Verhaeghen D, Neve ND, Dumortier FJE &Mortier EP (2003) Ability of the bispectral index, autoregressive modelling with exogenousinput-derived auditory evoked potentials, and predicted propofol concentrations to measurepatient responsiveness during anesthesia with propofol and remifentanil. Anesthesiology99(4): 802–812.
Thornton C & Sharpe RM (1998) Evoked responses in anaesthesia. Br J Anaesth 81(5): 771–781.Tinker JH, Sharbrough FW & Michenfelder JD (1977) Anterior shift of the dominant EEG
rhytham during anesthesia in the Java monkey: correlation with anesthetic potency. Anesthe-siology 46(4): 252–259.
Tolonen U & Lehtinen I (2006) Aikuisen normaali EEG. In: Partanen J, Falck B, Hasan J, JänttiV, Salmi T & Tolonen U (eds) Kliininen neurofysiologia, 109–128. Kustannus Oy Duodecim,Helsinki, Finland, 1st edition.
Tonner PH & Bein B (2006) Classic electroencephalographic parameters: median frequency,spectral edge frequency etc. Best Pract Res Clin Anaesthesiol 20(1): 147–159.
Vakkuri A, Yli-Hankala A, Sandin R, Mustola S, Høymork S, Nyblom S, Talja P, Sampson T, vanGils M & Viertiö-Oja H (2005) Spectral entropy monitoring is associated with reduced propo-fol use and faster emergence in propofol-nitrous oxide-alfentanil anesthesia. Anesthesiology103(2): 274–279.
van Gils M, Korhonen I & Yli-Hankala A (2002) Methods for assessing adequacy of anesthesia.Crit Rev Biomed Eng 30(1–3): 99–130.
Vanluchene ALG, Struys MMRF, Heyse BEK & Mortier EP (2004) Spectral entropy measure-ment of patient responsiveness during propofol and remifentanil. A comparison with thebispectral index. Br J Anaesth 93(5): 645–654.
Vaughan DJ, Shinner G, Thornton C & Brunner MD (2000) Effect of tramadol on electroen-cephalographic and auditory-evoked response variables during light anaesthesia. Br JAnaesth 85(5): 705–707.
Velly LJ, Rey MF, Bruder NJ, Gouvitsos FA, Witjas T, Regis JM, Peragut JC & Gouin FM(2007) Differential dynamic of action on cortical and subcortical structures of anestheticagents during induction of anesthesia. Anesthesiology 107(2): 202–212.
Viertiö-Oja H, Maja V, Särkelä M, Talja P, Tenkanen N, Tolvanen-Laakso H, Paloheimo M,
73
Vakkuri A, Yli-Hankala A & Meriläinen P (2004) Description of the Entropy algorithm asapplied in the Datex-Ohmeda S/5 Entropy Module. Acta Anaesthesiol Scand 48(2): 154–161.
von Dincklage F, Hackbarth M, Mager R, Rehberg B & Baars JH (2010) Monitoring of theresponsiveness to noxious stimuli during anaesthesia with propofol and remifentanil by usingRIII reflex threshold and bispectral index. Br J Anaesth 104(2): 201–208.
Voss L & Sleigh J (2007) Monitoring consciousness: the current status of EEG-based depth ofanaesthesia monitors. Best Pract Res Clin Anaesthesiol 21(3): 313–325.
Vuyk J, Lim T, Engbers FH, Burm AG, Vletter AA & Bovill JG (1995) The pharmacodynamicinteraction of propofol and alfentanil during lower abdominal surgery in women. Anesthesi-ology 83(1): 8–22.
Werry C, Neulinger A, Eckert O, Lehmkuhl P & Pichlmayr I (1996) [Age-related correlationbetween EEG parameters and depth of anesthesia under propofol. Effect of fentanyl]. Anaes-thesist 45(8): 722–730.
Westmoreland CL, Hoke JF, Sebel PS, Hug CC & Muir KT (1993) Pharmacokinetics of remifen-tanil (GI87084B) and its major metabolite (GI90291) in patients undergoing elective inpa-tient surgery. Anesthesiology 79(5): 893–903.
Yli-Hankala A, Vakkuri A, Annila P & Korttila K (1999) EEG bispectral index monitoring insevoflurane or propofol anaesthesia: analysis of direct costs and immediate recovery. ActaAnaesthesiol Scand 43(5): 545–549.
Yufune S, Takamatsu I, Masui K & Kazama T (2011) Effect of remifentanil on plasma propofolconcentration and bispectral index during propofol anaesthesia. Br J Anaesth 106(2): 208–214.
Yumura J, Koukita Y, ichi Fukuda K, Kaneko Y & Ichinohe T (2009) Low dose of fentanylreduces predicted effect-site concentration of propofol for flexible laryngeal mask airwayinsertion. J Anesth 23(2): 203–208.
Zbinden AM, Maggiorini M, Petersen-Felix S, Lauber R, Thomson DA & Minder CE (1994a)Anesthetic depth defined using multiple noxious stimuli during isoflurane/oxygen anesthesia.I. Motor reactions. Anesthesiology 80(2): 253–260.
Zbinden AM, Petersen-Felix S & Thomson DA (1994b) Anesthetic depth defined using multiplenoxious stimuli during isoflurane/oxygen anesthesia. II. Hemodynamic responses. Anesthe-siology 80(2): 261–267.
74
Original articles
I Kortelainen J, Koskinen M, Mustola S & Seppänen T (2007) EEG frequency progressionduring induction of anesthesia: from start of infusion to onset of burst suppression pat-tern. Proceedings of the 29th Annual International Conference of the IEEE Engineering inMedicine and Biology Society, Lyon, France: 1570–1573.
II Kortelainen J, Koskinen M, Mustola S & Seppänen T (2008) Remifentanil modifies the re-lation of electroencephalographic spectral changes and clinical endpoints in propofol anes-thesia. Anesthesiology 109: 198–205.
III Kortelainen J, Koskinen M, Mustola S & Seppänen T (2009) Effects of remifentanil onthe spectrum and quantitative parameters of electroencephalogram in propofol anesthesia.Anesthesiology 111: 574–583.
IV Kortelainen J, Väyrynen E & Seppänen T (2011) Depth of anesthesia during multidruginfusion: separating the effects of propofol and remifentanil using the spectral features ofEEG. IEEE Transactions on Biomedical Engineering 58: 1216–1223.
V Kortelainen J, Väyrynen E & Seppänen T (2011) Isomap approach to EEG-based assess-ment of neurophysiological changes during anesthesia. IEEE Transactions on Neural Sys-tems and Rehabilitation Engineering 19: 113–120.
Reprinted with permission from IEEE (I, IV, V) and the American Society of Anesthesiologists,Inc. Lippincott Williams & Wilkins, Inc. (II, III).
Original publications are not included in the electronic version of the dissertation.
75

76
A C T A U N I V E R S I T A T I S O U L U E N S I S
Book orders:Granum: Virtual book storehttp://granum.uta.fi/granum/
S E R I E S C T E C H N I C A
369. Nousiainen, Olli (2010) Characterization of second-level lead-free BGAinterconnections in thermomechanically loaded LTCC/PWB assemblies
370. Taskila, Sanna (2010) Improved enrichment cultivation of selected food-contaminating bacteria
371. Haapala, Antti (2010) Paper machine white water treatment in channel flow :integration of passive deaeration and selective flotation
372. Plekh, Maxim (2010) Ferroelectric performance for nanometer scaled devices
373. Lee, Young-Dong (2010) Wireless vital signs monitoring system for ubiquitoushealthcare with practical tests and reliability analysis
374. Sillanpää, Ilkka (2010) Supply chain performance measurement in themanufacturing industry : a single case study research to develop a supply chainperformance measurement framework
375. Marttila, Hannu (2010) Managing erosion, sediment transport and water quality indrained peatland catchments
376. Honkanen, Seppo (2011) Tekniikan ylioppilaiden valmistumiseen johtavienopintopolkujen mallintaminen — perusteena lukiossa ja opiskelun alkuvaiheessasaavutettu opintomenestys
377. Malinen, Ilkka (2010) Improving the robustness with modified boundedhomotopies and problem-tailored solving procedures
378. Yang, Dayou (2011) Optimisation of product change process and demand-supplychain in high tech environment
379. Kalliokoski, Juha (2011) Models of filtration curve as a part of pulp drainageanalyzers
380. Myllylä, Markus (2011) Detection algorithms and architectures for wireless spatialmultiplexing in MIMO-OFDM systems
381. Muhos, Matti (2011) Early stages of technology intensive companies
382. Laitinen, Ossi (2011) Utilisation of tube flow fractionation in fibre and particleanalysis
383. Lasanen, Kimmo (2011) Integrated analogue CMOS circuits and structures forheart rate detectors and other low-voltage, low-power applications
384. Herrala, Maila (2011) Governance of infrastructure networks : developmentavenues for the Finnish water and sewage sector
C385etukansi.fm Page 2 Wednesday, July 6, 2011 9:47 AM
ABCDEFG
UNIVERS ITY OF OULU P.O.B . 7500 F I -90014 UNIVERS ITY OF OULU F INLAND
A C T A U N I V E R S I T A T I S O U L U E N S I S
S E R I E S E D I T O R S
SCIENTIAE RERUM NATURALIUM
HUMANIORA
TECHNICA
MEDICA
SCIENTIAE RERUM SOCIALIUM
SCRIPTA ACADEMICA
OECONOMICA
EDITOR IN CHIEF
PUBLICATIONS EDITOR
Senior Assistant Jorma Arhippainen
Lecturer Santeri Palviainen
Professor Hannu Heusala
Professor Olli Vuolteenaho
Senior Researcher Eila Estola
Director Sinikka Eskelinen
Professor Jari Juga
Professor Olli Vuolteenaho
Publications Editor Kirsti Nurkkala
ISBN 978-951-42-9484-6 (Paperback)ISBN 978-951-42-9485-3 (PDF)ISSN 0355-3213 (Print)ISSN 1796-2226 (Online)
U N I V E R S I TAT I S O U L U E N S I SACTAC
TECHNICA
U N I V E R S I TAT I S O U L U E N S I SACTAC
TECHNICA
OULU 2011
C 385
Jukka Kortelainen
EEG-BASED DEPTH OF ANESTHESIA MEASUREMENTSEPARATING THE EFFECTS OF PROPOFOL AND REMIFENTANIL
UNIVERSITY OF OULU,FACULTY OF TECHNOLOGY,DEPARTMENT OF COMPUTER SCIENCE AND ENGINEERING;INFOTECH OULU
C 385
ACTA
Jukka Kortelainen
C385etukansi.fm Page 1 Wednesday, July 6, 2011 9:47 AM


![NSF Project EEG CIRCUIT DESIGN. Micro-Power EEG Acquisition SoC[10] Electrode circuit EEG sensing Interference.](https://static.fdocuments.net/doc/165x107/56649cfb5503460f949ccecd/nsf-project-eeg-circuit-design-micro-power-eeg-acquisition-soc10-electrode.jpg)