
EE 382C Final Project Presentation - Stanford CVA...
26
EE 382C Final Project Presentation Ted Jiang Curt Harting 5/24/11
Transcript of EE 382C Final Project Presentation - Stanford CVA...
EE 382C Final Project Presentation
Ted Jiang
Curt Harting
5/24/11
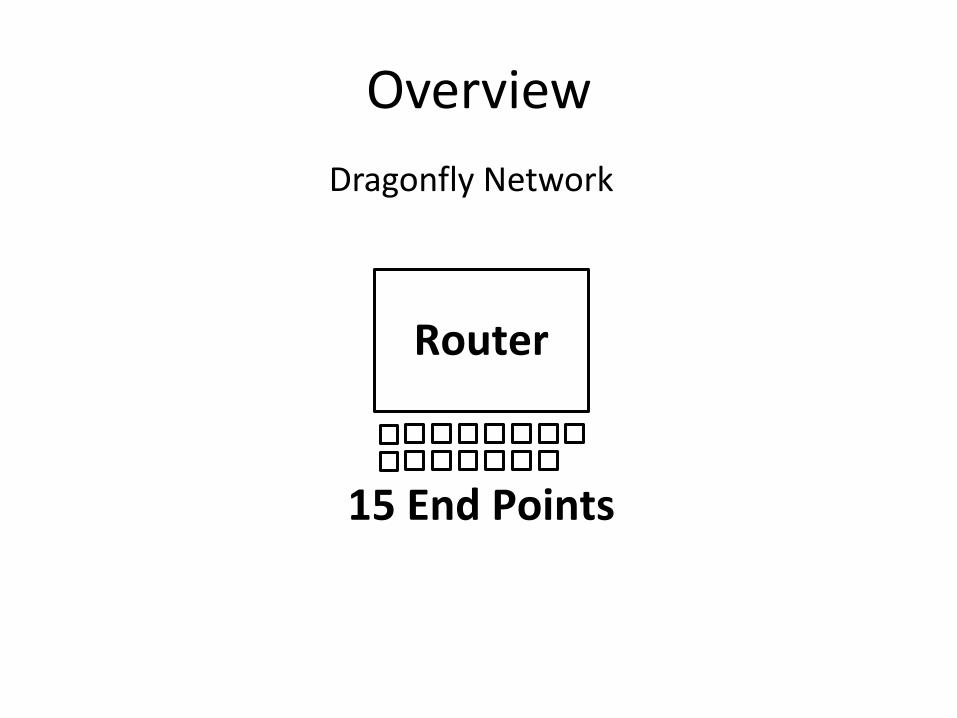
Overview
Router
15 End Points
Dragonfly Network
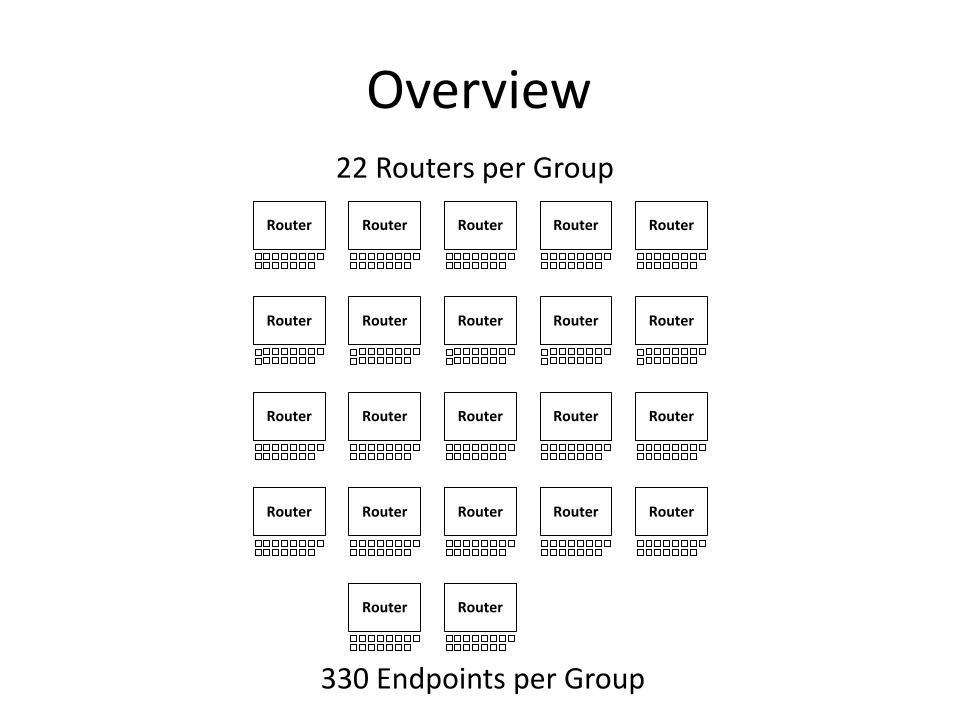
Overview 22 Routers per Group
330 Endpoints per Group
Router Router Router Router
Router Router Router Router
Router Router Router Router
Router Router Router Router
Router Router
Router
Router
Router
Router
Overview
Router
Router Router
Router Router
Router Router
Router
Router
Router Router
Router Router
Router Router
Router
Router Router Router Router
RouterRouter
15 End Points
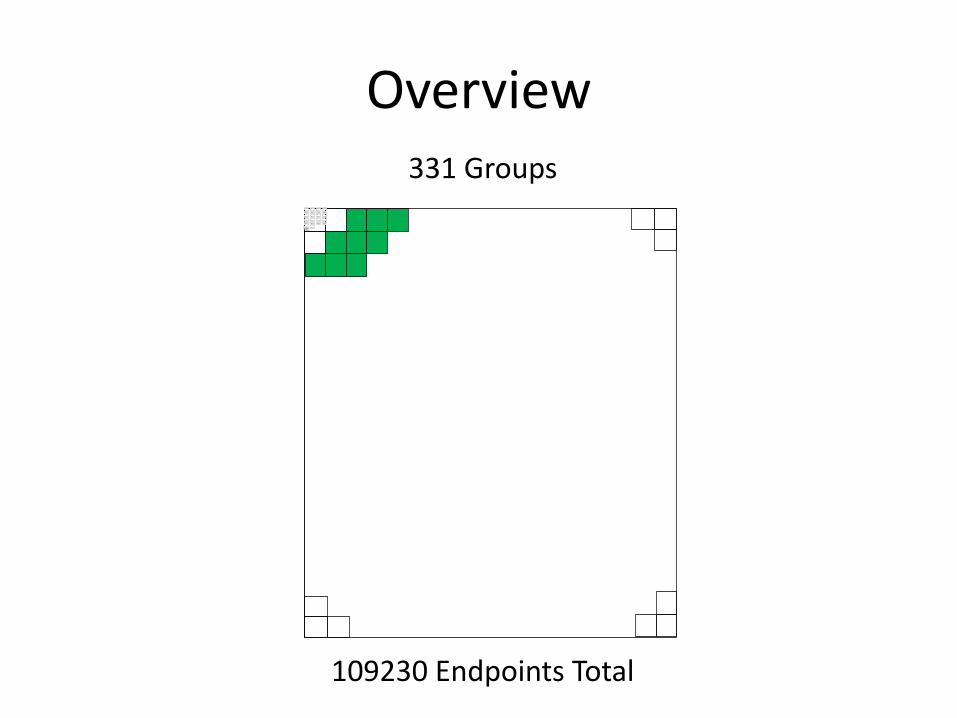
331 Groups
109230 Endpoints Total
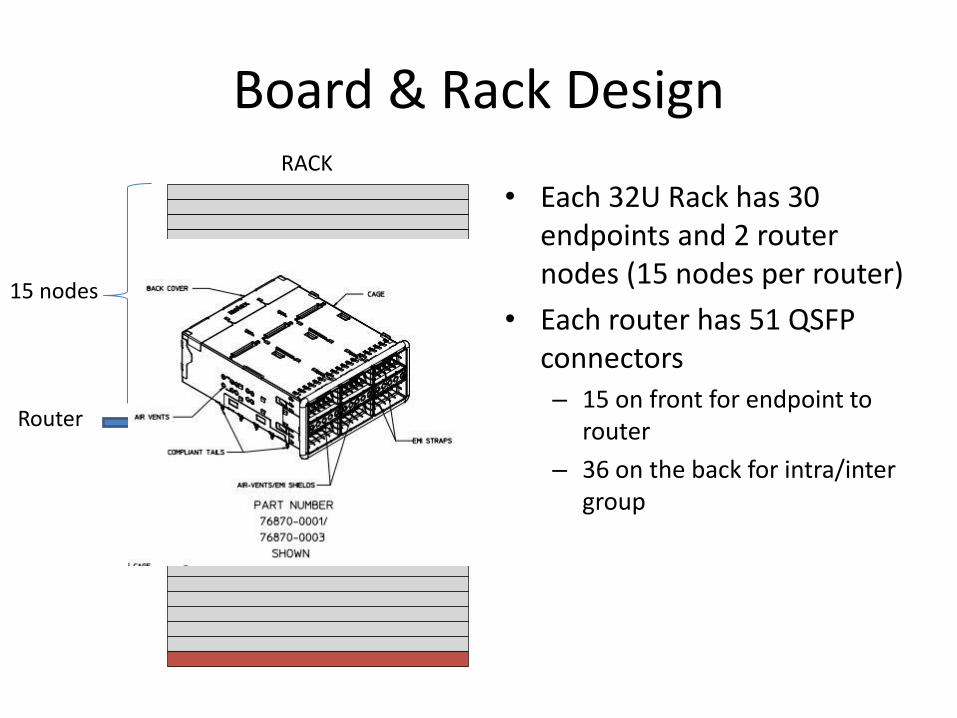
Board & Rack Design
• Each 32U Rack has 30 endpoints and 2 router nodes (15 nodes per router)
• Each router has 51 QSFP connectors – 15 on front for endpoint to
router
– 36 on the back for intra/inter group
RACK
15 nodes
Router
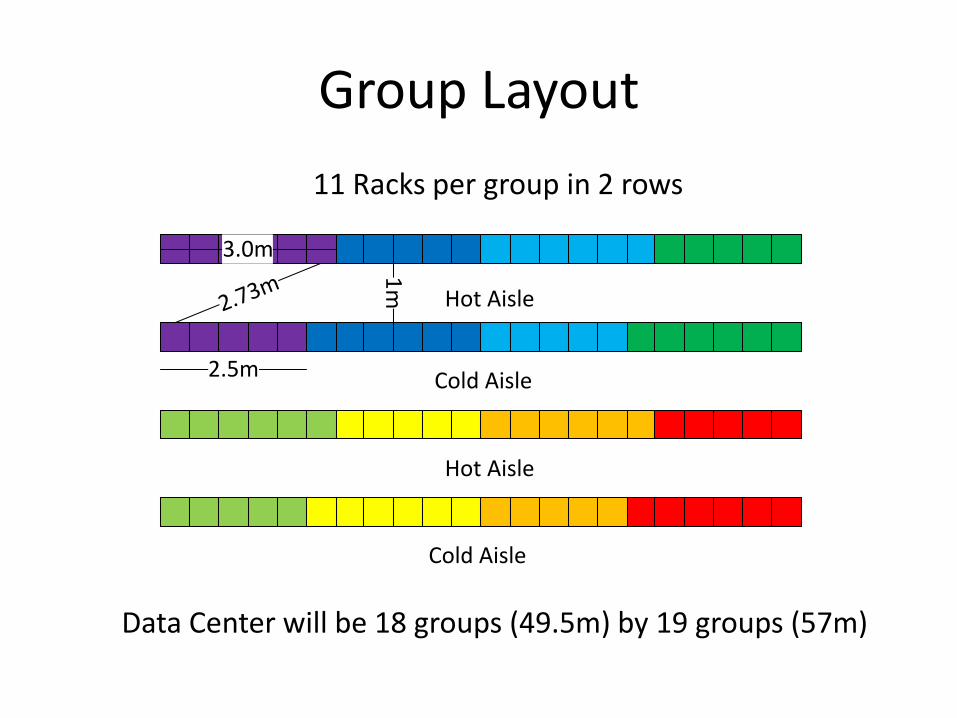
Group Layout
2.73m Hot Aisle
Cold Aisle
Hot Aisle
Cold Aisle
2.5m
3.0m
1m
11 Racks per group in 2 rows
Data Center will be 18 groups (49.5m) by 19 groups (57m)
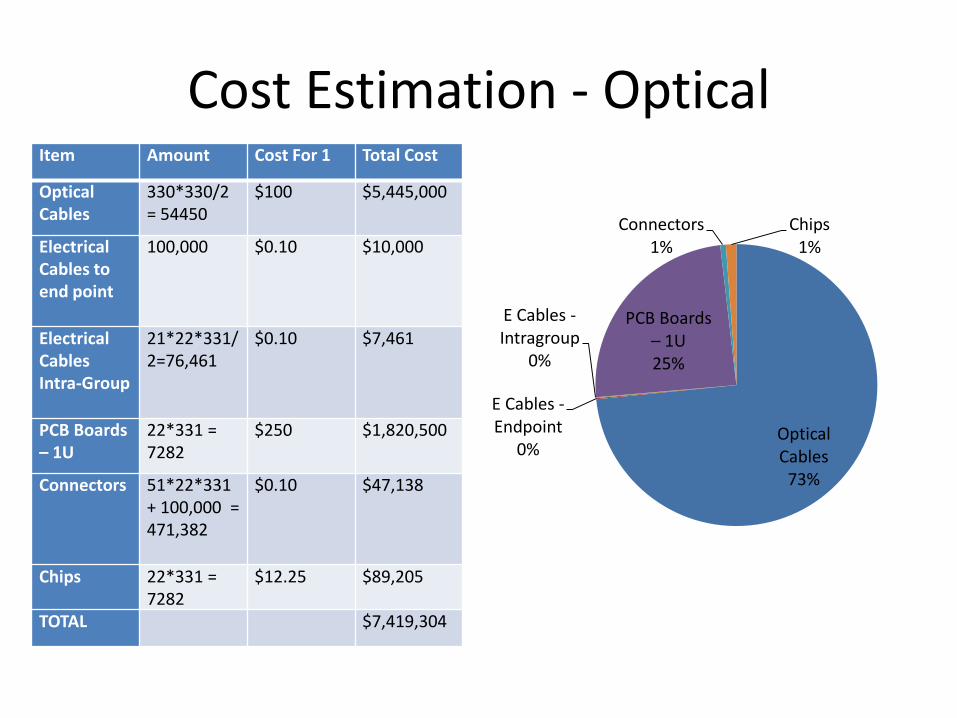
Cost Estimation - Optical Item Amount Cost For 1 Total Cost
Optical Cables
330*330/2 = 54450
$100 $5,445,000
Electrical Cables to end point
100,000 $0.10 $10,000
Electrical Cables Intra-Group
21*22*331/2=76,461
$0.10 $7,461
PCB Boards – 1U
22*331 = 7282
$250 $1,820,500
Connectors 51*22*331 + 100,000 = 471,382
$0.10 $47,138
Chips 22*331 = 7282
$12.25 $89,205
TOTAL $7,419,304
Optical Cables
73%
E Cables - Endpoint
0%
E Cables - Intragroup
0%
PCB Boards – 1U 25%
Connectors 1%
Chips 1%
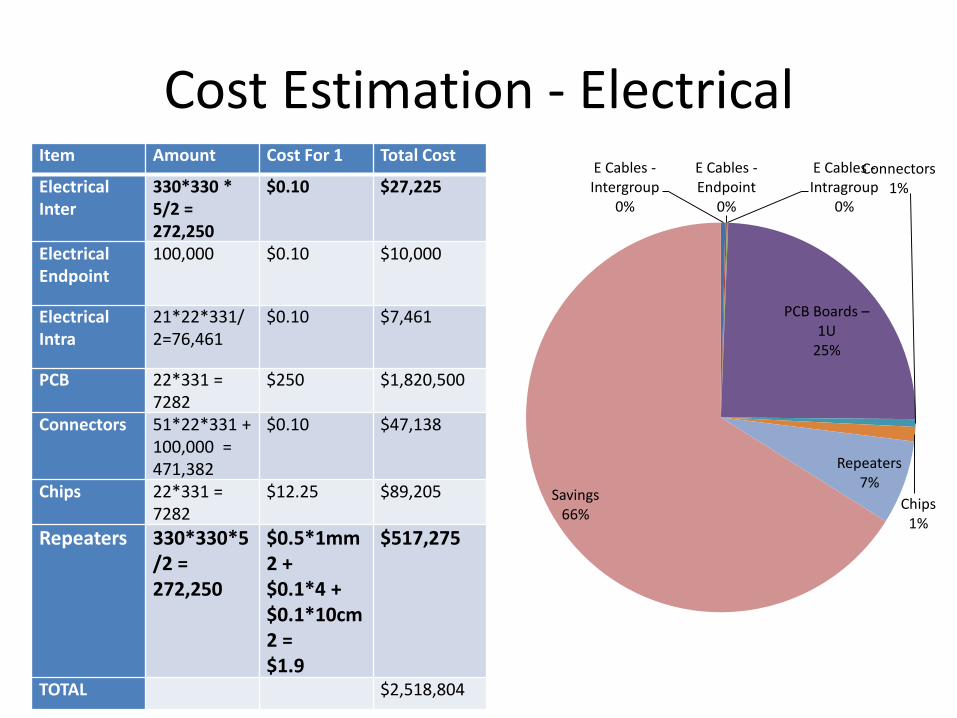
Cost Estimation - Electrical Item Amount Cost For 1 Total Cost
Electrical Inter
330*330 * 5/2 = 272,250
$0.10 $27,225
Electrical Endpoint
100,000 $0.10 $10,000
Electrical Intra
21*22*331/2=76,461
$0.10 $7,461
PCB 22*331 = 7282
$250 $1,820,500
Connectors 51*22*331 + 100,000 = 471,382
$0.10 $47,138
Chips 22*331 = 7282
$12.25 $89,205
Repeaters 330*330*5/2 = 272,250
$0.5*1mm2 + $0.1*4 + $0.1*10cm2 = $1.9
$517,275
TOTAL $2,518,804
E Cables - Intergroup
0%
E Cables - Endpoint
0%
E Cables - Intragroup
0%
PCB Boards – 1U
25%
Connectors 1%
Chips 1%
Repeaters 7%
Savings 66%
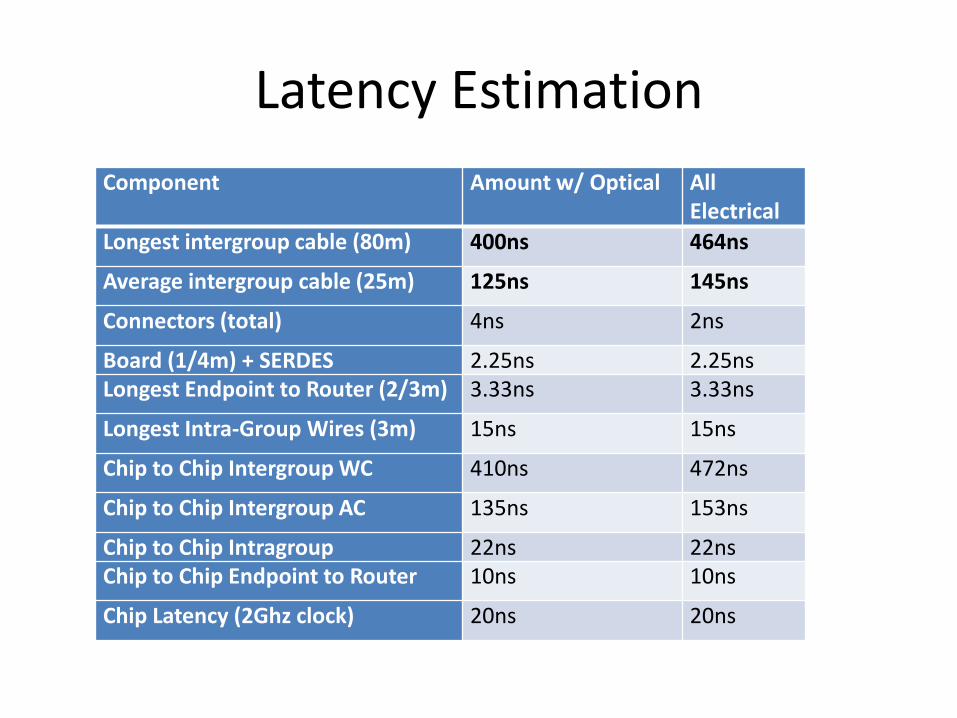
Latency Estimation
Component Amount w/ Optical All Electrical
Longest intergroup cable (80m) 400ns 464ns
Average intergroup cable (25m) 125ns 145ns
Connectors (total) 4ns 2ns
Board (1/4m) + SERDES 2.25ns 2.25ns Longest Endpoint to Router (2/3m) 3.33ns 3.33ns
Longest Intra-Group Wires (3m) 15ns 15ns
Chip to Chip Intergroup WC 410ns 472ns
Chip to Chip Intergroup AC 135ns 153ns
Chip to Chip Intragroup 22ns 22ns Chip to Chip Endpoint to Router 10ns 10ns
Chip Latency (2Ghz clock) 20ns 20ns
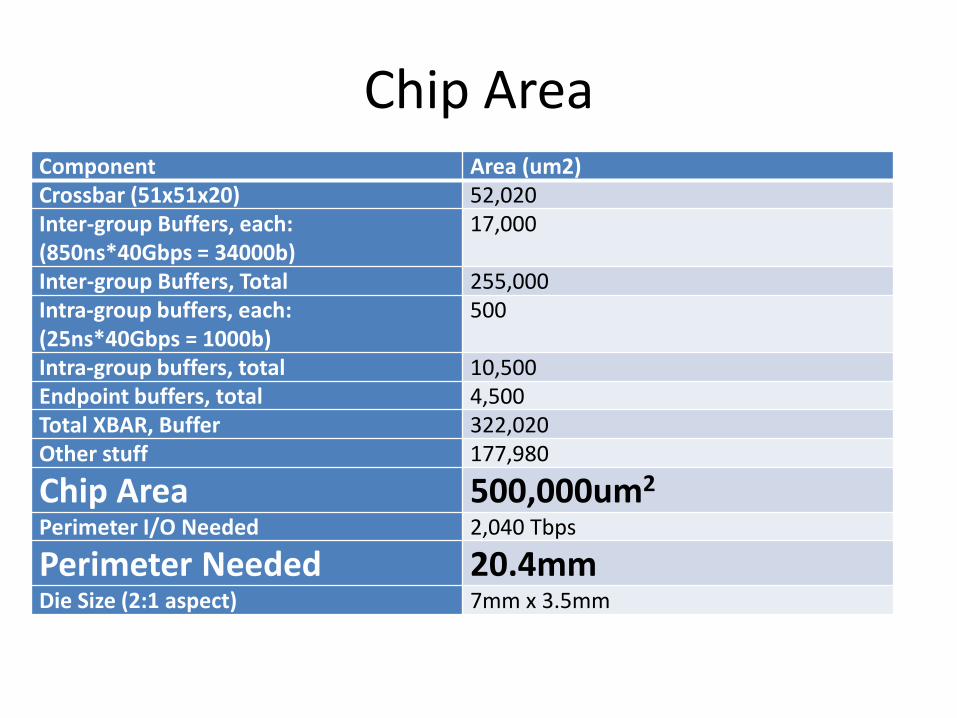
Chip Area Component Area (um2) Crossbar (51x51x20) 52,020 Inter-group Buffers, each: (850ns*40Gbps = 34000b)
17,000
Inter-group Buffers, Total 255,000 Intra-group buffers, each: (25ns*40Gbps = 1000b)
500
Intra-group buffers, total 10,500 Endpoint buffers, total 4,500 Total XBAR, Buffer 322,020 Other stuff 177,980
Chip Area 500,000um2 Perimeter I/O Needed 2,040 Tbps
Perimeter Needed 20.4mm Die Size (2:1 aspect) 7mm x 3.5mm
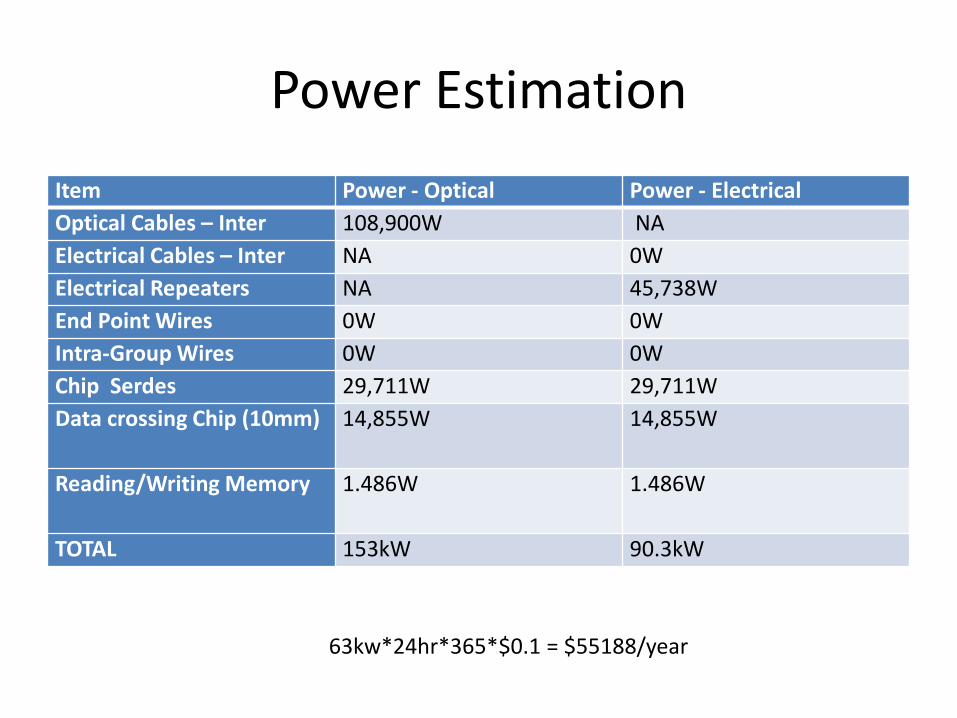
Power Estimation
Item Power - Optical Power - Electrical
Optical Cables – Inter 108,900W NA
Electrical Cables – Inter NA 0W
Electrical Repeaters NA 45,738W
End Point Wires 0W 0W
Intra-Group Wires 0W 0W
Chip Serdes 29,711W 29,711W
Data crossing Chip (10mm) 14,855W 14,855W
Reading/Writing Memory 1.486W 1.486W
TOTAL 153kW 90.3kW
63kw*24hr*365*$0.1 = $55188/year
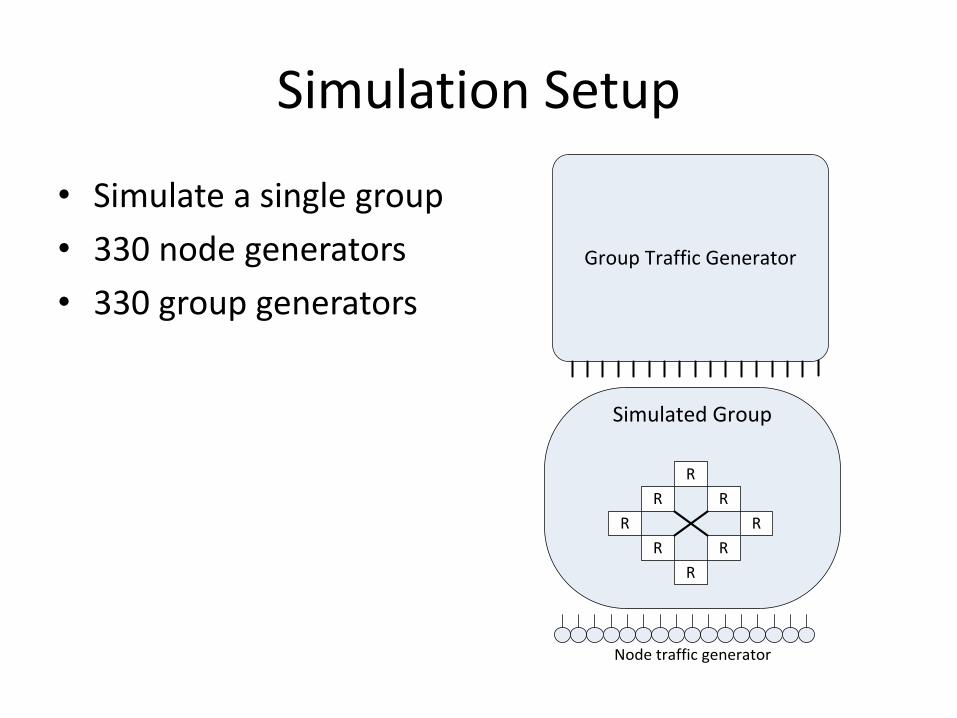
Simulation Setup
• Simulate a single group
• 330 node generators
• 330 group generators
Simulated Group
R
R
R
R
R
R
R
R
Node traffic generator
Group Traffic Generator
Simulated Group
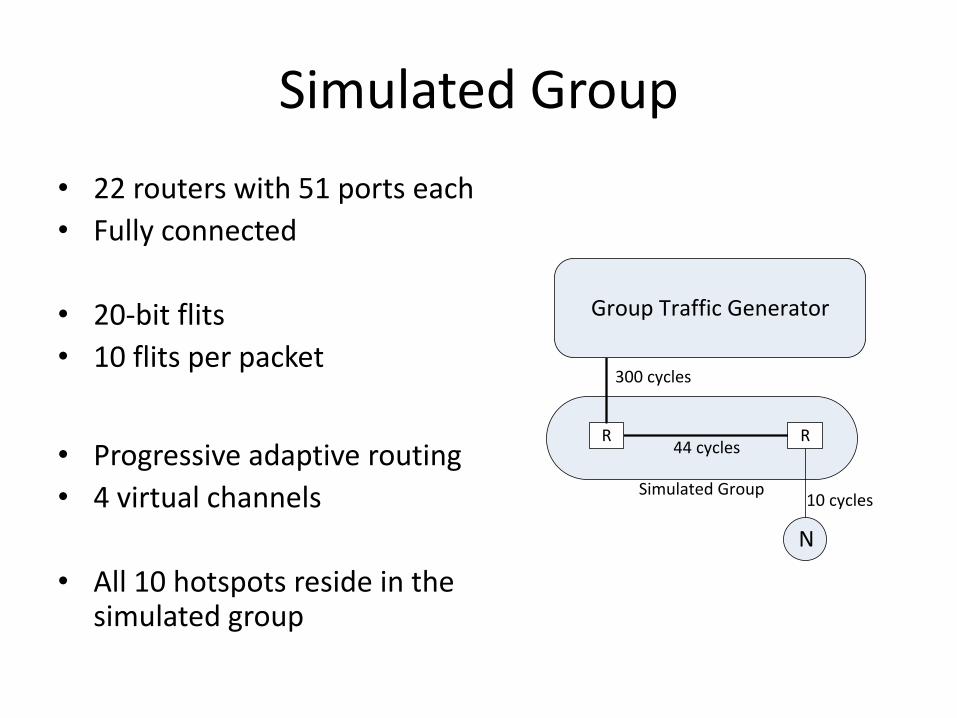
• 22 routers with 51 ports each
• Fully connected
• 20-bit flits
• 10 flits per packet
• Progressive adaptive routing
• 4 virtual channels
• All 10 hotspots reside in the simulated group
R R44 cycles
Group Traffic Generator
300 cycles
N
10 cyclesSimulated Group
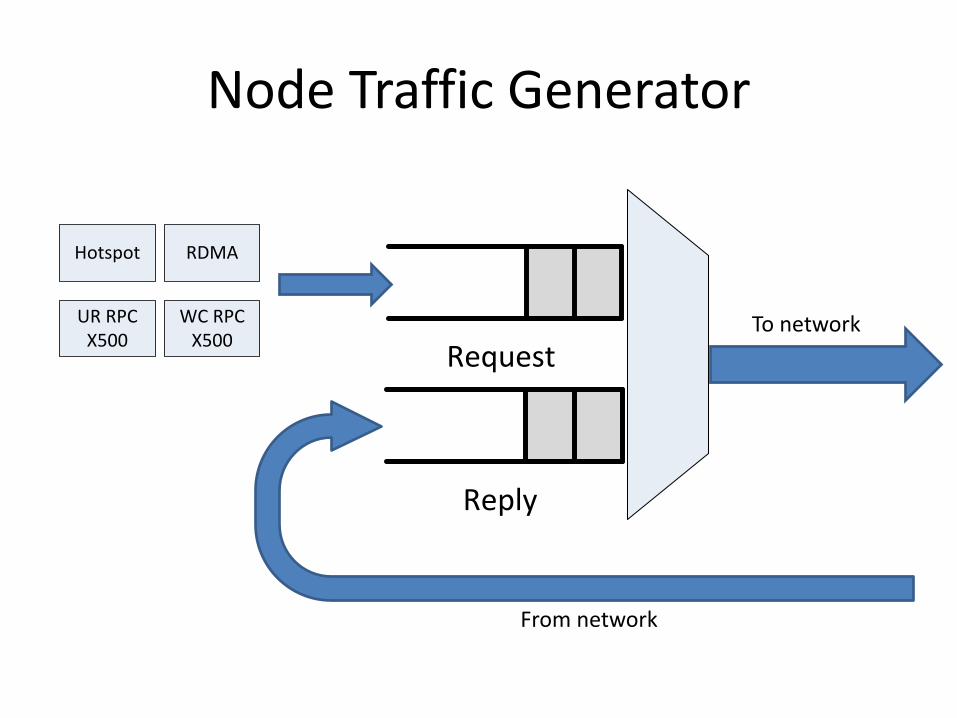
Node Traffic Generator
Hotspot RDMA
UR RPCX500
WC RPCX500
From network
To network
Request
Reply
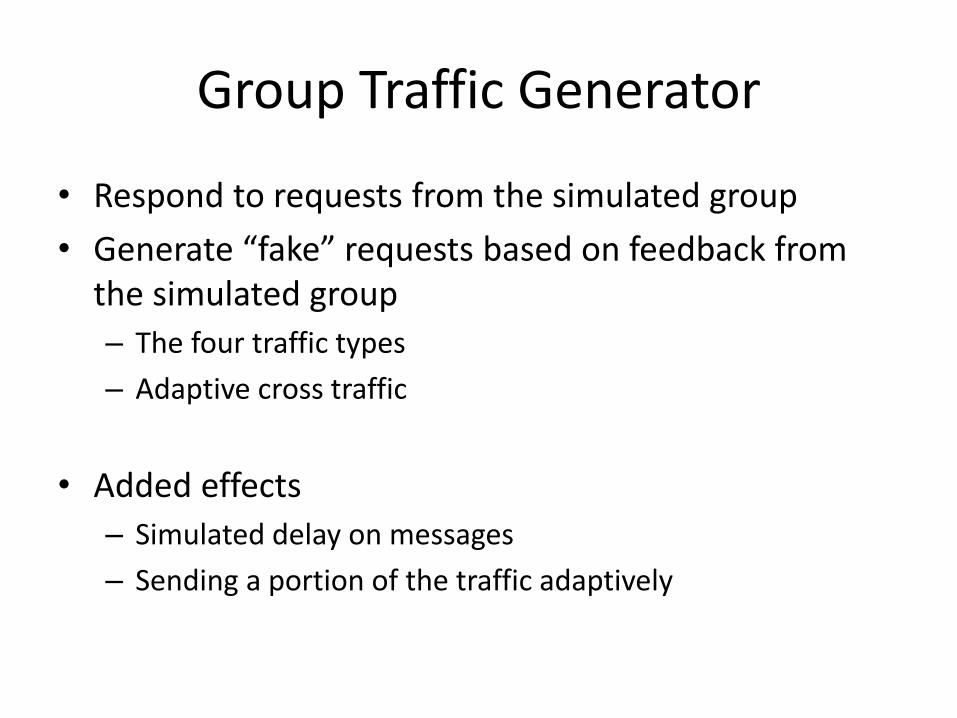
Group Traffic Generator
• Respond to requests from the simulated group
• Generate “fake” requests based on feedback from the simulated group
– The four traffic types
– Adaptive cross traffic
• Added effects
– Simulated delay on messages
– Sending a portion of the traffic adaptively
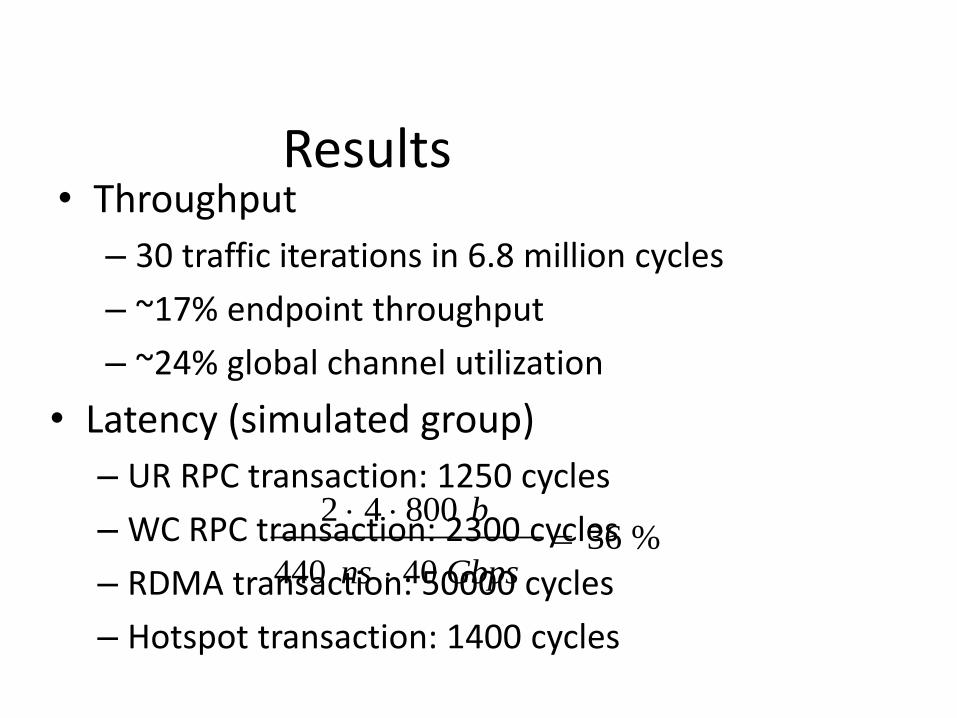
Results • Throughput
– 30 traffic iterations in 6.8 million cycles
– ~17% endpoint throughput
– ~24% global channel utilization
%3640440
80042
Gbpsns
b
• Latency (simulated group)
– UR RPC transaction: 1250 cycles
– WC RPC transaction: 2300 cycles
– RDMA transaction: 50000 cycles
– Hotspot transaction: 1400 cycles
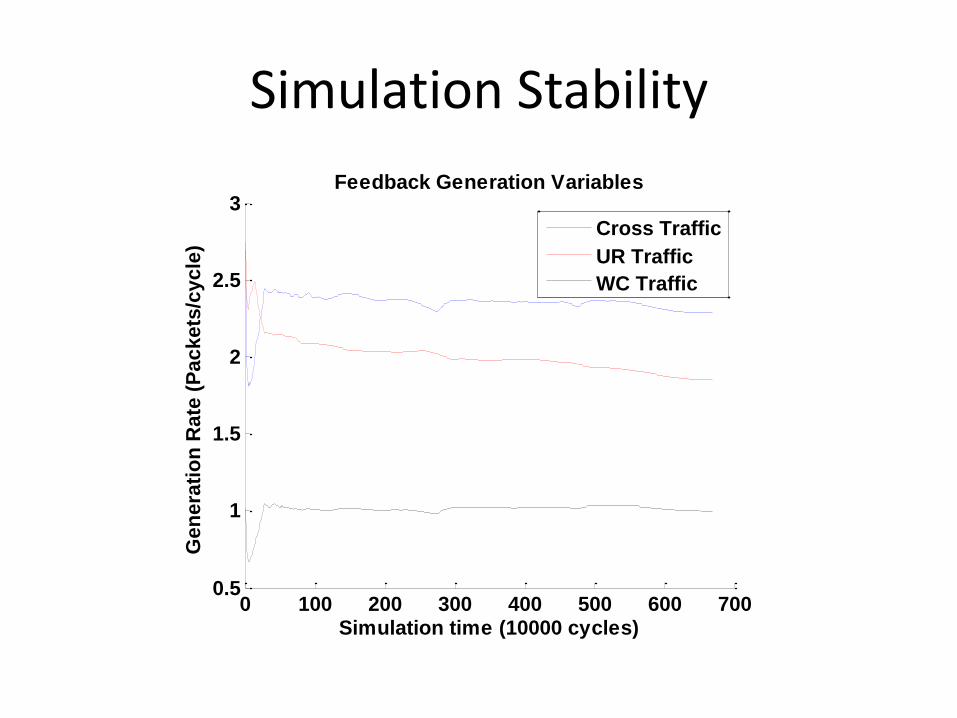
Simulation Stability
0 100 200 300 400 500 600 7000.5
1
1.5
2
2.5
3G
en
era
tio
n R
ate
(P
ackets
/cycle
)
Simulation time (10000 cycles)
Feedback Generation Variables
Cross Traffic
UR Traffic
WC Traffic
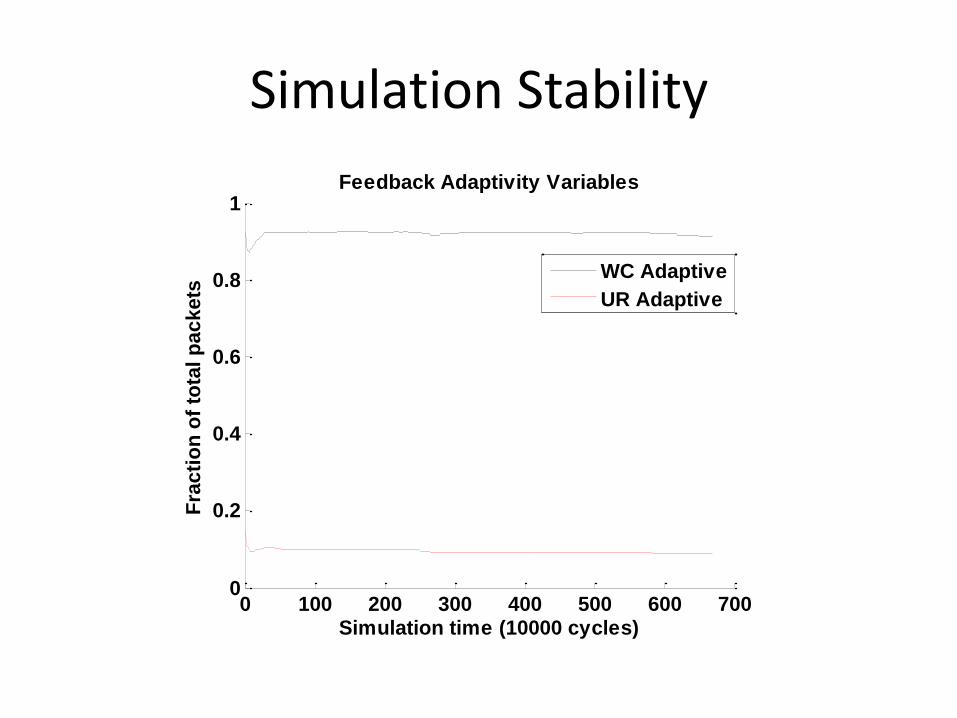
Simulation Stability
0 100 200 300 400 500 600 7000
0.2
0.4
0.6
0.8
1F
rac
tio
n o
f to
tal p
acke
ts
Simulation time (10000 cycles)
Feedback Adaptivity Variables
WC Adaptive
UR Adaptive
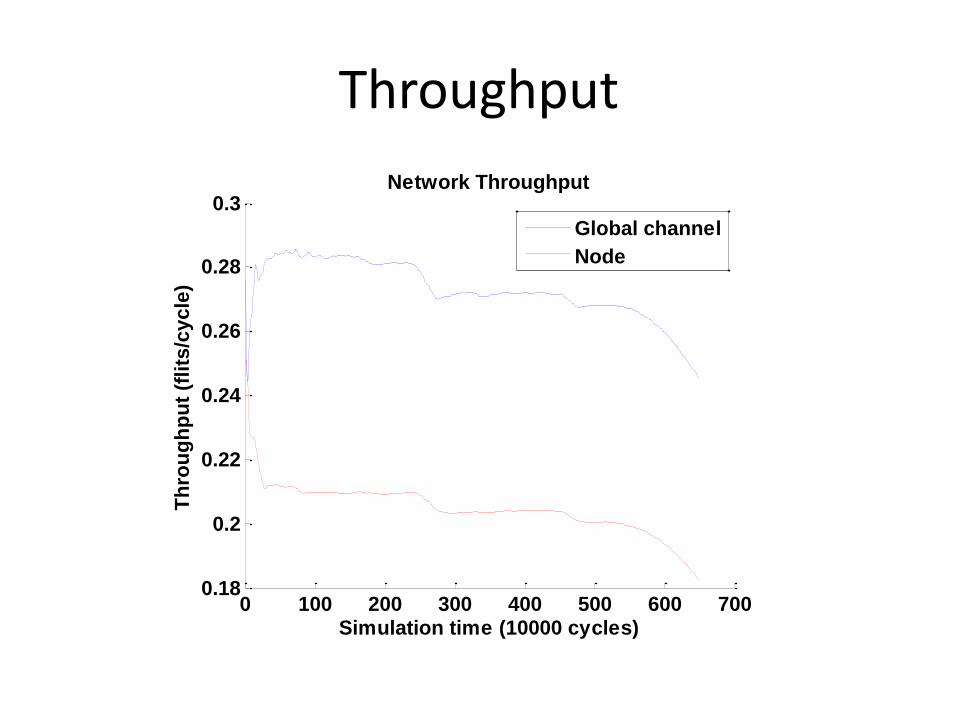
Throughput
0 100 200 300 400 500 600 7000.18
0.2
0.22
0.24
0.26
0.28
0.3T
hro
ug
hp
ut
(flits
/cycle
)
Simulation time (10000 cycles)
Network Throughput
Global channel
Node
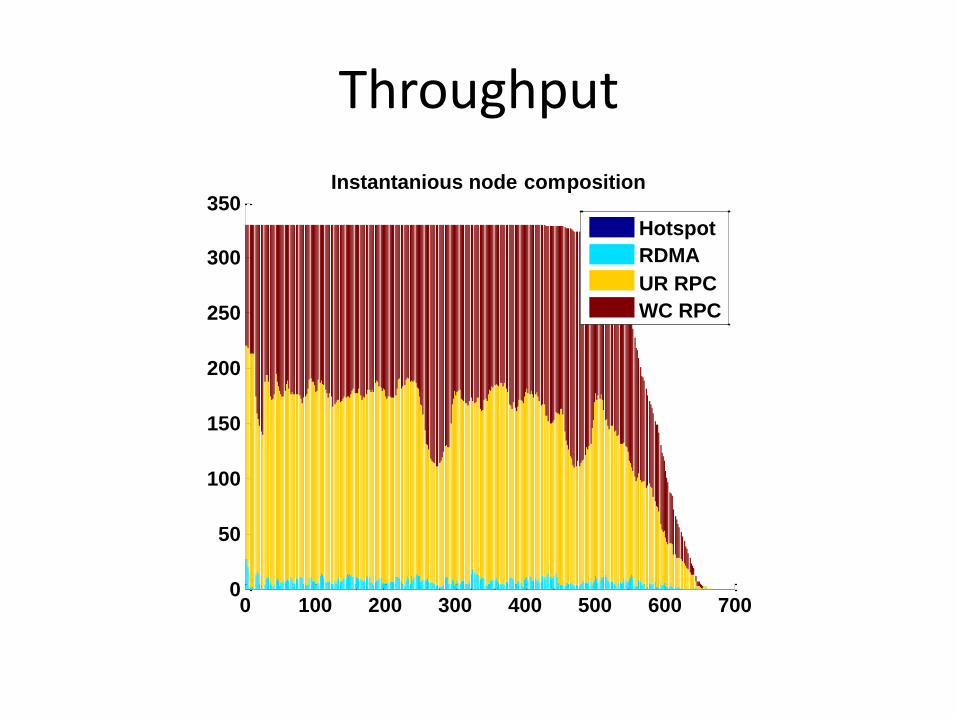
Throughput
0 100 200 300 400 500 600 7000
50
100
150
200
250
300
350Instantanious node composition
Hotspot
RDMA
UR RPC
WC RPC
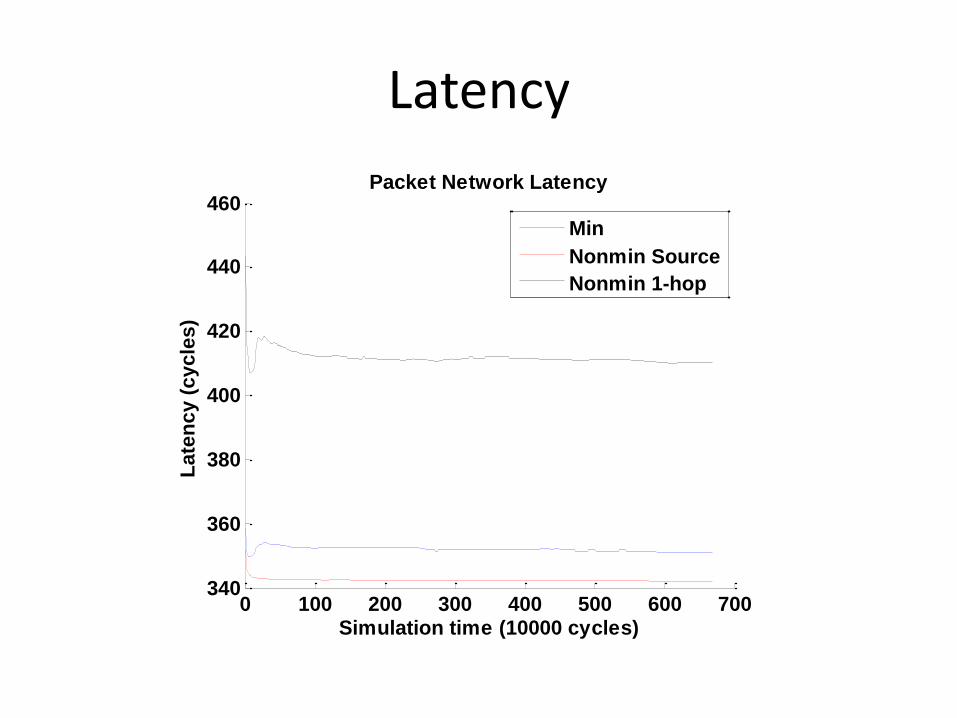
Latency
0 100 200 300 400 500 600 700340
360
380
400
420
440
460L
ate
ncy (
cycle
s)
Simulation time (10000 cycles)
Packet Network Latency
Min
Nonmin Source
Nonmin 1-hop
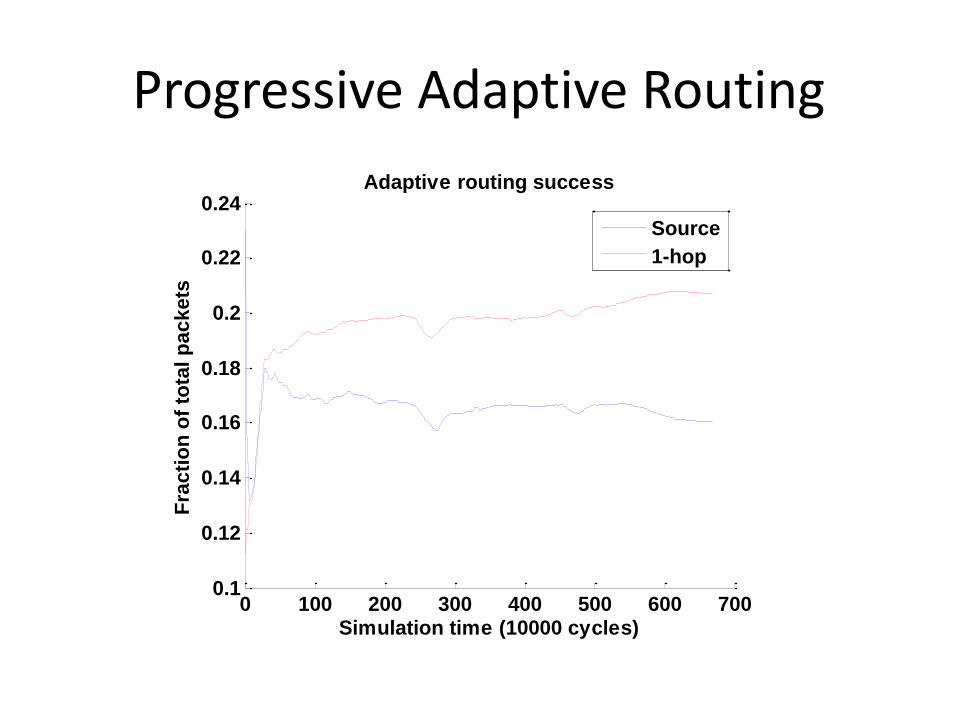
Progressive Adaptive Routing
0 100 200 300 400 500 600 7000.1
0.12
0.14
0.16
0.18
0.2
0.22
0.24F
rac
tio
n o
f to
tal p
acke
ts
Simulation time (10000 cycles)
Adaptive routing success
Source
1-hop
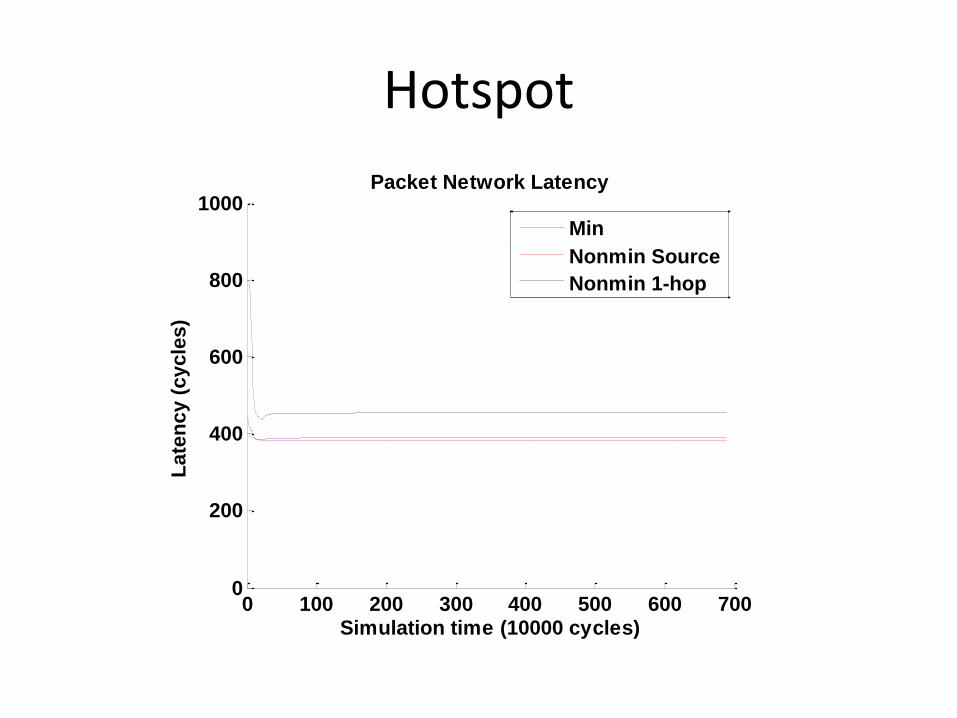
Hotspot
0 100 200 300 400 500 600 7000
200
400
600
800
1000
Late
ncy (
cycle
s)
Simulation time (10000 cycles)
Packet Network Latency
Min
Nonmin Source
Nonmin 1-hop
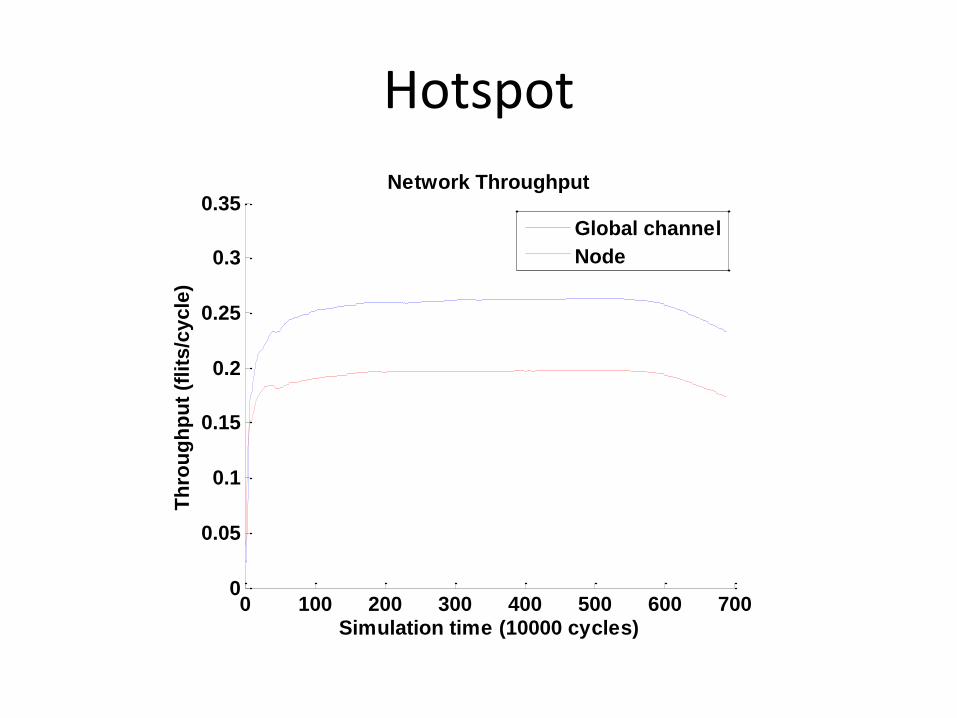
Hotspot
0 100 200 300 400 500 600 7000
0.05
0.1
0.15
0.2
0.25
0.3
0.35T
hro
ug
hp
ut
(flits
/cycle
)
Simulation time (10000 cycles)
Network Throughput
Global channel
Node
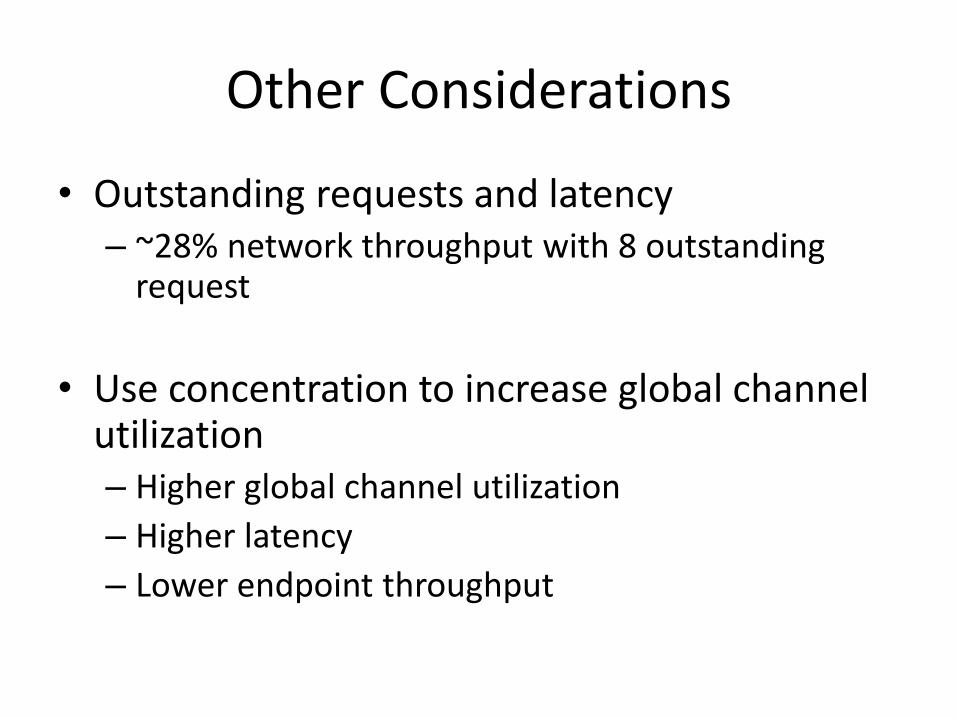
Other Considerations
• Outstanding requests and latency – ~28% network throughput with 8 outstanding
request
• Use concentration to increase global channel utilization – Higher global channel utilization
– Higher latency
– Lower endpoint throughput
0 100 200 300 400 500 600 7000
0.2
0.4
0.6
0.8
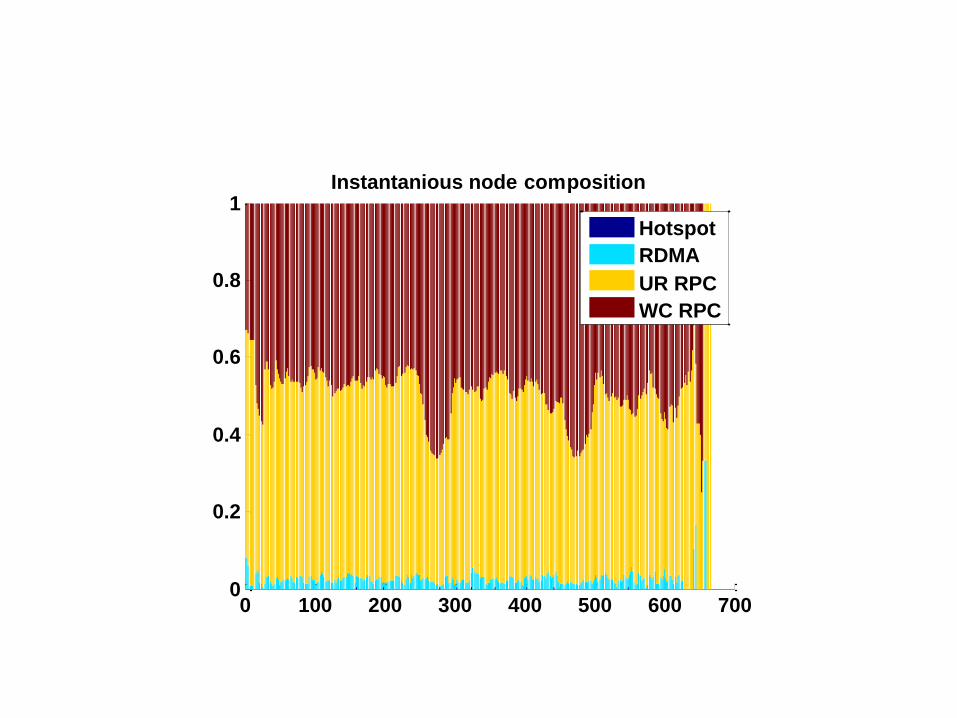
1Instantanious node composition
Hotspot
RDMA
UR RPC
WC RPC