EDUCATOR EVALUATION IN TENNESSEE...Tennessee’s Consortium on Research, Evaluation and Development,...
192
OCTOBER 2013 EDUCATOR EVALUATION IN TENNESSEE: INITIAL FINDINGS FROM THE 2013 FIRST TO THE TOP SURVEY MARK W. EHLERT MATTHEW J. PEPPER ERIC S. PARSONS SUSAN F. BURNS MATTHEW G. SPRINGER
Transcript of EDUCATOR EVALUATION IN TENNESSEE...Tennessee’s Consortium on Research, Evaluation and Development,...

OCTOBER 2013
EDUCATOR EVALUATION IN TENNESSEE:
INITIAL FINDINGS FROM THE 2013 FIRST TO THE TOP SURVEY
MARK W. EHLERT
MATTHEW J. PEPPER
ERIC S. PARSONS
SUSAN F. BURNS
MATTHEW G. SPRINGER
Tennessee’s Consortium on Research, Evaluation and Development, established in 2010 as part of Tennessee’s Race to the Top grant, is responsible for carrying out a detailed,
focused program of research around key grant initiatives.
AcknowledgmentsThe authors thank the many individuals who contributed to the design and administration of the survey and to the compilation of this report. Thanks are owed to the support staff and graduate students at the
Tennessee Consortium and at the University of Missouri, including Sheila Bleam, Margie Gurwit, Kelly Jones, Jude Kyoore, Jiaxi Li, Karishma Merchant, Rachel Michel, Sybil Shi, Jason Spector, and Brett Xiang.
Special thanks to Art Peng and Jessica Lewis for completing a review of an early draft.Additionally, we are grateful to Gera Summerford and staff at the Tennessee Education Association, and
to Commissioner Kevin Huffman, Erin O’Hara, Nate Schwartz, and Ra’Chel Ford and staff at the Tennessee Department of Education, for their efforts to communicate with educators across the state and encourage
their participation in the survey.
Most importantly, we have immense gratitude for the thousands of Tennessee educators who took time to share their experiences and perceptions through the 2013 First to the Top survey.
Thank you for all that you do for the students of Tennessee.
The research described in this working paper summarizes findings relative to educator evaluation in Tennessee, specifically preliminary findings from the 2013 First to the Top Survey. The views expressed in this paper
do not necessarily reflect those of sponsoring agencies or individuals acknowledged. Any errors remain the sole responsibility of the authors.
Please visit www.tnconsortium.org to learn more about our program of research and recent publications.
Tennessee Consortium on Research, Evaluation and Development
Peabody #44 | 230 Appleton Place | Nashville, Tennessee 37203 Phone 615-322-5538 | Fax 615-322-6018 www.tnconsortium.org
Educator Evaluation in Tennessee:
Initial Findings From the 2013 First to the Top Survey
Mark W. EhlertMatthew J. Pepper
Eric S. ParsonsSusan F. Burns
Matthew G. Springer
October 2013
Tennessee Consortium on Research, Evaluation and Development
www.tnconsortium.org
Recommended Citation: While permission to reprint is not necessary, the recommended citation for this docu-ment is: Ehlert, M.W., Pepper, M.J., Parsons, E.S., Burns, S.F. & Springer, M.G. (2013) Educator Evaluation in Tennessee: Initial Findings From the 2013 First to the Top Survey. Nashville: Tennessee Consortium on Research, Evaluation and Development. Retrieved from the Tennessee Consortium on Research, Evaluation and Develop-ment website: http://www.tnconsortium.org/projects-publications/first-to-top-survey/index.aspx.

This page intentionally left blank.
Initial Findings, 2013 First to the Top Survey-‐ i
TABLE OF CONTENTS Contents .................................................................................................................................................. i Figures ................................................................................................................................................... iii Tables ..................................................................................................................................................... v Executive Summary .............................................................................................................................. vi SECTION ONE Introduction and Overview ..................................................................................................................... 1 SECTION TWO Methodology .......................................................................................................................................... 3 Building the Sampling Frame ................................................................................................................... 3 Assigning Survey Modules to Sampling Frame Units ................................................................................ 4 Administration Procedures and Response Rates ...................................................................................... 5 Representativeness ................................................................................................................................. 6 Limitations ............................................................................................................................................ 10 Section Two Summary ........................................................................................................................... 11 SECTION THREE Teacher Evaluation Feedback .............................................................................................................. 12 Research Question 3.1: Which indicators are most commonly identified as teaching strengths, and how do
these vary by model? What is the nature of related feedback provided to teachers for identified teaching strengths? .......................................................................................................................................... 12
Research Question 3.2: Which indicators are most commonly identified as areas most in need of improvement; what resources were suggested to address those areas; which resources did teachers utilize; and how useful were those resources for improving their teaching? ........................................... 16
Research Question 3.3: On what topics do observers focus during post-‐conferences? ................................ 24 Research Question 3.4: What do teachers and observers perceive to be the primary purpose of feedback
from the evaluation process? Have these perceptions changed over time? ............................................ 25 Section Three Summary ........................................................................................................................ 27 SECTION FOUR How Teacher Evaluation Systems Are Being Implemented ................................................................ 29 Research Question 4.1: How are the jobs of observers being affected by teacher evaluation efforts? ........... 29 Research Question 4.2: How are teachers being affected by teacher evaluation efforts? ............................ 37

Initial Findings, 2013 First to the Top Survey-‐ ii
Section Four Summary .......................................................................................................................... 46 SECTION FIVE Perceptions of and Attitudes About the Quality, Value, and Effects of Educator Evaluation ............ 49 Research Question 5.1: To what degree do teachers and observers agree with statements about fairness
and quality in the teacher evaluation system used in their schools? Have these ratings changed since last year? ........................................................................................................................................... 49
Research Question 5.2: To what degree do teachers and observers agree with statements about potential negative effects resulting from the teacher evaluation process used in their schools? Have these ratings changed since last year? ..................................................................................................................... 53
Research Question 5.3: To what degree do teachers and observers agree with statements about professional benefits resulting from the teacher evaluation process used in their schools? Have these ratings changed since last year? ......................................................................................................... 55
Research Question 5.4: To what degree do teachers and observers agree with statements about improved teaching and learning outcomes resulting from the teacher evaluation process used in their schools? Have these ratings changed since last year? ........................................................................................ 59
Research Question 5.5: How do teachers and observers perceive the value of the teacher evaluation process? ............................................................................................................................................ 64
Section Five Summary ........................................................................................................................... 72 SECTION SIX Concluding Observations ..................................................................................................................... 75 Teacher Feedback .................................................................................................................................. 75 Implementation ..................................................................................................................................... 77 Perceptions of the Quality, Value and Effects of Teacher Evaluation ...................................................... 78 Appendix A: Counts of Educators in Tennessee and Representativeness of Respondent Samples
from the Spring 2013 First to the Top Survey .................................................................................. 81 Appendix B: Tennessee First to the Top Survey for Teachers and Administrators, Spring 2013 ...... 105

Initial Findings, 2013 First to the Top Survey-‐ iii
LIST OF FIGURES 3.1.1 Frequency that indicators were selected by teachers as their HIGHEST rated/strongest aspect
of their teaching, TEAM only 3.1.2 Frequency that indicators were selected by teachers as their HIGHEST rated/strongest aspect
of their teaching, other teacher evaluation models, top five indicators only 3.1.3 Frequency that teacher indicated their evaluator had provided suggestions for sharing their
identified strength with other teachers 3.2a.1 Frequency that indicators were selected by teachers as the one needing to be improved the
most, TEAM only 3.2a.2 Frequency that indicators were selected by teachers as the one needing to be improved the
most, other teacher evaluation models, top five indicators only 3.2c.1 Frequency that selected observers recommended specified resources to teachers 3.2d.1 Teacher responses on the number of times their observer followed up concerning the area
identified as most in need of improvement 3.3.1 Extent respondents focus on specified topics during feedback sessions, by position, TEAM only 3.4.1 Extent that feedback was perceived to be focused on improving teaching or making a
judgment: 2012 to 2013 comparison by teacher, observer, and model 4.1a.1 Number of observations conducted in 2013 at time of survey administration, by position 4.1b.1 Reported level of preparation of selected observers, by evaluation activity, 2013 to 2012, TEAM
only 4.1c.1 Number of hours per week on work related to teacher observations in 2013, by position and by
model 4.1d.1 Self-‐reported increase or decrease of time spent on specified job tasks by selected observers 4.2b.1 Time teachers reported spending on teacher evaluation tasks 4.2b.2 Disaggregated results for time teachers reported spending preparing for observations of
teaching in 2012-‐13 4.2c.1 Extent of teachers’ agreement that rubrics are used as a basis for suggestions to help them
improve their teaching, 2012 and 2013 4.2c.2 Extent of teachers’ agreement that the rubrics clearly define performance needed to earn each
rating score, 2012 and 2013 4.2c.3 Extent of teachers’ agreement with other statements about the rubrics used in teacher
observations, 2013 5.1.1 Teacher and selected observer perceptions of the quality of the teacher evaluation process,
2013 and 2012 5.1.2 Disaggregated results for teachers’ level of agreement with the statement Overall I am satisfied
with the teacher evaluation process used in my school. 5.2.1 Teacher perceptions of the negative effects of the teacher evaluation process, 2013 and 2012

Initial Findings, 2013 First to the Top Survey-‐ iv
5.2.2 Disaggregated results for teachers’ level of agreement with the statement The teacher evaluation process causes me a lot of stress.
5.3.1 Teacher and selected observer perceptions of the professional benefits of the teacher evaluation process, 2013 and 2012
5.3.2 Disaggregated results for teachers’ level of agreement with the statement The teacher evaluation process helps me improve as a professional.
5.4.1 Teacher and selected observer perceptions of the potential for the teacher evaluation process to improve teaching and student achievement, 2013 to 2012
5.4.2 Teacher agreement with statements about improved teaching and student achievement by 2012 final evaluation rating
5.4.3 Disaggregated results for teachers’ level of agreement with the statement The teacher evaluation process used in my school will improve my teaching.
5.4.4 Disaggregated results for teachers’ level of agreement with the statement The teacher evaluation process used in my school will improve my students’ achievement.
5.5a.1 Teacher and selected observer perceptions of the value of the teacher evaluation process 5.5a.2 Disaggregated results for teachers’ level of agreement with the statement The process of
evaluating my teaching performance takes more effort than the results are worth. 5.5b.1 Level of importance teachers and selected observers would place on teacher effectiveness
ratings for specified personnel decisions 5.5b.2 Level of importance teachers would place on effectiveness ratings for decisions concerning
teachers’ professional development 5.5b.3 Level of importance teachers would place on effectiveness ratings for decisions concerning
teacher retention
Initial Findings, 2013 First to the Top Survey-‐ v
LIST OF TABLES 2.1 Survey module assignments by type of position 2.2 Response rates by position type for the 2013 First to the Top Survey 2.3 Representativeness of administrator and teacher responses: Tennessee certified educators
versus survey respondents 3.2a.1 Teacher understanding of and agreement with ratings on the indicator most in need of
improvement, by reported rating 3.2b.1 Resources recommended to and/or utilized by teachers to address teaching weaknesses
identified as part of a teaching observation, with teachers’ ratings of resource usefulness 4.1a.1 Observer positions, by model, 2013 and 2012 4.1b.1 Percent of selected observer respondents who indicate that they are “adequately prepared” or
“very prepared” to conduct specified evaluation-‐related activities, by type and extent of training received
4.2a.1 Teacher responses to the question Who observed your teaching this year as part of the teacher evaluation process?
4.2d.1 When teachers indicated that they received evaluation results from the 2011-‐2012 school year, and whether or not results were discussed with their evaluator
4.2e.1 The extent that TEAM teachers support and are aware of changes made to the teacher evaluation process implemented during 2012-‐13

This page intentionally left blank.
Initial Findings, 2013 First to the Top Survey-‐ vi
EXECUTIVE SUMMARY Tennessee is beginning its fourth year of implementing a package of education reforms funded in part by a $501 million Race to the Top grant that was awarded to the state in spring 2010. The Tennessee Consortium on Research, Evaluation, and Development (the Consortium)1 is the lead external evaluator of these reform efforts and has implemented an annual statewide survey to examine educators’ experiences with and perceptions of these improvement efforts. Results in this report are based on survey responses from more than 26,000 professional educators who responded to the spring 2013 First to the Top Survey. The survey’s primary focus and the focus of this report are Tennessee’s educator evaluation systems because of this initiative’s immediate and near universal relevance. Three major issues related to educator evaluations were investigated in this report: 1) information about the nature of feedback provided to teachers from teacher evaluations, especially feedback from teaching observations; 2) information about how evaluation processes were conducted and how much time was devoted to that work; and 3) educators’ perceptions and attitudes about the quality and value of educator evaluations. Results from the 2013 First to the Top Survey reveal that Tennessee’s teacher evaluation systems have moved beyond the introduction phase into a period of improvement and refinement. Both teachers and observers perceived teacher evaluation processes more positively in 2012-‐13 compared to 2011-‐12. However, half of responding teachers remain unconvinced of the value and benefits resulting from current teacher evaluation systems. Results do suggest, however, that teachers more fully support the teacher evaluation process when they perceive the primary focus of the feedback they receive from teaching observations to be on improving their teaching rather than judging their performance. Key findings from each of the three major issues discussed in this report are presented below.
1 Established in 2010 as part of Tennessee’s Race to the Top grant, the Tennessee Consortium on Research, Evaluation and Development is responsible for carrying out a detailed, focused program of research and evaluation around key grant initiatives. As part of that work, the Consortium conducts the annual First to the Top Survey in an effort to solicit educator experiences of and attitudes towards First to the Top initiatives and reforms. Learn more about the Consortium at www.tnconsortium.org.

Initial Findings, 2013 First to the Top Survey-‐ vii
TEACHER FEEDBACK The implicit logic for how teacher evaluations can improve teaching is relatively straightforward. Teaching observations and other evaluation measures (e.g., student achievement and growth metrics) provide accurate evidence of teaching skills and teaching effectiveness. Feedback provided to teachers from the collected evidence, especially from classroom teaching observations, provides information to teachers on their teaching strengths and areas needing improvement. Acting on that feedback, teachers pursue formal and informal learning activities that help them change their professional practices in ways that improve teaching effectiveness. The changes in teaching practice will be reflected in results of subsequent teaching observations and, ultimately, in improved measures of student learning. In this “theory of action,” feedback from evaluations plays an important role in identifying what needs to be improved and how those improvements might be accomplished. Based on the results presented in this report, researchers identified the following key findings related to teacher feedback. Teachers in 2013 were more likely than teachers in 2012 to perceive the feedback from teaching observations to be more focused on helping them improve their practice than on judging their performance. Teachers’ perceptions of the primary focus of evaluation feedback are consistently strong predictors of differences in teachers’ perceptions and attitudes about the quality, benefits, and value of teacher evaluations. Perhaps the most important finding from the 2013 survey analyses is the relationship between the perceived purpose of observation feedback and teachers’ perceptions and attitudes about the quality and value of the new evaluation systems. Just under half of teachers (47 percent) reported in 2013 that they perceived the feedback from teaching observations to be more focused on improving their practice than judging their performance. This represents a ten percentage point increase over 2012 perceptions. Of the remaining teacher respondents in 2013, 31 percent perceived feedback to be equally focused on improvement and judgment and just over 20 percent perceived making a judgment to be the primary focus of feedback. The importance of this finding is evident when examining differences in perceived benefits and value from teacher evaluations based on the perceived focus of feedback. For example, teachers who perceived feedback from observations to be more focused on helping them improve were nearly three times as likely to agree that the teacher evaluation system used in their school helps them improve as professionals, clearly defines expectations, and influences the professional development in which they engage (70 to 80 percent agreement) than teachers who perceived judging performance as the focus of their feedback (around 25 percent agreement with each statement). In addition, two-‐thirds of teachers who perceived improvement as the main focus of feedback indicated they were satisfied with the teacher evaluation process in their schools while less than one in five teachers who perceived judgment as the primary focus agreed they were satisfied.

Initial Findings, 2013 First to the Top Survey-‐ viii
Most teacher respondents (but not all of them) reported that feedback from teaching observations included recommendations for how they could improve performance in areas identified as most needing improvement. Generally, activities and resources that included interactions with other professionals were most often used and reported to be most helpful to improving teaching. Many teachers indicated they received little or no follow-‐up from evaluators on their efforts to improve. Nearly 80 percent of responding teachers indicated that their observer had recommended one or more activities or resources to help them improve their performance in the area identified as most needing improvement. The percent of teachers who reported pursuing specific improvement activities almost always exceeded the percent reporting that their observers recommended the activity. With the exception of self-‐directed learning, activities recommended and pursued most often included teacher interactions with other professionals. Activities focused on working with colleagues also were more likely to be rated by teachers as more helpful to improving their teaching. Nearly half of responding teachers indicated that their observers never followed up with them about the areas identified as most needing improvement. Fewer than one in five teachers indicated that their observers followed up with them more than one time. This lack of follow-‐up is important, as it might influence teacher perceptions of how much their evaluations are focused on helping them improve their practice. Teachers reported that teaching strengths and areas in need of improvement identified through feedback from teaching observations were largely focused on issues related to instruction rather than planning, environment, or professionalism. The lists of knowledge and skills (rubrics) used to describe and evaluate teaching performance in the four teacher evaluation models 2 approved for use in Tennessee reflect multiple dimensions of teachers’ jobs. Most teachers singled out indicators directly related to instruction when asked to select the rubric item that was identified during teaching observations as their greatest teaching strength and the item identified as the area most needing improvement. This is an important finding because it suggests that Tennessee’s teachers and their observers are clearly focused on instruction when conducting and reviewing the results of teaching observations, which would help support an improvement-‐focused (rather than judgment-‐focused) evaluative environment.
2The Tennessee Educator Acceleration Model (TEAM) was the predominant teacher evaluation model used in school districts in 2012-‐2013 with more than 81 percent of all teachers working in those districts. Three additional evaluation models were also implemented: Teacher Effectiveness Measure (TEM) in the Memphis City Schools (10 percent of all teachers), Teacher Instructional Growth for Effectiveness and Results (TIGER) in select districts who are part of the Association of Independent and Municipal Schools (2.5 percent of all teachers), and Project COACH in Hamilton County and three other districts in East Tennessee (6.3 percent of all teachers).

Initial Findings, 2013 First to the Top Survey-‐ ix
IMPLEMENTATION Fidelity of implementation is a key concept for evaluation of change efforts. To know if TDOE’s prescribed changes to educator evaluation systems actually lead to better outcomes requires knowing if the prescribed changes were actually implemented as recommended. Researchers identified the following key finding related to implementing changes to teacher evaluation systems. Teacher evaluation continues to be implemented mostly as intended, and patterns of implementation appear to be similar to 2011-‐12. Related findings suggest that evaluation processes are growing more stable and that teacher perceptions of those processes are growing more positive. Patterns of results for implementation issues were as would be expected for both observers and teachers. Nearly all observers have attended evaluator training and those who received more training felt more prepared to complete evaluation tasks than those who received less training. Ninety percent of observers in schools using the TEAM model reported that they were well prepared to conduct evaluation tasks, up from 70 -‐ 75 percent who felt prepared in 2012. Principals and assistant principals conducted the bulk of teaching observations with 75 percent of principals and 66 percent of assistant principals reporting they conducted 41 or more observations during 2013. Consistent with this work load, most building administrators indicated they spent seven or more hours per week on tasks related to teacher evaluations, though only 47 percent indicated that they spent more time on this job duty in 2013 than 2012. Teachers’ responses indicated they were observed at least as frequently as state policy recommends and confirmed that a principal or assistant principal observed them most often. Teachers with lower 2012 evaluation ratings were more likely to report spending more than three hours being observed than their colleagues with the highest evaluation ratings. Additionally, 39 percent of novice teachers -‐ more than twice the percentage of teachers in any other experience level -‐ indicated that they had been observed for at least three hours. Survey findings further suggest that teachers are growing more positive in their perceptions related to evaluation processes. A larger share of teachers indicated that they perceived the evaluation system to be fair to them (32 percent in 2012 to 66 percent in 2013) and that their observers are qualified to evaluate their teaching (from 71 percent in 2012 to 76 percent in 2013). Results also suggest, however, that there continue to be opportunities for improvement. Teachers indicated that evaluation results from the prior school year were received across a wide time span, with one in five reporting that by late spring 2013 they had not yet received at least one measure that contributed to their 2011-‐12 total evaluation score.

Initial Findings, 2013 First to the Top Survey-‐ x
PERCEPTIONS OF THE QUALITY, VALUE AND EFFECTS OF TEACHER EVALUATION Teacher perceptions of their experiences with their evaluation systems and their attitudes about the value and benefits of teacher evaluations are important. Positive perceptions suggest that respondents have had relatively positive evaluation experiences and change theorists argue that favorable attitudes facilitate goal adoption and successful implementation of change efforts. Key findings regarding perceptions and attitudes of Tennessee teachers and their observers regarding teacher evaluation systems are enumerated below. Educators’ perceptions about the overall quality of evaluation systems and their benefits and value are becoming more positive over time, but there is still room for improvement. Comparing results from the 2013 First to the Top survey to results from the 2012 survey reveals between 10 and 15 percentage point increases in teacher agreement with positive statements about the qualitative aspects of teacher evaluation processes. Teachers were more likely to agree that observers were qualified and processes were fair, and less likely to agree that the process caused them a lot of stress and that observations disrupted classroom instruction. It should be noted, however, that nearly three-‐fourths of responding teachers still indicated in 2013 that evaluation processes caused them a lot of stress. Teacher agreement with statements indicating professional benefits from evaluation processes increased about 10 percentage points in 2013. Teachers in 2013 were more likely to agree that evaluation processes used in their school helps them improve as professionals, clearly defines expectations, and influences their professional development decisions. More than half of teacher respondents agreed with these indicators of professional benefit. Teachers in 2013 also were nearly 20 percentage points more likely than teachers in 2012 to agree that evaluation processes would improve their teaching (56 percent agreement in 2013) and 15 percentage points more likely to agree evaluation processes would improve student achievement (42 percent agreement in 2013). Finally, the share of teachers in 2013 who agreed that “The evaluation process used in my school takes more effort than the results are worth,” dropped by more than 1o percentage points when compared to 2012 results (63 percent agreement in 2013). Teacher perceptions related to teacher evaluations also were related to the evaluation system used in their schools, their experience levels, and the final rating they received from their 2011-‐12 evaluation. Researchers examined and reported survey results for many subgroups of respondents to determine the relationships between teacher responses to survey items and both select teacher characteristics and working conditions. Consistent patterns were observed, though the differences based on these other variables were smaller and less persistent than the differences based on whether teachers perceived their feedback to focus more on improving teaching or making a judgment. Perceptions about the quality, benefits, and value of teacher
Initial Findings, 2013 First to the Top Survey-‐ xi
evaluations from teachers in districts using TEAM (more than 80% of teachers in Tennessee) were consistently less favorable than the perceptions of teachers in districts using one of the alternative models, TEM, TIGER or COACH. For example, 48 percent of teachers in schools using the TEAM model agreed that they were satisfied with the teacher evaluation process while over half of teachers in Memphis (TEM model) and more than two thirds of teachers in schools using the TIGER and COACH models agreed that they were satisfied with their evaluation processes. Differences based on other teacher characteristics and experiences were generally smaller than differences observed across models and were consistent with variation reported in other studies of school reform. More experienced teachers tended to be somewhat more critical of the teacher evaluation systems than novice teachers and teachers who received higher evaluation ratings in 2012 tended to be slightly more positive in how they perceived their teacher evaluation systems. The perceptions of observers about the overall quality of evaluation systems and their benefits and value have become more positive over time, and, for the most part, were significantly more positive than perceptions of teachers. Positive perceptions of evaluation processes by administrator and instructional coach observers in 2013 were generally about 10 percentage points higher than their 2012 levels. When compared to teacher responses, observers were more likely to indicate that their teacher evaluation systems were of high quality and provided benefits and value. Differences between observer and teacher perceptions varied from no difference (for importance evaluation ratings should be given for compensation decisions) to 46 percentage points (for beliefs about teacher evaluations improving student achievement).
LOOKING AHEAD
Moving forward, the Consortium will continue to analyze findings from the 2013 First to the Top Survey and probe other areas of interest such as administrator evaluation, training for and implementation of Common Core Standards, and perceptions regarding compensation reforms. Additionally, Consortium researchers have begun revisions to the survey to further investigate potential changes to instructional practice associated with feedback and recommendations from the evaluation process. It is hoped that in so doing, researchers will be better able to illuminate the “black box” of teacher evaluation and more fully understand how reforms can be effectively embedded in the day to day practice of teachers and schools.

This page intentionally left blank.
Initial Findings, 2013 First to the Top Survey-‐ 1
I. INTRODUCTION AND OVERVIEW
ne of only two states to be awarded a grant in the first round of the United States Department of Education’s 2010 Race to the Top competition, Tennessee has just completed the third year of its four-‐year, $501 million award. Grant activities continue to move forward across the state
as students and educators persist in their implementation of various reform initiatives, including new curricular standards and assessments and a new system of educator evaluation.3 The Tennessee Consortium on Research, Evaluation and Development (the Consortium) continues to examine educator perceptions of these developing reforms through the First to the Top Survey, administered for the first time in the spring of 2011.4 This annual administration allows researchers to monitor how perspectives change over time and to adjust survey content. Each year, Consortium researchers review results from the prior year’s survey and discuss key questions and issues associated with First to the Top reform efforts with the Tennessee Department of Education (TDOE) to determine a primary focus for the First to the Top Survey’s questions. The initial FTTT survey in 2011 was distributed to a sample of approximately 40,000 teachers and 1400 principals. Questions focused broadly on race to the top reforms, including teacher evaluation. Evaluation-‐relevant questions addressed issues of implementation and general perceptions about teacher evaluation. In 2012, as changes to teacher evaluation systems became more central to reform efforts, Consortium researchers expanded the pool of educators invited to take the survey and focused more survey questions on teacher evaluations. Issues of implementation were the survey’s primary focus, e.g., who was being observed, how frequently, and by whom and whether feedback was being provided in a timely manner. The 2013 survey delved more deeply into the feedback provided through educator evaluation procedures, especially teaching observations. Section 2 of the report describes survey administration, discusses response rates, and presents a summary of respondent representativeness of the population of educators in Tennessee. The majority of the findings presented in sections three through five of this report reflect responses from the teachers who indicated they were observed as part of the teacher evaluation process used in their schools and building administrators and instructional coaches who conducted teaching observations.
3 Established in 2010 as part of Tennessee’s Race to the Top grant, the Tennessee Consortium on Research, Evaluation and Development is responsible for carrying out a detailed, focused program of research and evaluation around key grant initiatives. As part of that work, the Consortium conducts the annual First to the Top Survey in an effort to solicit educator experiences of and attitudes towards First to the Top initiatives and reforms. Learn more about the Consortium at www.tnconsortium.org. 4See Appendix B for a copy of the 2013 First to the Top Survey.
O

Initial Findings, 2013 First to the Top Survey-‐ 2
Section three focuses on the feedback teachers received after teaching observations; section four examines issues related to implementing changes to educator evaluation systems; and section five explores teacher and administrator perceptions about the quality, value, and outcomes of the “new” educator evaluations. Each section is organized around the specific research questions investigated within it and concludes with a summary of key findings. The report closes with section six, which presents concluding observations and implications for future research.

Initial Findings, 2013 First to the Top Survey-‐ 3
II. METHODOLOGY BUILDING THE SAMPLING FRAME The First to the Top Survey is fielded to collect information from all professional educators in Tennessee. Since individuals must have received an official email invitation to access the survey, it was necessary to construct a comprehensive list of all Tennessee professional certified staff that included their license number, demographic information, and valid email addresses. The first step in that process was to retrieve relevant records from the TDOE’s statewide database, EIS.5 These data were extracted in April 2013 and linked, by school code, to the TDOE School Directory to retrieve the grade levels served in the school6 identified in each educator’s employment record. Email addresses and additional data elements about each educator’s participation in educator evaluation systems were retrieved from the teacher evaluation database, CODE, and then linked to the information from EIS. Records of educators where position could not be identified and those determined to be certified educators working in central office positions were removed from the sampling frame. The resulting data file contained records for 75,996 certified staff employed in Tennessee’s public schools during the 2012-‐2013 school year, including their gender, ethnicity, place and position7 of employment, years of educational experience, highest educational level, email address, an evaluation role, and the regional service center in which their employing district is located.
5The Education Information System (EIS) captures real-‐time information about all professional personnel working in Tennessee public schools. A data file is built by the Consortium each year that includes a record for each employed person. The record for each person includes identifying data, the district(s) and school(s) where he or she works, the position(s) held by each individual in each school, and basic background information such as gender, race, education level, and experience. 6The various combinations of grade levels contained in each school in the state were examined and common patterns were summarized and recoded into a variable called Tier. This variable and a variable reflecting the size of the employing school district were added to the records in the sampling frame data file. 7There is some ambiguity in position assignment data contained in EIS and the “role” variable in the CODE data set. Researchers applied a heuristic for determining the “position” of each educator. Information based on position assignments in EIS was first examined and used to assign a position. If a position could not be assigned using EIS data, information from the CODE data set was used to determine a position. Responses to the first survey question that asked respondents for current position were used to populate the position variable for those relevant records where position could not be determined from EIS or CODE data. Those for whom a position could not be determined were assigned to an “Other” category. Note that this heuristic was utilized to complete the representativeness analyses only; survey respondents indicated on a specific question their current position and that information was used to group survey responses for analyses by position type.

Initial Findings, 2013 First to the Top Survey-‐ 4
A variety of minor data problems were identified in the resulting file. For example there were several instances where a single educator was linked to multiple email addresses. These minor issues affected very few records and were corrected when possible. The most significant issue was related to differences in the universe of records in the EIS and CODE data sets. Some individuals in the EIS data set were not matched in the CODE data set, resulting in missing email addresses, which excluded those individuals from participation in the survey. The largest group of records in EIS not matched to the CODE data was for employees in Memphis Public Schools, as this large urban district does not provide evaluation data to the TDOE CODE database. This resulted in missing email addresses for all Memphis educators identified in EIS. A request was submitted to the school district for email addresses of teachers and other staff in Memphis schools and more than 3,000 email addresses were cooperatively provided by district staff and linked by Consortium researchers to the sampling frame records. Unfortunately, the email addresses of nearly 350 building administrators in Memphis schools were not explicitly requested and, as a result, were not included in the file of email addresses the district did provide. Therefore, the building administrators from Memphis identified in EIS and in the sampling frame file did not receive invitations to take the First to the Top Survey. The implications of this are discussed in more detail below in the section on representativeness.
ASSIGNING SURVEY MODULES TO SAMPLING FRAME UNITS The initial First to the Top Survey was administered in spring 2011 and included sections soliciting perceptions and feedback about many of the reform initiatives identified in Tennessee’s Race to the Top grant application. When the First to the Top Survey was revised for administration in spring 2012, Consortium researchers elected to expand the portion of the survey that focused on legislated changes to educator evaluation systems used in schools. Survey items that were focused on other First to the Top reform initiatives and related resources were grouped into “modules” and researchers implemented a sampling approach using six distinct versions of the First to the Top survey. Each survey version contained a common set of items including all items related to the educator evaluation system and overall job satisfaction. Each version also included items related to one of the following six topics: Great Teachers and Leaders, Professional Development, Data Systems & Resources to Support Instruction, Standards and Assessment & Knowledge of and Attitudes Towards Reform, Instructional Practices and Testing, or Teacher Compensation. The primary purpose of this approach was to limit the average time needed to complete the survey to between 20 and 25 minutes while still collecting data from respondents on multiple reform initiatives. Every educator in the sampling frame was randomly assigned to receive one of the six survey versions8, though this mattered only for respondents who indicated that they did not conduct teacher observations as part of teacher evaluations.9 The assignment of sampling frame records to the six modules was completed through a process of clustered random assignment. The clustering was done within schools, though educators from very
8Educators in schools involved in strategic compensation reforms that are part of First to the Top efforts were not assigned to the Teacher Compensation version of the survey. These educators were randomly assigned to one of the five other module versions. 9Building administrators and respondents in other positions who indicated on the First to the Top survey that they conducted teaching observations as part of evaluating teachers were directed to a common set of questions for observers and were not presented with module questions.
Initial Findings, 2013 First to the Top Survey-‐ 5
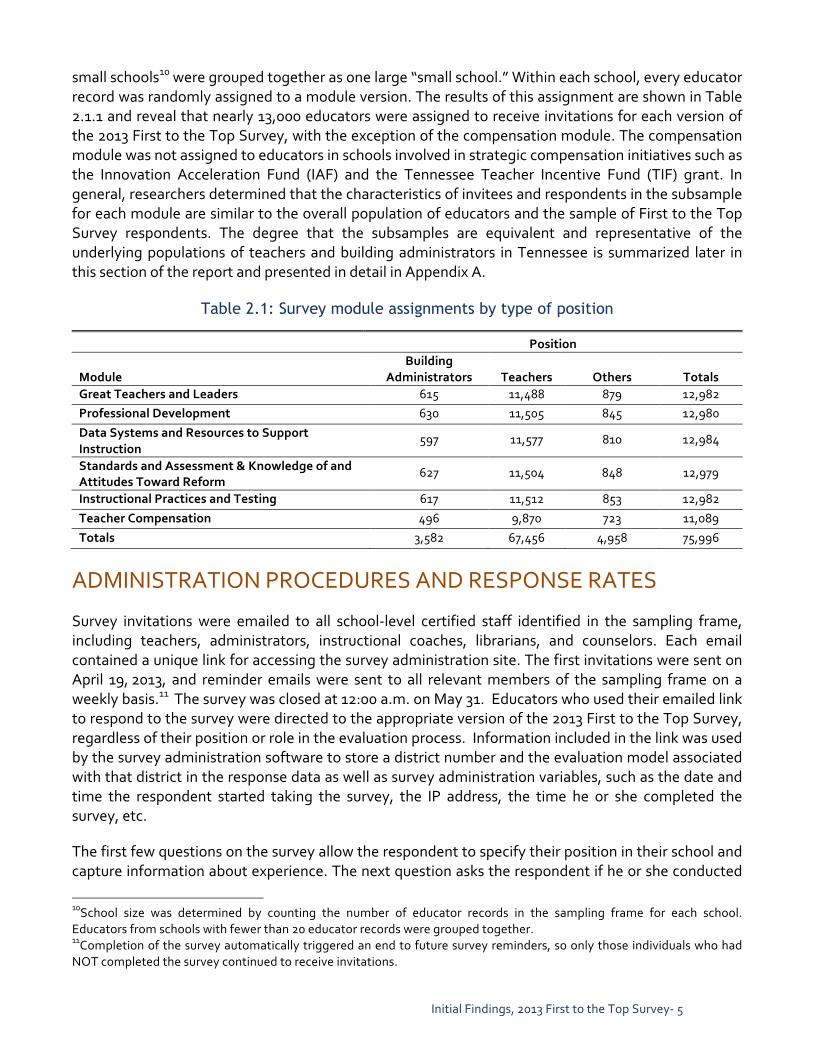
small schools10 were grouped together as one large “small school.” Within each school, every educator record was randomly assigned to a module version. The results of this assignment are shown in Table 2.1.1 and reveal that nearly 13,000 educators were assigned to receive invitations for each version of the 2013 First to the Top Survey, with the exception of the compensation module. The compensation module was not assigned to educators in schools involved in strategic compensation initiatives such as the Innovation Acceleration Fund (IAF) and the Tennessee Teacher Incentive Fund (TIF) grant. In general, researchers determined that the characteristics of invitees and respondents in the subsample for each module are similar to the overall population of educators and the sample of First to the Top Survey respondents. The degree that the subsamples are equivalent and representative of the underlying populations of teachers and building administrators in Tennessee is summarized later in this section of the report and presented in detail in Appendix A.
Table 2.1: Survey module assignments by type of position
Position
Module Building
Administrators Teachers Others Totals Great Teachers and Leaders 615 11,488 879 12,982 Professional Development 630 11,505 845 12,980 Data Systems and Resources to Support Instruction
597 11,577 810 12,984
Standards and Assessment & Knowledge of and Attitudes Toward Reform
627 11,504 848 12,979
Instructional Practices and Testing 617 11,512 853 12,982 Teacher Compensation 496 9,870 723 11,089 Totals 3,582 67,456 4,958 75,996
ADMINISTRATION PROCEDURES AND RESPONSE RATES Survey invitations were emailed to all school-‐level certified staff identified in the sampling frame, including teachers, administrators, instructional coaches, librarians, and counselors. Each email contained a unique link for accessing the survey administration site. The first invitations were sent on April 19, 2013, and reminder emails were sent to all relevant members of the sampling frame on a weekly basis.11 The survey was closed at 12:00 a.m. on May 31. Educators who used their emailed link to respond to the survey were directed to the appropriate version of the 2013 First to the Top Survey, regardless of their position or role in the evaluation process. Information included in the link was used by the survey administration software to store a district number and the evaluation model associated with that district in the response data as well as survey administration variables, such as the date and time the respondent started taking the survey, the IP address, the time he or she completed the survey, etc. The first few questions on the survey allow the respondent to specify their position in their school and capture information about experience. The next question asks the respondent if he or she conducted
10School size was determined by counting the number of educator records in the sampling frame for each school. Educators from schools with fewer than 20 educator records were grouped together. 11Completion of the survey automatically triggered an end to future survey reminders, so only those individuals who had NOT completed the survey continued to receive invitations.
Initial Findings, 2013 First to the Top Survey-‐ 6
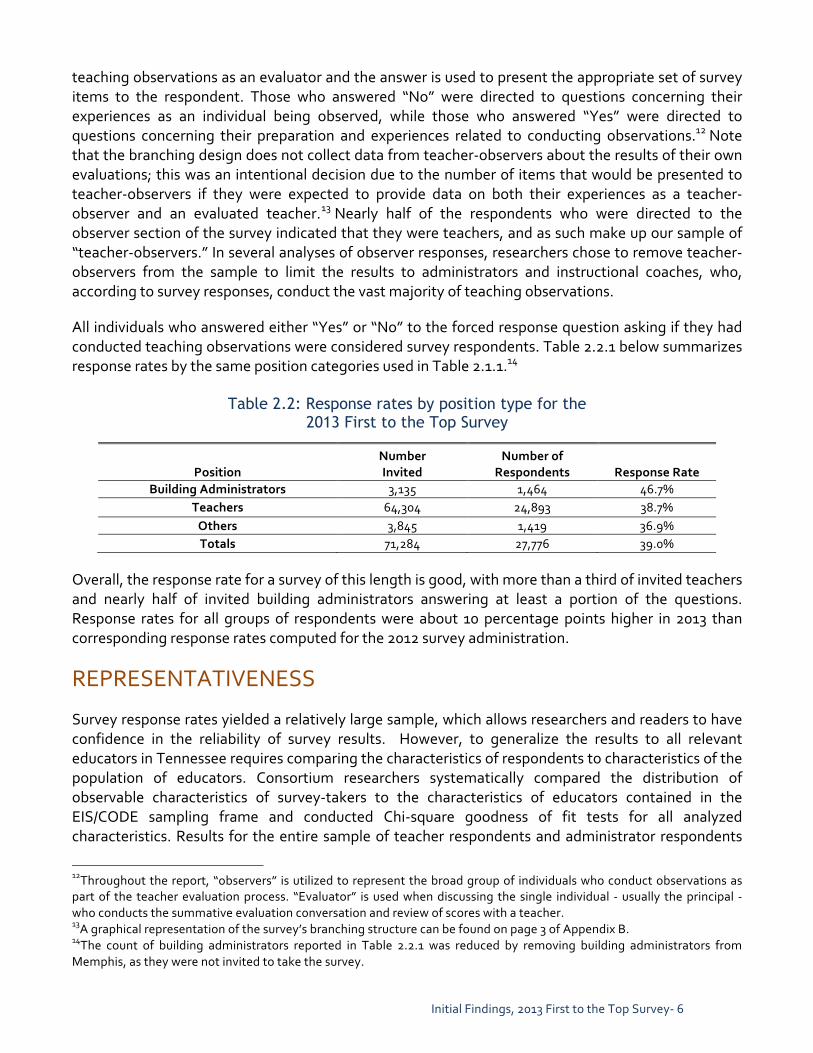
teaching observations as an evaluator and the answer is used to present the appropriate set of survey items to the respondent. Those who answered “No” were directed to questions concerning their experiences as an individual being observed, while those who answered “Yes” were directed to questions concerning their preparation and experiences related to conducting observations.12 Note that the branching design does not collect data from teacher-‐observers about the results of their own evaluations; this was an intentional decision due to the number of items that would be presented to teacher-‐observers if they were expected to provide data on both their experiences as a teacher-‐observer and an evaluated teacher.13 Nearly half of the respondents who were directed to the observer section of the survey indicated that they were teachers, and as such make up our sample of “teacher-‐observers.” In several analyses of observer responses, researchers chose to remove teacher-‐observers from the sample to limit the results to administrators and instructional coaches, who, according to survey responses, conduct the vast majority of teaching observations. All individuals who answered either “Yes” or “No” to the forced response question asking if they had conducted teaching observations were considered survey respondents. Table 2.2.1 below summarizes response rates by the same position categories used in Table 2.1.1.14
Table 2.2: Response rates by position type for the 2013 First to the Top Survey
Position Number Invited
Number of Respondents Response Rate
Building Administrators 3,135 1,464 46.7% Teachers 64,304 24,893 38.7% Others 3,845 1,419 36.9% Totals 71,284 27,776 39.0%
Overall, the response rate for a survey of this length is good, with more than a third of invited teachers and nearly half of invited building administrators answering at least a portion of the questions. Response rates for all groups of respondents were about 10 percentage points higher in 2013 than corresponding response rates computed for the 2012 survey administration.
REPRESENTATIVENESS Survey response rates yielded a relatively large sample, which allows researchers and readers to have confidence in the reliability of survey results. However, to generalize the results to all relevant educators in Tennessee requires comparing the characteristics of respondents to characteristics of the population of educators. Consortium researchers systematically compared the distribution of observable characteristics of survey-‐takers to the characteristics of educators contained in the EIS/CODE sampling frame and conducted Chi-‐square goodness of fit tests for all analyzed characteristics. Results for the entire sample of teacher respondents and administrator respondents
12Throughout the report, “observers” is utilized to represent the broad group of individuals who conduct observations as part of the teacher evaluation process. “Evaluator” is used when discussing the single individual -‐ usually the principal -‐ who conducts the summative evaluation conversation and review of scores with a teacher. 13A graphical representation of the survey’s branching structure can be found on page 3 of Appendix B. 14The count of building administrators reported in Table 2.2.1 was reduced by removing building administrators from Memphis, as they were not invited to take the survey.
Initial Findings, 2013 First to the Top Survey-‐ 7
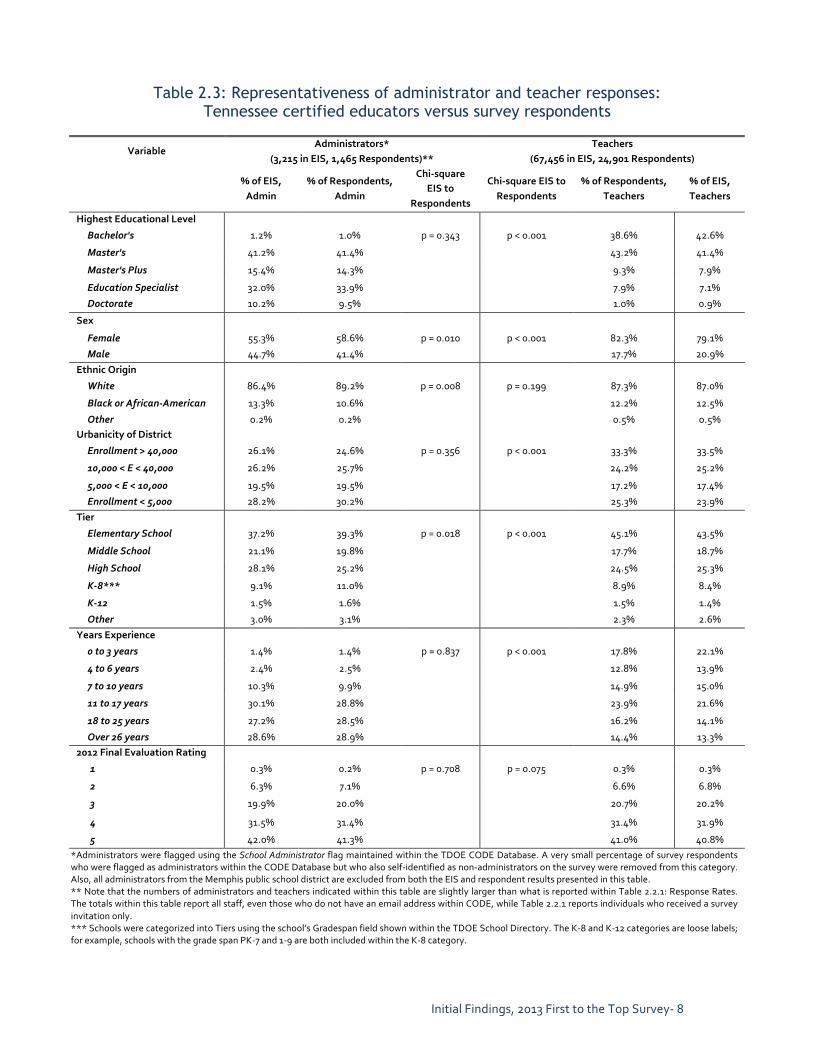
are shown in Table 2.3.1. Administrator comparisons are presented on the left side of the table and teacher comparisons are presented on the right side. For the most part, characteristics of administrators who responded to the survey are not different from the characteristics of administrators in the sampling frame. Only three of the Chi-‐square tests were statistically significant at the traditional level of p < .05 – for the distributions across gender, race, and type of school (tiers). Administrator respondents are slightly overrepresented by females, whites, and administrators in schools with elementary grade levels. Differences between the percentages in the sampling frame and the percentages in the respondent sample are not large, ranging from 4.0 percentage points for the tier variable to 2.8 percentage points for the race variable. These differences are small enough that they do not hinder the ability to generalize overall results from the survey responses to all administrators. Remember, however, that Memphis administrators are not included in the sampling frame nor are they included in survey responses – so generalized conclusions about administrator responses apply to all non-‐Memphis administrators. This also suggests that results will slightly underrepresent perspectives of administrators in large urban districts.
Initial Findings, 2013 First to the Top Survey-‐ 8
Table 2.3: Representativeness of administrator and teacher responses:
Tennessee certified educators versus survey respondents
Variable Administrators*
(3,215 in EIS, 1,465 Respondents)** Teachers
(67,456 in EIS, 24,901 Respondents)
% of EIS, Admin
% of Respondents, Admin
Chi-‐square EIS to
Respondents
Chi-‐square EIS to Respondents
% of Respondents, Teachers
% of EIS, Teachers
Highest Educational Level
Bachelor's 1.2% 1.0% p = 0.343 p < 0.001 38.6% 42.6%
Master's 41.2% 41.4% 43.2% 41.4%
Master's Plus 15.4% 14.3% 9.3% 7.9%
Education Specialist 32.0% 33.9% 7.9% 7.1%
Doctorate 10.2% 9.5% 1.0% 0.9%
Sex
Female 55.3% 58.6% p = 0.010 p < 0.001 82.3% 79.1%
Male 44.7% 41.4% 17.7% 20.9% Ethnic Origin
White 86.4% 89.2% p = 0.008 p = 0.199 87.3% 87.0%
Black or African-‐American 13.3% 10.6% 12.2% 12.5%
Other 0.2% 0.2% 0.5% 0.5% Urbanicity of District
Enrollment > 40,000 26.1% 24.6% p = 0.356 p < 0.001 33.3% 33.5%
10,000 < E < 40,000 26.2% 25.7% 24.2% 25.2%
5,000 < E < 10,000 19.5% 19.5% 17.2% 17.4%
Enrollment < 5,000 28.2% 30.2% 25.3% 23.9% Tier
Elementary School 37.2% 39.3% p = 0.018 p < 0.001 45.1% 43.5%
Middle School 21.1% 19.8% 17.7% 18.7%
High School 28.1% 25.2% 24.5% 25.3%
K-‐8*** 9.1% 11.0% 8.9% 8.4%
K-‐12 1.5% 1.6% 1.5% 1.4%
Other 3.0% 3.1% 2.3% 2.6% Years Experience
0 to 3 years 1.4% 1.4% p = 0.837 p < 0.001 17.8% 22.1%
4 to 6 years 2.4% 2.5% 12.8% 13.9%
7 to 10 years 10.3% 9.9% 14.9% 15.0%
11 to 17 years 30.1% 28.8% 23.9% 21.6%
18 to 25 years 27.2% 28.5% 16.2% 14.1%
Over 26 years 28.6% 28.9% 14.4% 13.3% 2012 Final Evaluation Rating
1 0.3% 0.2% p = 0.708 p = 0.075 0.3% 0.3%
2 6.3% 7.1% 6.6% 6.8%
3 19.9% 20.0% 20.7% 20.2%
4 31.5% 31.4% 31.4% 31.9%
5 42.0% 41.3% 41.0% 40.8% *Administrators were flagged using the School Administrator flag maintained within the TDOE CODE Database. A very small percentage of survey respondents who were flagged as administrators within the CODE Database but who also self-‐identified as non-‐administrators on the survey were removed from this category. Also, all administrators from the Memphis public school district are excluded from both the EIS and respondent results presented in this table. ** Note that the numbers of administrators and teachers indicated within this table are slightly larger than what is reported within Table 2.2.1: Response Rates. The totals within this table report all staff, even those who do not have an email address within CODE, while Table 2.2.1 reports individuals who received a survey invitation only. *** Schools were categorized into Tiers using the school’s Gradespan field shown within the TDOE School Directory. The K-‐8 and K-‐12 categories are loose labels; for example, schools with the grade span PK-‐7 and 1-‐9 are both included within the K-‐8 category.

Initial Findings, 2013 First to the Top Survey-‐ 9
Analyses of teacher representativeness are more subtle due to the large respondent sample size of nearly 25,000 observations. In short, even small deviations in the characteristics of respondents from the percentages observed for the sampling frame will result in statistically significant differences. This is the case for all but two of the Chi-‐square tests for the teacher sample shown in the table.15 However, the size of differences between population and sample percentages are not that large. Examination of the distributions for the characteristics showing statistically significant differences reveals the following deviations from representativeness in the teacher respondent sample.
• Experience: Novice teachers are underrepresented by 4.3 percentage points and teachers with 17 or more years of experience are overrepresented by 3.2 percentage points. Generally, other work examining perspectives about educational reforms has found more experienced teachers to be more critical and new teachers more accepting of reforms. This suggests the results from this survey may be tilted slightly toward a less accepting and more critical perspective.
• Education Level: This is highly correlated with experience, so the finding that the sample is slightly underrepresented by teachers with only a bachelor’s degree (4 percentage points) is not surprising. The implications for interpreting overall results are similar to the suggestion for experience.
• Tier: The teacher sample is slightly overrepresented by teachers from schools serving elementary grades. Combining the elementary school, K-‐8, and K-‐12 categories indicates that this group is overrepresented by a total of 2.2 percentage points in the teacher sample. Again, earlier work has found that teachers in elementary schools express more favorable attitudes than teachers at the middle and secondary levels to many instructionally oriented reform efforts, which suggests this imbalance might tilt results slightly toward a more accepting and less critical perspective.
• Gender: This is highly correlated with the type of school, with males being less likely to be employed as teachers in elementary grades. Females are slightly overrepresented in the sample (3.2 percentage points) which is consistent with the distribution of teacher respondents across tiers.
In addition to examining representativeness for the overall sample, researchers also examined representativeness of teacher respondents within evaluation model and the representativeness of the teacher respondents within each survey module. Representativeness by evaluation model is important to any discussion of results by model. For example, if the teacher respondents from schools using the TIGER model are not representative of all teachers in those schools, then the results may be biased and should be interpreted with care. Similarly, since each module is seen by only about one in six of the teacher respondents, it is important to know if the characteristics of the members of the relevant sampling frame are consistent with the overall population of teachers, and then if the characteristics of respondents are consistent with the characteristics of teachers invited to take the corresponding module. Detailed results for these comparisons are presented and discussed in Appendix A. In general, the conclusions about representativeness for the entire teacher sample are relevant to both subgroup analyses. Overall, the analysis of representativeness of respondents to the survey modules shows results that are basically identical to those observed for the overall teacher sample which is further evidence that the random assignment methods worked as planned. The analysis of representativeness by evaluation model yielded a few deviations from the results reported for the 15 The distribution by race of respondents is not different from the distribution by race of teachers in the sampling frame. Likewise, differences in the distributions of 2012 final evaluation scores for teachers in the sampling frame and teacher respondents were not statistically significant at conventional levels.

Initial Findings, 2013 First to the Top Survey-‐ 10
overall teacher sample for selected models, though none of the minor differences summarized in Appendix A have major implications for interpreting the reported findings for all respondents or findings reported by evaluation model.
LIMITATIONS Cautions about interpreting results related to the degree of representativeness of the samples are considered by report authors to be a relatively minor limitation in the ability to generalize results to the entire population of educators in Tennessee. While the sample is large and provides confidence in the reliability of results, it still only includes approximately one in three teachers and the sample of administrators excludes building administrators from Memphis. In addition to these limitations from sampling, a related limitation is that district level staff members are not included in the sampling frame and therefore, their perspectives are not included in survey responses. The results presented in this report are descriptive in nature, primarily frequency counts and related percentages. Some simple relationships are examined through cross-‐tabulations, but these, by definition only examine two variables at a time which hinders efforts to determine the complex interactions of the many factors that could influence educators’ experiences with and perceptions of the multi-‐faceted reforms being investigated. These descriptive statistics can suggest relationships between key variables, but in isolation cannot fully “explain” variation in responses. In addition, while theories of action underlie the educator evaluation and other First to the Top reforms, the descriptive statistics cannot indicate causation.16 Consortium researchers also are very interested in examining how teachers’ responses to the survey vary depending on the results of their teacher evaluations, i.e., comparing responses of teachers who receive high ratings to the responses of teachers who receive middle of the road or low ratings. The ability to do this is affected by timing issues. Results of the most recent year’s teacher evaluation process are not available in time to link them to results from the current administration of the First to the Top Survey, and likely this will always be the case. As an alternative, Consortium researchers linked teachers’ final evaluation ratings from the 2011-‐ 2012 school year to 2013 survey responses, where possible. Connecting survey results to evaluation results from the 2012-‐13 school year will occur at a later date. While the vast majority of items included in the First to the Top Survey utilize selected responses, there were a few items that allowed “constructed responses” (i.e., where respondents were asked to type in answers to the posed questions). Many respondents provided lengthy answers to those items which creates a rich survey-‐based source of qualitative data about a few key issues. However, due to time constraints, researchers have not been able to carefully review and use respondent comments to inform the results presented in this report. While this limitation does not affect the results presented,
16Consortium researchers are constructing aggregate measures of key constructs captured by the First to the Top Survey which can be used in more sophisticated analytics, but the short time available from the close of this annual survey and the publication of this report did not allow for the careful review of item responses and related analyses needed to validate and create these other measures. Comparisons of means, regression analyses, and other more sophisticated inferential statistical techniques using constructed measures will be conducted to investigate additional questions in later research briefs.
Initial Findings, 2013 First to the Top Survey-‐ 11
the comments would have been useful for verifying and/or illuminating interpretations and potential explanations of notable findings offered by report authors. These data will be incorporated as appropriate in future reports and briefs. Finally, findings from responses to the survey items packaged as modules are not included in this initial report. Potential relationships among the constructs measured in the core part of the survey and constructs measured in the modules have not been investigated. Analyses of responses to survey modules will be reported in future research briefs that will be prepared from responses to the First to the Top Surveys.
SECTION II SUMMARY More than 70,000 educators in Tennessee received email invitations to take one of six versions of the spring 2013 First to the Top Survey and more than 26,000 participated by responding and completing some or all of the survey. Response rates for the 2013 survey increased approximately 10 percentage points over the level observed for the 2012 First to the Top survey to nearly 40 percent overall, with levels approaching 50 percent for administrators and 40 percent for teachers. The characteristics of administrators who responded to the survey were not meaningfully different from the characteristics of all administrators in the EIS data system. Teacher respondents were a bit more likely to have more experience and be from elementary schools. While survey respondents were not perfectly representative of the overall population of educators in Tennessee, observed differences were small and should not substantially influence the findings reported for all respondents in this report. The remainder of the report presents the results of analyzing responses to the survey by this large representative sample of survey respondents.

Initial Findings, 2013 First to the Top Survey-‐ 12
III. TEACHER EVALUATION FEEDBACK Reporting of results from the 2013 First to the Top survey begins with an investigation into the feedback that teachers received after teaching observations. Teachers were asked to select from their evaluation rubric the indicator of teaching performance identified as their greatest teaching strength and the indicator of teaching performance that their observer identified as most needing to be improved. Teachers were presented with a series of relatively general questions about the feedback they received related to the aspect of their teaching identified as a strength. For the indicator of teaching performance identified as the area most needing improvement, the questions about related feedback included more specific queries about recommendations they received from their evaluator and the activities they pursued to try to improve teaching practice. Research questions 3.1 and 3.2 guided the analysis of feedback for identified teaching strengths and areas needing improvement. Observers provided information about the topics they tended to discuss when providing feedback after teaching observations. Related results were used to answer research question 3.3. Finally, both teachers and observers responded to a question about perceived focus of observation feedback that was used to answer research question 3.4.
Research Question 3.1: Which indicators are most commonly identified as teaching strengths, and how do these vary by model? What is the nature of related feedback provided to teachers for identified teaching strengths?
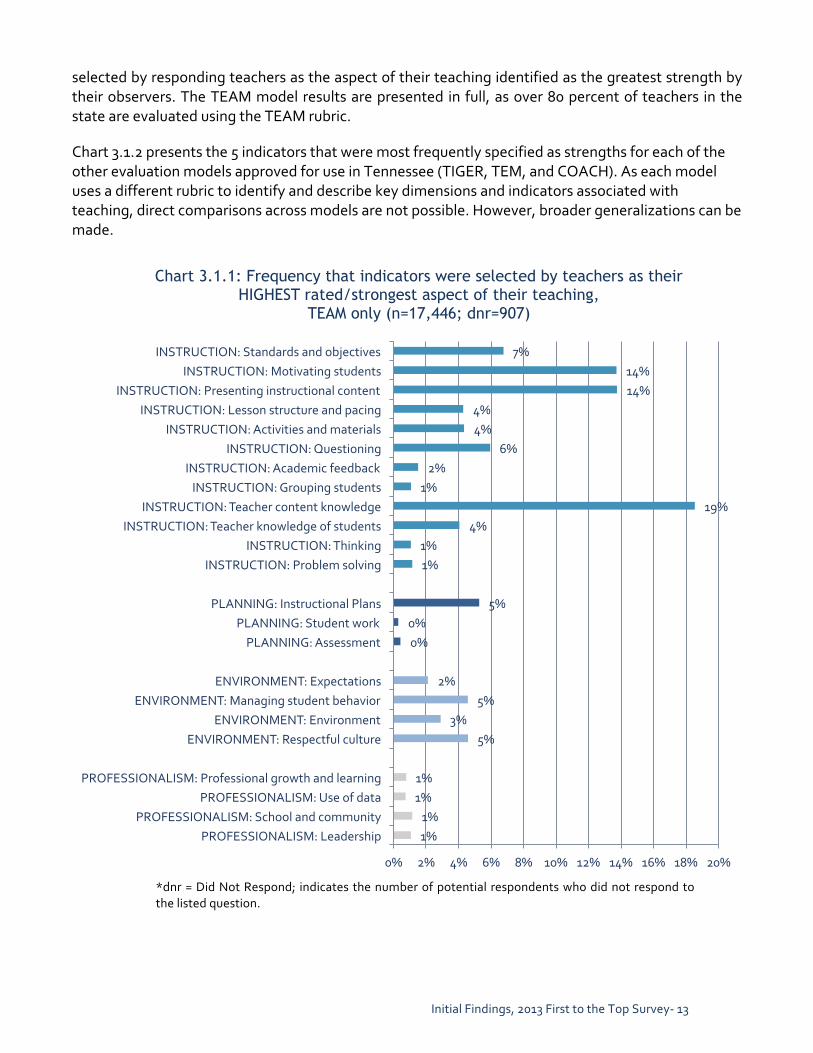
The four approved teacher evaluation models in Tennessee use different rubrics to describe teaching knowledge and skills and observers are trained in how to use those rubrics for conducting observations and providing feedback. Guidelines for providing feedback from teaching observations encourage evaluators to identify teaching strengths as well as areas where the observer believes the teacher needs improvement. Because most teachers are observed teaching more than once each year, they may have had multiple indicators from their rubric identified as teaching strengths. Teachers were asked to select the indicator on which they received their highest rating. In the case of a tie, the question asks the teacher to identify the indicator that he or she believes is the strongest aspect of their teaching. Each respondent was presented with a list of indicators from the rubric associated with the evaluation model used in their school from which to select a single indicator. A series of follow up questions asked teachers whether they agreed with their observer’s selection of this indicator, whether methods to improve this indicator were suggested, and whether their observer “provided suggestions for sharing this strength with others in your school.” Chart 3.1.1 summarizes how frequently each of the specific indicators from the TEAM rubric was
Initial Findings, 2013 First to the Top Survey-‐ 13
selected by responding teachers as the aspect of their teaching identified as the greatest strength by their observers. The TEAM model results are presented in full, as over 80 percent of teachers in the state are evaluated using the TEAM rubric. Chart 3.1.2 presents the 5 indicators that were most frequently specified as strengths for each of the other evaluation models approved for use in Tennessee (TIGER, TEM, and COACH). As each model uses a different rubric to identify and describe key dimensions and indicators associated with teaching, direct comparisons across models are not possible. However, broader generalizations can be made.
*dnr = Did Not Respond; indicates the number of potential respondents who did not respond to the listed question.
1% 1%
1% 1%
5% 3%
5% 2%
0% 0%
5%
1% 1%
4% 19%
1% 2%
6% 4% 4%
14% 14%
7%
0% 2% 4% 6% 8% 10% 12% 14% 16% 18% 20%
PROFESSIONALISM: Leadership PROFESSIONALISM: School and community
PROFESSIONALISM: Use of data PROFESSIONALISM: Professional growth and learning
ENVIRONMENT: Respectful culture ENVIRONMENT: Environment
ENVIRONMENT: Managing student behavior ENVIRONMENT: Expectations
PLANNING: Assessment PLANNING: Student work
PLANNING: Instructional Plans
INSTRUCTION: Problem solving INSTRUCTION: Thinking
INSTRUCTION: Teacher knowledge of students INSTRUCTION: Teacher content knowledge
INSTRUCTION: Grouping students INSTRUCTION: Academic feedback
INSTRUCTION: Questioning INSTRUCTION: Activities and materials
INSTRUCTION: Lesson structure and pacing INSTRUCTION: Presenting instructional content
INSTRUCTION: Motivating students INSTRUCTION: Standards and objectives
Chart 3.1.1: Frequency that indicators were selected by teachers as their HIGHEST rated/strongest aspect of their teaching,
TEAM only (n=17,446; dnr=907)

Initial Findings, 2013 First to the Top Survey-‐ 14
In the above charts, the width of each bar corresponds to the percent of teachers who selected the listed indicator as the one for which they received their highest rating. As can be seen from Chart 3.1.1, teachers in districts that utilize the TEAM model most commonly selected Teacher Content Knowledge as the indicator on which they received their highest rating.17 Moreover, indicators from the Instruction domain dominated this question for TEAM teachers, as no indicators from the Planning, Environment, or Professionalism domains captured more than 6 percent of responses. Instructional/teaching-‐related indicators are also frequently listed as strengths in both the TIGER and TEM models although not to the same extent as in TEAM. For example, the two indicators reported with the highest frequency in the TIGER model come from the Classroom Environment and Planning and Preparation domains. Interestingly, in the COACH model, classroom management indicators are more likely to have the
17When examined across Tiers, Teacher Content Knowledge remains the most commonly identified strength for teachers in middle and high schools. In elementary schools, Motivating Students and Presenting Instructional Material are the most commonly identified strengths reported by teachers (15 percent and 14 percent, respectively), with Teacher Content Knowledge the third most commonly identified (11 percent). Another interesting finding was that novice teachers (0-‐3 years) were more likely than more experienced teachers to report that Environment: Respectful Culture and Planning: Instructional Plans indicators were identified as their strengths.
31%
14%
7%
5%
5%
19%
16%
10%
10%
8%
11%
11%
10%
8%
7%
0% 5% 10% 15% 20% 25% 30% 35%
ENVIRONMENT: Teacher interaction w/ students
PLANNING & PREP: Knowledge of learning process
INSTRUCTION: Expectations
INSTRUCTION: Directions, procedures, & explanations
INSTRUCTION: Activities and assignments
TEACH: Engage students in lessons based on standards
ENVIRONMENT: Respectful, learning-‐focused classroom
TEACH: Engage students at all learning levels
TEACH: Explain content clearly and accurately
PLAN: Know your students for effective planning
CLASSROOM MANAGEMENT: Relationships
DELIVERY OF INSTRUCTION: Engagement
PLANNING AND PREP: Lessons
CLASSROOM MANAGEMENT: Environment
CLASSROOM MANAGEMENT: Expectations
TIGER
(n=6
07; d
nr=6
7)
TEM (n
=2475; dnr=1
31)
COACH
(n=1
101;
dnr=12
6)
Chart 3.1.2: Frequency that indicators were selected by teachers as their HIGHEST rated/strongest aspect of their teaching, other teacher evaluation
models, top five indicators only

Initial Findings, 2013 First to the Top Survey-‐ 15
highest ratings although no single indicator is chosen more than 11 percent of the time.18 One constant across models, however, is that interacting with, motivating, and engaging students is frequently reported as a teaching strength. In follow up questions, roughly 95 percent of relevant teacher respondents across all models indicated that they agreed that the selected indicator was, in fact, a teaching strength, while less than half reported that their observer had provided recommendations to help them improve in their strongest area ranging from 35 percent in TIGER to 45 percent in TEM.
18As the rubric used in the COACH model has over 40 indicators, this greater dispersion is not surprising.
13%
15%
14%
7%
13%
13%
12%
12%
14%
13%
15%
11%
12%
14%
13%
12%
13%
13%
13%
54%
42%
54%
79%
49%
56%
56%
59%
56%
55%
55%
46%
51%
53%
52%
54%
53%
56%
54%
34%
44%
32%
14%
38%
31%
31%
29%
31%
32%
30%
43%
37%
34%
35%
33%
35%
31%
34%
0% 10% 20% 30% 40% 50% 60% 70% 80% 90% 100%
Overall (n=21,853)
Primary Focus of Feedback
More Improvement (n=9,598)
Equal (n=6,264)
More Judgment (n=4,583)
Final 2012 Evaluation Rating
Final Rating = 5 (n=7,960)
Final Rating = 4 (n=6,321)
Final Rating = 3 (n=4,171)
Final Rating = 2 (n=1,343)
Final Rating = 1 (n=59)
Evaluation Model in Use
TEAM (n=17,562)
TIGER (n=637)
TEM (n=2,520)
COACH (n=1,134)
Educator Experience
0 to 3 years (n=4,009)
4 to 6 years (n=2,904)
7 to 10 years (n=3,263)
11 to 17 years (n=5,163)
18 to 25 years (n=3,493)
Over 26 years (n=3,021)
Chart 3.1.3. Frequency that teacher indicated their evaluator had provided suggestions for sharing their identified strength with other teachers
(n=22,860)
I don't know No Yes
Initial Findings, 2013 First to the Top Survey-‐ 16
The survey next asked teachers if their evaluator “provided suggestions for sharing this strength with others in your school”, and results are presented in Chart 3.1.3.19 Overall, only one out of three respondents indicated that sharing this strength with others had been suggested by their evaluator, with teacher respondents from Memphis, who utilize the TEM model, having the highest rate of suggested sharing. Somewhat surprisingly, teachers indicated that their evaluators did not discriminate based on teaching experience or final 2012 evaluation ratings when suggesting that observed teachers share their strengths. In other words, a novice teacher with three years of experience who showed a teaching strength was just as likely to be asked to share their strength with others as a veteran teacher with 20 years of experience. Similarly, teachers who earned low evaluation ratings in 2012 were nearly as likely to be asked to share their identified teaching strengths as those who earned high ratings. Equally interesting is the relationship between perceptions of the primary focus of observation feedback and being asked to share teaching strengths with others. Almost four out of five teachers who perceived their feedback to be more focused on improvement had received a suggestion to share their strength with others; this falls to approximately two out of five teachers among those who had perceived making a judgment to be the primary purpose of their feedback.
Research Question 3.2: Which indicators are most commonly identified as areas most in need of improvement; what resources were suggested to address those areas; which resources did teachers utilize; and how useful were those resources for improving their teaching?
Similar to the investigation of identified teaching strengths, research question 3.2 asks about the indicator identified by observers as the area most in need of improvement. In the case of a tie, the question asks the teacher to identify the indicator that the teacher believes is the one that needs to be improved the most. This section more deeply probes observer recommendations and teacher actions resulting from feedback about the area identified as most needing improvement, and this deeper investigation is reflected in the sub-‐research questions 3.2a through 3.2e.
Research Question 3.2a: Which rubric indicator did teachers report being identified by their observer as the element of their teaching needing to be improved the most, and to what degree did teachers understand the reasons for and agree with those ratings? Charts 3.2a.1 and 3.2a.2 mirror Charts 3.1.1 and 3.1.2 above although the results presented in both figures reflect the indicators identified as being those most in need of improvement, rather than those for which the teacher received their highest rating.20 Teachers in schools using the TEAM model
19This chart design is frequently used throughout the remainder of the report to present disaggregated results from an individual survey question. Note that the number of potential respondents is included in the chart title, and the number of respondents in each subgroup is presented as part of the corresponding row label. Summing the number of respondents for a crosstab variable (e.g., Primary focus of Feedback) generally will not equal the numbers of respondents shown for the “overall” category because of missing values in the crosstab variable. 20The two indicators INSTRUCTION: Teacher Knowledge of Students and ENVIRONMENT: Environment from the TEAM model were inadvertently excluded as selection options. An analysis of reinforcement indicators from the 2011-‐2012 TEAM database (which contains results of the universe of teacher observations) reveals a similar relative ranking of teacher weaknesses as the 2013 First to the Top survey (e.g., INSTRUCTION: Questioning is also the most often identified

Initial Findings, 2013 First to the Top Survey-‐ 17
selected Questioning as the indicator most needing improvement, followed by Grouping Students. As with Research Question 3.1, indicators from the Instruction rubric were selected more often than indicators from other domains by TEAM teachers.21 There is more overlap among indicators selected as improvement areas across evaluation models than overlap observed for teaching strengths. Specifically, indicators regarding questioning, assessments, and grouping students/content differentiation largely appear as areas in need of improvement regardless of the model examined. Two other results from Chart 3.2a.2 are also worth mentioning. In the TEM model, nearly half of all teachers list Use strategies that develop higher-‐level thinking skills as the indicator that is most in need of improvement. This may be due to the general difficulty of the task and/or the readiness of students. Moreover, its appearance does have a parallel in the TEAM model, where Problem Solving is the third most frequently selected indicator in need of improvement. Finally, it is worthwhile to note that in the COACH model, Communication is listed as one of the areas frequently in need of improvement. As the other models do not have a similar Family and Community domain, this result is unique to COACH and may indicate a gap in the other rubrics.
Instruction reinforcement indicator within the 2011-‐2012 TEAM database). The two excluded categories within this database appeared relatively infrequently, suggesting that their exclusion does not significantly impact the findings of this analysis. 21 Differences by tier are significant for the indicators selected as weaknesses. INSTRUCTION: Questioning was selected most often as a teacher weakness by teachers in all tiers, varying between a low of 20 percent among teachers in high school to a high of 24 percent among teachers in elementary schools. INSTRUCTION: Grouping Students, the second most frequently selected indicator when all TEAM teachers are considered together, has more variability across tiers, from a high of 21 percent for teachers in high schools to only 9 percent of teachers in elementary schools.
1% 2%
5% 1%
1% 3%
1%
6% 1% 1%
9% 6%
1% 14%
6% 22%
2% 8%
1% 2%
5%
0% 5% 10% 15% 20% 25%
PROFESSIONALISM: Leadership
PROFESSIONALISM: Use of data
ENVIRONMENT: Managing student behavior
PLANNING: Student work
INSTRUCTION: Thinking
INSTRUCTION: Grouping students
INSTRUCTION: Questioning
INSTRUCTION: Lesson structure and pacing
INSTRUCTION: Motivating students
Chart 3.2a.1: Frequency that indicators were selected by teachers as the one needing to be improved the most,
TEAM only (n=17,226; dnr=1,127)

Initial Findings, 2013 First to the Top Survey-‐ 18
The next survey questions ask teachers to provide the rating they received on this indicator, whether they understood their observer’s assignment of this rating and whether they agreed with their observer’s assignment of this rating. Results from responses to these questions are presented in Table 3.2a.1. Only 20 percent of respondents reported a rating of 1 or 2, while approximately half reported that they received a three as their lowest rating. An additional 17 percent of respondents report that their lowest rating was either a four or a five. The table also reveals, unsurprisingly, that as the value for the lowest rating increased from 1 to 5, so too did the likelihood that the respondent understood and agreed with this rating. It is unlikely that teachers who disagree with their observer’s rating would enthusiastically embrace suggested remedies or attempt to modify their practice; therefore the high levels of disagreements with lower ratings may indicate a challenge when engaging these teachers to address areas identified to be in need of improvement. The plurality (and near majority) of respondents indicate that they received a 3 as their lowest rating; however, two out of three of these teachers did agree with their observer’s rating.
26%
17%
10%
9%
5%
44%
11%
7%
7%
5%
10%
7%
6%
5%
5%
0% 5% 10% 15% 20% 25% 30% 35% 40% 45% 50%
INSTRUCTION: Student self-‐assessment
INSTRUCTION: Quality of questions
INSTRUCTION: Assessment criteria
PLANNING & PREP: Design of assessments
INSTRUCTION: Grouping of students
TEACH: Developing higher-‐level thinking skills
TEACH: Engaging students at all learning levels
ENVIRONMENT: Manage student behavior
TEACH: Multiple ways to engage with content
TEACH: Maximize instructional time
PLANNING & PREP: Mapping
DELIVERY OF INSTRUCTION: Differentiation
FAMILY AND COMMUNITY: Communications
MONITOR, ASSESS, & FOLLOW-‐UP: Self-‐assessment
MONITOR, ASSESS, & FOLLOW-‐UP: Analysis
TIGER
(n=6
04; d
nr=7
0)
TEM (n
=240
2; dnr=2
04)
COACH
(n=1
037; dnr=1
90)
Chart 3.2a.2: Frequency that indicators were selected by teachers as the one needing to be improved the most, other teacher evaluation models,
top five indicators only

Initial Findings, 2013 First to the Top Survey-‐ 19
Table 3.2a.1: Teacher understanding of and agreement with ratings on the indicator most in
need of improvement, by reported rating (n=22,860)
What was your initial rating on this indicator?
(n = 21456; dnr = 1,404)
Percent of responses with listed
score
Do you understand why your observer rated you at the level he
or she did?
Do you agree with this initial rating?
Yes No I don't know Yes No I don't know
1 1% 54% 43% 3% 22% 73% 5%
2 19% 75% 22% 2% 47% 46% 7%
3 49% 86% 12% 2% 69% 24% 7%
4 15% 91% 7% 2% 82% 13% 5%
5 2% 93% 5% 1% 90% 8% 2%
I don't know/remember 15% 70% 10% 20% 56% 18% 26% After selecting a rubric indicator, teachers were presented with a series of questions about the rating they received based on their teaching observation. Results from responses to these questions are presented in Table 3.2a.1. Only 20 percent of respondents reported receiving a rating of 1 or 2, while approximately half reported that they received a 3 as their lowest rating. An additional 17 percent of respondents reported that their lowest rating was either a 4 or a 5 and nearly 1 in 6 respondents indicated they couldn’t remember the actual rating. As the rating assigned to the indicator selected as a priority improvement area increased from 1 to 5, the percent of teachers who understood why they received the rating and their agreement with that assessment also increased. It is unlikely that teachers who disagree with their observer’s rating would enthusiastically embrace suggested remedies or attempt to modify their practice; therefore the high levels of disagreements with lower ratings may indicate a challenge when engaging these teachers to address areas identified to be in need of improvement. The plurality (and near majority) of respondents indicate that they received a 3 as their lowest rating; however, two out of three of these teachers did agree with their observer’s rating.
Research Question 3.2b: What types of resources did teachers report were recommended to them to improve their performance? Which resources did teachers report they used, and how useful were those resources for improving their teaching? After respondents identified the indicator most needing improvement, the survey then probed about the improvement strategies recommended to them by their evaluator, the resources and strategies teachers actually engaged in, and the degree to which they found those actions to be helpful to improving their teaching. Results from this series of questions are summarized in Table 3.2b.1. The first column in the table lists a set of resources, and the next two columns report, respectively, the percent of respondents who indicated that the listed resource was recommended by an observer and the percent of respondents who indicated that they utilized the resource. Resources are listed in descending order based on the third column that identifies the share of responding teachers who indicated that they utilized the resource. Note that respondents could report using a listed resource
Initial Findings, 2013 First to the Top Survey-‐ 20
even when they did not report that the resource was recommended by their evaluator. Indeed the percent of teachers utilizing a resource exceeds the percent who said it was recommended in every row except one (i.e., the “Other” category). The final three columns in the table report respondents’ rating of the usefulness of the resources they utilized. For example, self-‐directed reading/learning is the most commonly utilized resource by respondents, though it does not earn as high a usefulness rating as Informally consulting with peers or one-‐on-‐one work with a mentor teacher. More than one in five responding teachers indicated that their observers did not recommend any resources or activities to address the indicator needing the most improvement.22 For the remaining teachers, the table reveals that they are most likely to be advised to engage in self-‐directed learning and more informal interactions with other teachers. As noted above, teachers reported that they engaged in listed activities more frequently than they were recommended as strategies for improvement – in fact, for most strategies at least twice as many teachers indicated they pursued the strategy than indicated it was recommended. However, the relative rank ordering of the percentages in columns 2 and 3 of Table 3.2b.1 are very consistent. School-‐based professional development and observing other teachers were the only strategies that did not maintain the same ranking on the recommended versus pursued responses. Observing other teachers ranked fourth among recommended resources but ranked fifth in the list of activities pursued. So, not only did teachers report that recommendations were most likely to include self-‐directed learning and observing 0ther teachers, their actual efforts to improve focused on the same strategies. Finally, the results in Table 3.2b.1 indicate that the resources respondents were most likely to report helped significantly improve their teaching were those that allow them to interact with mentors, coaches, or their peers.
22The self-‐reported ratings for the indicator selected by teachers for this section were examined to determine if only those teachers receiving relatively high ratings on their selected indicator were the ones who received no recommendations to help them improve their performance. The distribution of ratings reported by teachers who indicated they received no recommendations mirrored the distribution of ratings for all teachers who answered this set of questions. Receiving no recommendations does not appear to be restricted to teachers whose lowest ratings are relatively high.
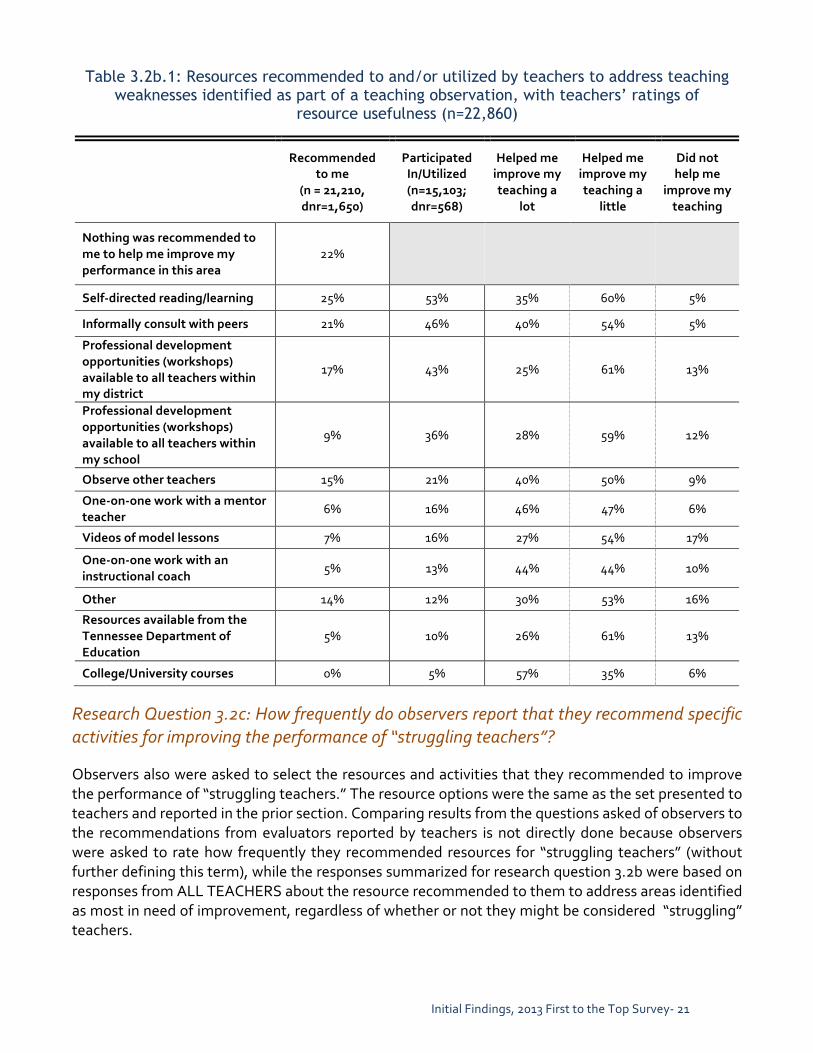
Initial Findings, 2013 First to the Top Survey-‐ 21
Table 3.2b.1: Resources recommended to and/or utilized by teachers to address teaching weaknesses identified as part of a teaching observation, with teachers’ ratings of
resource usefulness (n=22,860)
Recommended to me
(n = 21,210, dnr=1,650)
Participated In/Utilized (n=15,103; dnr=568)
Helped me improve my teaching a
lot
Helped me improve my teaching a
little
Did not help me
improve my teaching
Nothing was recommended to me to help me improve my performance in this area
22%
Self-‐directed reading/learning 25% 53% 35% 60% 5%
Informally consult with peers 21% 46% 40% 54% 5%
Professional development opportunities (workshops) available to all teachers within my district
17% 43% 25% 61% 13%
Professional development opportunities (workshops) available to all teachers within my school
9% 36% 28% 59% 12%
Observe other teachers 15% 21% 40% 50% 9%
One-‐on-‐one work with a mentor teacher
6% 16% 46% 47% 6%
Videos of model lessons 7% 16% 27% 54% 17%
One-‐on-‐one work with an instructional coach
5% 13% 44% 44% 10%
Other 14% 12% 30% 53% 16%
Resources available from the Tennessee Department of Education
5% 10% 26% 61% 13%
College/University courses 0% 5% 57% 35% 6%
Research Question 3.2c: How frequently do observers report that they recommend specific activities for improving the performance of “struggling teachers”? Observers also were asked to select the resources and activities that they recommended to improve the performance of “struggling teachers.” The resource options were the same as the set presented to teachers and reported in the prior section. Comparing results from the questions asked of observers to the recommendations from evaluators reported by teachers is not directly done because observers were asked to rate how frequently they recommended resources for “struggling teachers” (without further defining this term), while the responses summarized for research question 3.2b were based on responses from ALL TEACHERS about the resource recommended to them to address areas identified as most in need of improvement, regardless of whether or not they might be considered “struggling” teachers.
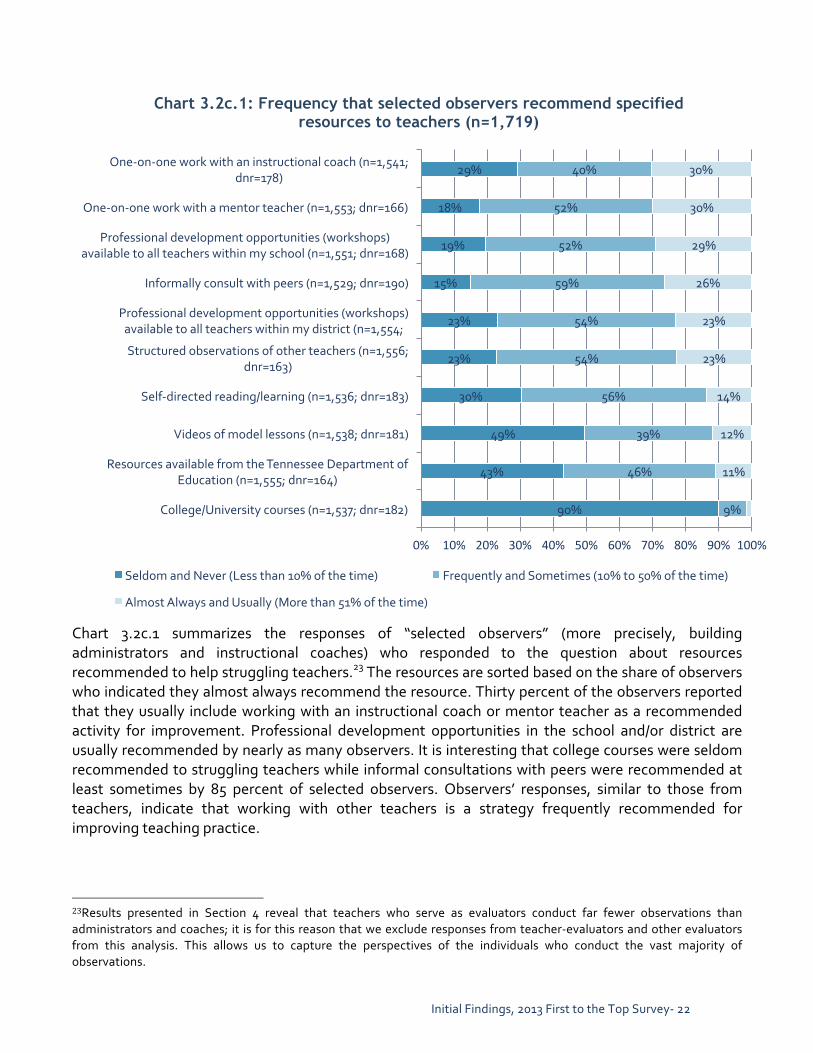
Initial Findings, 2013 First to the Top Survey-‐ 22
Chart 3.2c.1 summarizes the responses of “selected observers” (more precisely, building administrators and instructional coaches) who responded to the question about resources recommended to help struggling teachers.23 The resources are sorted based on the share of observers who indicated they almost always recommend the resource. Thirty percent of the observers reported that they usually include working with an instructional coach or mentor teacher as a recommended activity for improvement. Professional development opportunities in the school and/or district are usually recommended by nearly as many observers. It is interesting that college courses were seldom recommended to struggling teachers while informal consultations with peers were recommended at least sometimes by 85 percent of selected observers. Observers’ responses, similar to those from teachers, indicate that working with other teachers is a strategy frequently recommended for improving teaching practice.
23Results presented in Section 4 reveal that teachers who serve as evaluators conduct far fewer observations than administrators and coaches; it is for this reason that we exclude responses from teacher-‐evaluators and other evaluators from this analysis. This allows us to capture the perspectives of the individuals who conduct the vast majority of observations.
90%
43%
49%
30%
23%
23%
15%
19%
18%
29%
9%
46%
39%
56%
54%
54%
59%
52%
52%
40%
11%
12%
14%
23%
23%
26%
29%
30%
30%
0% 10% 20% 30% 40% 50% 60% 70% 80% 90% 100%
College/University courses (n=1,537; dnr=182)
Resources available from the Tennessee Department of Education (n=1,555; dnr=164)
Videos of model lessons (n=1,538; dnr=181)
Self-‐directed reading/learning (n=1,536; dnr=183)
Structured observations of other teachers (n=1,556; dnr=163)
Professional development opportunities (workshops) available to all teachers within my district (n=1,554;
Informally consult with peers (n=1,529; dnr=190)
Professional development opportunities (workshops) available to all teachers within my school (n=1,551; dnr=168)
One-‐on-‐one work with a mentor teacher (n=1,553; dnr=166)
One-‐on-‐one work with an instructional coach (n=1,541; dnr=178)
Chart 3.2c.1: Frequency that selected observers recommend specified resources to teachers (n=1,719)
Seldom and Never (Less than 10% of the time) Frequently and Sometimes (10% to 50% of the time)
Almost Always and Usually (More than 51% of the time)
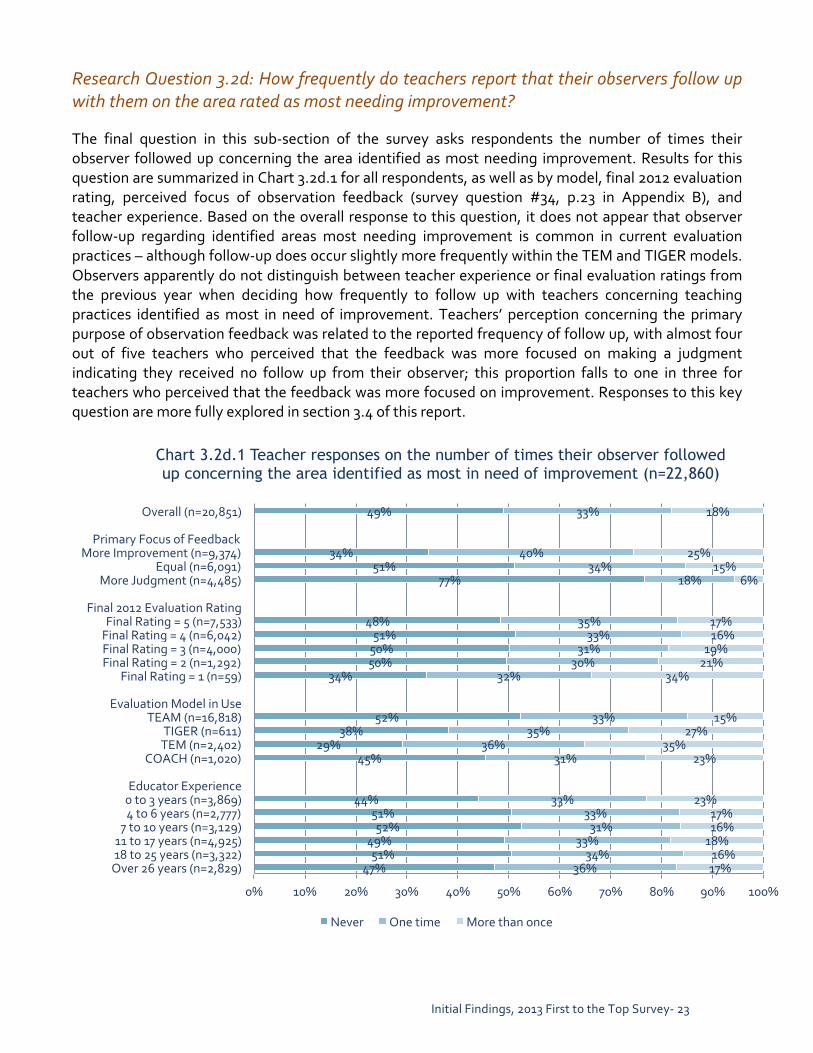
Initial Findings, 2013 First to the Top Survey-‐ 23
Research Question 3.2d: How frequently do teachers report that their observers follow up with them on the area rated as most needing improvement? The final question in this sub-‐section of the survey asks respondents the number of times their observer followed up concerning the area identified as most needing improvement. Results for this question are summarized in Chart 3.2d.1 for all respondents, as well as by model, final 2012 evaluation rating, perceived focus of observation feedback (survey question #34, p.23 in Appendix B), and teacher experience. Based on the overall response to this question, it does not appear that observer follow-‐up regarding identified areas most needing improvement is common in current evaluation practices – although follow-‐up does occur slightly more frequently within the TEM and TIGER models. Observers apparently do not distinguish between teacher experience or final evaluation ratings from the previous year when deciding how frequently to follow up with teachers concerning teaching practices identified as most in need of improvement. Teachers’ perception concerning the primary purpose of observation feedback was related to the reported frequency of follow up, with almost four out of five teachers who perceived that the feedback was more focused on making a judgment indicating they received no follow up from their observer; this proportion falls to one in three for teachers who perceived that the feedback was more focused on improvement. Responses to this key question are more fully explored in section 3.4 of this report.
49%
34% 51%
77%
48% 51% 50% 50%
34%
52% 38%
29% 45%
44% 51% 52%
49% 51%
47%
33%
40% 34%
18%
35% 33%
31% 30%
32%
33% 35%
36% 31%
33% 33% 31%
33% 34%
36%
18%
25% 15%
6%
17% 16%
19% 21%
34%
15% 27%
35% 23%
23% 17% 16% 18% 16% 17%
0% 10% 20% 30% 40% 50% 60% 70% 80% 90% 100%
Overall (n=20,851)
Primary Focus of Feedback More Improvement (n=9,374)
Equal (n=6,091) More Judgment (n=4,485)
Final 2012 Evaluation Rating Final Rating = 5 (n=7,533) Final Rating = 4 (n=6,042) Final Rating = 3 (n=4,000) Final Rating = 2 (n=1,292)
Final Rating = 1 (n=59)
Evaluation Model in Use TEAM (n=16,818)
TIGER (n=611) TEM (n=2,402)
COACH (n=1,020)
Educator Experience 0 to 3 years (n=3,869) 4 to 6 years (n=2,777) 7 to 10 years (n=3,129) 11 to 17 years (n=4,925) 18 to 25 years (n=3,322) Over 26 years (n=2,829)
Chart 3.2d.1 Teacher responses on the number of times their observer followed up concerning the area identified as most in need of improvement (n=22,860)
Never One time More than once
Initial Findings, 2013 First to the Top Survey-‐ 24
Research Question 3.3: On what topics do observers focus during post-‐conferences? This section examines the content of feedback provided to teachers during observation post-‐conferences as reported by observers in schools using the TEAM evaluation model.24 Chart 3.3.1 shows how much observers in different positions reported that they focused on each of the presented topics during a “typical post-‐conference”. Responses from principals and assistant principals were so similar that they are combined into one Administrator group. According to these self-‐reported data, observers in all positions invested at least some focus on all the identified topics during post conferences with the most focus reported for discussing the refinement and reinforcement areas. Discussing areas in need of improvement was most likely to be identified by respondents in all positions as a topic receiving “a significant amount” of focus during post-‐observation feedback sessions. Using rubrics to explain ratings was a significant focus area for a third or more of respondents in all positions and suggesting resources to help improve areas identified for refinement received significant focus from more than half of instructional coaches, but only a third of teacher-‐observers. Other differences in topic focus by position are relatively small; instructional coaches were a little more likely to use the rubric during the post conference and coaches and teacher-‐observers were a little more likely than administrators to focus on topics identified during pre-‐conferences.
24 There are several reasons why this research question focuses solely on the TEAM model. As mentioned previously, TEAM is the most commonly used evaluation model in the state, covering more than 80 percent of all teachers. In addition, the survey questions on which this analysis is based contain TEAM-‐specific language, which may have led non-‐TEAM respondents to interpret the questions differently than TEAM respondents. This factor combined with a high “Did not respond” rate among COACH model observers and the fact that administrator observers from Memphis School District (TEM) were not invited to participate in the survey, made cross-‐model analysis of this question not particularly illustrative.
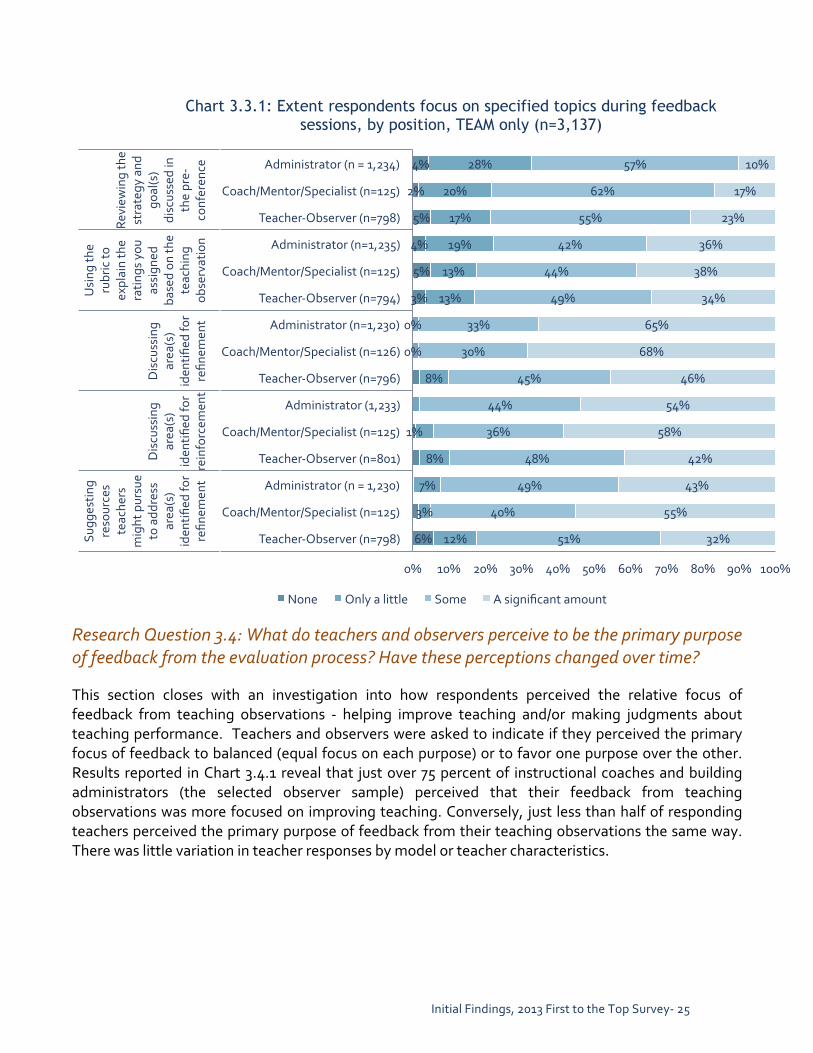
Initial Findings, 2013 First to the Top Survey-‐ 25
Research Question 3.4: What do teachers and observers perceive to be the primary purpose of feedback from the evaluation process? Have these perceptions changed over time? This section closes with an investigation into how respondents perceived the relative focus of feedback from teaching observations -‐ helping improve teaching and/or making judgments about teaching performance. Teachers and observers were asked to indicate if they perceived the primary focus of feedback to balanced (equal focus on each purpose) or to favor one purpose over the other. Results reported in Chart 3.4.1 reveal that just over 75 percent of instructional coaches and building administrators (the selected observer sample) perceived that their feedback from teaching observations was more focused on improving teaching. Conversely, just less than half of responding teachers perceived the primary purpose of feedback from their teaching observations the same way. There was little variation in teacher responses by model or teacher characteristics.
6%
1%
0%
0%
3%
5%
4%
5%
2%
4%
12%
3%
7%
8%
8%
13%
13%
19%
17%
20%
28%
51%
40%
49%
48%
36%
44%
45%
30%
33%
49%
44%
42%
55%
62%
57%
32%
55%
43%
42%
58%
54%
46%
68%
65%
34%
38%
36%
23%
17%
10%
0% 10% 20% 30% 40% 50% 60% 70% 80% 90% 100%
Teacher-‐Observer (n=798)
Coach/Mentor/Specialist (n=125)
Administrator (n = 1,230)
Teacher-‐Observer (n=801)
Coach/Mentor/Specialist (n=125)
Administrator (1,233)
Teacher-‐Observer (n=796)
Coach/Mentor/Specialist (n=126)
Administrator (n=1,230)
Teacher-‐Observer (n=794)
Coach/Mentor/Specialist (n=125)
Administrator (n=1,235)
Teacher-‐Observer (n=798)
Coach/Mentor/Specialist (n=125)
Administrator (n = 1,234)
Sugg
estin
g reso
urce
s teac
hers
might pursue
to add
ress
area
(s)
iden
tified
for
refin
emen
t
Discu
ssing
area
(s)
iden
tified
for
reinforcem
ent
Discu
ssing
area
(s)
iden
tified
for
refin
emen
t
Using
the
rubric to
ex
plain the
ratin
gs you
assign
ed
based on
the
teac
hing
ob
servation
Review
ing the
strategy
and
go
al(s)
discussed in
the pre-‐
conferen
ce
Chart 3.3.1: Extent respondents focus on specified topics during feedback sessions, by position, TEAM only (n=3,137)
None Only a little Some A significant amount

Initial Findings, 2013 First to the Top Survey-‐ 26
*As previously discussed, Memphis administrators did not participate in the 2013 First to the Top Survey. To verify the robustness of the changing perceptions of selected observers, the authors checked the responses of the 2012 selected observers excluding Memphis and found very similar results. In other words, the difference between the opinions of selected observers when comparing 2012 and 2013 is not due to the exclusion of Memphis in 2013.
The comparison of perceptions over time reveals a significant shift in teacher perceptions, with 2013 responses showing a gain in the share who reported a greater focus on feedback for improving teaching. Across all respondents, the percent of teachers who perceived that “feedback from my observer was focused more on helping me improve my teaching than making a judgment about my performance” increased from 37 percent in 2011-‐12 to 47 percent in 2012-‐13. A similar increase (from 68 to 76 percent) was found for observers. This increase was evident across all teacher evaluation models, with the largest increase occurring among teachers and observers using the TEAM model.25 A broader set of analyses reveals that the responses to this inquiry concerning the perceived purposes of feedback are related to elements of implementation and feedback. For example, the analyses for
25 As a test of robustness of this finding, researchers investigated whether or not such a change also occurred among the 8,252 teachers who responded to this question in both the 2012 survey and the 2013 survey. A similar change does occur among this group, suggesting that the change is not merely the result of a changing subset of survey respondents.
40% 45%
41% 49%
44% 49%
35% 47%
68% 76%
37% 47%
30% 30%
33% 27%
36% 27%
37% 31%
29% 23%
36% 31%
30% 25%
26% 24%
20% 24%
27% 22%
2% 2%
27% 22%
0% 10% 20% 30% 40% 50% 60% 70% 80% 90% 100%
COACH Teachers -‐ 2012 (n=383; dnr=15) COACH Teachers -‐ 2013 (n=1,038; dnr=189)
TEM Teachers -‐2012 (n=1,770; dnr=141) TEM Teachers -‐2013 (n=2,323; dnr=283)
TIGER Teachers -‐ 2012 (n=444; dnr=18) TIGER Teachers -‐ 2013 (n=596; dnr=78)
TEAM Teachers -‐ 2012 (n=10,786; dnr=594) TEAM Teachers -‐ 2013 (n=16,609; dnr=1,744)
Selected Observers -‐ 2012 (n=1,040; dnr=28)* Selected Observers -‐ 2013 (n=1,574, dnr=145)
All Teachers -‐ 2012 (n=13,383; dnr=769) All Teachers -‐ 2013 (n=20,566; dnr=2,294)
Chart 3.4.1: Extent that feedback was perceived to be focused on improving teaching or making a judgment: 2012 to 2013 comparison by teacher,
observer, and model (n=22,860)
The feedback that I received from my evaluator was focused more on helping me improve my teaching than making a judgment about my performance.
The feedback that I received from my evaluator was equally focused on helping me improve my teaching and making a judgment about my performance.
The feedback that I received from my evaluator was focused more on making a judgment about my performance than helping me improve my teaching.
Initial Findings, 2013 First to the Top Survey-‐ 27
Research Question 3.2d revealed that almost four out of five teachers who perceived that their feedback was more focused on making a judgment received no follow up from their observer, while this proportion falls to one in three for teachers who perceived that the feedback was more focused on improvement. The relationship between teacher responses to this question and other implementation and perceptual issues is explored throughout the remainder of this report.
SECTION III SUMMARY The feedback teachers receive from the evaluation process used in their schools is a key element of evaluation systems and is seen as a mechanism for improving teaching and student achievement. Examination of responses to items about feedback provided to and received by teachers in the 2013 First to the Top Survey yielded the key results summarized below.
Primary Focus of Observation Feedback Teacher and observer perceptions of the primary focus of observation feedback based on 2013 survey responses revealed about a 10 percentage point increase over 2012 levels in the shares that perceived observation feedback to be more focused on helping teachers improve than judging their performance. A large majority of 2013 observers (76 percent) believe that their feedback is more focused on helping teachers improve, while just under half of teachers (47 percent) perceive feedback based on teaching observations the same way. There were no large differences in these responses across teacher evaluation models.
Teaching Strengths Nearly 95 percent of responding teachers selected a rubric indicator that had been identified through teaching observations as the strongest aspect of their teaching performance. The nature of the most frequently selected aspects of teaching performance varied across evaluation models; teachers in schools using the TEAM model identified INSTRUCTION: Content knowledge most often; teachers in schools using TEM selected the TEACH: Engage students in lessons most often. In contrast, teachers in schools using TIGER selected the CLASSROOM ENVIRONMENT: Teacher interaction with students indicator most frequently although indicators related to instruction comprised three of the top five selected indicators for these teacher respondents. The COACH model had the most divergent results, with the CLASSROOM MANAGEMENT: Relationships indicator selected most often, and CLASSROOM MANAGEMENT indicators accounting for three of the top five indicators for this group of teachers. About 40 percent of these teachers indicated that their observer provided suggestions for how they could improve their area of strength and a third of the teachers were encouraged to share their strength with other teachers. The likelihood that teachers were asked to share their strengths did not vary by teacher experience and only slightly varied by the final 2012 evaluation ratings they received. Teachers whose observer had encouraged them to share their strength with other teachers were more likely to perceive the primary focus of their feedback to be improvement instead of making a judgment.
Initial Findings, 2013 First to the Top Survey-‐ 28
Teaching Areas Most in Need of Improvement A slightly smaller share of responding teachers (93 percent) selected a rubric indicator that had been identified through teaching observations as the area most in need of improvement. Again, there was some variation in the indicators selected as improvement areas by teachers in schools using different evaluation models, though the most frequently reported indicators were related to developing students’ higher order thinking skills. Teachers in schools using the TEAM or TIGER model identified INSTRUCTION indicators related to using questioning techniques most often; teachers in schools using the TEM model identified developing higher order thinking skills by a wide margin; and teachers in schools using the COACH model identified the Mapping indicator under the Planning domain most often. Nearly 80 percent of teachers indicated that their observer had recommended one or more activities or resources to help them improve their performance on the area identified as most needing improvement, which means over 20 percent did not receive specific recommendation on how they could improve their performance. Interestingly, more than twice as many teachers indicated they pursued each improvement strategy listed in the survey than the share who said that the strategy was suggested by their evaluator. While self-‐directed reading/learning was most often recommended and pursued by teachers, other activities and resources most often recommended and pursued tended to include interactions with colleagues and peers, e.g., observing other teachers, working one-‐on-‐one with a mentor teacher, etc. These strategies based on interactions with peers also tended to be the strategies that teachers reported were more useful in helping them improve their teaching. While university courses were not identified as recommended or pursued improvement strategies very often, it was most likely to be rated as helping improve teaching a lot by those who pursued this improvement option. Nearly half of responding teachers indicated that their observers never followed up with them about the areas identified as most needing improvement, with teachers in schools using the TEAM model a bit more likely than other teachers to indicate no follow up by their observers. Less than one in five teachers indicated that their observers followed up with them more than one time.
Initial Findings, 2013 First to the Top Survey-‐ 29
IV. INFORMATION ABOUT HOW TEACHER EVALUATION SYSTEMS ARE BEING IMPLEMENTED The full, statewide implementation of revisions to Tennessee’s teacher evaluation process occurred during the 2011-‐12 school year, and the 2012 First to the Top Survey Preliminary Report focused heavily on the fidelity of this program roll-‐out. Tennessee’s utilization of an electronic data platform that tracks both the number and timeliness of observations and who conducts observations reduces the need to investigate issues concerning the fidelity of implementation through the First to the Top Survey. The focus of items related to systems implementation in the 2013 version of the survey probed issues such as who conducted observations, observers’ self-‐reported level of preparation, time obligations of evaluation for both observers and teachers, and the timeliness of score reporting.
Research Question 4.1: How are the jobs of observers being affected by teacher evaluation efforts? Research question 4.1 focuses on implementation of the teacher evaluation process as it relates to those individuals who observe and evaluate teachers. A series of specific research questions guided investigations into who conducted how many observations and how much time and effort this work required. Researchers also examined the extent that observers reported changes to the allocation of time to various job tasks in 2012-‐13 compared to 2011-‐12.
Research Question 4.1a: Who conducted teacher observations, and has this changed since last year? The distributions of observer respondents across job positions in 2012 and 2013 by model are shown in the Table 4.1a.1. A larger share of observer respondents came from the teacher ranks in 2013 than in 2012. Since the percentages for each year have to sum to 100, the shares for other groups, by definition, had to decline when percentages for teacher-‐observers increased. It is unclear if this shift actually reflects a trend to recruit more teachers into the observer ranks or if the increase in teachers’ survey response rates in 2013 produced a larger relative increase in the number of teacher-‐observers compared to building administrators and instructional coaches. The 10 percentage point increase in teacher response rates yielded a much larger increase in teacher respondents than the corresponding 10 percent increase in building administrator and instructional coach responses. The increase in

Initial Findings, 2013 First to the Top Survey-‐ 30
teacher-‐observer percentages occurred for all models. 26,27
Table 4.1a.1: Observer positions, by model, 2013 and 2012
Principal
Assistant or vice
principal
Instructional coach
Teacher
Other
TEAM, 2013 (n=2,536) 27% 26% 6% 40% 2%
TEAM, 2012 (n=1,344) 31% 30% 7% 31% 1% TIGER, 2013 (n=150) 19% 18% 8% 54% 1%
TIGER, 2012 (n=64) 27% 16% 19% 39% 0% COACH, 2013 (n=173) 23% 24% 2% 50% 1%
COACH, 2012 (n=32) 31% 34% 0% 34% 0%
The increase in the number of teacher-‐observers from 2012 to 2013 does not necessarily imply that these individuals are conducting more of the teaching observations in their schools. Chart 4.1a.1 displays the results of a question to observers asking them how many teaching observations they had conducted by late spring of the 2012-‐13 school year. Four out of five teacher-‐observers reported conducting fewer than ten observations over the course of the school year. This is in stark contrast to the number of observations conducted by principals and assistant principals. Over 90 percent of building administrators reported conducting 21 or more observations, and three out of four principals and two out of three assistant principals reported conducting 41 or more observations. Because teachers and observers in other positions tend to conduct significantly fewer teaching observations than observers in administrative or coach positions, their responses will be omitted from most analyses in this section of the report.
26Due to the absence of Memphis administrators within the sample, Memphis teachers are also excluded from the analyses within this sub-‐section. 27The increase in teachers indicating that they serve as observers appears to be occurring to the greatest extent within urban districts. An analysis of evaluator positions by urbanicity reveals that within districts with enrollment over 40,000 (with Memphis excluded, Davidson, Knox, and Hamilton Counties), teachers make up 47 percent of the relative observer share.

Initial Findings, 2013 First to the Top Survey-‐ 31
Research Question 4.1b: How prepared do observers feel to carry out specific components of the teacher observation and evaluation process? Have these perceptions changed over time? The TDOE has made available training for evaluators focused on how to conduct observations and complete other tasks associated with educator evaluation systems. Observers were asked to indicate the amount of various types of evaluator training they attended during the 2012-‐13 school year and how prepared they felt to conduct evaluation tasks. Table 4.1b.1 summarizes the percent of administrator/coach observers who indicated they felt Adequately Prepared or Very Prepared for each listed evaluation task. Results were disaggregated by the different training respondents indicated they had received during 2012-‐13. For example, 83 percent of individuals who participated in TEAM Recertification Training during 2012-‐13 felt Adequately Prepared or Very Prepared to conduct beginning-‐of-‐the-‐year coaching conversations. Broadly speaking, reported levels of preparation are high across all training levels and evaluation tasks. A few trends are readily apparent from the table. First, TEAM observers who participated in recertification training were more comfortable on all evaluation aspects than new TEAM observers; similarly, observers using an alternative model that received more training felt more prepared than those who received less training. Additionally, all groups felt more prepared than observers who received no training. Administrator/coach observers reported having the lowest levels of preparation with beginning-‐of-‐the-‐year coaching conversations and explaining the calculation of the overall effectiveness rating.
40%
59%
7%
19%
22%
7%
11%
11%
23%
6%
4%
15%
5%
33%
27%
19%
13%
16%
40%
34%
2%
15%
25%
41%
0% 10% 20% 30% 40% 50% 60% 70% 80% 90% 100%
Other (n=47, dnr=7)
Teacher (n=1,206, dnr=212)
Instructional coach (n=186, dnr=7)
Assistant or vice principal (n=681, dnr=47)
Principal (n=708, dnr=33)
Chart 4.1a.1: Number of observations conducted in 2013 at time of survey administration, by position
1 to 5 6 to 10 11 to 20 21 to 40 41 to 70 Over 70
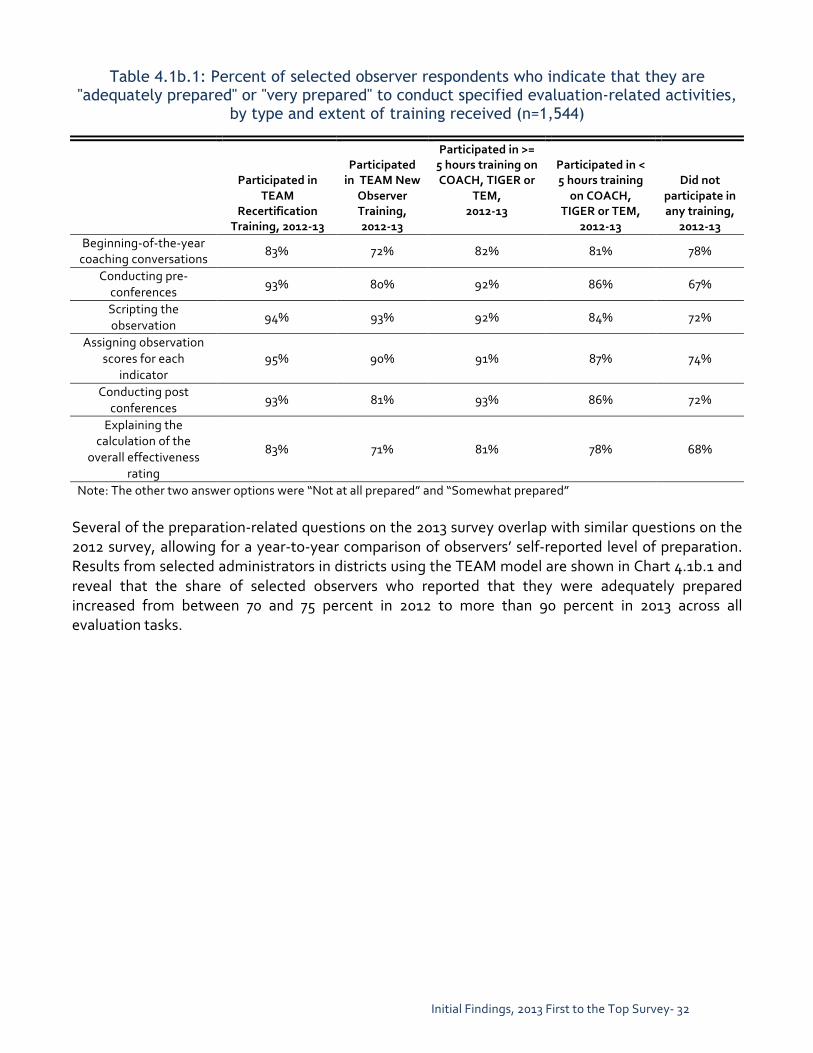
Initial Findings, 2013 First to the Top Survey-‐ 32
Table 4.1b.1: Percent of selected observer respondents who indicate that they are "adequately prepared" or "very prepared" to conduct specified evaluation-related activities,
by type and extent of training received (n=1,544)
Participated in TEAM
Recertification Training, 2012-‐13
Participated in TEAM New
Observer Training, 2012-‐13
Participated in >= 5 hours training on COACH, TIGER or
TEM, 2012-‐13
Participated in < 5 hours training
on COACH, TIGER or TEM,
2012-‐13
Did not participate in any training,
2012-‐13 Beginning-‐of-‐the-‐year coaching conversations
83% 72% 82% 81% 78%
Conducting pre-‐conferences
93% 80% 92% 86% 67%
Scripting the observation
94% 93% 92% 84% 72%
Assigning observation scores for each
indicator 95% 90% 91% 87% 74%
Conducting post conferences
93% 81% 93% 86% 72%
Explaining the calculation of the
overall effectiveness rating
83% 71% 81% 78% 68%
Note: The other two answer options were “Not at all prepared” and “Somewhat prepared” Several of the preparation-‐related questions on the 2013 survey overlap with similar questions on the 2012 survey, allowing for a year-‐to-‐year comparison of observers’ self-‐reported level of preparation. Results from selected administrators in districts using the TEAM model are shown in Chart 4.1b.1 and reveal that the share of selected observers who reported that they were adequately prepared increased from between 70 and 75 percent in 2012 to more than 90 percent in 2013 across all evaluation tasks.

Initial Findings, 2013 First to the Top Survey-‐ 33
27%
8%
25%
5%
14%
5%
25%
8%
50%
42%
49%
43%
47%
41%
52%
46%
22%
49%
25%
51%
38%
53%
22%
45%
0% 20% 40% 60% 80% 100%
Conducting post conferences, 2012 (n=928; dnr=924)
Conducting post conferences, 2013 (n=1,425; dnr=83)
Assigning observation scores for each rubric, 2012 (n=928; dnr=922)
Assigning observation scores for each indicator, 2013 (n=1,425; dnr=82)
Scripting the observation, 2012 (n=928; dnr=921)
Scripting the observation, 2013 (n=1,386; dnr=121)
Conducting pre-‐conferences, 2012 (n=924; dnr=4)
Conducting pre-‐conferences, 2013 (n=1,431; dnr=75)
Chart 4.1b.1: Reported level of preparation of selected observers, by evaluation activity, 2013 to 2012, TEAM only
Not at all prepared Somewhat prepared Adequately prepared Very prepared

Initial Findings, 2013 First to the Top Survey-‐ 34
Research Question 4.1c: How much time is being devoted by observers to teacher evaluations? The 2013 survey asked a different question concerning the amount of time being devoted by observers to teacher observations and other evaluation tasks than similar questions on the 2012 survey. Instead of asking respondents to report the amount of time by component, the 2013 survey asked for an estimate of the average number of hours spent each week on work related to teacher evaluations. These results are reported in Chart 4.1c.1 by position and by model. Across all models, administrators spend more time every week doing work related to teacher evaluations than observers in other positions. There is some variation across models, with assistant principals in schools using the TIGER model spending relatively less time on evaluations than assistant principals in schools using the TEAM 0r COACH models. As would be expected based on the earlier finding that teacher-‐observers conduct far fewer observations than other observer groups, nearly 80 percent of teacher-‐observers in schools using the TEAM model and over 90 percent of teacher-‐observers using other models reported that they spent 0 to 6 hours per week on work related to teacher evaluations.
Notes: Results for TEM are not reported due to missing Memphis administrator responses. Results for instructional coaches utilizing the COACH model are also intentionally excluded due to a small sample size.
96%
94%
78%
58%
60%
51%
59%
43%
43%
36%
37%
4%
6%
17%
25%
31%
46%
33%
44%
40%
46%
43%
6%
17%
9%
3%
7%
14%
17%
18%
20%
0% 10% 20% 30% 40% 50% 60% 70% 80% 90% 100%
COACH (n=67, dnr=19)
TIGER (n=77, dnr=4)
TEAM (n=876, dnr=145)
TIGER (n=12, dnr=0)
TEAM (n=134, dnr=5)
COACH (n=37, dnr=5)
TIGER (n=27, dnr=0)
TEAM (n=617, dnr=42)
COACH (n=35, dnr=5)
TIGER (n=28, dnr=1)
TEAM (n=647, dnr=25)
Teac
her
Instructiona
l Co
ach
Assistant or V
ice
Principa
l Principa
l
Chart 4.1c.1: Number of hours per week on work related to teacher observations, 2013, by position and by model
0 to 6 hours 7 to 12 hours Over 12 hours

Initial Findings, 2013 First to the Top Survey-‐ 35
Research Question 4.1d: In what ways do observers report that the allocation of their time has changed when comparing 2012-‐13 to 2011-‐12? Making room in observers’ work schedules for conducting teaching observations and completing other tasks related to teacher evaluations may require that administrators and other observers adjust the time and effort devoted to other job duties. The 2013 First to the Top survey presented to observers a list of leadership activities and administrative job tasks and asked respondents to indicate if they are spending more, less, or about the same amount of time as last year on each item. Results from administrator and coach responses to this question are shown in Chart 4.1d.1. The job tasks in Chart 4.1d.1 are listed in descending order based on the share of respondents who reported spending more time compared to the prior year. The relative ranking of these items is interesting with the top four activities being very much oriented toward instructional leadership. In fact, more observers reported more time devoted to those activities than the share spending more time on teacher evaluations. While more than half of observers reported spending more time interacting with teachers about their teaching, based on teacher responses summarized in section 3, these interactions may not have been perceived as being follow-‐up on areas identified needing improvement.
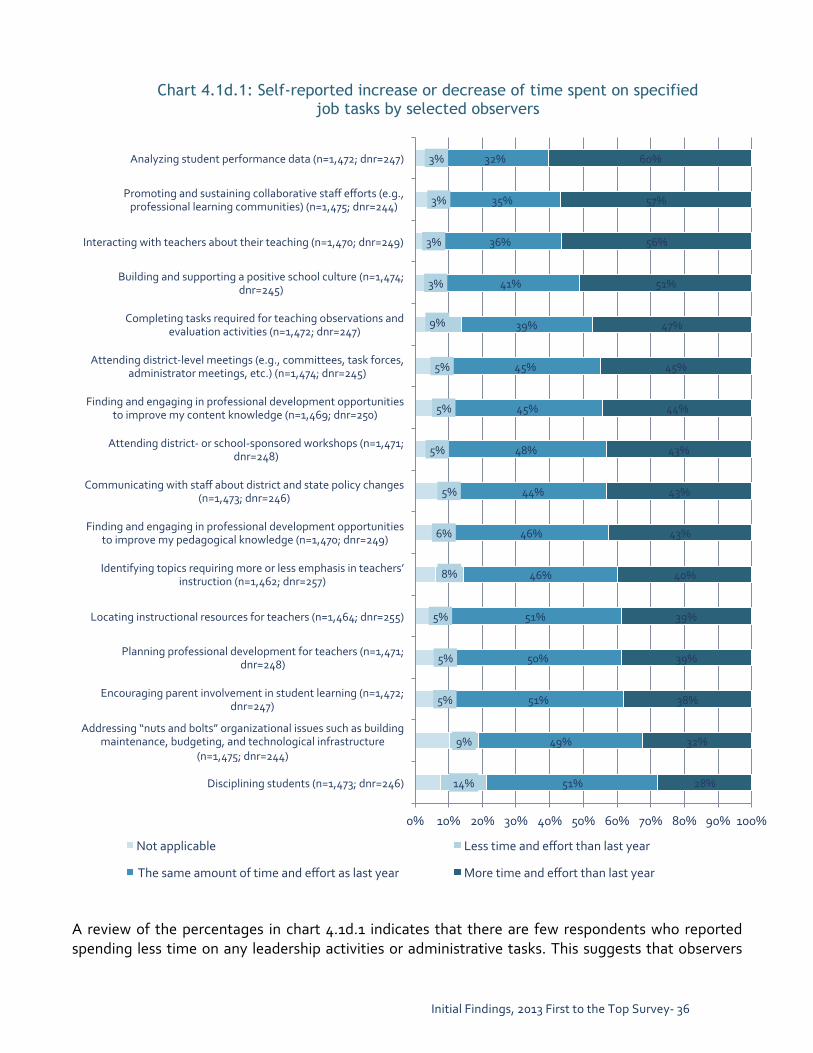
Initial Findings, 2013 First to the Top Survey-‐ 36
A review of the percentages in chart 4.1d.1 indicates that there are few respondents who reported spending less time on any leadership activities or administrative tasks. This suggests that observers
14%
9%
5%
5%
5%
8%
6%
5%
5%
5%
5%
9%
3%
3%
3%
3%
51%
49%
51%
50%
51%
46%
46%
44%
48%
45%
45%
39%
41%
36%
35%
32%
28%
32%
38%
39%
39%
40%
43%
43%
43%
44%
45%
47%
51%
56%
57%
60%
0% 10% 20% 30% 40% 50% 60% 70% 80% 90% 100%
Disciplining students (n=1,473; dnr=246)
Addressing “nuts and bolts” organizational issues such as building maintenance, budgeting, and technological infrastructure
(n=1,475; dnr=244)
Encouraging parent involvement in student learning (n=1,472; dnr=247)
Planning professional development for teachers (n=1,471; dnr=248)
Locating instructional resources for teachers (n=1,464; dnr=255)
Identifying topics requiring more or less emphasis in teachers’ instruction (n=1,462; dnr=257)
Finding and engaging in professional development opportunities to improve my pedagogical knowledge (n=1,470; dnr=249)
Communicating with staff about district and state policy changes (n=1,473; dnr=246)
Attending district-‐ or school-‐sponsored workshops (n=1,471; dnr=248)
Finding and engaging in professional development opportunities to improve my content knowledge (n=1,469; dnr=250)
Attending district-‐level meetings (e.g., committees, task forces, administrator meetings, etc.) (n=1,474; dnr=245)
Completing tasks required for teaching observations and evaluation activities (n=1,472; dnr=247)
Building and supporting a positive school culture (n=1,474; dnr=245)
Interacting with teachers about their teaching (n=1,470; dnr=249)
Promoting and sustaining collaborative staff efforts (e.g., professional learning communities) (n=1,475; dnr=244)
Analyzing student performance data (n=1,472; dnr=247)
Chart 4.1d.1: Self-reported increase or decrease of time spent on specified job tasks by selected observers
Not applicable Less time and effort than last year
The same amount of time and effort as last year More time and effort than last year
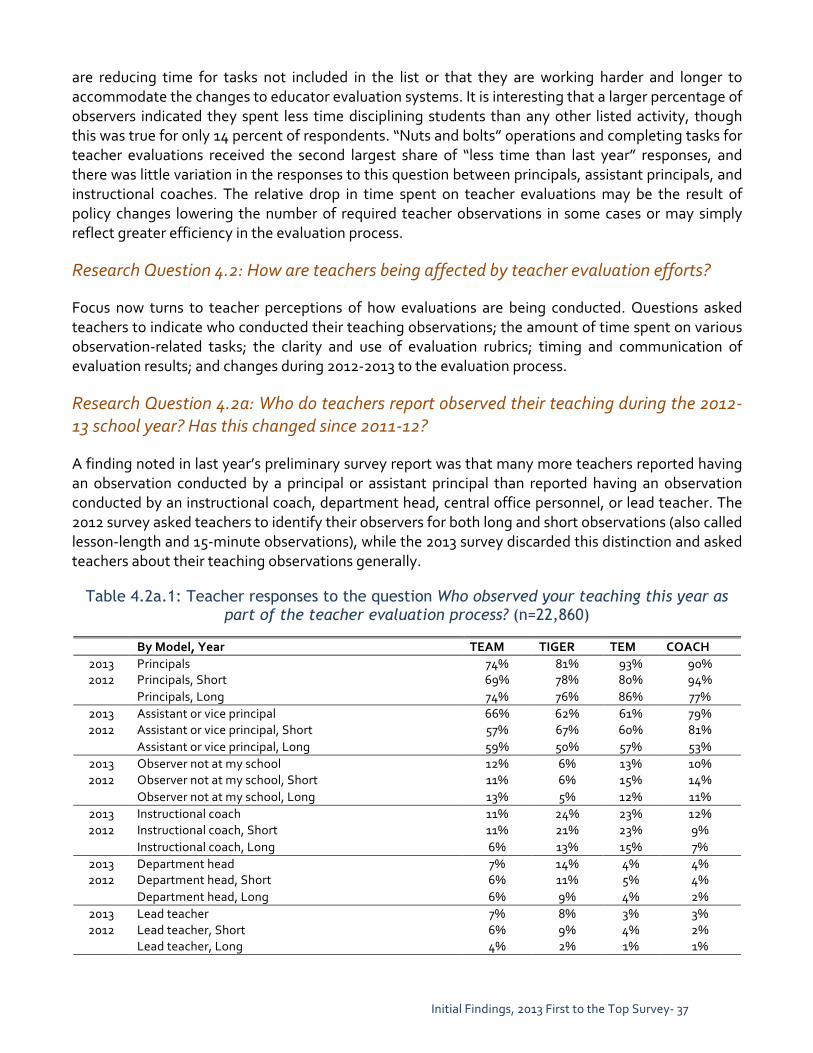
Initial Findings, 2013 First to the Top Survey-‐ 37
are reducing time for tasks not included in the list or that they are working harder and longer to accommodate the changes to educator evaluation systems. It is interesting that a larger percentage of observers indicated they spent less time disciplining students than any other listed activity, though this was true for only 14 percent of respondents. “Nuts and bolts” operations and completing tasks for teacher evaluations received the second largest share of “less time than last year” responses, and there was little variation in the responses to this question between principals, assistant principals, and instructional coaches. The relative drop in time spent on teacher evaluations may be the result of policy changes lowering the number of required teacher observations in some cases or may simply reflect greater efficiency in the evaluation process.
Research Question 4.2: How are teachers being affected by teacher evaluation efforts? Focus now turns to teacher perceptions of how evaluations are being conducted. Questions asked teachers to indicate who conducted their teaching observations; the amount of time spent on various observation-‐related tasks; the clarity and use of evaluation rubrics; timing and communication of evaluation results; and changes during 2012-‐2013 to the evaluation process.
Research Question 4.2a: Who do teachers report observed their teaching during the 2012-‐13 school year? Has this changed since 2011-‐12? A finding noted in last year’s preliminary survey report was that many more teachers reported having an observation conducted by a principal or assistant principal than reported having an observation conducted by an instructional coach, department head, central office personnel, or lead teacher. The 2012 survey asked teachers to identify their observers for both long and short observations (also called lesson-‐length and 15-‐minute observations), while the 2013 survey discarded this distinction and asked teachers about their teaching observations generally.
Table 4.2a.1: Teacher responses to the question Who observed your teaching this year as part of the teacher evaluation process? (n=22,860)
By Model, Year TEAM TIGER TEM COACH 2013 Principals 74% 81% 93% 90% 2012 Principals, Short 69% 78% 80% 94%
Principals, Long 74% 76% 86% 77% 2013 Assistant or vice principal 66% 62% 61% 79% 2012 Assistant or vice principal, Short 57% 67% 60% 81%
Assistant or vice principal, Long 59% 50% 57% 53% 2013 Observer not at my school 12% 6% 13% 10% 2012 Observer not at my school, Short 11% 6% 15% 14%
Observer not at my school, Long 13% 5% 12% 11% 2013 Instructional coach 11% 24% 23% 12% 2012 Instructional coach, Short 11% 21% 23% 9%
Instructional coach, Long 6% 13% 15% 7% 2013 Department head 7% 14% 4% 4% 2012 Department head, Short 6% 11% 5% 4%
Department head, Long 6% 9% 4% 2% 2013 Lead teacher 7% 8% 3% 3% 2012 Lead teacher, Short 6% 9% 4% 2%
Lead teacher, Long 4% 2% 1% 1%

Initial Findings, 2013 First to the Top Survey-‐ 38
Table 4.2a.1 presents the percent of teachers, by model, who indicated that they were observed at least once by an observer in the listed position type for 2013, for 2012 short observations, and for 2012 lesson-‐length observations. There was little change when comparing 2013 results to either 2012 short evaluation results or 2012 lesson-‐length evaluation results. At least three-‐quarters of teachers indicated that their teaching was observed by a principal and nearly two-‐thirds indicated they were observed by an assistant principal. Differences across models indicate that teachers in schools using TEAM are a little less likely to be observed by their principals than teachers in districts using alternative models. Teachers in districts using the TIGER and TEM models were more likely than teachers in other models to be observed by instructional coaches, especially for less than lesson length observations conducted during the 2011-‐12 school year.
Research Question 4.2b: How much time is being devoted by teachers to the teacher evaluation process? Detailed information was collected in the 2011-‐12 version of the First to the Top Survey about the time teachers spent on specific activities related to both short and long teaching observations. In the 2013 version of the survey, teachers were asked to indicate the total time they had spent during the school year on four major tasks related to observations, from preparing for conferences to receiving and/or reviewing feedback. Results for all teacher respondents are reported in Chart 4.2b.1 and reveal that teachers spend the most time preparing for observations with nearly 30 percent indicating they spent more than five hours on this task and an additional 37 percent indicating they spent between 2 and 5 hours preparing for observations during the 2012-‐13 school year. The majority of responding teachers indicated that they spent just a couple hours or less during the year on all other observation activities. It is noteworthy that about two in five teachers report that they spent between two and five hours being observed.
16%
30%
77%
56%
88%
37%
6%
39%
9%
29%
5%
0% 20% 40% 60% 80% 100%
Preparing for observations (n=22,218; dnr=642)
Pre-‐conferences (n=22,037; dnr=823)
Being observed (n=21,969; dnr=891)
Receiving / reviewing feedback (n=22,238; dnr=622)
Chart 4.2b.1: Time teachers reported spending on teacher evaluation tasks
No Time Up to 2 Hours 2 to 5 Hours Over 5 Hours

Initial Findings, 2013 First to the Top Survey-‐ 39
Disaggregated results for teacher time spent preparing for teaching observations in 2012-‐13 are presented in Chart 4.2b.2 and reveal large variations across evaluation models used. Nearly two in five teachers in schools using the COACH model reported they spent zero minutes preparing for observations, while nearly a third of teachers in schools using the TEAM or TEM models reported they spent more than five hours preparing for observations. These differences concerning time required are most likely a consequence of the design of each system, with COACH’s approach requiring frequent but brief classroom visits. Teachers who indicated they perceived the primary focus of observation feedback to be judgment were a bit more likely than teachers who perceived their feedback to be focused on improvement to spend more than five hours preparing for observations. Time spent preparing for teaching observations also varied systematically by experience with more novice teachers spending more than five hours preparing than any other group. What is interesting is the large drop in the share of teachers in the next experience level (four to six years) who spent more than five hours preparing for observations and then the gradual increase in time spent preparing for each successive experience group. Though not presented in graphs or tables in this report, patterns in time spent on other observation tasks also were examined across the same disaggregation variables. The time spent being observed varied systematically with final 2012 evaluation ratings and teacher experience. Teachers who received lower ratings in 2012 were much more likely to be observed for more than 3 hours; teachers who earned a final rating of one or two in 2012 were nearly three times more likely to report that they were observed for at least three hours than teachers who earned a rating of five in 2012 (11 percent of these teachers reported being observed for three or more hours). Similarly, 39 percent of novice teachers, more than twice the percentage of teachers in any other experience level, indicated that they had been observed for at least three hours. Finally, reported time spent being observed varied across observation models with teachers in schools using TEAM much less likely to choose an option less than two hours than teachers in the other models. More than a quarter of teachers in schools using the COACH or TEM model and about one in five teachers in schools using the TIGER model reported spending less than an hour being observed; this is in contrast to the 12 percent of teachers in schools using TEAM who indicated they spent less than an hour being observed.

Initial Findings, 2013 First to the Top Survey-‐ 40
4%
3%
4%
5%
6%
3%
3%
3%
0%
2%
10%
1%
38%
4%
4%
5%
4%
3%
3%
8%
8%
8%
8%
10%
8%
8%
7%
7%
7%
22%
8%
21%
7%
9%
10%
8%
8%
8%
22%
23%
22%
18%
24%
21%
21%
23%
25%
21%
26%
25%
16%
18%
25%
24%
22%
22%
20%
20%
21%
20%
17%
19%
20%
20%
21%
20%
21%
13%
20%
7%
18%
20%
21%
21%
19%
19%
17%
18%
17%
17%
16%
18%
18%
17%
24%
18%
12%
17%
5%
18%
17%
16%
18%
17%
18%
29%
27%
29%
35%
26%
30%
30%
29%
24%
31%
16%
29%
12%
35%
25%
26%
27%
31%
32%
0% 10% 20% 30% 40% 50% 60% 70% 80% 90% 100%
Overall (n=22,218)
Primary Focus of Feedback
More Improvement (n=9,570)
Equal (n=6,244)
More Judgment (n=4,570)
Final 2012 Evaluation Rating
Final Rating = 5 (n=8,107)
Final Rating = 4 (n=6,411)
Final Rating = 3 (n=4,248)
Final Rating = 2 (n=1,361)
Final Rating = 1 (n=59)
Evaluation Model in Use
TEAM (n=17,865)
TIGER (n=649)
TEM (n=2,542)
COACH (n=1,162)
Educator Experience
0 to 3 years (n=4,076)
4 to 6 years (n=2,941)
7 to 10 years (n=3,304)
11 to 17 years (n=5,232)
18 to 25 years (n=3,579)
Over 26 years (n=3,086)
Chart 4.2b.2: Disaggregated results for time teachers reported spending preparing for observations of teaching in 2012-13 (n=22,860)
0 Minutes Less than 1 Hour 1 to 2 Hours 2 to 3 Hours 3 to 5 Hours Over 5 Hours

Initial Findings, 2013 First to the Top Survey-‐ 41
Research Question 4.2c: How are rubrics being used in the evaluation process and to what degree do teachers and observers believe they are helpful? The report now turns to a brief investigation into teachers’ and observers’ perceptions of the clarity of their model-‐specific rubrics and the extent that rubrics were used by observers to suggest ways teachers could improve their teaching. Chart 4.2c.1 presents by model the extent that teachers and observers agree with a statement concerning the clarity of the rubrics. In 2013, two out of three TEAM teachers agreed or strongly agreed that their rubric “clearly describes the teaching performance needed to earn each rating score.” This level of agreement reflects an increase of 10 percentage points over the level of agreement observed in 2012. Teachers using other evaluation models also showed increases in level of agreement with this statement, though the increase was not quite as large. While not shown in chart 4.2c.1, observers agreed with this statement about 80 percent of the time which reflected a slight increase over 2012 levels.
8%
7%
6%
5%
4%
3%
4%
3%
19%
16%
14%
11%
12%
10%
15%
11%
52%
57%
63%
62%
62%
65%
62%
65%
21%
19%
17%
22%
22%
22%
20%
21%
2012, COACH Teachers (n=398; dnr=23)
2013, COACH Teachers (n=1,032; dnr=195)
2012, TEM Teachers (n=1,797; dnr=114)
2013, TEM Teachers (n=2,358; dnr=248)
2012, TIGER Teachers (n=449; dnr=13)
2013, TIGER Teachers (n=598; dnr=76)
2012, TEAM Teachers (n=10,842; dnr=538)
2013, TEAM Teachers (n=16,596; dnr=1,757)
My ev
alua
tor u
ses the rubric(s) from our te
ache
r eva
luation proc
ess as a basis fo
r sugg
estin
g ho
w I ca
n im
prov
e my teac
hing
.
Chart 4.2c.1: Extent of teachers' agreement that rubrics are used as a basis for suggestions to help them improve their teaching, 2012 and 2013
(n=22,680)
Strongly Disagree Disagree Agree Strongly Agree

Initial Findings, 2013 First to the Top Survey-‐ 42
Given this report’s focus on feedback from observations, the next chart reports by model and year teachers’ reported level of agreement with the statement that the rubric is “used as the basis for suggesting how to improve my teaching”. Results show little movement since last year, with over four out of five teachers agreeing or strongly agreeing with the statement.
Finally, Chart 4.2c.3 reports results from two additional rubric-‐related questions asked of all teachers in 2013. More than two out of three teachers strongly disagree or disagree with the statement that teachers must receive a score of 4 or higher on all indicators on the rubric to be rated an effective teacher, and approximately three out of four teachers agree or strongly agree that the rubric(s) omit important aspects of teaching that should be considered when evaluating teachers.
13%
8%
8%
7%
10%
4%
13%
8%
31%
26%
23%
19%
26%
25%
30%
27%
46%
58%
56%
59%
52%
62%
48%
57%
9%
9%
12%
15%
12%
9%
9%
8%
2012, COACH Teachers (n=376; dnr=22)
2013, COACH Teachers (n=1,031; dnr=196)
2012, TEM Teachers (n=1,790; dnr=121)
2013, TEM Teachers (n=2,339; dnr=267)
2012, TIGER Teachers (n=448; dnr=14)
2013, TIGER Teachers (n=599; dnr=75)
2012, TEAM Teachers (n=10,834; dnr=546)
2013, TEAM Teachers (n=16,541; dnr=1,812)
The rubric(s) u
sed in m
y scho
ol’s teac
her e
valuation proc
ess clea
rly describe the teac
hing
perform
ance
ne
eded
to earn ea
ch ra
ting score.
Chart 4.2c.2: Extent of teachers' agreement that the rubrics clearly define performance needed to earn each rating score, 2012 and 2013 (n=22,680)
Strongly Disagree Disagree Agree Strongly Agree
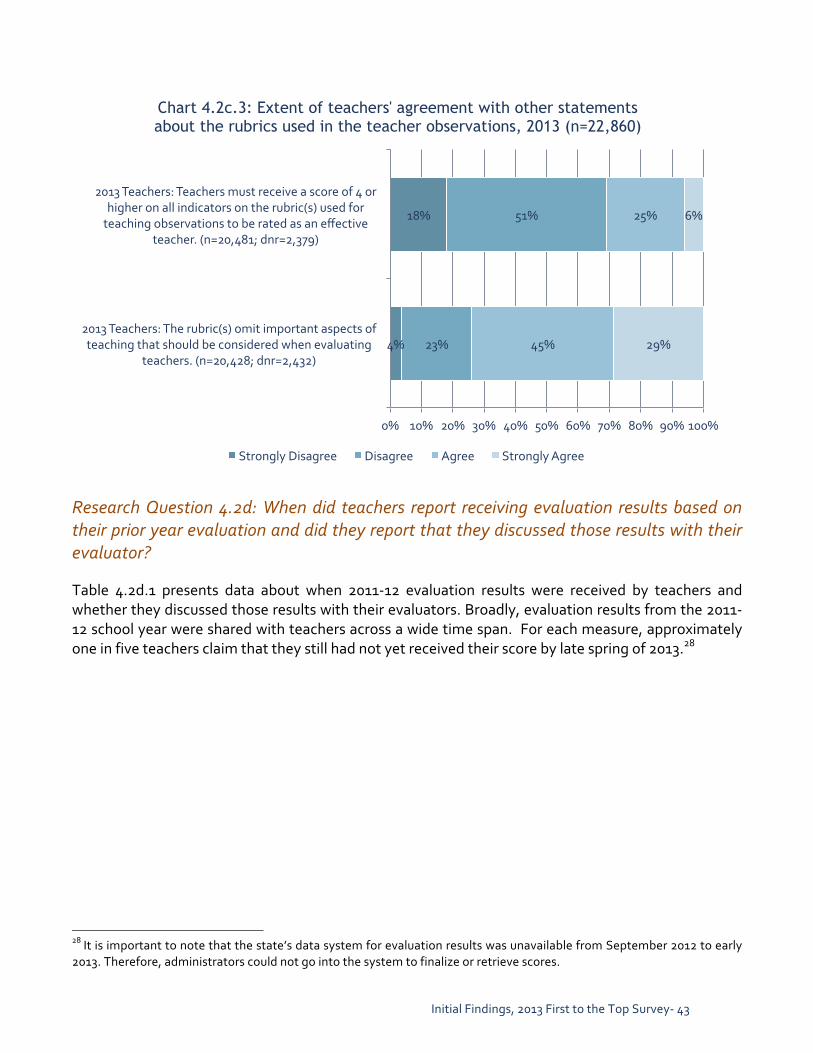
Initial Findings, 2013 First to the Top Survey-‐ 43
Research Question 4.2d: When did teachers report receiving evaluation results based on their prior year evaluation and did they report that they discussed those results with their evaluator? Table 4.2d.1 presents data about when 2011-‐12 evaluation results were received by teachers and whether they discussed those results with their evaluators. Broadly, evaluation results from the 2011-‐12 school year were shared with teachers across a wide time span. For each measure, approximately one in five teachers claim that they still had not yet received their score by late spring of 2013.28
28 It is important to note that the state’s data system for evaluation results was unavailable from September 2012 to early 2013. Therefore, administrators could not go into the system to finalize or retrieve scores.
4%
18%
23%
51%
45%
25%
29%
6%
0% 10% 20% 30% 40% 50% 60% 70% 80% 90% 100%
2013 Teachers: The rubric(s) omit important aspects of teaching that should be considered when evaluating
teachers. (n=20,428; dnr=2,432)
2013 Teachers: Teachers must receive a score of 4 or higher on all indicators on the rubric(s) used for teaching observations to be rated as an effective
teacher. (n=20,481; dnr=2,379)
Chart 4.2c.3: Extent of teachers' agreement with other statements about the rubrics used in the teacher observations, 2013 (n=22,860)
Strongly Disagree Disagree Agree Strongly Agree

Initial Findings, 2013 First to the Top Survey-‐ 44
Table 4.2d.1: When teachers indicated that they received evaluation results
from the 2011-2012 school year, and whether or not results were discussed with their evaluator
Spring 2012
Summer 2012
Fall 2012
Spring 2013
Not Yet Received
Discussed with
Evaluator
Not
Discussed 35% Growth Measure (n=18,784dnr=4,076)
25% 25% 26% 5% 19% 61% 39%
15% Achievement Measure (n=18,697; dnr=4,163)
28% 22% 26% 6% 18% 62% 38%
50% Qualitative Measure (n=18,531; dnr=4,329)
36% 18% 22% 6% 18% 67% 33%
My overall effectiveness rating (n=18,828; dnr=4,032)
21% 23% 30% 8% 18% 63% 37%
The final two columns in Table 4.2d.1 report the extent that teachers who did receive scores discussed them with their evaluator and reveal that, for each measure, about two out of three teachers had discussed the result with their evaluator.29 This aggregate percentage hides an interesting finding, however. When limited to the 11,489 teachers who answered this question for all four measures, 56 percent answered “Yes” to all four, 28 percent answered “No” to all four, and the remaining 16 percent had a mix of “Yes” and “No”. While some of the 28 percent of teachers who never discussed any result with their evaluator may be explained by administrative turnover, it may also reveal a subset of evaluators that never engage in discussions with their teachers about their evaluation results.30
Research Question 4.2e: To what extent do TEAM teachers support the changes made to the teacher evaluation process implemented during the 2012-‐2013 school year? Several policy and procedural changes were made to the teacher evaluation model for the 2012-‐13 school year. This section of the report concludes with an examination of teachers’ support for four of those changes. The analysis is limited only to teachers in districts using TEAM, as it is unclear how some of the policy changes were implemented in districts using an alternative model. In addition to asking teachers the degree to which they agree with each statement about the changes to evaluation, the 2013 survey also allowed them to indicate if they were not aware of the change at all. Findings are reported in Table 4.2e.1. More than four out of five teachers support decreasing observation requirements for teachers who previously received an overall performance rating of five, and more than nine out of ten support requiring an initial coaching conversation with teachers who previously received an overall performance rating of one. Support for the next set of changes is reported for two mutually exclusive groups: teachers who indicated that they do not expect to receive an individual growth score and those who do. The two rows indicate that, overall, teachers supported the weighting changes implemented by TDOE at the conclusion of the 2011-‐12 school year and there is no difference when
29A feature of the surveying software solicited teachers’ response on this discussion question only if they had already received their result. 30These also may disproportionately be teachers scoring 5’s on all measures.

Initial Findings, 2013 First to the Top Survey-‐ 45
responses are disaggregated by teachers the new rule would affect and those that it would not. Finally, over two out of three teacher respondents did not support the addition of special education students’ assessment scores into the pool of test scores analyzed to generate individual growth scores and this level holds for both teachers who have an individual growth score and those that do not.31 The information reported in the right-‐hand column of Table 4.2e.1 displays the percent of teacher respondents who indicated that they could not provide an opinion because they were not aware of the change. Note that teachers were most aware of the decreased number of observations required for teachers previously scoring a five and least aware of the requirement to hold initial coaching conversations with teachers previously scoring a one. When examined by 2012 final evaluation score, those few teachers who received a one or two rating were more likely to know about the initial coaching conversation requirement and nearly 90 percent of them agreed that the change represented an improvement to the teacher evaluation process.
31 The other interesting finding from this question is the difference by teacher years of experience, which is 64 percent Strongly Disagree/Disagree for teachers with 0-‐3 years of experience and nearly 80 percent Strongly Disagree/Disagree for teachers with more than 17 years of experience.
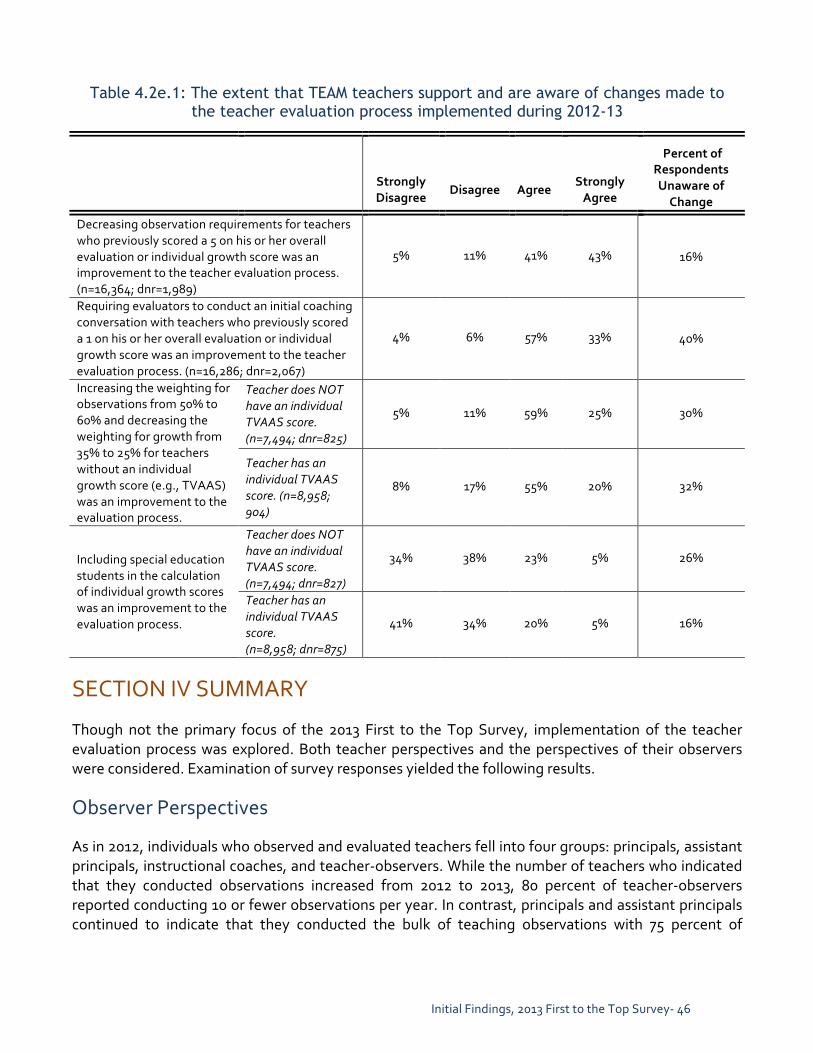
Initial Findings, 2013 First to the Top Survey-‐ 46
Table 4.2e.1: The extent that TEAM teachers support and are aware of changes made to
the teacher evaluation process implemented during 2012-13
Strongly Disagree
Disagree
Agree
Strongly Agree
Percent of Respondents Unaware of Change
Decreasing observation requirements for teachers who previously scored a 5 on his or her overall evaluation or individual growth score was an improvement to the teacher evaluation process. (n=16,364; dnr=1,989)
5% 11% 41% 43% 16%
Requiring evaluators to conduct an initial coaching conversation with teachers who previously scored a 1 on his or her overall evaluation or individual growth score was an improvement to the teacher evaluation process. (n=16,286; dnr=2,067)
4% 6% 57% 33% 40%
Increasing the weighting for observations from 50% to 60% and decreasing the weighting for growth from 35% to 25% for teachers without an individual growth score (e.g., TVAAS) was an improvement to the evaluation process.
Teacher does NOT have an individual TVAAS score. (n=7,494; dnr=825)
5% 11% 59% 25% 30%
Teacher has an individual TVAAS score. (n=8,958; 904)
8% 17% 55% 20% 32%
Including special education students in the calculation of individual growth scores was an improvement to the evaluation process.
Teacher does NOT have an individual TVAAS score. (n=7,494; dnr=827)
34% 38% 23% 5% 26%
Teacher has an individual TVAAS score. (n=8,958; dnr=875)
41% 34% 20% 5% 16%
SECTION IV SUMMARY Though not the primary focus of the 2013 First to the Top Survey, implementation of the teacher evaluation process was explored. Both teacher perspectives and the perspectives of their observers were considered. Examination of survey responses yielded the following results.
Observer Perspectives As in 2012, individuals who observed and evaluated teachers fell into four groups: principals, assistant principals, instructional coaches, and teacher-‐observers. While the number of teachers who indicated that they conducted observations increased from 2012 to 2013, 80 percent of teacher-‐observers reported conducting 10 or fewer observations per year. In contrast, principals and assistant principals continued to indicate that they conducted the bulk of teaching observations with 75 percent of
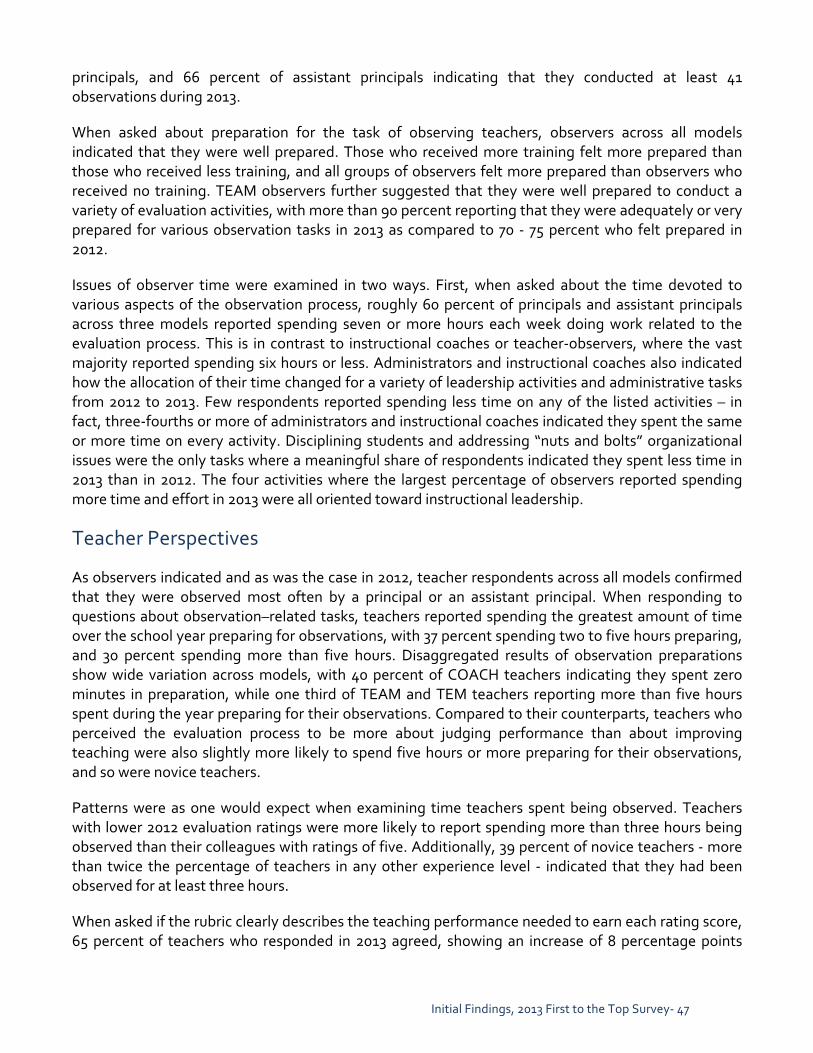
Initial Findings, 2013 First to the Top Survey-‐ 47
principals, and 66 percent of assistant principals indicating that they conducted at least 41 observations during 2013. When asked about preparation for the task of observing teachers, observers across all models indicated that they were well prepared. Those who received more training felt more prepared than those who received less training, and all groups of observers felt more prepared than observers who received no training. TEAM observers further suggested that they were well prepared to conduct a variety of evaluation activities, with more than 90 percent reporting that they were adequately or very prepared for various observation tasks in 2013 as compared to 70 -‐ 75 percent who felt prepared in 2012. Issues of observer time were examined in two ways. First, when asked about the time devoted to various aspects of the observation process, roughly 60 percent of principals and assistant principals across three models reported spending seven or more hours each week doing work related to the evaluation process. This is in contrast to instructional coaches or teacher-‐observers, where the vast majority reported spending six hours or less. Administrators and instructional coaches also indicated how the allocation of their time changed for a variety of leadership activities and administrative tasks from 2012 to 2013. Few respondents reported spending less time on any of the listed activities – in fact, three-‐fourths or more of administrators and instructional coaches indicated they spent the same or more time on every activity. Disciplining students and addressing “nuts and bolts” organizational issues were the only tasks where a meaningful share of respondents indicated they spent less time in 2013 than in 2012. The four activities where the largest percentage of observers reported spending more time and effort in 2013 were all oriented toward instructional leadership.
Teacher Perspectives As observers indicated and as was the case in 2012, teacher respondents across all models confirmed that they were observed most often by a principal or an assistant principal. When responding to questions about observation–related tasks, teachers reported spending the greatest amount of time over the school year preparing for observations, with 37 percent spending two to five hours preparing, and 30 percent spending more than five hours. Disaggregated results of observation preparations show wide variation across models, with 40 percent of COACH teachers indicating they spent zero minutes in preparation, while one third of TEAM and TEM teachers reporting more than five hours spent during the year preparing for their observations. Compared to their counterparts, teachers who perceived the evaluation process to be more about judging performance than about improving teaching were also slightly more likely to spend five hours or more preparing for their observations, and so were novice teachers. Patterns were as one would expect when examining time teachers spent being observed. Teachers with lower 2012 evaluation ratings were more likely to report spending more than three hours being observed than their colleagues with ratings of five. Additionally, 39 percent of novice teachers -‐ more than twice the percentage of teachers in any other experience level -‐ indicated that they had been observed for at least three hours. When asked if the rubric clearly describes the teaching performance needed to earn each rating score, 65 percent of teachers who responded in 2013 agreed, showing an increase of 8 percentage points

Initial Findings, 2013 First to the Top Survey-‐ 48
over responses for the same question in 2012. Additionally four of five teachers across models agreed or strongly agreed that the rubric was “used as the basis for suggesting how to improve my teaching.” Reponses to this question were similar in 2012. Finally, two new rubric-‐related questions were asked of teachers in 2013. More than two out of three respondents disagreed with the statement that teachers must receive a score of four or higher on all indicators on the rubric to be rated an effective teacher, and approximately three out of four agreed or strongly agreed that the rubric(s) omit important aspects of teaching that should be considered when evaluating teachers. Teachers generally indicated that evaluation results were shared across a wide time span, with one in five teachers reporting that by late spring 2013 they had not yet received at least one measure that contributes to their total evaluation score. For those who had received scores, more than one third had not discussed results from at least one measure with their evaluator. Furthermore, 28 percent of the more than 11,000 respondents who received scores on all four measures indicated they had never discussed any of those final ratings with an evaluator. During the course of the 2012-‐2013 school year but prior to the fielding of the 2013 First to the Top Survey, changes were made to the teacher evaluation process. Though awareness of changes varied based on what appeared to be whether a teacher was impacted by the specific change, 70 to 80 percent of teachers who were aware of all but one change agreed that it represented an improvement to their evaluation systems. The one item that was not perceived as an improvement to evaluation processes was including special education students’ scores when calculating individual growth measures where only one in four teachers who were aware of the change supported it.

Initial Findings, 2013 First to the Top Survey-‐ 49
V. PERCEPTIONS OF AND ATTITUDES ABOUT THE QUALITY, VALUE, AND EFFECTS OF EDUCATOR EVALUATION Results presented in this section of the report shift focus to teacher and observer perceptions of the quality, value, and effects of the teacher evaluation processes used in their schools. To a large degree, this section represents teacher and administrator appraisals of important characteristics of the teacher evaluation systems now being used in their schools. This research questions investigated in this section of the report reflect five key constructs, including perceptions of fairness and quality, potential negative effects, professional benefits, impacts on teaching and student achievement, and value that respondents attribute to the teacher evaluation systems used in their schools. Results for the specific research questions are presented for all respondents combined and disaggregated results for selected survey items are also reported. Of particular interest in this section of the report are how teachers’ responses vary by their experience levels, evaluation model in use in their schools, their final evaluation ratings from the 2011-‐2012 school year32, and their answers to the question about how they perceived the primary purpose of feedback from observations (question #34). Most research questions involved analyses of multiple survey items. When disaggregated results for the items are similar, only one item is presented in the report. When items analyzed for a research question reveal different disaggregated results, multiple items are discussed to illustrate differences.
Research Question 5.1: To what degree do teachers and observers agree with statements about fairness and quality in the teacher evaluation system used in their schools? Have these ratings changed since last year? Three items from the 2013 First to the Top survey were identified as indicators of fairness and quality in educator evaluation systems: two items that stated the system is fair and a third item related to observer qualifications. Chart 5.1.1 presents a summary of responses from teachers and selected observers reflecting their perceptions of fairness and quality in the teacher evaluation processes used
32Evaluation results from 2012 were matched to spring 2013 survey responses. In some cases where responses across final 2012 evaluation ratings were examined, Consortium researchers limited the sample to respondents where the school for which the 2012 evaluation rating was relevant to the same school in which the respondent was working in 2013. This restriction is referred to as the “same-‐school sample” in the presentation of results and is noted in relevant charts, tables, and discussions.

Initial Findings, 2013 First to the Top Survey-‐ 50
in their schools. The top section of the chart compares responses over time and reveals a fairly large shift in the share of teachers who agreed that the process is fair to them, from 32 percent who selected agree or strongly agree in 2012 to 66 percent who selected the same responses in 2013. The 2013 results also are related to a teacher’s 2012 final evaluation rating – slightly over half of teachers (51 percent) who had received a one or two as a final evaluation score in 2012 strongly disagreed or disagreed with this statement while less than one in three teachers (31 percent) who had received a four or a five expressed disagreement. The next section in the chart reports teacher agreement with a statement that their observers were qualified to evaluation their teaching. More than three-‐fourths of responding teachers agreed with this statement in 2013, which reflects a slight increase compared to responses from 2012. The final two sections of Chart 5.1.1 report teachers’ and selected observers’ overall satisfaction with the teacher evaluation system used in their schools. Just over half of responding teachers agreed or strongly agreed that they were satisfied with the teacher evaluation process in their schools, a meaningful increase over the 30 percent of teachers who agreed with this statement in 2012. Observers were more likely to report overall satisfaction with nearly 80 percent indicating they were satisfied with their evaluation system which reflects an increase of 15 percentage points over 2012 levels of agreement.
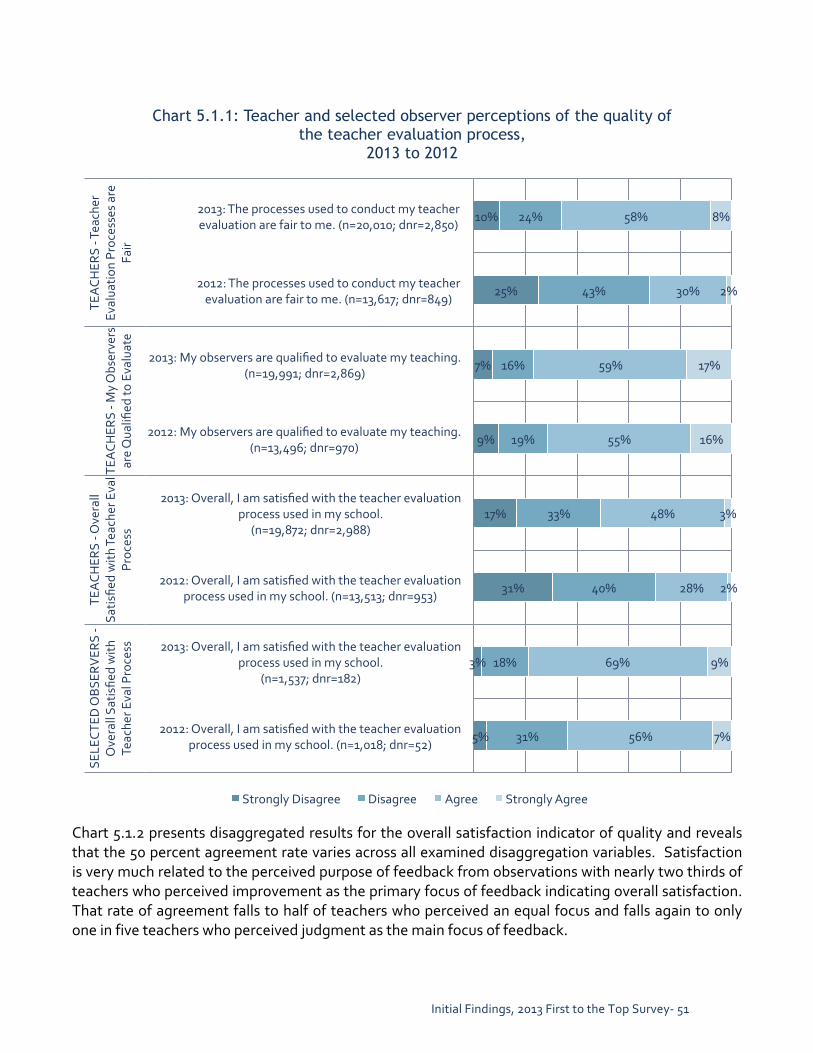
Initial Findings, 2013 First to the Top Survey-‐ 51
Chart 5.1.2 presents disaggregated results for the overall satisfaction indicator of quality and reveals that the 50 percent agreement rate varies across all examined disaggregation variables. Satisfaction is very much related to the perceived purpose of feedback from observations with nearly two thirds of teachers who perceived improvement as the primary focus of feedback indicating overall satisfaction. That rate of agreement falls to half of teachers who perceived an equal focus and falls again to only one in five teachers who perceived judgment as the main focus of feedback.
5%
3%
31%
17%
9%
7%
25%
10%
31%
18%
40%
33%
19%
16%
43%
24%
56%
69%
28%
48%
55%
59%
30%
58%
7%
9%
2%
3%
16%
17%
2%
8%
2012: Overall, I am satisfied with the teacher evaluation process used in my school. (n=1,018; dnr=52)
2013: Overall, I am satisfied with the teacher evaluation process used in my school.
(n=1,537; dnr=182)
2012: Overall, I am satisfied with the teacher evaluation process used in my school. (n=13,513; dnr=953)
2013: Overall, I am satisfied with the teacher evaluation process used in my school.
(n=19,872; dnr=2,988)
2012: My observers are qualified to evaluate my teaching. (n=13,496; dnr=970)
2013: My observers are qualified to evaluate my teaching. (n=19,991; dnr=2,869)
2012: The processes used to conduct my teacher evaluation are fair to me. (n=13,617; dnr=849)
2013: The processes used to conduct my teacher evaluation are fair to me. (n=20,010; dnr=2,850)
SELE
CTED
OBS
ERVER
S -‐
Ove
rall Sa
tisfie
d with
Te
ache
r Eva
l Proce
ss
TEACH
ERS -‐ O
verall
Satis
fied with
Tea
cher Eva
l Proc
ess
TEACH
ERS -‐ M
y Obs
erve
rs
are Qua
lified
to Eva
luate
TEACH
ERS -‐ T
each
er
Evalua
tion Proc
esses are
Fair
Chart 5.1.1: Teacher and selected observer perceptions of the quality of the teacher evaluation process,
2013 to 2012
Strongly Disagree Disagree Agree Strongly Agree

Initial Findings, 2013 First to the Top Survey-‐ 52
Satisfaction also varied in a predictable fashion when conditioned on 2012 final evaluation ratings; teacher agreement with the satisfaction statement declined with each decline in prior year evaluation score. The highest level of satisfaction was held by teachers who had earned a 5, where 56 percent of those teachers agreed they were satisfied with the evaluation system. Only 32 percent of the few teachers who earned a 1 rating in 2012 felt the same way. Differences across evaluation models are substantial. Just under half of teacher in schools using TEAM agreed that they were satisfied with the evaluation process while nearly 70 percent of teachers in schools using the TIGER model indicated they were satisfied. Finally, the level of satisfaction declined as teachers’ years of experience increased. Over 60 percent of novice teachers agreed that they were satisfied with the system while only 46 percent of the most veteran teacher group agreed.
17%
8% 12%
41%
13% 18% 22% 26%
36%
18% 8%
15% 11%
11% 17% 18% 17% 19% 20%
33%
26% 37%
41%
31% 35%
35% 36%
32%
34% 25%
29% 21%
27% 33% 32% 34% 35% 35%
48%
62% 48%
18%
53% 45% 41%
36% 30%
46% 64%
52% 60%
57% 48% 47% 47% 44% 43%
3%
4% 2% 1%
3% 2% 2% 1% 2%
2% 4% 5% 7%
5% 3% 3% 2% 2% 3%
0% 10% 20% 30% 40% 50% 60% 70% 80% 90% 100%
Overall (n=19,872)
Primary Focus of Feedback More Improvement (n=8,990)
Equal (n=5,881) More Judgment (n=4,353)
Final 2012 Evaluation Rating Final Rating = 5 (n=7,191) Final Rating = 4 (n=5,776) Final Rating = 3 (n=3,820) Final Rating = 2 (n=1,232)
Final Rating = 1 (n=53)
Evaluation Model in Use TEAM (n=16,039)
TIGER (n=582) TEM (n=2,265)
COACH (n=986)
Educator Experience 0 to 3 years (n=3,628) 4 to 6 years (n=2,625) 7 to 10 years (n=2,951)
11 to 17 years (n=4,689) 18 to 25 years (n=3,213) Over 26 years (n=2,776)
Chart 5.1.2: Disaggregated results for teachers' level of agreement with the statement Overall I am satisfied with the teacher evaluation process used in
my school. (n=22,860)
Strongly Disagree Disagree Agree Strongly Agree

Initial Findings, 2013 First to the Top Survey-‐ 53
Patterns of results across these disaggregation variables for the other survey items examined as part of the investigation of this research question are very consistent with the results reported in Chart 5.1.2. In other words, perceived fairness and observer qualifications were higher among less experienced teachers, those with higher final ratings, those using alternative teacher evaluation models, and those who perceived that their observation feedback was more focused on improving teaching than making a judgment.
Research Question 5.2: To what degree do teachers and observers agree with statements about potential negative effects resulting from the teacher evaluation process used in their schools? Have these ratings changed since last year? On the opposite side of the quality coin are teacher perceptions concerning potential negative effects resulting from the teacher evaluation process. The survey probed two specific issues related to this topic: whether teachers believed that the teacher evaluation process caused them a lot of stress and whether the practice of teacher observations disrupted their classroom instruction. Chart 5.2.1 reveals that nearly three out of four teachers reported significant stress from the teacher evaluation process in 2013; however, this does represent a decline from 2012 when more than five of six teachers agreed with the statement. In addition, there was a decline in the share of teachers who “Strongly Agreed” with the statement -‐ from 55 percent of respondents in 2012 to 39 percent of respondents in 2013. In summary, three out of four teachers agreed or strongly agreed that the teacher evaluation process causes them a lot of stress and, compared to last year, teachers’ level of agreement with this statement has decreased in overall frequency and strength. The second section in Chart 5.2.1 reveals that only about one in three responding teachers (34 percent) perceived that teaching observations disrupt their classroom instruction. This also reflects a nearly 10 percentage point drop from the 42 percent of teachers who agreed or strongly agreed with this statement last year. This finding suggests that more teachers are becoming acclimated to having observers in their classroom; observers and observation activities are becoming less obtrusive; or both changes may be occurring simultaneously.
8%
8%
3%
4%
49%
58%
13%
22%
28%
24%
28%
35%
14%
10%
55%
39%
2012: Teaching observations disrupt my classroom instruction. (n=13,474; dnr=992)
2013: Teaching observations disrupt my classroom instruction.
2012: The teacher evaluation process causes me a lot of stress. (n=13,613; dnr=853)
2013: The teacher evaluation process causes me a lot of stress.
TEACH
ERS -‐
Disrupts
Instruction
TEACH
ERS -‐
Causes
Stress
Chart 5.2.1: Teacher perceptions of the negative effects of the teacher evaluation process, 2013 to 2012
Strongly Disagree Disagree Agree Strongly Agree
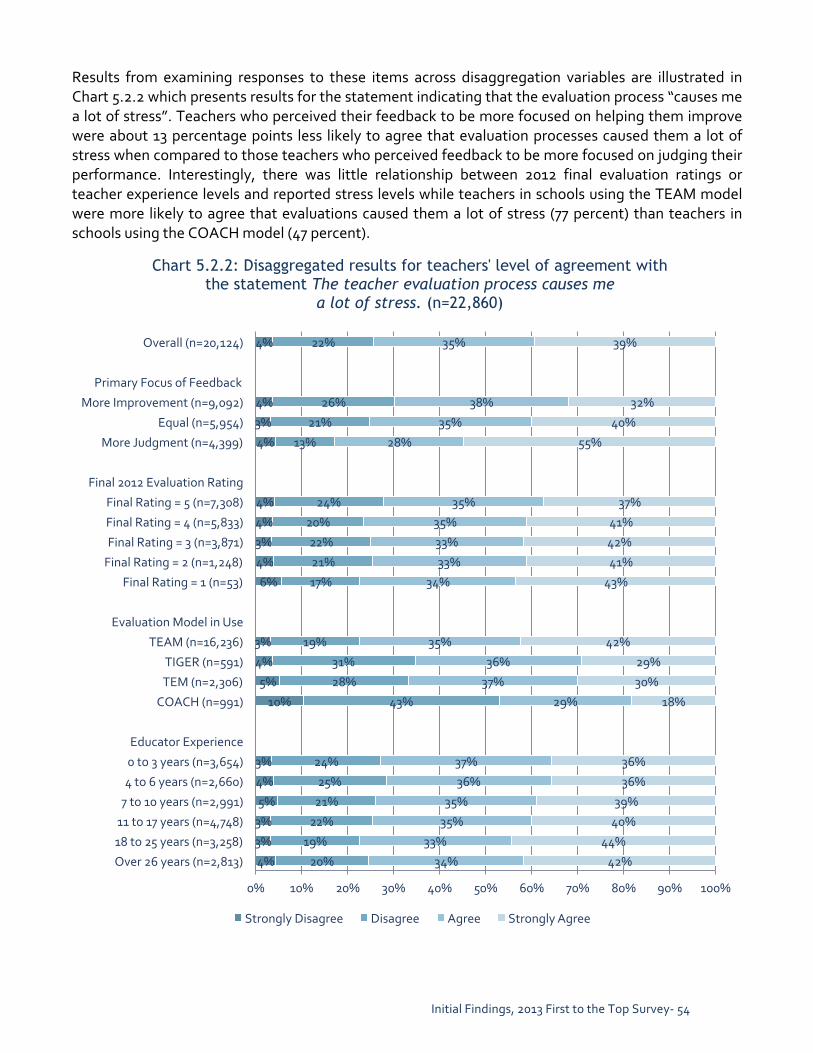
Initial Findings, 2013 First to the Top Survey-‐ 54
Results from examining responses to these items across disaggregation variables are illustrated in Chart 5.2.2 which presents results for the statement indicating that the evaluation process “causes me a lot of stress”. Teachers who perceived their feedback to be more focused on helping them improve were about 13 percentage points less likely to agree that evaluation processes caused them a lot of stress when compared to those teachers who perceived feedback to be more focused on judging their performance. Interestingly, there was little relationship between 2012 final evaluation ratings or teacher experience levels and reported stress levels while teachers in schools using the TEAM model were more likely to agree that evaluations caused them a lot of stress (77 percent) than teachers in schools using the COACH model (47 percent).
4%
4%
3%
4%
4%
4%
3%
4%
6%
3%
4%
5%
10%
3%
4%
5%
3%
3%
4%
22%
26%
21%
13%
24%
20%
22%
21%
17%
19%
31%
28%
43%
24%
25%
21%
22%
19%
20%
35%
38%
35%
28%
35%
35%
33%
33%
34%
35%
36%
37%
29%
37%
36%
35%
35%
33%
34%
39%
32%
40%
55%
37%
41%
42%
41%
43%
42%
29%
30%
18%
36%
36%
39%
40%
44%
42%
0% 10% 20% 30% 40% 50% 60% 70% 80% 90% 100%
Overall (n=20,124)
Primary Focus of Feedback
More Improvement (n=9,092)
Equal (n=5,954)
More Judgment (n=4,399)
Final 2012 Evaluation Rating
Final Rating = 5 (n=7,308)
Final Rating = 4 (n=5,833)
Final Rating = 3 (n=3,871)
Final Rating = 2 (n=1,248)
Final Rating = 1 (n=53)
Evaluation Model in Use
TEAM (n=16,236)
TIGER (n=591)
TEM (n=2,306)
COACH (n=991)
Educator Experience
0 to 3 years (n=3,654)
4 to 6 years (n=2,660)
7 to 10 years (n=2,991)
11 to 17 years (n=4,748)
18 to 25 years (n=3,258)
Over 26 years (n=2,813)
Chart 5.2.2: Disaggregated results for teachers' level of agreement with the statement The teacher evaluation process causes me
a lot of stress. (n=22,860)
Strongly Disagree Disagree Agree Strongly Agree
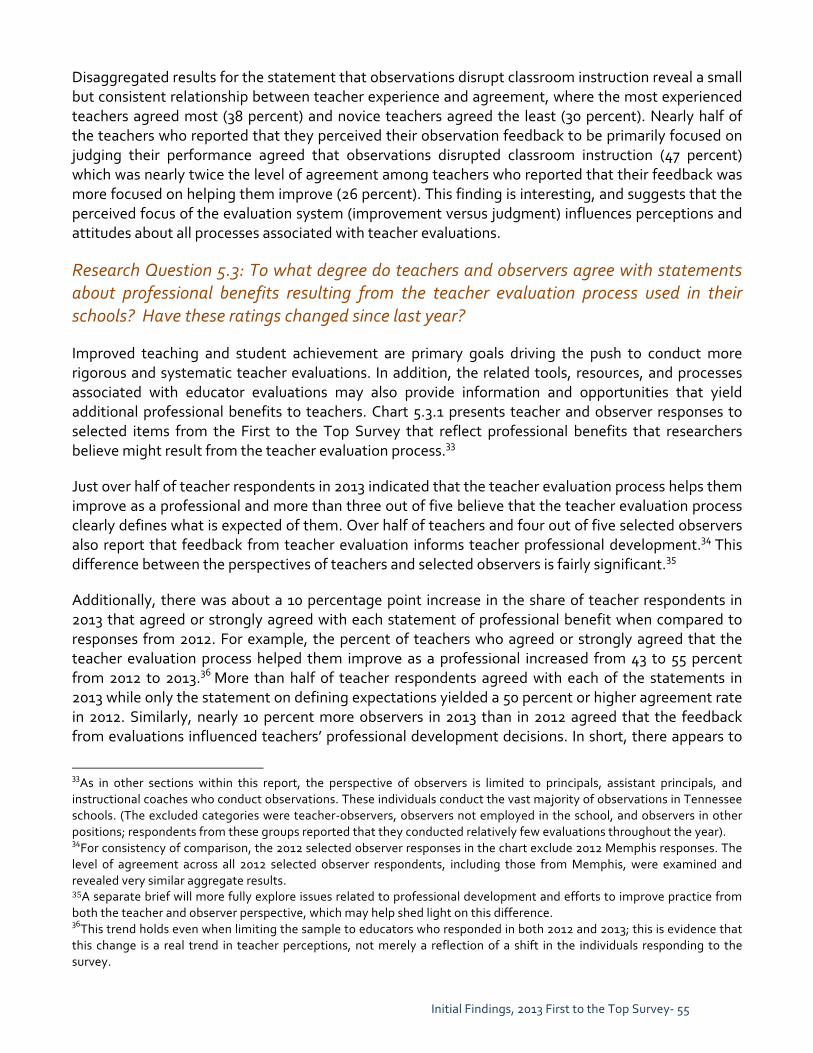
Initial Findings, 2013 First to the Top Survey-‐ 55
Disaggregated results for the statement that observations disrupt classroom instruction reveal a small but consistent relationship between teacher experience and agreement, where the most experienced teachers agreed most (38 percent) and novice teachers agreed the least (30 percent). Nearly half of the teachers who reported that they perceived their observation feedback to be primarily focused on judging their performance agreed that observations disrupted classroom instruction (47 percent) which was nearly twice the level of agreement among teachers who reported that their feedback was more focused on helping them improve (26 percent). This finding is interesting, and suggests that the perceived focus of the evaluation system (improvement versus judgment) influences perceptions and attitudes about all processes associated with teacher evaluations.
Research Question 5.3: To what degree do teachers and observers agree with statements about professional benefits resulting from the teacher evaluation process used in their schools? Have these ratings changed since last year? Improved teaching and student achievement are primary goals driving the push to conduct more rigorous and systematic teacher evaluations. In addition, the related tools, resources, and processes associated with educator evaluations may also provide information and opportunities that yield additional professional benefits to teachers. Chart 5.3.1 presents teacher and observer responses to selected items from the First to the Top Survey that reflect professional benefits that researchers believe might result from the teacher evaluation process.33 Just over half of teacher respondents in 2013 indicated that the teacher evaluation process helps them improve as a professional and more than three out of five believe that the teacher evaluation process clearly defines what is expected of them. Over half of teachers and four out of five selected observers also report that feedback from teacher evaluation informs teacher professional development.34 This difference between the perspectives of teachers and selected observers is fairly significant.35 Additionally, there was about a 10 percentage point increase in the share of teacher respondents in 2013 that agreed or strongly agreed with each statement of professional benefit when compared to responses from 2012. For example, the percent of teachers who agreed or strongly agreed that the teacher evaluation process helped them improve as a professional increased from 43 to 55 percent from 2012 to 2013.36 More than half of teacher respondents agreed with each of the statements in 2013 while only the statement on defining expectations yielded a 50 percent or higher agreement rate in 2012. Similarly, nearly 10 percent more observers in 2013 than in 2012 agreed that the feedback from evaluations influenced teachers’ professional development decisions. In short, there appears to
33As in other sections within this report, the perspective of observers is limited to principals, assistant principals, and instructional coaches who conduct observations. These individuals conduct the vast majority of observations in Tennessee schools. (The excluded categories were teacher-‐observers, observers not employed in the school, and observers in other positions; respondents from these groups reported that they conducted relatively few evaluations throughout the year). 34For consistency of comparison, the 2012 selected observer responses in the chart exclude 2012 Memphis responses. The level of agreement across all 2012 selected observer respondents, including those from Memphis, were examined and revealed very similar aggregate results. 35A separate brief will more fully explore issues related to professional development and efforts to improve practice from both the teacher and observer perspective, which may help shed light on this difference. 36This trend holds even when limiting the sample to educators who responded in both 2012 and 2013; this is evidence that this change is a real trend in teacher perceptions, not merely a reflection of a shift in the individuals responding to the survey.

Initial Findings, 2013 First to the Top Survey-‐ 56
be an increase in perceived professional benefits from the new teacher evaluation processes both among teachers and observers.
Chart 5.3.2 presents disaggregated results for teachers’ level of agreement with the statement indicating that the evaluation process “helps me improve as a professional”. Not surprisingly, teachers who perceived that their feedback was more focused on making improvements agreed or strongly agreed with the statement nearly three times as often as teachers who perceived the primary purpose of feedback to be judgment. Agreement with this statement also varied by evaluation model in use in the school; 67 percent of teachers in both TIGER and COACH districts agreed or strongly agreed that the teacher evaluation process helps them improve as professionals; in contrast, the agreement level was 53 percent for teachers in schools using the TEAM model. The 2012 final evaluation ratings earned by responding teachers do not appear to be related to teachers’ agreement with this statement about
14%
10%
12%
8%
19%
11%
24%
16%
44%
36%
35%
30%
38%
34%
66%
74%
39%
49%
49%
56%
39%
51%
8%
9%
3%
5%
5%
6%
4%
4%
2012: Feedback to individual teachers based on their evaluations influences the professional development in
which they participate. (n=20,005; dnr=2,845)
2013: Feedback to individual teachers based on their evaluations influences the professional development in
which they participate. (n=20,005; dnr=2,845)
2012: Feedback from my teacher evaluation informs the professional development activities in which I participate.
(n=13,343; dnr=1,123)
2013: Feedback from my teacher evaluation informs the professional development activities in which I participate.
(n=19,994; dnr=2,866)
2012: The teacher evaluation process clearly defines what is expected of me. (n=13,601; dnr=865)
2013: The teacher evaluation process clearly defines what is expected of me.
(n=20,005; dnr=2,845)
2012: The teacher evaluation process helps me improve as a professional. (n=13,544; dnr=922)
2013: The teacher evaluation process helps me improve as a professional.
(n=19,910; dnr=2,950)
SELE
CTED
OBS
ERVER
S -‐ Informs My Te
ache
rs'
PD
TEACH
ERS -‐ Informs
My Prof Dev
TEACH
ERS -‐ C
learly
Defi
nes
Wha
t is Ex
pected
TE
ACH
ERS -‐ Improv
e as
Profession
al
Chart 5.3.1: Teacher and selected observer perceptions of the benefits of the teacher evaluation process, 2013 to 2012
Strongly Disagree Disagree Agree Strongly Agree

Initial Findings, 2013 First to the Top Survey-‐ 57
professional improvement. The relationship with experience evident in the chart indicates that teachers with more experience were less likely to report that the evaluation system helped them improve as professionals. The relationships presented in Chart 5.3.2 are fairly consistent across the other items related to professional benefits from the teacher evaluation process. The reported influence on professional development was lowest among teachers in schools using TEAM (51 percent agreed versus 60 to 70 percent in the other models) and just slightly higher for novice teachers and teachers who received a low 2012 final evaluation rating. Disaggregated results for the statement indicating that the evaluation system “clearly defines what is expected of me” vary systematically with 2012 final evaluation ratings teachers who received higher ratings were more likely to agree with the statement. This is the only item in this group of statements where the relationship between final evaluation rating and perceived benefit was so consistent. It is unclear if those teachers who receive higher ratings did so because the evaluation system provides information to help them know how to be good teachers or if the higher ratings signal to responding teachers that the system simply recognizes the good practices they employ. The lower agreement by teachers who receive lower ratings suggests that the latter interpretation is more appropriate at this stage of system implementation.

Initial Findings, 2013 First to the Top Survey-‐ 58
11%
5%
8%
28%
10%
12%
13%
14%
12%
12%
6%
9%
9%
6%
11%
11%
11%
13%
15%
34%
25%
37%
47%
34%
35%
37%
33%
37%
36%
28%
28%
24%
24%
33%
35%
36%
37%
39%
51%
63%
52%
24%
51%
50%
47%
49%
48%
49%
61%
56%
60%
62%
51%
51%
49%
46%
43%
4%
7%
3%
1%
5%
3%
3%
4%
4%
4%
6%
7%
7%
7%
5%
3%
4%
3%
3%
0% 10% 20% 30% 40% 50% 60% 70% 80% 90% 100%
Overall (n=19,910)
Primary Focus of Feedback
More Improvement (n=8,996)
Equal (n=5,887)
More Judgment (n=4,368)
Final 2012 Evaluation Rating
Final Rating = 5 (n=7,244)
Final Rating = 4 (n=5,762)
Final Rating = 3 (n=3,824)
Final Rating = 2 (n=1,231)
Final Rating = 1 (n=52)
Evaluation Model in Use
TEAM (n=16,065)
TIGER (n=585)
TEM (n=2,278)
COACH (n=982)
Educator Experience
0 to 3 years (n=3,625)
4 to 6 years (n=2,636)
7 to 10 years (n=2,962)
11 to 17 years (n=4,693)
18 to 25 years (n=3,227)
Over 26 years (n=2,767)
Chart 5.3.2: Disaggregated results for teachers' level of agreement with the statement The teacher evaluation process helps me improve as a
professional. (n=22,860)
Strongly Disagree Disagree Agree Strongly Agree

Initial Findings, 2013 First to the Top Survey-‐ 59
Research Question 5.4: To what degree do teachers and observers agree with statements about improved teaching and learning outcomes resulting from the teacher evaluation process used in their schools? Have these ratings changed since last year? The ultimate outcomes sought from reformed educator evaluation systems are improved teaching and student learning. Teachers responded to statements about evaluation-‐based improvements to their own teaching and their students’ achievement and statements about evaluation-‐based improvements to teaching and student achievement in their schools. These complementary items allowed investigating whether teachers perceived more potential teaching and learning benefits for their colleagues than themselves. Results from these statements and equivalent statements from the 2012 version of the survey are presented in Chart 5.4.1. The first section of Chart 5.4.1 presents agreement with statements about teacher evaluations leading to improved teaching. The first finding is that teachers agreed with statements about evaluation leading to improvements to their own teaching (56 percent) as much as they agreed with the statement about improvements to teaching in their schools (53 percent.) The second finding indicates that the share of teachers agreeing that teacher evaluations will improve their teaching increased from 38 percent in 2012 to 56 percent in 2013. The very low share of teacher respondents who strongly agree with these statements is also noteworthy; less than 5 percent of teachers selected the strongly agree option for any of these statements.
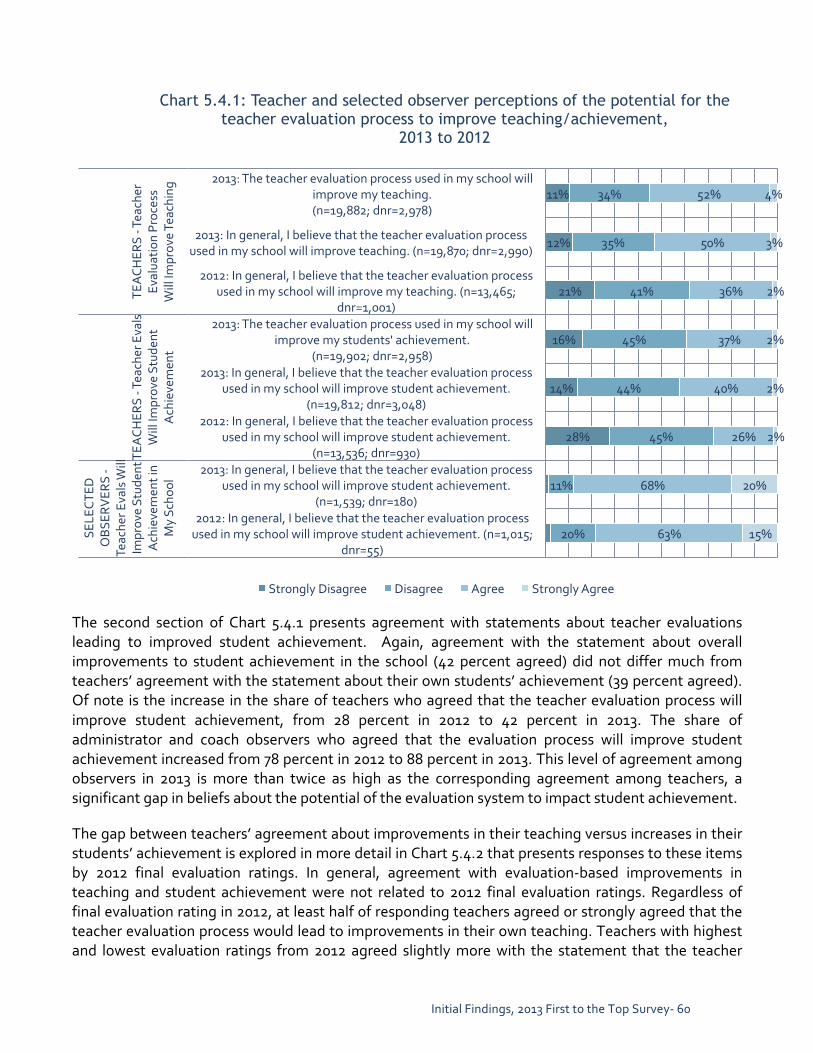
Initial Findings, 2013 First to the Top Survey-‐ 60
The second section of Chart 5.4.1 presents agreement with statements about teacher evaluations leading to improved student achievement. Again, agreement with the statement about overall improvements to student achievement in the school (42 percent agreed) did not differ much from teachers’ agreement with the statement about their own students’ achievement (39 percent agreed). Of note is the increase in the share of teachers who agreed that the teacher evaluation process will improve student achievement, from 28 percent in 2012 to 42 percent in 2013. The share of administrator and coach observers who agreed that the evaluation process will improve student achievement increased from 78 percent in 2012 to 88 percent in 2013. This level of agreement among observers in 2013 is more than twice as high as the corresponding agreement among teachers, a significant gap in beliefs about the potential of the evaluation system to impact student achievement. The gap between teachers’ agreement about improvements in their teaching versus increases in their students’ achievement is explored in more detail in Chart 5.4.2 that presents responses to these items by 2012 final evaluation ratings. In general, agreement with evaluation-‐based improvements in teaching and student achievement were not related to 2012 final evaluation ratings. Regardless of final evaluation rating in 2012, at least half of responding teachers agreed or strongly agreed that the teacher evaluation process would lead to improvements in their own teaching. Teachers with highest and lowest evaluation ratings from 2012 agreed slightly more with the statement that the teacher
28%
14%
16%
21%
12%
11%
20%
11%
45%
44%
45%
41%
35%
34%
63%
68%
26%
40%
37%
36%
50%
52%
15%
20%
2%
2%
2%
2%
3%
4%
2012: In general, I believe that the teacher evaluation process used in my school will improve student achievement. (n=1,015;
dnr=55)
2013: In general, I believe that the teacher evaluation process used in my school will improve student achievement.
(n=1,539; dnr=180)
2012: In general, I believe that the teacher evaluation process used in my school will improve student achievement.
(n=13,536; dnr=930)
2013: In general, I believe that the teacher evaluation process used in my school will improve student achievement.
(n=19,812; dnr=3,048)
2013: The teacher evaluation process used in my school will improve my students' achievement.
(n=19,902; dnr=2,958)
2012: In general, I believe that the teacher evaluation process used in my school will improve my teaching. (n=13,465;
dnr=1,001)
2013: In general, I believe that the teacher evaluation process used in my school will improve teaching. (n=19,870; dnr=2,990)
2013: The teacher evaluation process used in my school will improve my teaching. (n=19,882; dnr=2,978)
SELE
CTED
OBS
ERVER
S -‐
Teac
her E
vals W
ill
Improv
e Stud
ent
Ach
ieve
men
t in
My Sc
hool
TEACH
ERS -‐ T
each
er Eva
ls
Will Im
prov
e Stud
ent
Ach
ieve
men
t
TEACH
ERS -‐ T
each
er
Evalua
tion Proc
ess
Will Im
prov
e Te
aching
Chart 5.4.1: Teacher and selected observer perceptions of the potential for the teacher evaluation process to improve teaching/achievement,
2013 to 2012
Strongly Disagree Disagree Agree Strongly Agree

Initial Findings, 2013 First to the Top Survey-‐ 61
evaluation process would improve their students’ achievement, however, only about 40 percent of teachers in those groups agreed with this outcome.
Charts 5.4.3 and 5.4.4 present other disaggregated results for these outcome statements. As one might expect, Chart 5.4.3 shows that less experienced teachers were more likely to agree that teacher evaluation could improve their teaching more than more experienced teachers. Teachers in schools using the TEAM model were the least likely to agree (53 percent) while those in schools using the COACH or TIGER models were the most likely to agree (66 and 68 percent, respectively). The largest differences are observed when teachers were grouped based on their responses to question #34; more than 70 percent of the teachers who perceived that their feedback was focused on improvement agreed that the system will improve their teaching. Only 24 percent of teachers who perceived the primary focus of their feedback to be judgment of performance agreed that the system will improve their teaching.
14%
14%
13%
12%
10%
20%
19%
20%
17%
14%
30%
35%
37%
35%
35%
37%
48%
46%
46%
45%
51%
49%
47%
50%
52%
39%
32%
33%
35%
38%
5%
2%
3%
3%
4%
5%
1%
2%
2%
2%
0% 10% 20% 30% 40% 50% 60% 70% 80% 90% 100%
Final 2012 Eval Rating = 1 (n=43)
Final 2012 Eval Rating = 2 (n=1,116)
Final 2012 Eval Rating = 3 (n=3,518)
Final 2012 Eval Rating = 4 (n=5,310)
Final 2012 Eval Rating = 5 (n=6,732)
Final 2012 Eval Rating = 1 (n=41)
Final 2012 Eval Rating = 2 (n=1,117)
Final 2012 Eval Rating = 3 (n=3,523)
Final 2012 Eval Rating = 4 (n=5,324)
Final 2012 Eval Rating = 5 (n=6,738)
The teac
her e
valuation proc
ess will
improv
e my teac
hing
.
The teac
her e
valuation
proc
ess will im
prov
e my
stud
ents' ach
ieve
men
t.
Chart 5.4.2: Teacher agreement with statements about improved teaching and student achievement by 2012 final evaluation rating
Strongly Disagree Disagree Agree Strongly Agree

Initial Findings, 2013 First to the Top Survey-‐ 62
11%
4%
7%
27%
11%
4%
9%
8%
7%
10%
11%
11%
13%
13%
34%
24%
38%
49%
36%
28%
27%
26%
23%
34%
35%
36%
38%
40%
52%
66%
53%
23%
50%
64%
57%
60%
64%
52%
51%
50%
47%
44%
4%
6%
2%
1%
3%
4%
7%
6%
6%
4%
3%
3%
3%
3%
0% 10% 20% 30% 40% 50% 60% 70% 80% 90% 100%
Overall (n=19,882)
Primary Focus of Feedback
More Improvement (n=8,995)
Equal (n=5,896)
More Judgment (n=4,348)
Evaluation Model in Use
TEAM (n=16,043)
TIGER (n=582)
TEM (n=2,275)
COACH (n=982)
Educator Experience
0 to 3 years (n=3,630)
4 to 6 years (n=2,628)
7 to 10 years (n=2,949)
11 to 17 years (n=4,684)
18 to 25 years (n=3,214)
Over 26 years (n=2,777)
Chart 5.4.3: Disaggregated results for teachers' level of agreement with the statement The teacher evaluation process used in my school will improve
my teaching. (n=22,860)
Strongly Disagree Disagree Agree Strongly Agree

Initial Findings, 2013 First to the Top Survey-‐ 63
Chart 5.4.4 presents disaggregated results for the statement indicating that “the teacher evaluation process … will improve my students’ achievement.” The patterns of responses are nearly identical to patterns observed in Chart 5.4.3, which focuses on the perception that teaching will improve; however, the level of agreement is approximately 15 to 20 percentage points lower for all groups on Chart 5.4.4 than in the prior chart. Less than half of the teachers in schools using the TEAM model agreed with the statement (37 percent) while just more than half the teachers using the COACH or TIGER models agreed that evaluation would improve their students’ achievement. Just over half of the teachers who perceived their observation feedback to be primarily focused on improvement agreed that the teacher evaluation process would improve their students’ achievement, significantly less than the 72 percent who agreed that the process would improve their teaching. Conversely, only 16 percent
16%
9%
13%
35%
17%
9%
13%
12%
11%
16%
16%
16%
18%
18%
45%
39%
49%
50%
46%
39%
39%
36%
37%
44%
45%
47%
47%
48%
37%
48%
36%
15%
35%
50%
43%
48%
47%
37%
36%
35%
32%
32%
2%
4%
2%
0%
2%
3%
5%
4%
4%
3%
2%
2%
2%
2%
0% 10% 20% 30% 40% 50% 60% 70% 80% 90% 100%
Overall (n=19,902)
Primary Focus of Feedback
More Improvement (n=9,015)
Equal (n=5.880)
More Judgment (n=4,360)
Evaluation Model in Use
TEAM (n=16,054)
TIGER (n=587)
TEM (n=2,278)
COACH (n=983)
Educator Experience
0 to 3 years (n=3,622)
4 to 6 years (n=2,638)
7 to 10 years (n=2,964)
11 to 17 years (n=4,693)
18 to 25 years (n=3,212)
Over 26 years (n=2,773)
Chart 5.4.4: Disaggregated results for teachers' level of agreement with the statement The teacher evaluation process used in my school will improve
my students’ achievement. (n=22,860)
Strongly Disagree Disagree Agree Strongly Agree
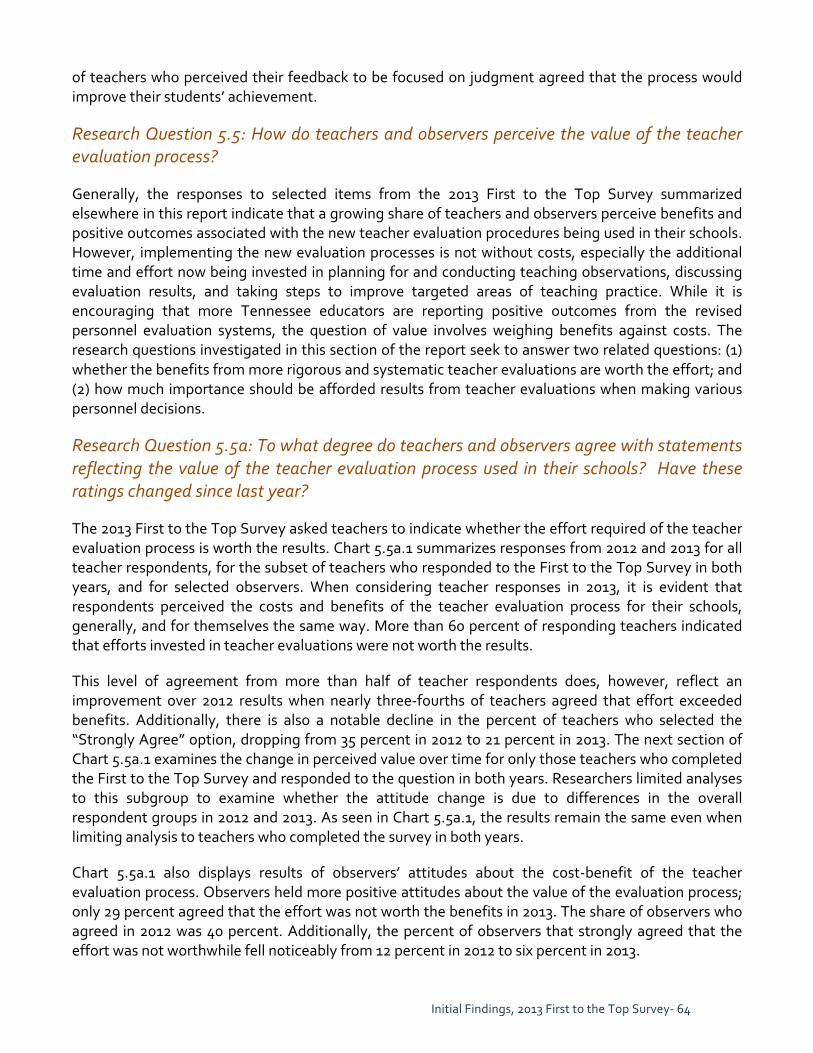
Initial Findings, 2013 First to the Top Survey-‐ 64
of teachers who perceived their feedback to be focused on judgment agreed that the process would improve their students’ achievement.
Research Question 5.5: How do teachers and observers perceive the value of the teacher evaluation process? Generally, the responses to selected items from the 2013 First to the Top Survey summarized elsewhere in this report indicate that a growing share of teachers and observers perceive benefits and positive outcomes associated with the new teacher evaluation procedures being used in their schools. However, implementing the new evaluation processes is not without costs, especially the additional time and effort now being invested in planning for and conducting teaching observations, discussing evaluation results, and taking steps to improve targeted areas of teaching practice. While it is encouraging that more Tennessee educators are reporting positive outcomes from the revised personnel evaluation systems, the question of value involves weighing benefits against costs. The research questions investigated in this section of the report seek to answer two related questions: (1) whether the benefits from more rigorous and systematic teacher evaluations are worth the effort; and (2) how much importance should be afforded results from teacher evaluations when making various personnel decisions.
Research Question 5.5a: To what degree do teachers and observers agree with statements reflecting the value of the teacher evaluation process used in their schools? Have these ratings changed since last year? The 2013 First to the Top Survey asked teachers to indicate whether the effort required of the teacher evaluation process is worth the results. Chart 5.5a.1 summarizes responses from 2012 and 2013 for all teacher respondents, for the subset of teachers who responded to the First to the Top Survey in both years, and for selected observers. When considering teacher responses in 2013, it is evident that respondents perceived the costs and benefits of the teacher evaluation process for their schools, generally, and for themselves the same way. More than 60 percent of responding teachers indicated that efforts invested in teacher evaluations were not worth the results. This level of agreement from more than half of teacher respondents does, however, reflect an improvement over 2012 results when nearly three-‐fourths of teachers agreed that effort exceeded benefits. Additionally, there is also a notable decline in the percent of teachers who selected the “Strongly Agree” option, dropping from 35 percent in 2012 to 21 percent in 2013. The next section of Chart 5.5a.1 examines the change in perceived value over time for only those teachers who completed the First to the Top Survey and responded to the question in both years. Researchers limited analyses to this subgroup to examine whether the attitude change is due to differences in the overall respondent groups in 2012 and 2013. As seen in Chart 5.5a.1, the results remain the same even when limiting analysis to teachers who completed the survey in both years. Chart 5.5a.1 also displays results of observers’ attitudes about the cost-‐benefit of the teacher evaluation process. Observers held more positive attitudes about the value of the evaluation process; only 29 percent agreed that the effort was not worth the benefits in 2013. The share of observers who agreed in 2012 was 40 percent. Additionally, the percent of observers that strongly agreed that the effort was not worthwhile fell noticeably from 12 percent in 2012 to six percent in 2013.
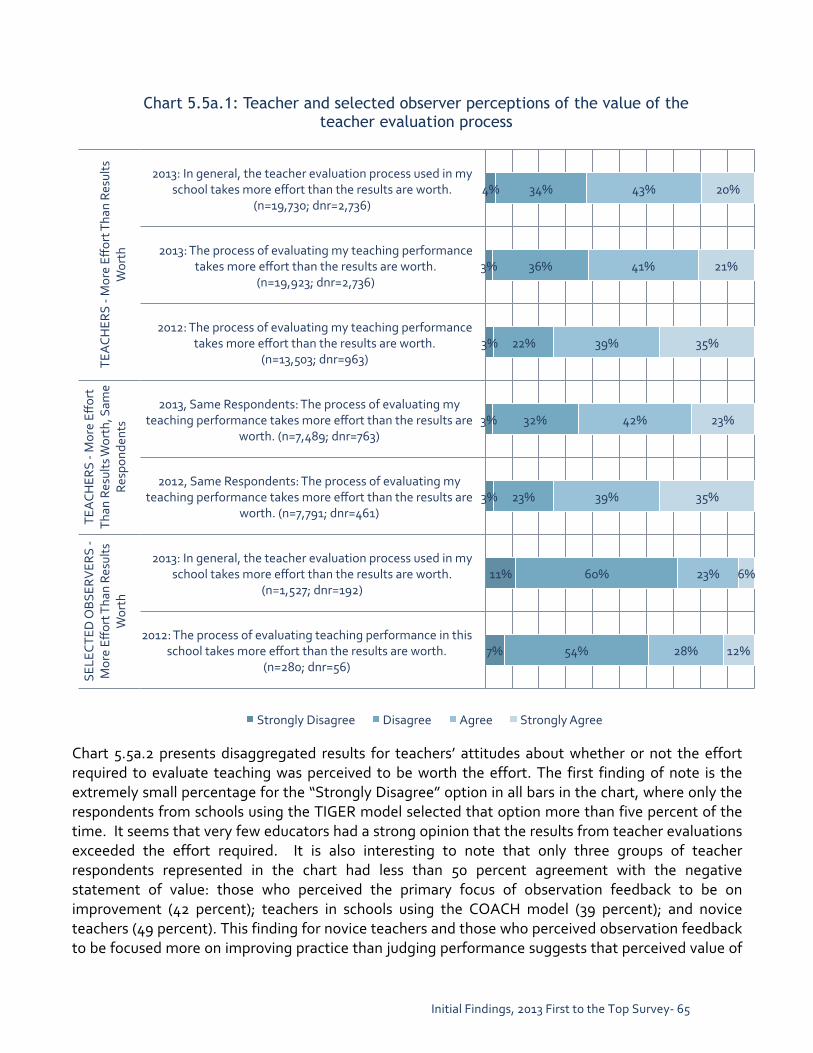
Initial Findings, 2013 First to the Top Survey-‐ 65
Chart 5.5a.2 presents disaggregated results for teachers’ attitudes about whether or not the effort required to evaluate teaching was perceived to be worth the effort. The first finding of note is the extremely small percentage for the “Strongly Disagree” option in all bars in the chart, where only the respondents from schools using the TIGER model selected that option more than five percent of the time. It seems that very few educators had a strong opinion that the results from teacher evaluations exceeded the effort required. It is also interesting to note that only three groups of teacher respondents represented in the chart had less than 50 percent agreement with the negative statement of value: those who perceived the primary focus of observation feedback to be on improvement (42 percent); teachers in schools using the COACH model (39 percent); and novice teachers (49 percent). This finding for novice teachers and those who perceived observation feedback to be focused more on improving practice than judging performance suggests that perceived value of
7%
11%
3%
3%
3%
3%
4%
54%
60%
23%
32%
22%
36%
34%
28%
23%
39%
42%
39%
41%
43%
12%
6%
35%
23%
35%
21%
20%
2012: The process of evaluating teaching performance in this school takes more effort than the results are worth.
(n=280; dnr=56)
2013: In general, the teacher evaluation process used in my school takes more effort than the results are worth.
(n=1,527; dnr=192)
2012, Same Respondents: The process of evaluating my teaching performance takes more effort than the results are
worth. (n=7,791; dnr=461)
2013, Same Respondents: The process of evaluating my teaching performance takes more effort than the results are
worth. (n=7,489; dnr=763)
2012: The process of evaluating my teaching performance takes more effort than the results are worth.
(n=13,503; dnr=963)
2013: The process of evaluating my teaching performance takes more effort than the results are worth.
(n=19,923; dnr=2,736)
2013: In general, the teacher evaluation process used in my school takes more effort than the results are worth.
(n=19,730; dnr=2,736)
SELE
CTED
OBS
ERVER
S -‐
More Eff
ort T
han Re
sults
Worth
TEACH
ERS -‐ M
ore Eff
ort
Than
Results W
orth, S
ame
Resp
onde
nts
TEACH
ERS -‐ M
ore Eff
ort T
han Re
sults
Worth
Chart 5.5a.1: Teacher and selected observer perceptions of the value of the teacher evaluation process
Strongly Disagree Disagree Agree Strongly Agree

Initial Findings, 2013 First to the Top Survey-‐ 66
teacher evaluations is related to how much teachers believe the system is designed to help them. The finding for the teachers in schools using the COACH model suggests that either the model requires less effort or that the system is more geared to improvement. Results presented in Section 3 in Chart 3.4.1 indicate that teachers in schools using COACH are no more likely to perceive their observation feedback as focused on improvement, which is noteworthy as COACH utilizes a far different model than the three other models. This hypothesis is supported in Section 4 where a large share of teachers in schools using the COACH model reported spending no time preparing for (mostly unannounced) teaching observations.
Comparisons within the various strata also are interesting. The perceived purpose of observation
feedback is an important predictor of perceived value of the evaluation system with nearly 80 percent of teachers who perceive observation feedback as primarily judgment focused agreeing that the results are not worth the effort while less than half of teachers who perceive feedback as primarily improvement focused agreed. There was little variation across 2012 final evaluation ratings, with only the small group who received the lowest rating deviating much from the overall 60 percent agreement
3%
3% 2% 3%
3% 3% 3% 3% 4%
2% 3% 4% 7%
3% 2% 3% 3% 2% 3%
36%
45% 35%
19%
37% 33% 33% 31%
44%
33% 47%
41% 53%
48% 38% 36% 33%
30% 28%
41%
38% 43%
42%
41% 41% 41% 46%
33%
41% 37%
41% 31%
35% 41%
40% 43%
42% 43%
21%
14% 19%
37%
20% 23% 23% 20% 19%
23% 13% 14%
8%
14% 19% 21% 21%
26% 26%
0% 10% 20% 30% 40% 50% 60% 70% 80% 90% 100%
Overall (n=19,923)
Primary Focus of Feedback More Improvement (n=8,994)
Equal (n=5,900) More Judgment (n=4,371)
Final 2012 Evaluation Rating Final Rating = 5 (n=7,228) Final Rating = 4 (n=5,781) Final Rating = 3 (n=3,835) Final Rating = 2 (n=1,228)
Final Rating = 1 (n=52)
Evaluation Model in Use TEAM (n=16,083)
TIGER (n=589) TEM (n=2,271)
COACH (n=980)
Educator Experience 0 to 3 years (n=3,626) 4 to 6 years (n=2,627)
7 to 10 years (n=2,968) 11 to 17 years(n=4,701) 18 to 25 years (n=3,216) Over 26 years (n=2,785)
Chart 5.5a.2: Disaggregated results for teachers' level of agreement with the statement The process of evaluating my teaching performance takes more
effort than the results are worth. (n=22,860)
Strongly Disagree Disagree Agree Strongly Agree

Initial Findings, 2013 First to the Top Survey-‐ 67
rate (52 percent agreed). As noted in other presentations of disaggregated results, teachers in schools using the TEAM model tended to be more negative about the teacher evaluation process than teachers in schools using one of the alternative models. The share of teachers in schools using TEAM who selected the Agree or Strongly Agree option (64 percent) was 9 percentage points higher than teachers from Memphis (the TEM model) and 25 percentage points higher than teachers in schools using the COACH model. Finally, the pattern for teacher experience is interesting in its linearity. The share of teachers who agreed with the negative value statement increased at each experience level, from 49 percent for novice teachers to 69 percent for those teachers with more than 25 years of experience.
Research Question 5.5b: To what degree do teachers and selected observers support utilizing results from the teacher evaluation process to inform teacher personnel decisions, and how has this level of support changed from 2012? The survey also asked respondents how much importance should be afforded teacher effectiveness ratings when making major personnel decisions. While this is not a direct measure of “value,” the importance that educators are willing to place on high stakes uses of effectiveness ratings is an indicator of how broadly and how relevant results from teacher evaluations might become in educational decisions. Results for teacher respondents and selected observers from both the 2012 and 2013 First to the Top Surveys are presented in Chart 5.5b.1.
4% 6%
1% 1%
25% 26%
18% 19%
14% 18%
6% 7%
10% 15%
2% 3%
12% 13%
6%
28% 28%
35% 31%
23% 26%
17% 19%
23% 25%
8% 11%
52% 48%
42% 39%
33% 31%
34% 36%
46% 40%
54% 52%
47% 42%
47% 46%
33% 33%
53% 55%
15% 15%
13% 14%
17% 16%
23% 22%
19% 18%
44% 39%
0% 10% 20% 30% 40% 50% 60% 70% 80% 90% 100%
Teachers, 2013 (n=22,141; dnr=719) Teachers, 2012 (n=13,603; dnr=863)
Observers, 2013 (n=1,542; dnr=177) Observers, 2012 (n=1,045; dnr=50)
Teachers, 2013 (n=17,979; dnr=4,881) Teachers, 2012 (n=13,571; dnr=895)
Observers, 2013 (n=1,536; dnr=183) Observers, 2012 (n=1,040; dnr=55)
Teachers, 2013 (n=20,151; dnr=2,709) Teachers, 2012 (n=13,474; dnr=992)
Observers, 2013 (n=1,529; dnr=190) Observers, 2012 (n=1,039; dnr=56)
Teachers, 2013 (n=20,792; dnr=2,068) Teachers, 2012 (n=13,528; dnr=938)
Observers, 2013 (n=1,542; dnr=177) Observers, 2012 (n=1,039; dnr=56)
. . . Profession
al
deve
lopm
ent for
teac
hers?
. . . Te
ache
r co
mpe
nsation?
. . . Te
ache
r ad
vanc
emen
t . . . Te
ache
r retention?
Chart 5.5b.1: Level of importance teachers and selected observers would place on teacher effectiveness ratings for specified personnel decisions
No Importance Low Importance Moderate Importance High Importance
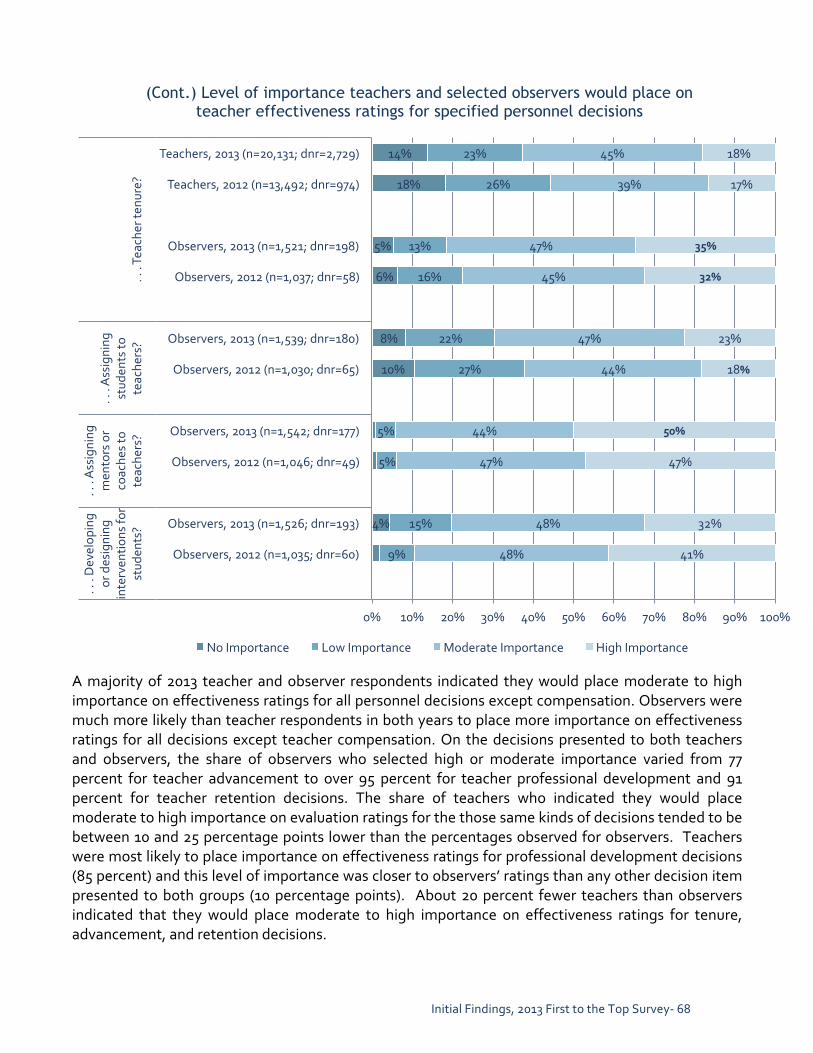
Initial Findings, 2013 First to the Top Survey-‐ 68
A majority of 2013 teacher and observer respondents indicated they would place moderate to high importance on effectiveness ratings for all personnel decisions except compensation. Observers were much more likely than teacher respondents in both years to place more importance on effectiveness ratings for all decisions except teacher compensation. On the decisions presented to both teachers and observers, the share of observers who selected high or moderate importance varied from 77 percent for teacher advancement to over 95 percent for teacher professional development and 91 percent for teacher retention decisions. The share of teachers who indicated they would place moderate to high importance on evaluation ratings for the those same kinds of decisions tended to be between 10 and 25 percentage points lower than the percentages observed for observers. Teachers were most likely to place importance on effectiveness ratings for professional development decisions (85 percent) and this level of importance was closer to observers’ ratings than any other decision item presented to both groups (10 percentage points). About 20 percent fewer teachers than observers indicated that they would place moderate to high importance on effectiveness ratings for tenure, advancement, and retention decisions.
14%
18%
5%
6%
8%
10%
4%
23%
26%
13%
16%
22%
27%
5%
5%
15%
9%
45%
39%
47%
45%
47%
44%
44%
47%
48%
48%
18%
17%
35%
32%
23%
18%
50%
47%
32%
41%
0% 10% 20% 30% 40% 50% 60% 70% 80% 90% 100%
Teachers, 2013 (n=20,131; dnr=2,729)
Teachers, 2012 (n=13,492; dnr=974)
Observers, 2013 (n=1,521; dnr=198)
Observers, 2012 (n=1,037; dnr=58)
Observers, 2013 (n=1,539; dnr=180)
Observers, 2012 (n=1,030; dnr=65)
Observers, 2013 (n=1,542; dnr=177)
Observers, 2012 (n=1,046; dnr=49)
Observers, 2013 (n=1,526; dnr=193)
Observers, 2012 (n=1,035; dnr=60)
. . . Te
ache
r ten
ure?
. . . Assigning
stud
ents to
teac
hers?
. . . Assigning
men
tors or
coac
hes to
teac
hers?
. . . Dev
elop
ing
or designing
interven
tions
for
stud
ents?
(Cont.) Level of importance teachers and selected observers would place on teacher effectiveness ratings for specified personnel decisions
No Importance Low Importance Moderate Importance High Importance

Initial Findings, 2013 First to the Top Survey-‐ 69
Just under 50 percent of observers responding to the survey in 2013 selected high or moderate importance for using effectiveness ratings for teacher compensation decisions (which reflects a small decline compared to 2012 results) while nearly the same share of 2013 teacher respondents (48 percent which reflects a very small increase) would place moderate or high importance on effectiveness ratings for compensation decisions. Additional analyses indicate that teacher respondents from schools involved in strategic compensation reforms were 9 percentage points less likely to indicate that effectiveness ratings should have No Importance in compensation decisions and 10 percentage points more likely to indicate that the ratings should have moderate importance in decisions about teacher pay than teacher respondents from other schools. Observers were presented with three additional kinds of decisions that might be informed by effectiveness ratings. Nearly all observers believe effectiveness ratings can help inform assigning mentors or coaches to teachers and designing interventions for students while about seven in ten observer respondents would place moderate to high importance on evaluation results when assigning students to teachers. Changes in response patterns between 2012 and 2013 were relatively small for both teacher and observer respondents. In general, teachers were a few percentage points more likely in 2013 to indicate they would place moderate to high importance on effectiveness ratings for all listed personnel decisions when compared to responses in 2012. Increases for observers were about the same magnitude, with moderate to high importance for teacher compensation actually declining a few percentage points from 2012 levels. Chart 5.5b.2 presents disaggregated results for teacher responses to the item focused on teacher professional development and Chart 5.5b3 presents disaggregated results for teacher responses to the item on teacher retention. Two disaggregated charts are presented for this research question because of the qualitative difference in the kind of decision implicated by the two statements: professional development is (1) focused on teaching improvement while teacher retention decisions reflect much higher stakes and is (2) more focused on judgment than improvement.

Initial Findings, 2013 First to the Top Survey-‐ 70
4%
3%
3%
7%
4%
4%
4%
4%
8%
4%
2%
3%
3%
3%
3%
4%
4%
4%
4%
12%
10%
12%
16%
11%
12%
13%
12%
8%
12%
8%
9%
9%
10%
12%
11%
12%
12%
13%
52%
51%
55%
50%
51%
52%
52%
51%
54%
53%
51%
49%
49%
53%
51%
53%
51%
53%
51%
33%
36%
31%
28%
34%
32%
31%
33%
31%
31%
39%
39%
38%
34%
34%
32%
33%
31%
32%
Overall (n=22,141)
Primary Focus of Feedback
More Improvement (n=9,419)
Equal (n=6,138)
More Judgment (n=4,321)
Final 2012 Evaluation Rating
Final Rating = 5 (n=8,077)
Final Rating = 4 (n=6,383)
Final Rating = 3 (n=4,201)
Final Rating = 2 (n=1,345)
Final Rating = 1 (n=58)
Evaluation Model in Use
TEAM (n=17,748)
TIGER (n=611)
TEM (n=2,536)
COACH (n=1,196)
Educator Experience
0 to 3 years (n=4,070)
4 to 6 years (n=2,920)
7 to 10 years (n=3,283)
11 to 17 years (n=5,205)
18 to 25 years (n=3,540)
Over 26 years (n=3,123)
Chart 5.5b.2: Level of importance teachers would place on effectiveness ratings for decisions concerning teachers' professional development
(n=22,860)
No Importance Low Importance Moderate Importance High Importance

Initial Findings, 2013 First to the Top Survey-‐ 71
The chart on professional development shows little variation in the share of teachers who indicated effectiveness ratings should play an important role in related decisions. The largest difference is between the teachers who perceived their feedback to be focused more on improvement (87 percent) compared to the teachers who perceived their feedback to be more judgment focused (78 percent). There were virtually no differences across 2012 final evaluation ratings and only very small declines with increasing experience. Differences across evaluation models also were small with the largest difference between the share of teachers in schools using the TEAM model and teachers in schools using the TIGER model; and that difference was only six percentage points.
10%
8% 9%
18%
8% 11% 13% 15% 17%
11% 6% 9% 9%
7% 10% 10% 11% 12% 12%
23%
21% 23%
29%
21% 24%
26% 29% 27%
25% 21% 18% 17%
20% 25% 23% 23% 26% 23%
47%
49% 49%
41%
48% 47%
45% 42%
38%
48% 52%
44% 49%
51% 45% 48% 46%
47% 47%
19%
22% 18%
13%
22% 18% 16% 14%
17%
17% 20%
29% 25%
21% 20% 20% 19% 15% 17%
0% 10% 20% 30% 40% 50% 60% 70% 80% 90% 100%
Overall (n=20,792)
Primary Focus of Feedback More Improvement (n=8,952)
Equal (n=5,788) More Judgment (n=3,851)
Final 2012 Evaluation Rating Final Rating = 5 (n=7,720) Final Rating = 4 (n=5,938) Final Rating = 3 (n=3,852) Final Rating = 2 (n=1,215)
Final Rating = 1 (n=53)
Evaluation Model in Use TEAM (n=16,619)
TIGER (n=637) TEM (n=2,394)
COACH (n=1,142)
Educator Experience 0 to 3 years (n=3,915) 4 to 6 years (n=2,754) 7 to 10 years (n=3,106)
11 to 17 years (n=4,844) 18 to 25 years (n=3,278) Over 26 years (n=2,895)
Chart 5.5b.3: Level of importance teachers would place on effectiveness ratings for decisions concerning teacher retention (n=22,860)
No Importance Low Importance Moderate Importance High Importance

Initial Findings, 2013 First to the Top Survey-‐ 72
Chart 5.5b.3 reveals greater differences between teacher subgroups than are apparent in Chart 5.5b.2. The previous chart was focused on a personnel decision that supports teachers (i.e., professional development) whereas Chart 5.5b.3 can be considered a more high-‐stakes decision for teachers. Teachers who perceived their feedback as focused more on helping them improve were 17 percentage points more likely to indicate that evaluation ratings should play an important role in making decisions about teacher retention, than teachers who perceived their feedback to be more focused on judgment. Similar differences were observed based on teachers’ 2012 final evaluation ratings, with the share of teachers who received the highest ratings more likely than those who received a rating of one or two to report that evaluation ratings should be an important part of retention decisions. As noted for other disaggregated results, teachers in schools using the TEAM model respond differently than teachers in schools using one of the approved alternative models. Seven to nine percent fewer teachers in schools using TEAM would place moderate to high importance on effectiveness ratings for teacher retention decisions than teachers using other evaluation models. Differences across experience are too small to be meaningful except for the slightly larger share of novice teachers who selected the moderate or high importance options. Results in Chart 5.5b.3 are highly consistent with analyses of teachers’ attitudes about the use of evaluation ratings for decisions about teacher advancement and teacher tenure. These findings on how important teachers believe effectiveness ratings should be in personnel decisions indicate that teachers believe ratings should inform improvement efforts (e.g., professional development). In addition, while nearly two in three responding teachers would place high or moderate importance on effectiveness ratings for higher stakes employment decisions, the divergence across other variables examined suggest that this willingness to consider evaluation results depends to some degree on whether they perceived that their system was focused on helping them improve.
SECTION V SUMMARY The results reported in this section of the report reflect educators’ perceptions and opinions about the “goodness” of the teacher evaluation model used in their schools and the potential for this important component of personnel policy to improve practices in and outcomes from schooling. Key findings from analyses of responses to relevant survey items are summarized below.
Evaluation Process Quality Indicators Generally teacher responses to items assessing attributes of quality in the evaluation system revealed increases in positive perceptions and somewhat smaller declines in perceptions of negative characteristics. Two out of three teacher respondents agreed that evaluations were fair (more than twice the share who agreed in 2012) and just over half indicated they were satisfied with system used in their schools (up from only 30 percent in 2012). The share of observer respondents who indicated they were satisfied with their evaluation systems also increased over 2012 levels from 63 percent agreement to 78 percent agreement. Stress associated with teacher evaluations continued to be a concern for nearly three in four teachers (down from more than 80 percent of teachers in 2012) while only one in three teachers indicated that observations were disruptive to classroom instruction (down from more than 40 percent in 2012).

Initial Findings, 2013 First to the Top Survey-‐ 73
These findings differed by model and with teachers’ perceptions of the primary purpose of observation feedback. Teachers in schools using the TEAM model were more likely to agree that evaluations caused them a lot of stress (77 percent agreement) than teachers in schools using other models (only 47 percent of COACH teachers agreed) and were less likely to agree that they were satisfied with the system (48 percent of TEAM teachers agreed compared to 66 percent for teachers in schools using TIGER or COACH models). Teachers who perceived their observation feedback to be more focused on helping them improve were much more likely to indicate they were satisfied with their evaluation system (66 percent) than teachers who perceived their feedback as primarily focused on judging their performance (19 percent). Teacher experience also was moderately inversely related to satisfaction with the 62 percent of novice teacher agreement level declining to 46 percent agreement for teachers with 26 or more years of experience.
Benefits from Teacher Evaluations Observer and teacher responses also indicate that, overall, professional benefits and improvements in teaching and student achievement attributable to the evaluation process are perceived to be increasing. More than half of teacher respondents agreed with all statements indicating that they perceived professional benefits accruing from the teacher evaluation process with 55 percent overall agreeing that the system will help them “improve as a professional.” While this represents just over half of respondents, the agreement is 12 percentage points higher than the level observed in 2012 and is consistent with gains in agreement observed for all three items examined as indicators of professional benefits. Consistent with other findings, teachers in schools using the TEAM model were less likely to agree with statements about professional benefits; novice teachers were more likely to agree than veteran teachers; and teachers who perceived their observation feedback to be improvement focused were much more likely to agree that they benefit professionally from the evaluation process than teachers who perceived their feedback to be more judgmental. Findings related to perceived impacts on teaching and student achievement reveal that more teachers in 2013 agreed that evaluations can help improve their teaching and student achievement, with gains in improved teaching pushing the overall agreement rate to over half of teachers; however, gains for the statement about improved student achievement from evaluations still yielded only 39 percent agreement when teachers responded about improvements in achievement for “my students.” Levels of agreement with these statements varied across evaluation models and the perceived focus of feedback in directions consistent with other findings. Ten to fifteen percent fewer teachers in schools using the TEAM model agreed with statements about improved teaching and learning than teachers in schools using alternative models. Differences based on teachers’ perceptions about the purpose of feedback were larger; and teachers who perceived their feedback to be focused more on improvement were three times more likely to agree that evaluations would improve their teaching and three and a half times more likely to agree evaluations would improve their students’ achievement than teachers who perceived feedback to be more focused on judgment.
Perceived Value of Teacher Evaluations Approximately 10 percent fewer 2013 teacher respondents agreed that the “evaluation process takes more effort than the results are worth” than 2012 teacher respondents; however, more than 60 percent of teachers still agreed or strongly agreed with this statement in 2013. Agreement was

Initial Findings, 2013 First to the Top Survey-‐ 74
inversely related to teacher experience and perceived improvement focus of feedback. Consistent with other findings, teachers in schools using TEAM were more likely to agree with this statement than teachers in schools using alternative models with COACH teachers the least likely to agree. The level of importance teachers and observers would place on effectiveness ratings for personnel decisions in 2013 showed only small gains compared to responses from 2012 with teachers about 20 percentage points less likely than observers to place moderate to high importance on effectiveness ratings for all decisions except teacher compensation. In the case of teacher compensation, just under half of teachers and observers in 2013 believe effectiveness ratings should be an important factor (though importance ratings were higher for teacher respondents from schools participating in strategic compensation reforms). The importance of effectiveness ratings was the highest for professional development decisions with little variation across models, 2012 evaluation ratings, teacher experience levels, or perceived focus of observation feedback. Importance declined substantially for the other higher stakes decisions related to retention, advancement, and tenure; and differences across other variables were consistent with earlier findings. Teachers in schools using the TEAM model were least likely to place moderate to high importance on effectiveness ratings for high stakes personnel decisions while novice teachers, those receiving higher ratings in 2012, and those perceiving their feedback to be improvement focused were more likely to believe effectiveness ratings should play an important role.

Initial Findings, 2013 First to the Top Survey-‐ 75
VI. CONCLUDING OBSERVATIONS Improving teaching is a key goal in Tennessee’s successful Race to the Top grant award and implementing more rigorous and comprehensive educator evaluation systems is a central strategy for helping to achieve this outcome. Changes to teacher evaluation systems being implemented in Tennessee are significant. All teachers are to be observed teaching their students every year, and detailed rubrics have been developed for use in defining desired teaching skills, classifying observed teaching behaviors, and recommending changes to improve teaching. Results from teaching observations and other measures included in teacher evaluations are being collected in a state-‐wide database and legislation and other policy directives are making those results more relevant for local human resource decisions. The implicit logic for how teacher evaluations can improve teaching is relatively straightforward. Teaching observations and other evaluation measures (e.g., student achievement and growth metrics) provide accurate evidence of teaching skills and teaching effectiveness. Feedback provided to teachers from the collected evidence, especially from classroom teaching observations, provides information to teachers on their teaching strengths and areas needing improvement. Acting on that feedback, teachers pursue formal and informal learning activities that help them change their professional practices in ways that improve teaching effectiveness. The changes in teaching practice will be reflected in results of subsequent teaching observations and, ultimately, in improved measures of student learning. Three major issues related to educator evaluations were investigated in this report. The lead section of the report presented information about the nature of feedback provided to teachers from teacher evaluations, especially feedback from teaching observations. Information about how evaluation processes were conducted and how much time was devoted to that work was presented in the section on implementation. Educators’ perceptions and attitudes about the quality and value of educator evaluations comprised the third major group of results presented in the report. A synopsis of the rationale for investigating each major issue and key findings are presented in this final section.
TEACHER FEEDBACK Feedback teachers receive from their final evaluation and teaching observations is a critical element in the ability of evaluations to improve teaching quality. The topics addressed and the recommendations offered during feedback sessions are important to the process of using evaluations for improving
Initial Findings, 2013 First to the Top Survey-‐ 76
teaching. Based on the results presented in this report, researchers identified the following key findings related to teacher feedback. • Teachers reported that teaching strengths and areas in need of improvement identified through
feedback from teaching observations were largely focused on issues related to instruction rather than planning, environment, or professionalism.
By a large margin, observers of TEAM teachers most commonly identified INSTRUCTION: Content knowledge as a teaching strength for teachers. Observers using TEM also cited an instructional area, TEACH: Engage Students in Lessons, while those using TIGER cited CLASSROOM ENVIRONMENT: Teacher interaction with students, and those using COACH cited the CLASSROOM MANAGEMENT: Relationships. Teachers generally reported agreement with the strength their observer identified, and about a third of respondents indicated that they had been invited to share their strength with other teachers. Turning to observation feedback for areas in need of improvement, teachers in schools using the TEAM or TIGER model identified INSTRUCTION indicators related to using questioning techniques most often; teachers in schools using the TEM model identified developing higher order thinking skills by a wide margin; and teachers in schools using the COACH model identified the Mapping indicator under the Planning domain most often. Unlike responses relative to teaching strengths, teacher agreement with an observer’s rating on the designated indicator seemed to be closely aligned with a teacher’s evaluation score. • Most teacher respondents (but not all of them) reported that feedback from teaching observations
included recommendations for how they could improve performance in areas identified as most needing improvement. Generally, activities and resources that included interactions with other professionals were most often used and reported to be most helpful to improving teaching. Many teachers indicated they received little or no follow-‐up from evaluators on their efforts to improve.
When asked about resources and follow up related to areas in need of improvement, nearly 80 percent of teachers indicated that their observer had recommended one or more activities or resources to help them improve their performance. Consistently, more teachers indicated that they pursued improvement activities more often than those activities were recommended by their evaluators. This finding indicates that teachers are taking personal initiative to improve their teaching and not just responding to evaluator recommendations. In addition to self-‐directed learning, activities and resources most often recommended and pursued tended to involve interactions with colleagues or other individuals, e.g., observing other teachers or working one-‐on-‐one with a mentor or coach. These also tended to be the strategies that teachers reported were most helpful with improving their teaching. Nearly half of responding teachers indicated that their observers never followed up with them about the areas identified as most needing improvement, with teachers in schools using the TEAM model a bit more likely than other teachers to indicate no follow up by their observers. Fewer than one in five teachers indicated that their observers followed up with them more than one time. • Teachers in 2013 were more likely than teachers in 2012 to perceive feedback from teaching
observations to be more focused on helping them improve their practice than on judging their
Initial Findings, 2013 First to the Top Survey-‐ 77
performance. Teachers’ perceptions of the primary focus of evaluation feedback are consistently strong predictors of differences in teachers’ perceptions and attitudes about the quality, benefit, and value of teacher evaluations.
Perhaps the most important finding from the 2013 survey analyses is the relationship between the perceived purpose of observation feedback and teachers’ perceptions and attitudes about the quality and value of the new evaluation systems. Just under half of teachers in 2013 (47 percent) indicated that they perceived the primary purpose of the feedback received from their observers to be more focused on helping them improve their teaching than on judging their performance. This represents a 10-‐percentage point increase from 2012 results. Just over 30 percent of teachers in 2013 indicated that the focus on improvement versus judgment were equal, while 22 percent perceived the primary purpose of feedback to be judgment (down 5 percentage points from 2012 results). These findings indicate that many teachers were not yet convinced that improving their teaching was the major focus of the feedback they received, although progress was made compared to 2012. The importance of this finding is evident when examining differences in perceived benefits and value from teacher evaluations based on perceived purposes of feedback. Teachers who perceived improvement as the primary focus of feedback were generally three times more likely to agree that teacher evaluations would improve their teaching and students’ achievement than teachers who perceived judgment as the primary focus. In addition, two-‐thirds of teachers who perceived improvement as the main focus of feedback indicated they were satisfied with the teacher evaluation process in their schools while less than one in five teachers who perceived judgment as the primary focus agreed they were satisfied.
IMPLEMENTATION Fidelity of implementation is a key concept for evaluation of change efforts. To know if TDOE’s prescribed changes to educator evaluation systems actually lead to better outcomes requires knowing if the prescribed changes were actually implemented as recommended. Researchers identified the following key finding related to implementing changes to teacher evaluation systems. • Teacher evaluation continues to be implemented mostly as intended, and patterns of implementation
appear to be similar to 2011-‐12. Related findings suggest that evaluation processes are growing more stable and that teacher perceptions of those processes are growing more positive.
Generally, teachers were observed at least as frequently as state policy recommends and final evaluation ratings incorporated all required measures. Nearly all observers have attended evaluator training and those who received more training felt more prepared to complete evaluation tasks than those who received less training. Ninety percent of observers in schools using the TEAM model reported that they were well prepared to conduct evaluation tasks, up from 70 -‐ 75 percent who felt prepared in 2012. Principals and assistant principals conducted the bulk of teaching observations with 75 percent of principals and 66 percent of assistant principals reporting they conducted 41 or more observations during 2013. Teachers further confirmed a principal or assistant principal observed them most often. Consistent with this work load, most building administrators indicated they spent seven or more hours per week on tasks related to teacher evaluations, though only 47 percent indicated that they spent more time on this job duty in 2013 than 2012.

Initial Findings, 2013 First to the Top Survey-‐ 78
Patterns were as would be expected when examining time teachers spent being observed. Teachers with lower 2012 evaluation ratings were more likely to report spending more than three hours being observed than their colleagues with ratings of five. Additionally, 39 percent of novice teachers -‐ more than twice the percentage of teachers in any other experience level -‐ indicated that they had been observed for at least three hours. Many measures indicate that implementation efforts are growing more stable and positive. For example, a larger share of teachers indicated that they perceived the evaluation system to be fair to them (32 percent in 2012 to 66 percent in 2013) and that their observers are qualified to evaluate their teaching (from 71 percent in 2012 to 76 percent in 2013). However, results also suggest that there are still opportunities for improvement. Teachers indicated that evaluation results from the prior school year were received across a wide time span, with one in five teachers reporting that by late spring 2013 they had not yet received at least one measure that contributes to their total evaluation score. For those who had received scores, more than one third had not discussed results from at least one measure with their evaluator. Furthermore, 28 percent of the more than 11,000 respondents who received scores on all four measures indicated they had never discussed any of those final ratings with their evaluator.
PERCEPTIONS OF THE QUALITY, VALUE AND EFFECTS OF TEACHER EVALUATION Teacher perceptions and attitudes about the potential value and benefits from teacher evaluations matter. Change theorists argue that favorable attitudes facilitate goal adoption and successful implementation of change efforts. Several key findings related to educator perceptions and attitudes are presented and discussed below. • Educators’ perceptions about the overall quality of evaluation systems and their benefits and value
are becoming more positive over time, but there is still room for improvement. • Teacher perceptions related to teacher evaluations also were related to the evaluation system used in
their schools, their experience levels, and the final rating they received from their 2011-‐12 evaluation. • The perceptions of observers about the overall quality of evaluation systems and their benefits and
value have become more positive over time, and, for the most part, were significantly more positive than perceptions of teachers.
The 2013 First to the Top survey results indicated that teacher agreement with positive statements about teacher evaluations increased by about 10 to 15 percentage points over results from the 2012 survey. Some differences were observed across evaluation models and teacher characteristics and their perceptions of the primary focus of observation feedback. The key findings listed above related to implementation, benefits, and value are discussed below in separate subsections.
Evaluation Process Quality Indicators
Two out of three teacher respondents agreed that evaluations were fair (more than twice the share who agreed in 2012) and just over half indicated they were satisfied with the system used in their schools (up from only 30 percent in 2012.) The share of observer respondents who indicated they were

Initial Findings, 2013 First to the Top Survey-‐ 79
satisfied with their evaluation systems also increased over 2012 levels, from 63 percent agreement to 78 percent agreement. Teachers who perceived their observation feedback to be more focused on helping them improve were much more likely to indicate they were satisfied with their evaluation system (66 percent) than teachers who perceived their feedback as primarily focused on judging their performance (19 percent). Teacher experience was inversely related to satisfaction with the evaluation system with satisfaction levels gradually declining from almost two thirds of novice teachers to slightly less than half of teachers with 26 or more years of experience. Teachers in schools using the TEAM model were less likely to agree that they were satisfied with the system (48 percent of TEAM teachers agreed compared to 66 percent for teachers in schools using TIGER or COACH models). Unintended negative characteristics of the evaluation system also moved in a positive direction. Stress associated with teacher evaluations continued to be a concern for nearly three in four teachers (down from more than 80 percent of teachers in 2012), while only one in three teachers indicated that observations were disruptive to classroom instruction (down from more than 40 percent in 2012). Teachers in schools using the TEAM model were more likely to agree that evaluations caused them a lot of stress (77 percent agreement) than teachers in schools using other models (only 47 percent of COACH teachers agreed).
Benefits from Teacher Evaluations Observer and teacher responses also indicated that, overall, professional benefits and improvements in teaching and student achievement attributable to the evaluation process were perceived to be increasing. Slightly more than half of teacher respondents agreed that the system would help them “improve as a professional” – a 12 percentage point increase over the level of agreement observed in 2012. Similar increases in agreement were observed for the other three items examined as indicators of professional benefits. Consistent with other findings, teachers in schools using the TEAM model were less likely to agree with statements about professional benefits, novice teachers were more likely to agree than veteran teachers, and teachers who perceived their observation feedback to be improvement focused were much more likely to agree that they benefit professionally from the evaluation process than teachers who perceived their feedback to be more judgmental. More teachers in 2013 agreed that evaluations can help improve their teaching and student achievement. Increases in agreement with improved teaching from evaluations resulted in over half of teachers agreeing; however, gains for the statement about improved student achievement from evaluations still yielded only 39 percent agreement when teachers responded about improvements in achievement for “my students.” Levels of agreement with these statements varied across evaluation models and the perceived focus of feedback in directions consistent with other findings. Ten to fifteen percent fewer teachers in schools using the TEAM model agreed with statements about improved teaching and learning than teachers in schools using alternative models. Teachers who perceived their feedback to be focused more on improvement were three times more likely to agree that evaluations would improve their teaching and three and a half times more likely to agree evaluations would improve their students’ achievement than teachers who perceived feedback to be more focused on judgment.

Initial Findings, 2013 First to the Top Survey-‐ 80
Perceived Value of Teacher Evaluations
Approximately 10 percent fewer 2013 teacher respondents agreed that the “evaluation process takes more effort than the results are worth” than 2012 teacher respondents; however, more than 60 percent of teachers still agreed or strongly agreed with this statement in 2013. Agreement was inversely related to teacher experience and perceived improvement focus of feedback. Consistent with other findings, teachers in schools using TEAM were more likely to agree with this statement than teachers in schools using alternative models with COACH teachers the least likely to agree. Additionally, observers had a more positive response than teachers.
MOVING FORWARD Results from the 2013 First to the Top Survey suggest that changes to teacher evaluation systems have moved beyond the introductory phase and that related processes and procedures have grown more stable. Although both teachers and observers perceive the teacher evaluation process more positively in 2013 than they did in 2012 a significant share of teachers remain unconvinced of its efficacy. This gap, while closing, suggests a number of opportunities for improvement or refinement of processes and procedures. Consortium researchers continue to analyze findings from the 2013 First to the Top Survey and probe additional areas of interest related to teacher evaluations. A brief that examines how specific information on the way evaluations are conducted predicts teachers’ perceptions of the purpose of observation feedback is being prepared. Questions about the potential to use student surveys as measures in evaluation systems also will be analyzed with results forthcoming in a separate brief. Other briefs examining specific issues related to teacher evaluation also will be prepared as topics emerge from the continuing analyses. Finally, researchers plan to implement changes to the 2014 First to the Top Survey to more fully investigate the changes to instructional practice that result from the teacher evaluation process. Other kinds of data also were collected on the First to the Top Survey, including reactions to changes in administrator evaluations and teachers’ participation in efforts to prepare for implementing Common Core State Standards. Briefs from these results will be prepared and made available over the next few months. The modules investigating other components of the First to the Top reform initiatives also will be evaluated and reported as separate briefs and those analyses will include, where appropriate, how perceptions of resources, standards, leadership, and professional development are related to perceptions of educator evaluation systems. These efforts will help researchers better illuminate the “black box” of teacher evaluation and more fully understand how reforms can be effectively embedded in the day to day practices of teachers and schools.

This page intentionally left blank.
Appendix A: Initial Findings, 2013 First to the Top Survey-‐ 81
APPENDIX A Counts of Educators in Tennessee and Representativeness of Respondent Samples from the Spring 2013 First to the Top Survey
The sampling frame for the spring 2013 First-‐to-‐the-‐Top (FTTT) survey was constructed from two primary state level administrative data sets. The EIS data set identifies all professional educators in the state with some information about positions held, experience, etc. In some instances, an educator in EIS held multiple positions. In these instances, if a teacher position was indicated, it was given first priority and assigned. Second and third priorities were assigned to administrator and other positions, respectively. The CODE data set is newer and was designed to capture and organize data from educator evaluation systems and provided information about evaluation roles and, more importantly, was the primary source of email addresses used to invite participants. These data were supplemented by email addresses for all teachers working in Memphis Public Schools because that LEA is not represented in the CODE data set. Unfortunately, the email addresses of building administrators in Memphis were not requested as part of the supplemental data provided by Memphis Public Schools, so individuals in those positions were not invited to participate in the 2013 First to the Top survey. Records in the sampling frame were then assigned to one of three categories – building administrator, teacher, or other – with EIS position given priority over the CODE indicator. Any educators that remained unassigned based on their EIS and CODE records, and who responded to the First to the Top survey, were assigned based on their self-‐reported position. Those unassigned after these steps were assigned to the “Other” staff category. The analyses in this appendix present the percentages of Tennessee educators in the various strata categories, the corresponding percentages of respondents in the same categories, and the results of a Chi-‐Square Goodness of Fit test that examined whether the distribution across strata of respondents “fit” the corresponding distribution observed for the population. Each section of the appendix also includes the authors’ brief assessment of the degree to which results from the survey can be generalized. As noted above, two primary groups, teachers and building administrators, were identified and included in the representativeness checks. The strata used for testing include gender, race/ethnicity, experience, the type of school (elementary, middle, high school, or schools with various combinations of grade levels), the size of the LEA, education level, and 2012 final evaluation rating (limited to those for whom these data are available). These counts and comparisons are examined three ways, as there are different underlying “populations” for various presentations in the report. First, all teacher and building administrator respondents were compared to the overall population of teachers and building administrators to determine the overall representativeness of the sample.37 These results are reported in Table A1 and presented graphically in Figures A1-‐A14. They are most useful when interpreting reported statistics for all teacher or evaluator responses.
37 Note that the EIS building administrator counts EXCLUDE the principals and assistant principals from Memphis who were included in the sampling frame because there were relevant records in the data system.

Appendix A: Initial Findings, 2013 First to the Top Survey-‐ 82
When presenting results by teacher evaluation model, it is important to know whether or not the respondents associated with each model are representative of all the educators in schools using the relevant evaluation model. Therefore, a second analysis was conducted by model across the identified strata. These results are presented in Table A2a through Table A2d. Finally, each educator in the sampling frame was randomly assigned to receive an invitation for one of six “versions” of the survey. Each version contained a section that asked questions about one other key reform initiative embodied in Tennessee’s Race to the Top effort. This modular design was implemented as a way to limit the length of the First to the Top survey while still collecting data about those other reforms. An analysis was conducted by module across the identified strata to check the representativeness of respondents for each of the modules, as well as the representativeness of the invitees to the overall sampling frame. These results are presented in Table A3a through Table A3f.
I. PRIMARY REPRESENTATIVENESS RESULTS
• Administrative respondents appear to be largely representative of the overall population. • The representativeness of the teacher respondent sample is more difficult to evaluate given
that the large sample size results in even small percentage point discrepancies producing statistically significant differences. However, the under-‐representation of novice teachers and those holding only a bachelor’s degree (groups that likely contain a great deal of overlap) is the most likely to be of practical concern to researchers and policy makers.
• Of particular interest is the distribution of the 2011-‐2012 final evaluation ratings for survey respondents. Differences in the distribution of final evaluation ratings between the sampling frame and respondents are not statistically significant at the p < .05 level.
• When representativeness is examined within each teacher evaluation model, o TEAM results largely parallel those for the entire sample. o The TIGER model is the most representative of the four models, while TEM is the
least, with women and elementary teachers over-‐represented among TEM respondents.
o Bachelor’s degree holders are generally not under-‐represented in the COACH model, although larger mid-‐sized districts (enrollment between 10,000-‐40,000 students) and middle school teachers are.
o The 2012 final evaluation ratings observed for teachers in districts using the TIGER and COACH models include more 5’s than ratings observed for teachers in the overall sampling frame (mostly TEAM), while TEM has fewer 5 ratings. This latter difference could be the result of lower TVAAS scores in the TEM schools or may be due to fundamental differences in the scoring rubrics used in the three models.
• When analyzed at the module level, o The assignment of modules to teachers does appear to be well randomized. o Following from the first point, the representativeness patterns within each module
mimic the patterns from the overall sample. Specifically, more experienced and educated teachers are over-‐represented in the sample, as are women and elementary teachers to a lesser degree.
Appendix A: Initial Findings, 2013 First to the Top Survey-‐ 83
The remainder of this appendix is organized into three sections. Section One presents representativeness testing for the combined teacher and combined administrator samples. Section Two presents results of the representativeness testing by evaluation model, while Section Three examines the representativeness of the subsamples randomly assigned to receive different versions of the survey. Sections Two and Three are limited to teacher respondents.
II. OVERALL REPRESENTATIVENESS OF THE SAMPLE Table A1 below presents data on the representativeness of the respondent sample compared to the overall sampling frame. The analysis is completed separately for administrators and teachers, with results for administrators in the left-‐hand columns of the table and teacher results on the right. As mentioned in the introduction, building administrators (principals and assistant principals) from Memphis Public Schools are excluded from the EIS statistics, as they were not sent invitations to participate in the survey and, as such, do not figure into the respondent values. Based on the results presented in Table A1, the sample of administrative respondents appears to be largely representative of administrators in the overall sampling frame. For four of the seven strata (educational level, district size, experience, and 2012 final evaluation rating), the distribution of respondents cannot be statistically distinguished from the overall distribution. The tests for the other three strata (gender, ethnicity, and school type) indicate statistically noticeable differences between the respondents and the overall population, with female, white, and elementary school administrators over-‐represented. However, for all but gender, the differences for each category are less than three percent and, as such, likely provide little practical difference in terms of representativeness. The representativeness of teachers is harder to analyze because, given the size of the respondent sample (nearly 25,000), even small percentage point differences are statistically significant. In fact, of the seven strata, only ethnicity and 2012 final evaluation rating are found to be representative based solely on statistical grounds. In practical terms, however, many of the differences from the other strata are small and not likely to affect the generalizability of the results. The two strata of most concern are educational level and experience with more highly educated and more experienced teachers over-‐represented in the respondent sample as compared to novice teachers and those holding only a bachelor’s degree.

Appendix A: Initial Findings, 2013 First to the Top Survey-‐ 84
Table A1: 2013 First to the Top Survey A Check of Representativeness of Administrator and Teacher Responses
Tennessee Certified Educators Versus Survey Respondents
Variable Administrators*
(3,215 in EIS, 1,465 Respondents) Teachers
(67,456 in EIS, 24,901 Respondents) % of EIS,
Admin % of Respondents,
Admin Chi-‐square EIS to Respondents
Chi-‐square EIS to Respondents
% of Respondents, Teachers
% of EIS, Teachers
Highest Educational Level
Bachelor's 1.2% 1.0% p = 0.343 p < 0.001 38.6% 42.6% Master's 41.2% 41.4% Figure A1 Figure A2 43.2% 41.4% Master's Plus 15.4% 14.3% 9.3% 7.9% Education Specialist 32.0% 33.9% 7.9% 7.1% Doctorate 10.2% 9.5% 1.0% 0.9%
Sex Female 55.3% 58.6% p = 0.010 p < 0.001 82.3% 79.1% Male 44.7% 41.4% Figure A3 Figure A4 17.7% 20.9%
Ethnic Origin White 86.4% 89.2% p = 0.008 p = 0.199 87.3% 87.0% Black or African-‐American 13.3% 10.6% Figure A5 Figure A6 12.2% 12.5% Other 0.2% 0.2% 0.5% 0.5%
Urbanicity of District Enrollment > 40,000 26.1% 24.6% p = 0.356 p < 0.001 33.3% 33.5% 10,000 < E < 40,000 26.2% 25.7% Figure A7 Figure A8 24.2% 25.2% 5,000 < E < 10,000 19.5% 19.5% 17.2% 17.4% Enrollment < 5,000 28.2% 30.2% 25.3% 23.9%
Tier Elementary School 37.2% 39.3% p = 0.018 p < 0.001 45.1% 43.5% Middle School 21.1% 19.8% Figure A9 Figure A10 17.7% 18.7% High School 28.1% 25.2% 24.5% 25.3% K-‐8 9.1% 11.0% 8.9% 8.4% K-‐12 1.5% 1.6% 1.5% 1.4% Other 3.0% 3.1% 2.3% 2.6%
Years Experience 0 to 3 years 1.4% 1.4% p = 0.837 p < 0.001 17.8% 22.1% 4 to 6 years 2.4% 2.5% Figure A11 Figure A12 12.8% 13.9% 7 to 10 years 10.3% 9.9% 14.9% 15.0% 11 to 17 years 30.1% 28.8% 23.9% 21.6% 18 to 25 years 27.2% 28.5% 16.2% 14.1% Over 26 years 28.6% 28.9% 14.4% 13.3%
2012 Final Evaluation Rating 1 0.3% 0.2% p = 0.708 p = 0.075 0.3% 0.3% 2 6.3% 7.1% Figure A13 Figure A14 6.6% 6.8% 3 19.9% 20.0% 20.7% 20.2%
4 31.5% 31.4% 31.4% 31.9%
5 42.0% 41.3% 41.0% 40.8% *Administrators were flagged using the School Administrator flag maintained within the TDOE CODE Database. A very small percentage of survey respondents who were flagged as administrators within the CODE Database but who also self-‐identified as non-‐administrators on the survey were dropped from this category. Also, all administrators from the Memphis public school district are excluded from both the EIS and respondent results presented in this table.
Appendix A: Initial Findings, 2013 First to the Top Survey-‐ 85
III. REPRESENTATIVENESS BY TEACHER EVALUATION MODEL
This section presents representativeness results broken down by the four teacher evaluation models approved for use in the state of Tennessee – TEAM, TIGER, TEM, and COACH. There are four tables presented below (Table A2a – Table A2d), one for each model. For each of the seven strata, two separate comparisons are presented. First, all teachers in the sampling frame who teach in a district using the relevant model are compared to the overall population. This comparison provides information on how teacher characteristics are distributed across the evaluation systems. Chi-‐squared statistics are also provided for these comparisons. These generally imply significant differences in teacher characteristics between teachers from districts using a particular evaluation model and the teachers in the overall sampling frame, which is not surprising as there is no reason to expect representativeness along this dimension given the non-‐random nature of evaluation model adoption. However, one such cross-‐model comparison is worth noting. When 2012 final evaluation ratings are broken down by evaluation model, the distribution of 5’s is much higher among teachers in districts using the TIGER and COACH models than in the overall sampling frame. In contrast, there are many fewer 5’s (in percentage terms) among TEM teachers. Given that 50 percent of the final evaluation rating is comprised of growth measures, it cannot be determined from the values presented in the table whether or not this is a result of lower growth measures in the TEM schools or of fundamental differences in the scoring rubrics used by the three models. Hence, further analysis is required to disentangle this finding. The second comparison presented in the tables is between all teachers in districts using the given evaluation model and the corresponding teacher survey respondents. This allows for a check to determine if teacher respondents within each model are actually representative of the population of teachers who teach in districts using the model. Not surprisingly considering that TEAM is the largest model in the state comprising 79.8 percent of all responding teachers (19,882 out of 24,901), the results from Table A2a largely mirror those presented in Table A1a; although all of the reported differences are significant, the ones of largest practical concern involve teacher education and experience. Turning to the TIGER model, Table A2b indicates that the respondent sample of TIGER teachers is largely representative of the overall population, although teachers from the smallest districts (those with student enrollment below 5,000) are significantly under-‐represented. Of the four models, TEM appears to have the least representative respondent sample with significant differences occurring in all strata except ethnicity and district size (not surprising given that the TEM model is limited to the Memphis school district). As in the larger teacher sample, novice and bachelor’s degree holding teachers are under-‐represented among TEM respondents. Moreover, women and elementary school teachers are significantly over-‐represented, as are teachers who received a 4 or 5 for their 2012 final evaluation rating. In fact, the percentage of elementary school respondents from TEM schools is nearly 8 percentage points higher than the percentage of elementary school teachers in TEM schools. Given these results, some caution should be exercised when analyzing survey results broken out by the TEM model.

Appendix A: Initial Findings, 2013 First to the Top Survey-‐ 86
The respondents of the final model, COACH, lie with TEAM on the representativeness spectrum between the largely representative TIGER model and the least representative TEM model. Novice teachers are under-‐represented among COACH respondents. Moreover, teachers working in the largest COACH districts are over-‐represented by nearly 6 percentage points. Middle school teachers are slightly under-‐represented.

Appendix A: Initial Findings, 2013 First to the Top Survey-‐ 87
Table A2a: 2013 First to the Top Survey A Check of Representativeness of Teacher Responses TEAM Model (54,809 in Model, 19,882 Respondents)
Variable % of EIS
% in Model
Chi-‐square EIS to All in Model
% of Respondents
Chi-‐square All in Model to Respondents
Highest Educational Level
Bachelor's 42.6% 43.2% p < 0.001 39.3% p < 0.001
Master's 41.4% 41.6% 43.4%
Master's Plus 7.9% 7.3% 8.4%
Education Specialist 7.1% 7.1% 7.8%
Doctorate 0.9% 0.9% 1.0%
Sex
Female 79.1% 79.3% p = 0.228 82.4% p < 0.001
Male 20.9% 20.7% 17.6%
Ethnic Origin
White 87.0% 92.5% p < 0.001 93.6% p < 0.001
Black or African-‐American 12.5% 7.1% 6.0%
Other 0.5% 0.4% 0.4%
Urbanicity of District
Enrollment > 40,000 33.5% 23.3% p < 0.001 21.9% p < 0.001
10,000 < E < 40,000 25.2% 29.8% 29.8%
5,000 < E < 10,000 17.4% 20.7% 20.5%
Enrollment < 5,000 23.9% 26.1% 27.9%
Tier
Elementary School 43.5% 42.2% p < 0.001 42.8% p < 0.001
Middle School 18.7% 18.7% 18.2%
High School 25.3% 25.7% 25.0%
K-‐8 8.4% 9.6% 10.3%
K-‐12 1.4% 1.6% 1.7%
Other 2.6% 2.1% 1.9%
Years Experience
0 to 3 years 22.1% 22.2% p = 0.440 18.2% p < 0.001
4 to 6 years 13.9% 13.9% 12.8%
7 to 10 years 15.0% 15.0% 14.8%
11 to 17 years 21.6% 21.3% 23.5%
18 to 25 years 14.1% 14.3% 16.5%
Over 26 years 13.3% 13.2% 14.3%
2012 Final Evaluation Rating*
1 0.3% 0.3% p = 0.031 0.3% p = 0.068
2 6.8% 6.6% 6.4%
3 20.2% 19.8% 20.5%
4 31.9% 32.4% 31.7%
5 40.8% 40.9% 41.1%
*There were 47,342 TEAM teachers in the sampling frame (86.4% of all TEAM teachers) who could be matched to a 2012 final evaluation rating. Of those, there were 17,983 respondents.
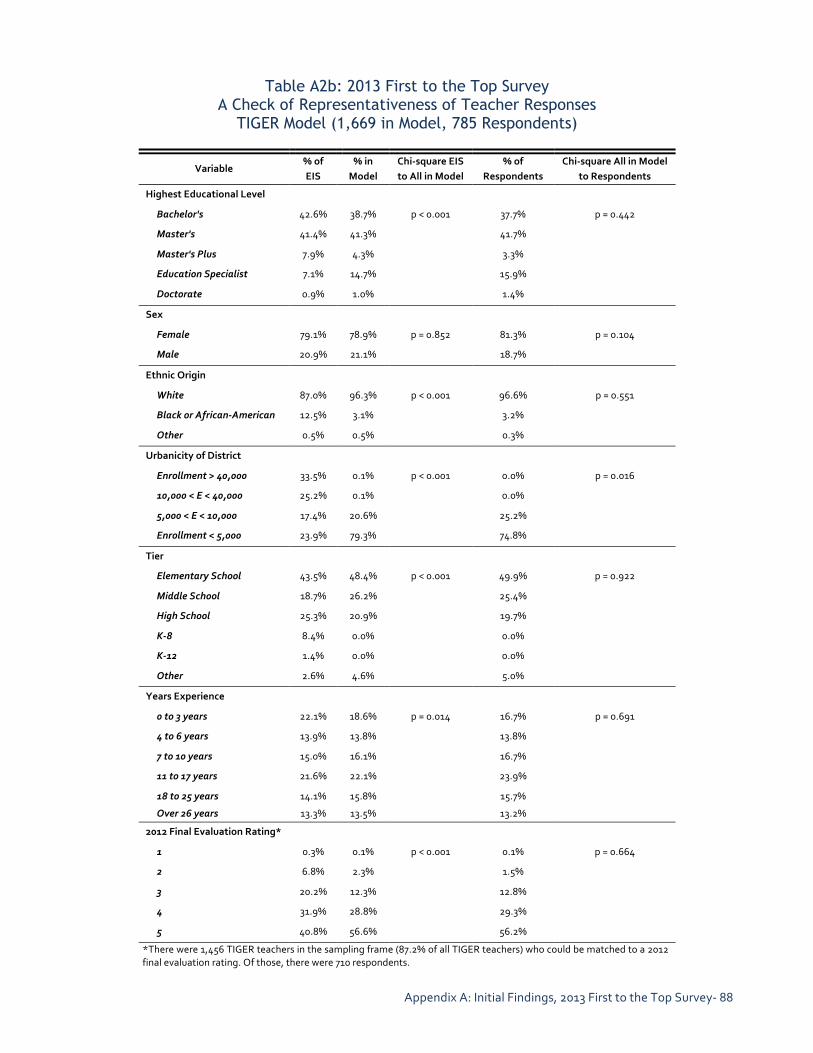
Appendix A: Initial Findings, 2013 First to the Top Survey-‐ 88
Table A2b: 2013 First to the Top Survey A Check of Representativeness of Teacher Responses
TIGER Model (1,669 in Model, 785 Respondents)
Variable % of EIS
% in Model
Chi-‐square EIS to All in Model
% of Respondents
Chi-‐square All in Model to Respondents
Highest Educational Level
Bachelor's 42.6% 38.7% p < 0.001 37.7% p = 0.442
Master's 41.4% 41.3% 41.7%
Master's Plus 7.9% 4.3% 3.3%
Education Specialist 7.1% 14.7% 15.9%
Doctorate 0.9% 1.0% 1.4%
Sex
Female 79.1% 78.9% p = 0.852 81.3% p = 0.104
Male 20.9% 21.1% 18.7%
Ethnic Origin
White 87.0% 96.3% p < 0.001 96.6% p = 0.551
Black or African-‐American 12.5% 3.1% 3.2%
Other 0.5% 0.5% 0.3%
Urbanicity of District
Enrollment > 40,000 33.5% 0.1% p < 0.001 0.0% p = 0.016
10,000 < E < 40,000 25.2% 0.1% 0.0%
5,000 < E < 10,000 17.4% 20.6% 25.2%
Enrollment < 5,000 23.9% 79.3% 74.8%
Tier
Elementary School 43.5% 48.4% p < 0.001 49.9% p = 0.922
Middle School 18.7% 26.2% 25.4%
High School 25.3% 20.9% 19.7%
K-‐8 8.4% 0.0% 0.0%
K-‐12 1.4% 0.0% 0.0%
Other 2.6% 4.6% 5.0%
Years Experience
0 to 3 years 22.1% 18.6% p = 0.014 16.7% p = 0.691
4 to 6 years 13.9% 13.8% 13.8%
7 to 10 years 15.0% 16.1% 16.7%
11 to 17 years 21.6% 22.1% 23.9%
18 to 25 years 14.1% 15.8% 15.7%
Over 26 years 13.3% 13.5% 13.2%
2012 Final Evaluation Rating*
1 0.3% 0.1% p < 0.001 0.1% p = 0.664
2 6.8% 2.3% 1.5%
3 20.2% 12.3% 12.8%
4 31.9% 28.8% 29.3%
5 40.8% 56.6% 56.2%
*There were 1,456 TIGER teachers in the sampling frame (87.2% of all TIGER teachers) who could be matched to a 2012 final evaluation rating. Of those, there were 710 respondents.
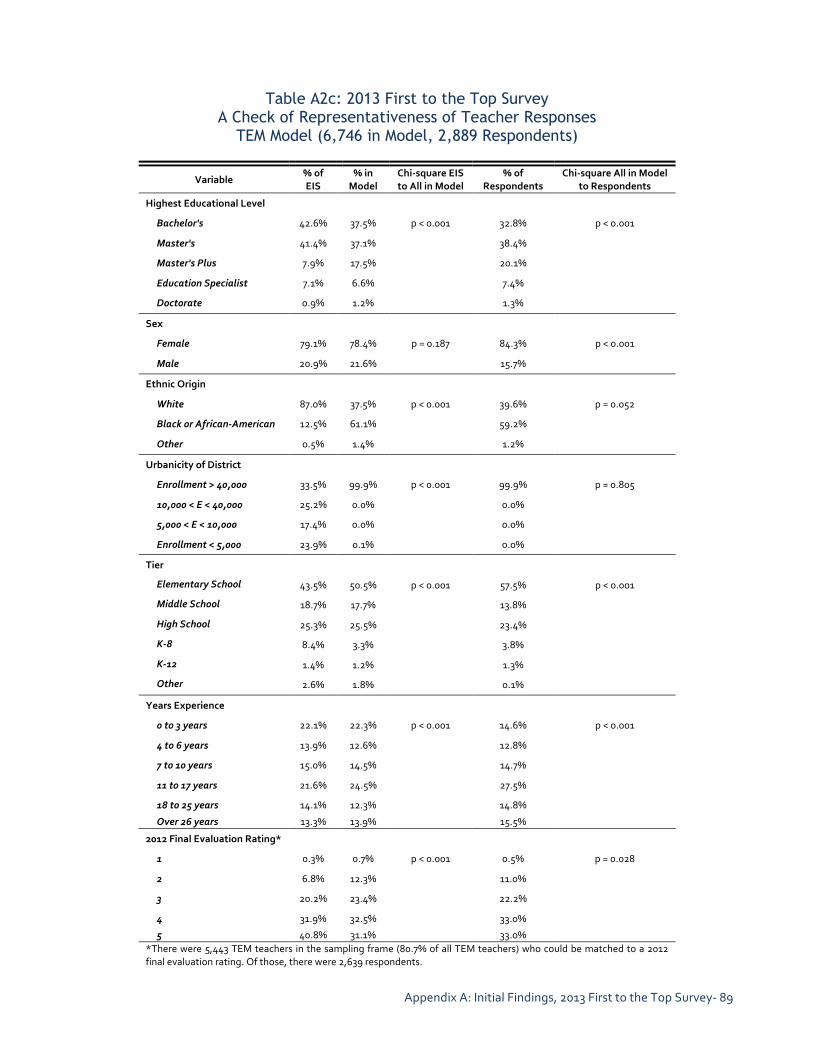
Appendix A: Initial Findings, 2013 First to the Top Survey-‐ 89
Table A2c: 2013 First to the Top Survey
A Check of Representativeness of Teacher Responses TEM Model (6,746 in Model, 2,889 Respondents)
Variable % of EIS
% in Model
Chi-‐square EIS to All in Model
% of Respondents
Chi-‐square All in Model to Respondents
Highest Educational Level
Bachelor's 42.6% 37.5% p < 0.001 32.8% p < 0.001
Master's 41.4% 37.1% 38.4%
Master's Plus 7.9% 17.5% 20.1%
Education Specialist 7.1% 6.6% 7.4%
Doctorate 0.9% 1.2% 1.3%
Sex
Female 79.1% 78.4% p = 0.187 84.3% p < 0.001
Male 20.9% 21.6% 15.7%
Ethnic Origin
White 87.0% 37.5% p < 0.001 39.6% p = 0.052
Black or African-‐American 12.5% 61.1% 59.2%
Other 0.5% 1.4% 1.2%
Urbanicity of District
Enrollment > 40,000 33.5% 99.9% p < 0.001 99.9% p = 0.805
10,000 < E < 40,000 25.2% 0.0% 0.0%
5,000 < E < 10,000 17.4% 0.0% 0.0%
Enrollment < 5,000 23.9% 0.1% 0.0%
Tier
Elementary School 43.5% 50.5% p < 0.001 57.5% p < 0.001
Middle School 18.7% 17.7% 13.8%
High School 25.3% 25.5% 23.4%
K-‐8 8.4% 3.3% 3.8%
K-‐12 1.4% 1.2% 1.3%
Other 2.6% 1.8% 0.1%
Years Experience
0 to 3 years 22.1% 22.3% p < 0.001 14.6% p < 0.001
4 to 6 years 13.9% 12.6% 12.8%
7 to 10 years 15.0% 14.5% 14.7%
11 to 17 years 21.6% 24.5% 27.5%
18 to 25 years 14.1% 12.3% 14.8%
Over 26 years 13.3% 13.9% 15.5%
2012 Final Evaluation Rating*
1 0.3% 0.7% p < 0.001 0.5% p = 0.028
2 6.8% 12.3% 11.0%
3 20.2% 23.4% 22.2%
4 31.9% 32.5% 33.0%
5 40.8% 31.1% 33.0% *There were 5,443 TEM teachers in the sampling frame (80.7% of all TEM teachers) who could be matched to a 2012 final evaluation rating. Of those, there were 2,639 respondents.

Appendix A: Initial Findings, 2013 First to the Top Survey-‐ 90
Table A2d: 2013 First to the Top Survey A Check of Representativeness of Teacher Responses COACH Model (4,232 in Model, 1,345 Respondents)
Variable % of EIS
% in Model
Chi-‐square EIS to All in Model
% of Respondents
Chi-‐square All in Model to Respondents
Highest Educational Level
Bachelor's 42.6% 44.2% p < 0.001 40.2% p = 0.055
Master's 41.4% 46.8% 50.3%
Master's Plus 7.9% 2.8% 2.9%
Education Specialist 7.1% 5.5% 5.8%
Doctorate 0.9% 0.6% 0.8%
Sex
Female 79.1% 77.5% p = 0.011 78.4% p = 0.447
Male 20.9% 22.5% 21.6%
Ethnic Origin
White 87.0% 90.5% p < 0.001 91.1% p = 0.450
Black or African-‐American 12.5% 8.6% 8.3%
Other 0.5% 0.9% 0.6%
Urbanicity of District
Enrollment > 40,000 33.5% 72.8% p < 0.001 78.4% p < 0.001
10,000 < E < 40,000 25.2% 16.2% 8.0%
5,000 < E < 10,000 17.4% 0.0% 0.0%
Enrollment < 5,000 23.9% 10.9% 13.5%
Tier
Elementary School 43.5% 47.9% p < 0.001 48.8% p = 0.023
Middle School 18.7% 16.5% 13.5%
High School 25.3% 21.7% 22.2%
K-‐8 8.4% 4.3% 4.5%
K-‐12 1.4% 0.3% 0.1%
Other 2.6% 9.2% 10.8%
Years Experience
0 to 3 years 22.1% 22.7% p = 0.012 18.7% p = 0.001
4 to 6 years 13.9% 15.3% 13.5%
7 to 10 years 15.0% 15.6% 15.8%
11 to 17 years 21.6% 20.6% 22.6%
18 to 25 years 14.1% 12.9% 14.9%
Over 26 years 13.3% 12.9% 14.3%
2012 Final Evaluation Rating*
1 0.3% 0.0% p < 0.001 0.0% p = 0.190
2 6.8% 3.3% 2.9%
3 20.2% 23.6% 25.6%
4 31.9% 26.2% 23.6%
5 40.8% 46.9% 47.9%
*There were 3,667 COACH teachers in the sampling frame (86.6% of all COACH teachers) who could be matched to a 2012 final evaluation rating. Of those, there were 1,225 respondents.

Appendix A: Initial Findings, 2013 First to the Top Survey-‐ 91
IV. REPRESENTATIVENESS BY SURVEY MODULE As mentioned in the introduction, each educator in the sampling frame was randomly assigned to one of six modules that asked questions on a wider array of topics related to other Race to the Top reform efforts. This sampling methodology was decided upon because of the desire to make the length of the survey manageable while still collecting data on issues important to the educational system in Tennessee. This section presents representativeness results broken down by module for each of the six survey modules. As in the previous section, two separate comparisons are made. First, the group of all teachers assigned to the module is compared to the overall sampling frame. This comparison provides information on whether the modules were adequately randomized. As can be seen from Tables A3a-‐A3f, only two of the forty-‐two strata (seven strata per module) are found to be significantly different from the overall sampling frame at the 95 percent confidence level, which is what one would expect if the modules were randomly assigned. The second comparison is between module invitees and module respondents, i.e., are the respondents to each module representative of those who were assigned to the module. Perhaps not surprisingly given the fact that the modules appear to have been well randomized, the representativeness results largely mirror those for the overall sample. For example, novice teachers and those holding a bachelor’s degree are slightly under-‐represented in every module. Males are also under-‐represented in each module, but to a lesser extent, while elementary school teachers are over-‐represented in the standards, data resources, and instructional practices modules. Some of this differential may be explained by the larger role that standardized testing plays at the elementary level. Interestingly, teachers from small schools are slightly over-‐represented in the data resources module, although the differences are small.
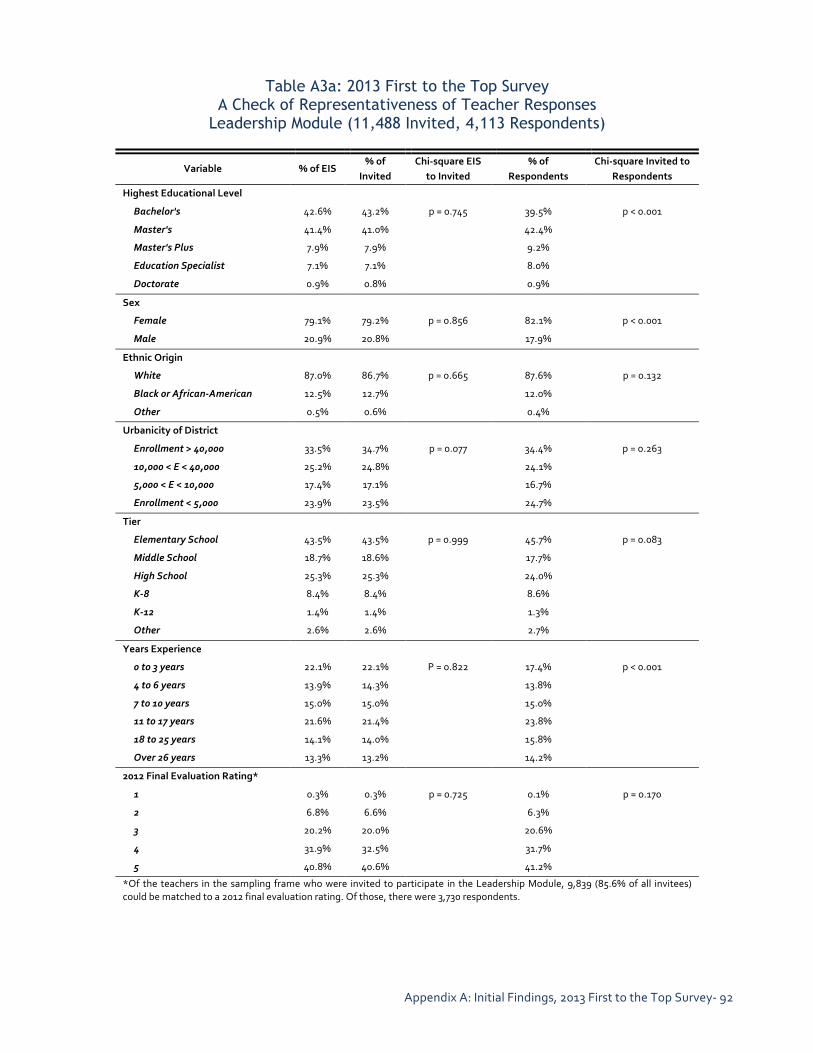
Appendix A: Initial Findings, 2013 First to the Top Survey-‐ 92
Table A3a: 2013 First to the Top Survey A Check of Representativeness of Teacher Responses
Leadership Module (11,488 Invited, 4,113 Respondents)
Variable % of EIS % of
Invited Chi-‐square EIS
to Invited % of
Respondents Chi-‐square Invited to
Respondents
Highest Educational Level
Bachelor's 42.6% 43.2% p = 0.745 39.5% p < 0.001
Master's 41.4% 41.0% 42.4%
Master's Plus 7.9% 7.9% 9.2%
Education Specialist 7.1% 7.1% 8.0%
Doctorate 0.9% 0.8% 0.9%
Sex
Female 79.1% 79.2% p = 0.856 82.1% p < 0.001
Male 20.9% 20.8% 17.9%
Ethnic Origin
White 87.0% 86.7% p = 0.665 87.6% p = 0.132
Black or African-‐American 12.5% 12.7% 12.0%
Other 0.5% 0.6% 0.4%
Urbanicity of District
Enrollment > 40,000 33.5% 34.7% p = 0.077 34.4% p = 0.263
10,000 < E < 40,000 25.2% 24.8% 24.1%
5,000 < E < 10,000 17.4% 17.1% 16.7%
Enrollment < 5,000 23.9% 23.5% 24.7%
Tier
Elementary School 43.5% 43.5% p = 0.999 45.7% p = 0.083
Middle School 18.7% 18.6% 17.7%
High School 25.3% 25.3% 24.0%
K-‐8 8.4% 8.4% 8.6%
K-‐12 1.4% 1.4% 1.3%
Other 2.6% 2.6% 2.7%
Years Experience
0 to 3 years 22.1% 22.1% P = 0.822 17.4% p < 0.001
4 to 6 years 13.9% 14.3% 13.8%
7 to 10 years 15.0% 15.0% 15.0%
11 to 17 years 21.6% 21.4% 23.8%
18 to 25 years 14.1% 14.0% 15.8%
Over 26 years 13.3% 13.2% 14.2%
2012 Final Evaluation Rating*
1 0.3% 0.3% p = 0.725 0.1% p = 0.170
2 6.8% 6.6% 6.3%
3 20.2% 20.0% 20.6%
4 31.9% 32.5% 31.7%
5 40.8% 40.6% 41.2%
*Of the teachers in the sampling frame who were invited to participate in the Leadership Module, 9,839 (85.6% of all invitees) could be matched to a 2012 final evaluation rating. Of those, there were 3,730 respondents.

Appendix A: Initial Findings, 2013 First to the Top Survey-‐ 93
Table A3b: 2013 First to the Top Survey A Check of Representativeness of Teacher Responses
Professional Development Module (11,505 Invited, 4,403 Respondents)
Variable % of EIS % of
Invited Chi-‐square EIS
to Invited % of Respondents
Chi-‐square Invited to Respondents
Highest Educational Level
Bachelor's 42.6% 42.4% p = 0.218 38.6% p < 0.001
Master's 41.4% 41.4% 42.4%
Master's Plus 7.9% 7.6% 9.4%
Education Specialist 7.1% 7.6% 8.6%
Doctorate 0.9% 1.0% 1.1%
Sex
Female 79.1% 78.9% p = 0.577 81.7% p < 0.001
Male 20.9% 21.1% 18.3%
Ethnic Origin
White 87.0% 86.8% p = 0.916 87.0% p = 0.955
Black or African-‐American 12.5% 12.6% 12.5%
Other 0.5% 0.5% 0.5%
Urbanicity of District
Enrollment > 40,000 33.5% 34.6% p = 0.079 34.7% p = 0.400
10,000 < E < 40,000 25.2% 25.1% 24.2%
5,000 < E < 10,000 17.4% 17.1% 17.0%
Enrollment < 5,000 23.9% 23.2% 24.1%
Tier
Elementary School 43.5% 43.2% p = 0.887 43.7% p = 0.674
Middle School 18.7% 19.1% 18.4%
High School 25.3% 25.4% 25.5%
K-‐8 8.4% 8.3% 8.6%
K-‐12 1.4% 1.4% 1.5%
Other 2.6% 2.6% 2.3%
Years Experience
0 to 3 years 22.1% 22.3% p = 0.904 18.1% p < 0.001
4 to 6 years 13.9% 14.0% 12.9%
7 to 10 years 15.0% 15.3% 15.2%
11 to 17 years 21.6% 21.2% 23.4%
18 to 25 years 14.1% 14.0% 15.9%
Over 26 years 13.3% 13.2% 14.4%
2012 Final Evaluation Rating*
1 0.3% 0.3% p = 0.836 0.3% p = 0.544
2 6.8% 6.9% 6.6%
3 20.2% 20.2% 20.8%
4 31.9% 31.4% 30.3%
5 40.8% 41.2% 41.9%
*Of the teachers in the sampling frame who were invited to participate in the Professional Development Module, 9,907 (86.1% of all invitees) could be matched to a 2012 final evaluation rating. Of those, there were 3,987 respondents.
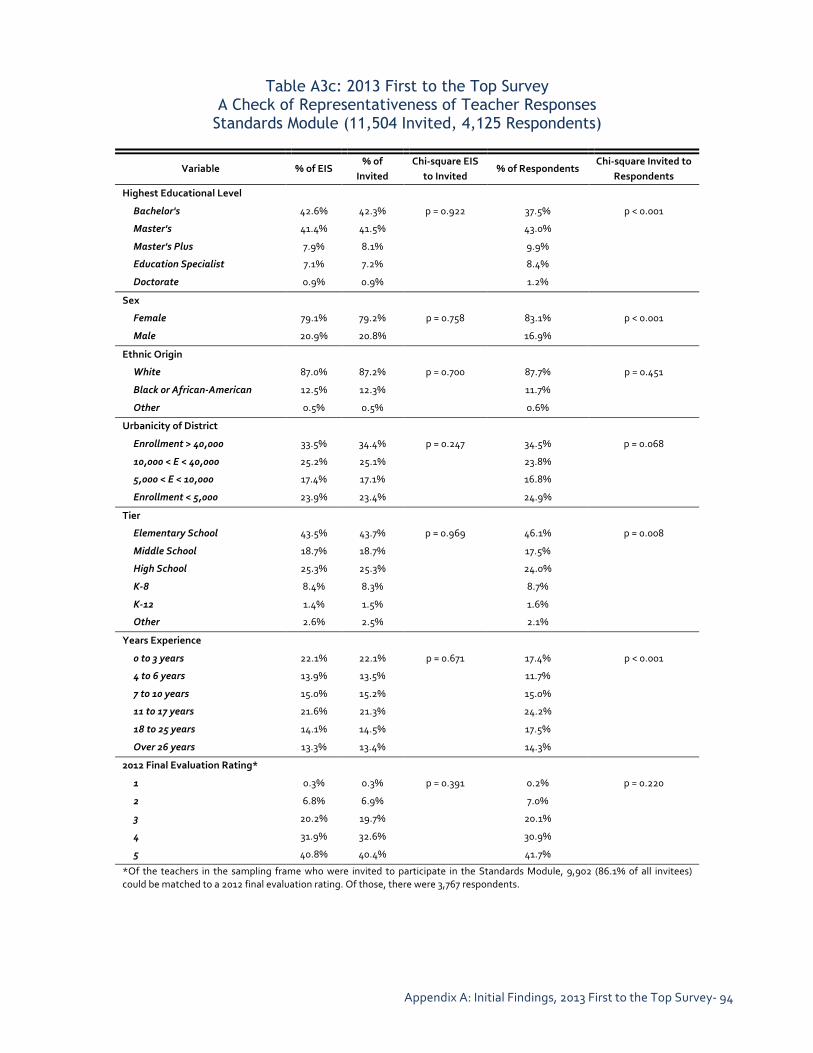
Appendix A: Initial Findings, 2013 First to the Top Survey-‐ 94
Table A3c: 2013 First to the Top Survey A Check of Representativeness of Teacher Responses
Standards Module (11,504 Invited, 4,125 Respondents)
Variable % of EIS % of
Invited Chi-‐square EIS
to Invited % of Respondents
Chi-‐square Invited to Respondents
Highest Educational Level
Bachelor's 42.6% 42.3% p = 0.922 37.5% p < 0.001
Master's 41.4% 41.5% 43.0%
Master's Plus 7.9% 8.1% 9.9%
Education Specialist 7.1% 7.2% 8.4%
Doctorate 0.9% 0.9% 1.2%
Sex
Female 79.1% 79.2% p = 0.758 83.1% p < 0.001
Male 20.9% 20.8% 16.9%
Ethnic Origin
White 87.0% 87.2% p = 0.700 87.7% p = 0.451
Black or African-‐American 12.5% 12.3% 11.7%
Other 0.5% 0.5% 0.6%
Urbanicity of District
Enrollment > 40,000 33.5% 34.4% p = 0.247 34.5% p = 0.068
10,000 < E < 40,000 25.2% 25.1% 23.8%
5,000 < E < 10,000 17.4% 17.1% 16.8%
Enrollment < 5,000 23.9% 23.4% 24.9%
Tier
Elementary School 43.5% 43.7% p = 0.969 46.1% p = 0.008
Middle School 18.7% 18.7% 17.5%
High School 25.3% 25.3% 24.0%
K-‐8 8.4% 8.3% 8.7%
K-‐12 1.4% 1.5% 1.6%
Other 2.6% 2.5% 2.1%
Years Experience
0 to 3 years 22.1% 22.1% p = 0.671 17.4% p < 0.001
4 to 6 years 13.9% 13.5% 11.7%
7 to 10 years 15.0% 15.2% 15.0%
11 to 17 years 21.6% 21.3% 24.2%
18 to 25 years 14.1% 14.5% 17.5%
Over 26 years 13.3% 13.4% 14.3%
2012 Final Evaluation Rating*
1 0.3% 0.3% p = 0.391 0.2% p = 0.220
2 6.8% 6.9% 7.0%
3 20.2% 19.7% 20.1%
4 31.9% 32.6% 30.9%
5 40.8% 40.4% 41.7%
*Of the teachers in the sampling frame who were invited to participate in the Standards Module, 9,902 (86.1% of all invitees) could be matched to a 2012 final evaluation rating. Of those, there were 3,767 respondents.
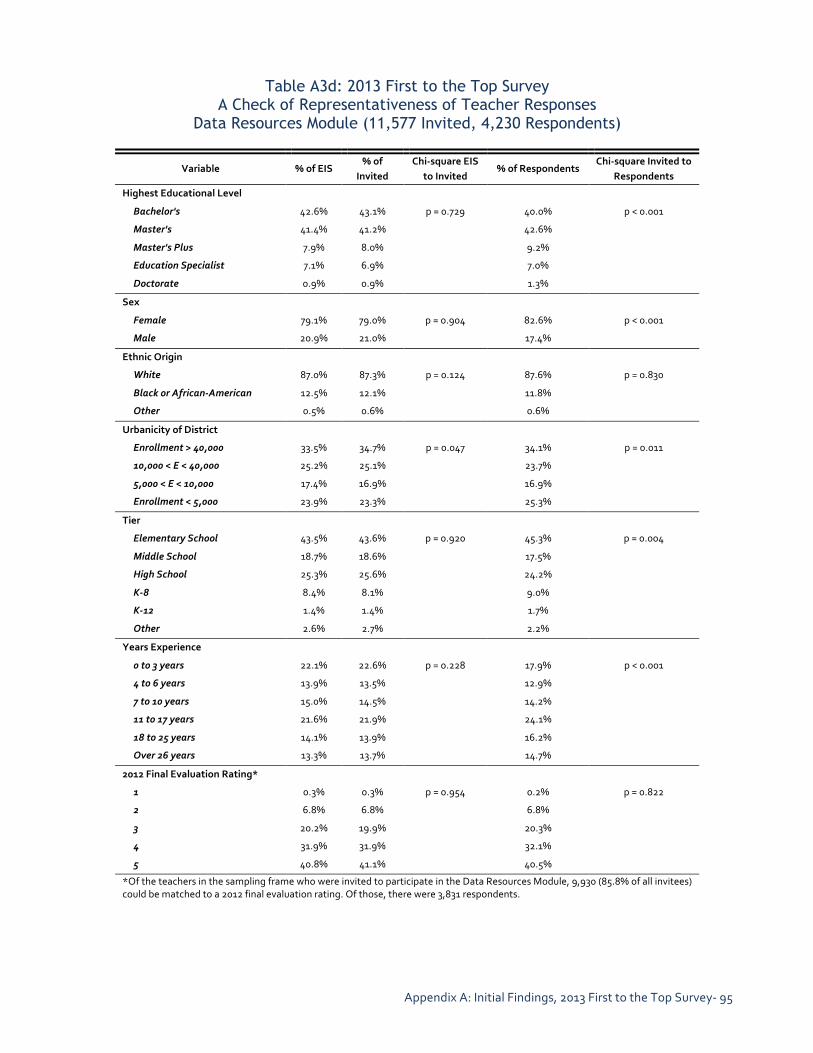
Appendix A: Initial Findings, 2013 First to the Top Survey-‐ 95
Table A3d: 2013 First to the Top Survey A Check of Representativeness of Teacher Responses
Data Resources Module (11,577 Invited, 4,230 Respondents)
Variable % of EIS % of
Invited Chi-‐square EIS
to Invited % of Respondents
Chi-‐square Invited to Respondents
Highest Educational Level
Bachelor's 42.6% 43.1% p = 0.729 40.0% p < 0.001
Master's 41.4% 41.2% 42.6%
Master's Plus 7.9% 8.0% 9.2%
Education Specialist 7.1% 6.9% 7.0%
Doctorate 0.9% 0.9% 1.3%
Sex
Female 79.1% 79.0% p = 0.904 82.6% p < 0.001
Male 20.9% 21.0% 17.4%
Ethnic Origin
White 87.0% 87.3% p = 0.124 87.6% p = 0.830
Black or African-‐American 12.5% 12.1% 11.8%
Other 0.5% 0.6% 0.6%
Urbanicity of District
Enrollment > 40,000 33.5% 34.7% p = 0.047 34.1% p = 0.011
10,000 < E < 40,000 25.2% 25.1% 23.7%
5,000 < E < 10,000 17.4% 16.9% 16.9%
Enrollment < 5,000 23.9% 23.3% 25.3%
Tier
Elementary School 43.5% 43.6% p = 0.920 45.3% p = 0.004
Middle School 18.7% 18.6% 17.5%
High School 25.3% 25.6% 24.2%
K-‐8 8.4% 8.1% 9.0%
K-‐12 1.4% 1.4% 1.7%
Other 2.6% 2.7% 2.2%
Years Experience
0 to 3 years 22.1% 22.6% p = 0.228 17.9% p < 0.001
4 to 6 years 13.9% 13.5% 12.9%
7 to 10 years 15.0% 14.5% 14.2%
11 to 17 years 21.6% 21.9% 24.1%
18 to 25 years 14.1% 13.9% 16.2%
Over 26 years 13.3% 13.7% 14.7%
2012 Final Evaluation Rating*
1 0.3% 0.3% p = 0.954 0.2% p = 0.822
2 6.8% 6.8% 6.8%
3 20.2% 19.9% 20.3%
4 31.9% 31.9% 32.1%
5 40.8% 41.1% 40.5%
*Of the teachers in the sampling frame who were invited to participate in the Data Resources Module, 9,930 (85.8% of all invitees) could be matched to a 2012 final evaluation rating. Of those, there were 3,831 respondents.

Appendix A: Initial Findings, 2013 First to the Top Survey-‐ 96
Table A3e: 2013 First to the Top Survey A Check of Representativeness of Teacher Responses
Instructional Practices Module (11,512 Invited, 4,346 Respondents)
Variable % of EIS % of
Invited Chi-‐square EIS
to Invited % of Respondents
Chi-‐square Invited to Respondents
Highest Educational Level
Bachelor's 42.6% 42.5% p = 0.512 38.5% p < 0.001
Master's 41.4% 41.8% 43.4%
Master's Plus 7.9% 8.1% 9.4%
Education Specialist 7.1% 6.7% 7.7%
Doctorate 0.9% 0.9% 1.0%
Sex
Female 79.1% 79.2% p = 0.846 82.5% p < 0.001
Male 20.9% 20.8% 17.5%
Ethnic Origin
White 87.0% 86.5% p = 0.331 86.8% p = 0.763
Black or African-‐American 12.5% 13.0% 12.8%
Other 0.5% 0.5% 0.5%
Urbanicity of District
Enrollment > 40,000 33.5% 34.3% p = 0.286 33.4% p = 0.141
10,000 < E < 40,000 25.2% 24.9% 24.2%
5,000 < E < 10,000 17.4% 17.1% 17.3%
Enrollment < 5,000 23.9% 23.7% 25.1%
Tier
Elementary School 43.5% 43.5% p = 0.913 45.3% p = 0.019
Middle School 18.7% 19.0% 17.9%
High School 25.3% 25.2% 24.7%
K-‐8 8.4% 8.4% 8.9%
K-‐12 1.4% 1.4% 1.3%
Other 2.6% 2.5% 2.0%
Years Experience
0 to 3 years 22.1% 22.1% p = 0.555 18.0% p < 0.001
4 to 6 years 13.9% 13.9% 12.6%
7 to 10 years 15.0% 15.5% 15.6%
11 to 17 years 21.6% 21.6% 23.5%
18 to 25 years 14.1% 14.0% 16.6%
Over 26 years 13.3% 12.8% 13.8%
2012 Final Evaluation Rating*
1 0.3% 0.3% p = 0.690 0.3% p = 0.401
2 6.8% 7.1% 6.3%
3 20.2% 20.5% 20.8%
4 31.9% 31.6% 32.2%
5 40.8% 40.4% 40.4%
*Of the teachers in the sampling frame who were invited to participate in the Instructional Practices Module, 9,844 (85.5% of all invitees) could be matched to a 2012 final evaluation rating. Of those, there were 3,905 respondents.
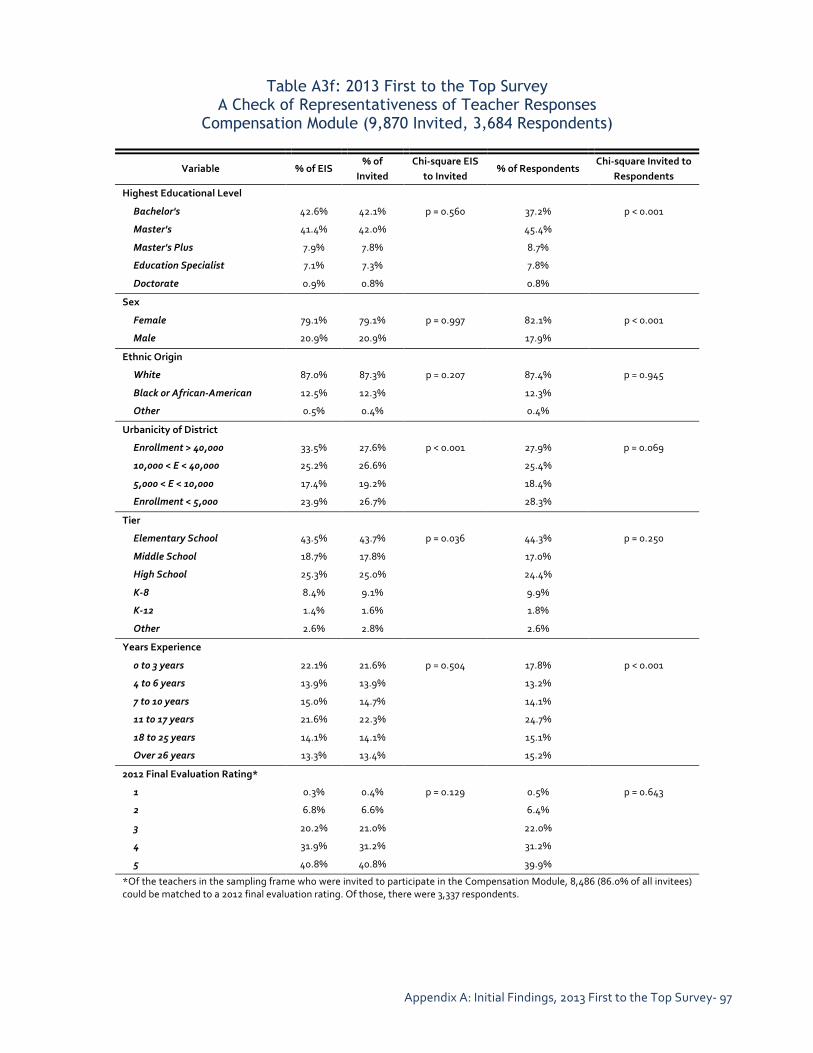
Appendix A: Initial Findings, 2013 First to the Top Survey-‐ 97
Table A3f: 2013 First to the Top Survey A Check of Representativeness of Teacher Responses
Compensation Module (9,870 Invited, 3,684 Respondents)
Variable % of EIS % of
Invited Chi-‐square EIS
to Invited % of Respondents
Chi-‐square Invited to Respondents
Highest Educational Level
Bachelor's 42.6% 42.1% p = 0.560 37.2% p < 0.001
Master's 41.4% 42.0% 45.4%
Master's Plus 7.9% 7.8% 8.7%
Education Specialist 7.1% 7.3% 7.8%
Doctorate 0.9% 0.8% 0.8%
Sex
Female 79.1% 79.1% p = 0.997 82.1% p < 0.001
Male 20.9% 20.9% 17.9%
Ethnic Origin
White 87.0% 87.3% p = 0.207 87.4% p = 0.945
Black or African-‐American 12.5% 12.3% 12.3%
Other 0.5% 0.4% 0.4%
Urbanicity of District
Enrollment > 40,000 33.5% 27.6% p < 0.001 27.9% p = 0.069
10,000 < E < 40,000 25.2% 26.6% 25.4%
5,000 < E < 10,000 17.4% 19.2% 18.4%
Enrollment < 5,000 23.9% 26.7% 28.3%
Tier
Elementary School 43.5% 43.7% p = 0.036 44.3% p = 0.250
Middle School 18.7% 17.8% 17.0%
High School 25.3% 25.0% 24.4%
K-‐8 8.4% 9.1% 9.9%
K-‐12 1.4% 1.6% 1.8%
Other 2.6% 2.8% 2.6%
Years Experience
0 to 3 years 22.1% 21.6% p = 0.504 17.8% p < 0.001
4 to 6 years 13.9% 13.9% 13.2%
7 to 10 years 15.0% 14.7% 14.1%
11 to 17 years 21.6% 22.3% 24.7%
18 to 25 years 14.1% 14.1% 15.1%
Over 26 years 13.3% 13.4% 15.2%
2012 Final Evaluation Rating*
1 0.3% 0.4% p = 0.129 0.5% p = 0.643
2 6.8% 6.6% 6.4%
3 20.2% 21.0% 22.0%
4 31.9% 31.2% 31.2%
5 40.8% 40.8% 39.9%
*Of the teachers in the sampling frame who were invited to participate in the Compensation Module, 8,486 (86.0% of all invitees) could be matched to a 2012 final evaluation rating. Of those, there were 3,337 respondents.

Appendix A: Initial Findings, 2013 First to the Top Survey-‐ 98
Figure A1
Return Figure A2
Return
0.0%
10.0%
20.0%
30.0%
40.0%
50.0%
60.0%
70.0%
80.0%
90.0%
Female Male
Gender of Teachers and FTTT Teacher Respondents
In Population Teacher Respondents
0.0% 5.0% 10.0% 15.0% 20.0% 25.0% 30.0% 35.0% 40.0% 45.0% 50.0%
BA MA MA+ EDS PHD
Education Level of Teachers and FTTT Teacher Respondents
In Population Teacher Respondents

Appendix A: Initial Findings, 2013 First to the Top Survey-‐ 99
Figure A3
Return
Figure A4
Return
0.0%
10.0%
20.0%
30.0%
40.0%
50.0%
60.0%
70.0%
Female Male
Gender of Building Admins and FTTT Admin Respondents Minus Memphis
In Population Admin Respondents
0.0%
10.0%
20.0%
30.0%
40.0%
50.0%
60.0%
70.0%
80.0%
90.0%
Female Male
Gender of Teachers and FTTT Teacher Respondents
In Population Teacher Respondents
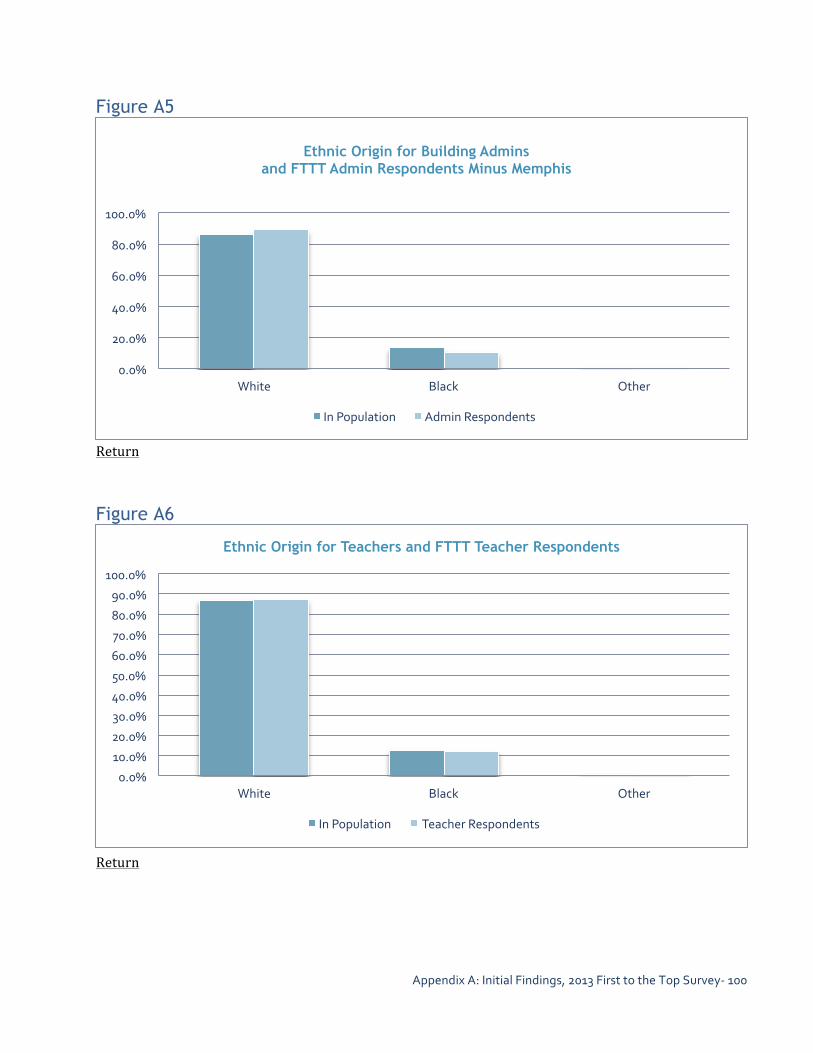
Appendix A: Initial Findings, 2013 First to the Top Survey-‐ 100
Figure A5
Return Figure A6
Return
0.0%
20.0%
40.0%
60.0%
80.0%
100.0%
White Black Other
Ethnic Origin for Building Admins and FTTT Admin Respondents Minus Memphis
In Population Admin Respondents
0.0%
10.0%
20.0%
30.0%
40.0%
50.0%
60.0%
70.0%
80.0%
90.0%
100.0%
White Black Other
Ethnic Origin for Teachers and FTTT Teacher Respondents
In Population Teacher Respondents

Appendix A: Initial Findings, 2013 First to the Top Survey-‐ 101
Figure A7
Return Figure A8
Return
0.0%
5.0%
10.0%
15.0%
20.0%
25.0%
30.0%
35.0%
> 40k 10k to 40k 5k to 10k < 5k
Urbanicity of Building Admins and FTTT Admin Respondents Minus Memphis
In Population Admin Respondents
0.0%
5.0%
10.0%
15.0%
20.0%
25.0%
30.0%
35.0%
40.0%
> 40k 10k to 40k 5k to 10k < 5k
Urbanicity of Teachers and FTTT Teacher Respondents
In Population Teacher Respondents

Appendix A: Initial Findings, 2013 First to the Top Survey-‐ 102
Figure A9
Return Figure A10
Return
0.0%
5.0%
10.0%
15.0%
20.0%
25.0%
30.0%
35.0%
40.0%
45.0%
Elem Middle High K-‐8 K-‐12 Other
Tier for Building Admins and FTTT Admin Respondents Minus Memphis
In Population Admin Respondents
0.0% 5.0%
10.0% 15.0% 20.0% 25.0% 30.0% 35.0% 40.0% 45.0% 50.0%
Elem Middle High K-‐8 K-‐12 Other
Tier for Teachers and FTTT Teacher Respondents
In Population Teacher Respondents
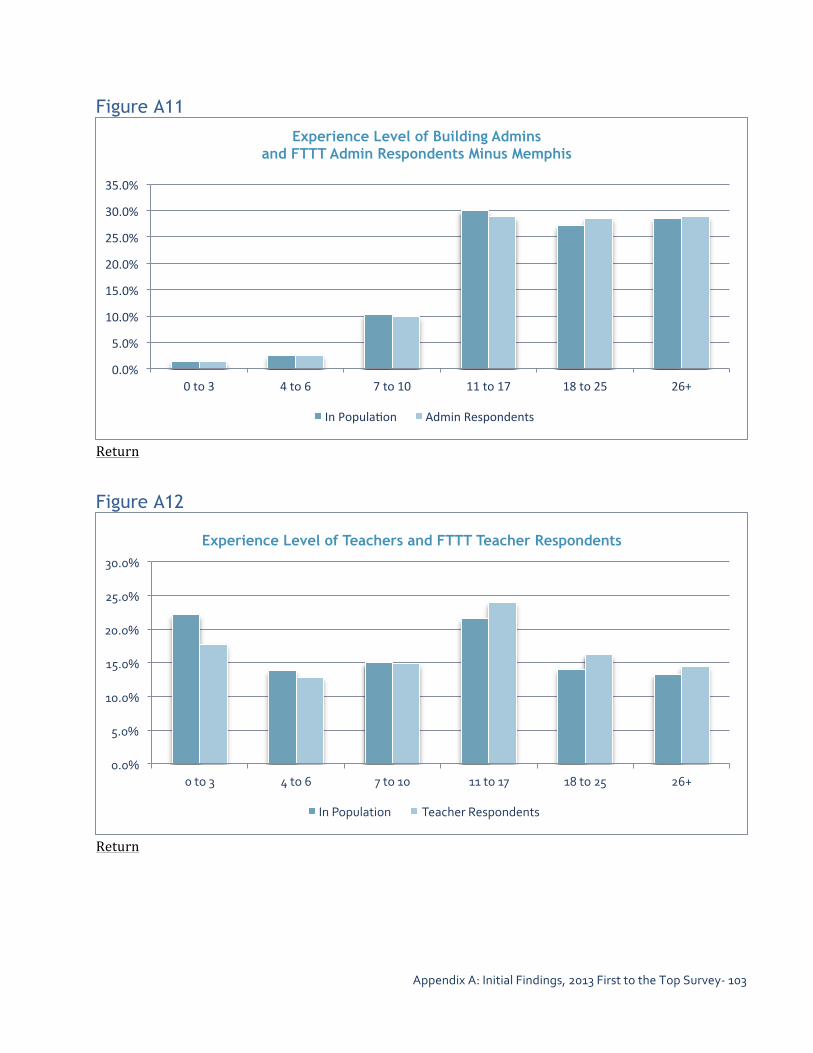
Appendix A: Initial Findings, 2013 First to the Top Survey-‐ 103
Figure A11
Return Figure A12
Return
0.0%
5.0%
10.0%
15.0%
20.0%
25.0%
30.0%
35.0%
0 to 3 4 to 6 7 to 10 11 to 17 18 to 25 26+
Experience Level of Building Admins and FTTT Admin Respondents Minus Memphis
In Popula8on Admin Respondents
0.0%
5.0%
10.0%
15.0%
20.0%
25.0%
30.0%
0 to 3 4 to 6 7 to 10 11 to 17 18 to 25 26+
Experience Level of Teachers and FTTT Teacher Respondents
In Population Teacher Respondents

Appendix A: Initial Findings, 2013 First to the Top Survey-‐ 104
Figure A13
Return Figure A14
Return
0.0% 5.0%
10.0% 15.0% 20.0% 25.0% 30.0% 35.0% 40.0% 45.0%
1 2 3 4 5
2012 Final Evaluation Rating of Building Admins and FTTT Admin Respondents Minus Memphis
In Sampling Frame Administrator Respondents
0.0% 5.0%
10.0% 15.0% 20.0% 25.0% 30.0% 35.0% 40.0% 45.0%
1 2 3 4 5
2012 Final Evaluation Rating of Teachers and FTTT Teacher Respondents
In Sampling Frame Teacher Respondents

This page intentionally left blank.

Appendix B: Initial Findings, 2013 First to the Top Survey-‐ 105
APPENDIX B Tennessee First to the Top Survey for Teachers and Administrators, Spring 2013
Tennessee’s Consortium on Research, Evaluation, and Development (the Consortium) is responsible for carrying out a detailed, focused program of research as part of Tennessee’s Race to the Top grant. The 2013 First to the Top Survey is one of the primary research instruments designed to inform the Consortium’s evaluation work generally, and most specifically, evaluation of Tennessee’s educator evaluation program. This 20-‐minute survey, open from late April through the end of May 2013, enables both Consortium researchers and the Tennessee Department of Education (TDOE) to better understand Tennessee educators’ perceptions of and experiences with teacher and administrator evaluation across Tennessee.
I. DATA SOURCES AND MODULE STRUCTURE Survey invitations were sent to the 75,627 certified Tennessee educators who both appeared as school-‐based personnel within the TDOE Education Information System and who were linked to an email address within the TDOE CODE database. Educator email addresses were linked within a constructed file to a variety of demographic and evaluation data stored within EIS and CODE, including gender, ethnicity, years educational experience, highest educational level, evaluation role, and regional service center. In order to minimize the burden of survey-‐takers, educators were randomly assigned to take one of six survey versions. Each version of the survey contained the same core questions that investigated aspects of the evaluation model used within the educator’s school. Each version also contained a distinct module that covered one of the following topics: Great Teachers and Leaders, Professional Development, Data Systems and Resources to Support Instruction, Standards and Assessment and Knowledge of and Attitudes Towards Reform, Instructional Practices and Testing, and Teacher Compensation.38 Through this method, a wide range of survey topics could be investigated while also limiting the survey’s length.
II. SURVEY STRUCTURE All educators – including teachers, administrators, and certified support staff such as librarians and counselors – took the same survey because branching structures within the survey sent educators into distinct question pathways depending on their responses. A visual presentation 38A small subset of Tennessee schools that are participating within a TIF grant had already been surveyed within 2011-‐12 on the questions included within the Compensation Module, and were randomly assigned to one of the five non-‐compensation modules.
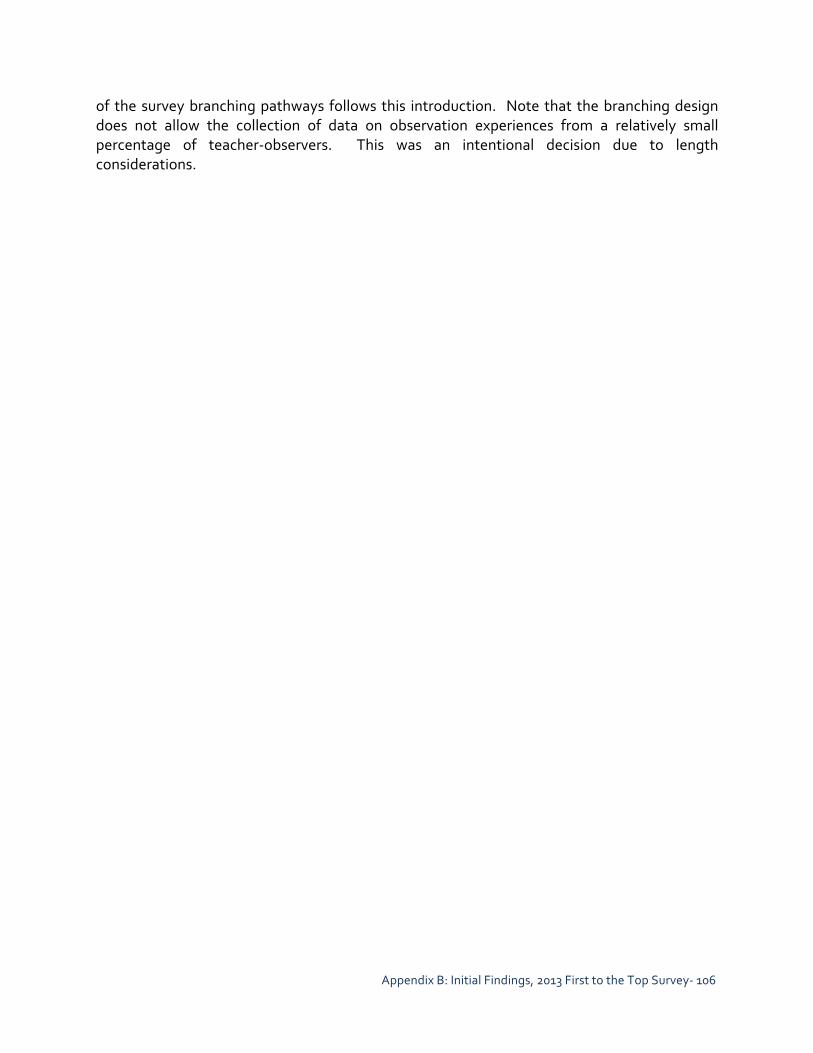
Appendix B: Initial Findings, 2013 First to the Top Survey-‐ 106
of the survey branching pathways follows this introduction. Note that the branching design does not allow the collection of data on observation experiences from a relatively small percentage of teacher-‐observers. This was an intentional decision due to length considerations.

Appendix B: Initial Findings, 2013 First to the Top Survey-‐ 107
MODEL POSITION DEMOGRAPHICS ROLE
EVALUATION
QUESTIONS
COMMON CORE
QUESTIONS
MODULES
MODULES
OB
SER
VED
OBS
ERV
ERS
AD
MIN
ISTR
ATO
RS
OBS
ERV
ERS
NO
N-A
DM
INIS
TRA
TOR
S
JOB
SATISFACTION
PREPOPULATED BY
DISTRICT AND
EVALUATION
MODEL:Q1-Q2
STRUCTURE AND BRANCHING PATHWAYS OF THE
TENNESSEE FIRST TO THE TOP SURVEY - SPRING 2013
CURRENT
EDUCATOR
POSITION: Q3
NON-TEACHER
DEMOGRAPHICS: Q7-Q10
TEACHER
DEMOGRAPHICS: Q4-Q6
CENTRAL OFFICE
STAFF, PERSONNEL AT
MORE THAN ONE
SCHOOL
EXIT SURVEY
OBS
ERVE
D
JOB
SATI
SFA
CTIO
N:
Q51
-54
EXIT
SUR
VEY
OB
SER
VER
JOB
SATI
SFA
CTIO
N:
Q83
-86
EXIT
SUR
VEY
ADMIN EVALUATION
PERCEPTIONS & EXPERIENCES:
Q55-59
TEACHER EVALUATION
PERCEPTIONS & EXPERIENCES:
Q60-78
OBSERVER
QUESTIONS RE:MODULE
TOPICS: Q79-82
GREAT TEACHERS AND
LEADERS: 37 QUESTIONS
PROF. DEVELOPMENT: 37 QUESTIONS
DATA SYSTEMS & REFORM:38 QUESTIONS
STANDARDS AND ASSESS-MENT: 22 QUESTIONS
INST. PRACTICES & TEACHING: 21 QUESTIONS
TEACHER COMPENSATION:14 QUESTIONS
NEVER
OBSERVED
EXIT
SURVEY
EVALUATION
PERCEPTIONS & EXPERIENCES:
Q12-47
COMMON CORE
STANDARDS:Q48-50
INDICATES
BRANCHING
QUESTIONS
SERVES
AS
OBSERVER:Q11
SCHOOL-BASED
NON-TEACHERS
TEACHERS
NO
YES
NO
YES
YES
EVALUATIONQUESTIONS

Appendix B: Initial Findings, 2013 First to the Top Survey-‐ 108
Tennessee First to the Top Survey for Teachers and Administrators Spring 2013 * Required Information Tennessee's Consortium on Research, Evaluation, and Development (the Consortium) is responsible for carrying out a detailed, focused program of research as part of Tennessee's Race to the Top grant. This survey will collect information regarding perceptions and experiences related to educator evaluation in Tennessee. Professor Matthew G. Springer at Vanderbilt University is Director of the Consortium and the principal investigator for this research study. Your feedback regarding Tennessee's evaluation efforts will enable us to better understand your personal views and experiences with Tennessee's new evaluation models. This feedback will also be provided in an aggregated form to the Tennessee Department of Education as they consider future revisions to the evaluation process. Survey results from the 2011-‐12 school year were utilized by the Tennessee Department of Education in its review and modification of evaluation models, and many of the questions on this survey are specifically designed to probe teacher perceptions on potential modifications. You may view a Short Report of the 2011-‐12 survey results by clicking here. Your completion of this survey is voluntary, and you may refuse to answer specific questions if you do not wish to answer them. The information you provide will be kept strictly confidential. We will not share individual responses with state, district, or school level staff or anyone else outside the project, except as required by law. We will not identify any individuals by name in our study reports; your responses will be combined with others and, as stated above, reported only in the aggregate. At the end of the study, we will destroy any personally identifiable information. It should take you approximately 20 minutes to complete this survey. We ask that you complete the survey between now and May 17, 2013. If you have questions about the survey or about technical issues, or if you have questions about the Consortium generally or about our work regarding teacher and principal evaluation, please contact us via email ([email protected]) or by phone (615-‐322-‐5538). Thank you for your participation!

Appendix B: Initial Findings, 2013 First to the Top Survey-‐ 109
1. [POPULATED: Respondent does not see this question] Evaluator Model a. 1 b. 2 c. 3

Appendix B: Initial Findings, 2013 First to the Top Survey-‐ 110
2. [PRE-‐POPULATED: Respondent does not see this question] Evaluator District a. 171 b. 51 c. 10 d. 541 e. 20 f. 172 g. 30 h. 40 i. 50 j. 274 k. 60 l. 821 m. 70 n. 80 o. 90 p. 100 q. 110 r. 120 s. 130 t. 140 u. 61 v. 11 w. 150 x. 160 y. 170 z. 180 aa. 190 bb. 721 cc. 200 dd. 210 ee. 220 ff. 230 gg. 231 hh. 101
ii. 542 jj. 240 kk. 521 ll. 250 mm. 260 nn. 941 oo. 275 pp. 280 qq. 290 rr. 300 ss. 301 tt. 310 uu. 320 vv. 330 ww. 340 xx. 350 yy. 360 zz. 370 aaa. 380 bbb. 390 ccc. 400 ddd. 410 eee. 92 fff. 420 ggg. 271 hhh. 430 iii. 93 jjj. 450 kkk. 901 lll. 460 mmm. 822 nnn. 470 ooo. 480 ppp. 490
qqq. 500 rrr. 951 sss. 531 ttt. 510 uuu. 391 vvv. 520 www. 530 xxx. 560 yyy. 570 zzz. 161 aaaa. 580 bbbb. 590 cccc. 52 dddd. 600 eeee. 94 ffff. 540 gggg. 550 hhhh. 610 iiii. 791 jjjj. 272 kkkk. 620 llll. 630 mmmm. 640 nnnn. 650 oooo. 751 pppp. 151 qqqq. 12 rrrr. 660 ssss. 761 tttt. 670 uuuu. 401 vvvv. 680 wwww. 690 xxxx. 700
yyyy. 710 zzzz. 720 aaaaa. 581 bbbbb. 730 ccccc. 740 ddddd. 371 eeeee. 750 fffff. 760 ggggg. 770 hhhhh. 780 iiiii. 790 jjjjj. 800 kkkkk. 95 lllll. 999 mmmmm. 810 nnnnn. 820 ooooo. 830 ppppp. 621 qqqqq. 840 rrrrr. 273 sssss. 850 ttttt. 162 uuuuu. 860 vvvvv. 661 wwwww. 870 xxxxx. 880 yyyyy. 890 zzzzz. 900 aaaaaa. 910 bbbbbb. 920 cccccc. 97 dddddd. 930 eeeeee. 940 ffffff. 950

Appendix B: Initial Findings, 2013 First to the Top Survey-‐ 111
3. *Please select the option below that best describes your professional position/role during the 2012-‐2013 school year. a. Principal of a single school Go to Question 7 b. Assistant principal or vice principal of a single school Go to Question 7 c. Instructional coach/mentor, reading/math specialist, etc. at
a single school (you serve in one of these capacities at least 50% of your time) Go to Question 7
d. Teacher CONTINUE to Question 4 e. Central office staff member Go to Question 87 f. A position that has responsibilities at more than one
School Go to Question 87 g. Other (please specify) _____________ Go to Question 7
4. Including this school year (2012-‐2013), how many years have you worked as a teacher in
your current school? a. 1 b. 2 c. 3 d. 4 e. 5 f. 6 g. 7 h. 8 i. 9 j. 10 k. 11 l. 12 m. 13 n. 14 o. 15 p. 16 q. 17 r. 18 s. 19 t. 20 u. 21 v. 22 w. 23 x. 24 y. 25 z. 26 aa. 27 bb. 28 cc. 29 dd. 30 ee. 31 ff. 32 gg. 33 hh. 34 ii. 35 jj. 36 kk. 37 ll. 38 mm. 39 nn. 40 oo. 41 pp. 42 qq. 43 rr. 44 ss. 45 tt. 46 uu. 47 vv. 48 ww. 49 xx. 50
5. Do any of your students take either the TCAP Achievement or TCAP End Of Course
assessment? a. Yes b. No
6. Are you teaching in a grade and subject area this year that will result in you receiving
your own teacher-‐level TVAAS score? a. Yes Go to Question 11 b. No Go to Question 11 c. I don’t know Go to Question 11

Appendix B: Initial Findings, 2013 First to the Top Survey-‐ 112
7. Including this school year (2012-‐2013), how many years have you held a position like your current one (e.g., principal, assistant principal, instructional coach/mentor, reading/math specialist, etc.)? a. Overall a. 1 b. 2 c. 3 d. 4 e. 5 f. 6 g. 7 h. 8 i. 9 j. 10 k. 11 l. 12 m. 13 n. 14 o. 15 p. 16 q. 17 r. 18 s. 19 t. 20 u. 21 v. 22 w. 23 x. 24 y. 25 z. 26 aa. 27 bb. 28 cc. 29 dd. 30 ee. 31 ff. 32 gg. 33 hh. 34 ii. 35 jj. 36 kk. 37 ll. 38 mm. 39 nn. 40 oo. 41 pp. 42 qq. 43 rr. 44 ss. 45 tt. 46 uu. 47 vv. 48 ww. 49 xx. 50
b. In your present school a. 1 b. 2 c. 3 d. 4 e. 5 f. 6 g. 7 h. 8 i. 9 j. 10 k. 11 l. 12 m. 13 n. 14 o. 15 p. 16 q. 17 r. 18 s. 19 t. 20 u. 21 v. 22 w. 23 x. 24 y. 25 z. 26 aa. 27 bb. 28 cc. 29 dd. 30 ee. 31 ff. 32 gg. 33 hh. 34 ii. 35 jj. 36 kk. 37 ll. 38 mm. 39 nn. 40 oo. 41 pp. 42 qq. 43 rr. 44 ss. 45 tt. 46 uu. 47 vv. 48 ww. 49 xx. 50
8. How many years have you worked as a teacher? (If you have never worked as a
teacher, please answer “0”.) a. Years (Select one option) a. 0 (I have never worked as a teacher) Go to Question 11 b. 1 c. 2 d. 3 e. 4 f. 5 g. 6 h. 7 i. 8 j. 9 k. 10 l. 11 m. 12 n. 13 o. 14 p. 15 q. 16 r. 17 s. 18 t. 19 u. 20 v. 21 w. 22 x. 23 y. 24 z. 25 aa. 26 bb. 27 cc. 28 dd. 29 ee. 30 ff. 31 gg. 32 hh. 33 ii. 34 jj. 35 kk. 36 ll. 37 mm. 38 nn. 39 oo. 40 pp. 41 qq. 42 rr. 43 ss. 44 tt. 45 uu. 46 vv. 47 ww. 48 xx. 49 yy. 50
Appendix B: Initial Findings, 2013 First to the Top Survey-‐ 113
9. At which level(s) have you worked as a teacher? Mark all that apply. a. Early childhood d. High School b. Elementary e. Other c. Middle/Junior High
10. Which subjects did you teach? Mark all that apply. a. Self-‐contained classroom teacher (all core subjects) |__| b. English / language arts / reading |__| c. Mathematics |__| d. Science |__| e. Social studies or history |__| f. Foreign language |__| g. English as a second language (ESL) or special instruction for English
language learners (ELL) or limited English proficient (LEP) students |__| h. Visual or performing arts |__| i. Special education |__| j. Physical education |__| k. Other |__|
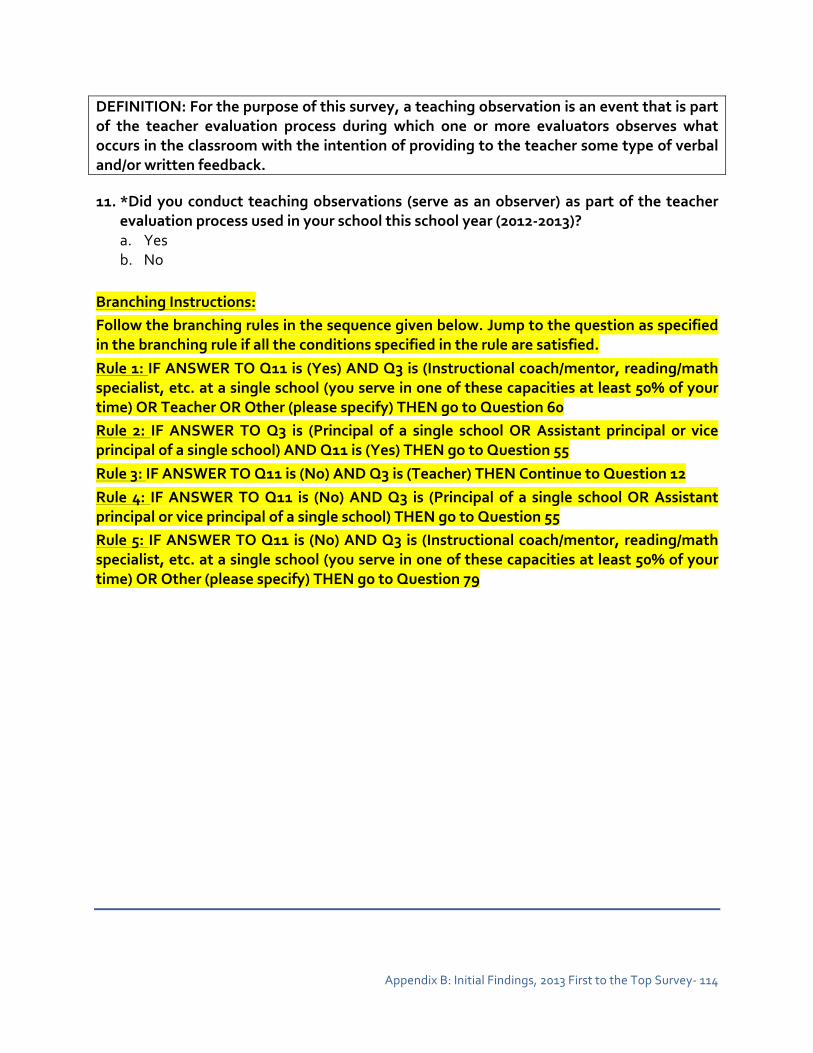
Appendix B: Initial Findings, 2013 First to the Top Survey-‐ 114
DEFINITION: For the purpose of this survey, a teaching observation is an event that is part of the teacher evaluation process during which one or more evaluators observes what occurs in the classroom with the intention of providing to the teacher some type of verbal and/or written feedback. 11. *Did you conduct teaching observations (serve as an observer) as part of the teacher
evaluation process used in your school this school year (2012-‐2013)? a. Yes b. No
Branching Instructions: Follow the branching rules in the sequence given below. Jump to the question as specified in the branching rule if all the conditions specified in the rule are satisfied. Rule 1: IF ANSWER TO Q11 is (Yes) AND Q3 is (Instructional coach/mentor, reading/math specialist, etc. at a single school (you serve in one of these capacities at least 50% of your time) OR Teacher OR Other (please specify) THEN go to Question 60 Rule 2: IF ANSWER TO Q3 is (Principal of a single school OR Assistant principal or vice principal of a single school) AND Q11 is (Yes) THEN go to Question 55 Rule 3: IF ANSWER TO Q11 is (No) AND Q3 is (Teacher) THEN Continue to Question 12 Rule 4: IF ANSWER TO Q11 is (No) AND Q3 is (Principal of a single school OR Assistant principal or vice principal of a single school) THEN go to Question 55 Rule 5: IF ANSWER TO Q11 is (No) AND Q3 is (Instructional coach/mentor, reading/math specialist, etc. at a single school (you serve in one of these capacities at least 50% of your time) OR Other (please specify) THEN go to Question 79

Appendix B: Initial Findings, 2013 First to the Top Survey-‐ 115
Part I: Questions for Teachers
12. *Has your teaching been observed this year as part of the teacher evaluation process used at your school? a. Yes Continue to Question 13 b. No Go to Question 40
13. Who has observed your teaching this year (2012-‐2013) as part of the teacher evaluation
process? Mark all that apply. a. A principal b. An assistant or vice principal c. A department head d. An instructional coach e. A senior teacher from the school, such as a mentor, master, or lead teacher f. An observer not working at your school g. Other (please specify)
14. How much TOTAL TIME have you spent on the following activities related to
observations of your teaching during this school year (2012-‐2032)?
0 minutes
Less than 1 hour
1 to 2 hours
2 to 3 hours
3 to 5 hours
Over 5 hours
a. Preparation for observations 1 2 3 4 5 6 b. Pre-‐conferences 1 2 3 4 5 6 c. Being observed 1 2 3 4 5 6 d. Receiving and/or reviewing
feedback from observations 1 2 3 4 5 6
Branching Instructions Follow the branching rules in the sequence given below. Jump to the question as specified in the branching rule if all the conditions specified in the rule are satisfied. Rule 1: IF ANSWER TO Q1 is (1) THEN go to Question 15 Rule 2: IF ANSWER TO Q1 is (2) THEN go to Question 16 Rule 3: IF ANSWER TO Q1 is (3) THEN go to Question 17 Rule 4: IF ANSWER TO Q1 is (4) THEN go to Question 18
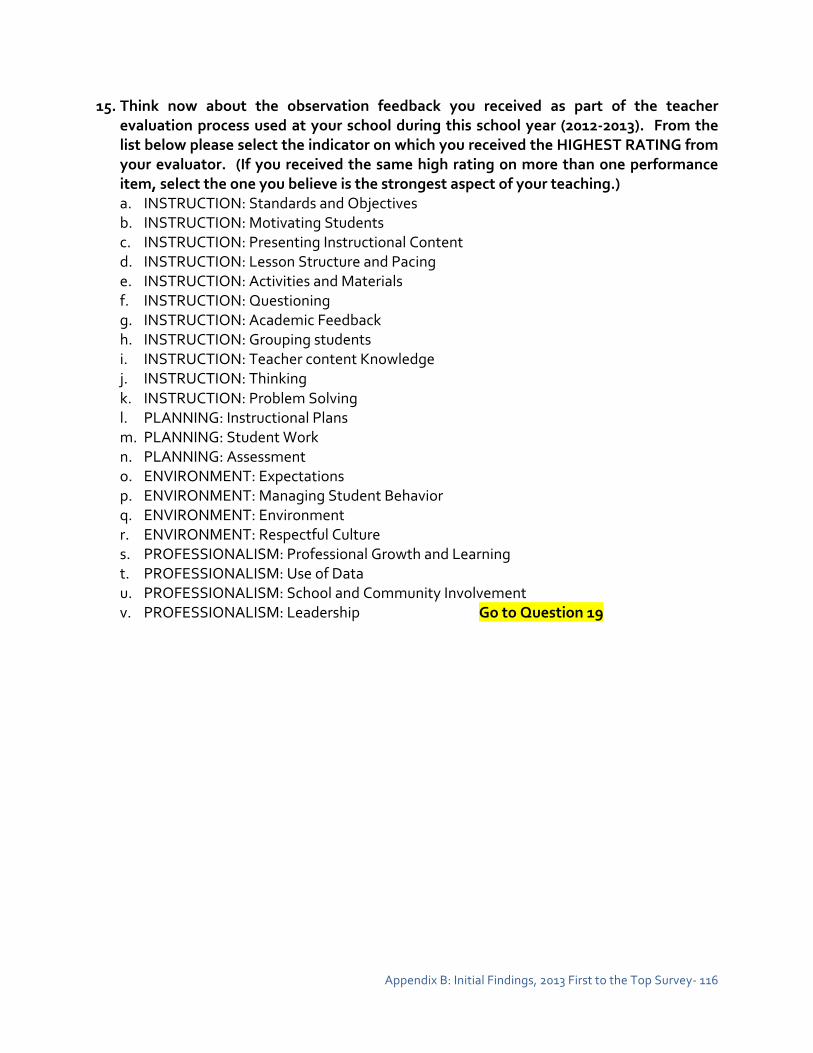
Appendix B: Initial Findings, 2013 First to the Top Survey-‐ 116
15. Think now about the observation feedback you received as part of the teacher evaluation process used at your school during this school year (2012-‐2013). From the list below please select the indicator on which you received the HIGHEST RATING from your evaluator. (If you received the same high rating on more than one performance item, select the one you believe is the strongest aspect of your teaching.) a. INSTRUCTION: Standards and Objectives b. INSTRUCTION: Motivating Students c. INSTRUCTION: Presenting Instructional Content d. INSTRUCTION: Lesson Structure and Pacing e. INSTRUCTION: Activities and Materials f. INSTRUCTION: Questioning g. INSTRUCTION: Academic Feedback h. INSTRUCTION: Grouping students i. INSTRUCTION: Teacher content Knowledge j. INSTRUCTION: Thinking k. INSTRUCTION: Problem Solving l. PLANNING: Instructional Plans m. PLANNING: Student Work n. PLANNING: Assessment o. ENVIRONMENT: Expectations p. ENVIRONMENT: Managing Student Behavior q. ENVIRONMENT: Environment r. ENVIRONMENT: Respectful Culture s. PROFESSIONALISM: Professional Growth and Learning t. PROFESSIONALISM: Use of Data u. PROFESSIONALISM: School and Community Involvement v. PROFESSIONALISM: Leadership Go to Question 19

Appendix B: Initial Findings, 2013 First to the Top Survey-‐ 117
16. Think now about the observation feedback you received as part of the teacher evaluation process used at your school during this school year (2012-‐2013). From the list below please select the indicator on which you received the HIGHEST RATING from your evaluator. (If you received the same high rating on more than one performance item, select the one you believe is the strongest aspect of your teaching.) a. PLANNING AND PREPARATION: Knowledge of the Learning Process b. PLANNING AND PREPARATION: Value, Sequence, and Alignment c. PLANNING AND PREPARATION: Suitability for Diverse Learners d. PLANNING AND PREPARATION: Learning Activities e. PLANNING AND PREPARATION: Design of Formative Assessments f. THE CLASSROOM ENVIRONMENT: Teacher Interaction with Students g. THE CLASSROOM ENVIRONMENT: Importance of the Content h. THE CLASSROOM ENVIRONMENT: Management of Instructional Groups i. THE CLASSROOM ENVIRONMENT: Management of Transitions j. THE CLASSROOM ENVIRONMENT: Management of Materials and Supplies k. THE CLASSROOM ENVIRONMENT: Expectations l. THE CLASSROOM ENVIRONMENT: Monitoring of Student Behavior m. THE CLASSROOM ENVIRONMENT: Response to Student Misbehavior n. THE CLASSROOM ENVIRONMENT: Safety and Accessibility o. INSTRUCTION: Expectations for Learning and Achievement p. INSTRUCTION: Directions, Procedures and Explanations of Content q. INSTRUCTION: Use of Oral and Written Language r. INSTRUCTION: Quality of Questions s. INSTRUCTION: Student Participation t. INSTRUCTION: Activities and Assignments u. INSTRUCTION: Grouping of Students v. INSTRUCTION: Instructional Materials and Resources w. INSTRUCTION: Structure and Pacing x. INSTRUCTION: Assessment Criteria y. INSTRUCTION: Monitoring of Student Learning z. INSTRUCTION: Feedback to Students aa. INSTRUCTION: Student Self-‐Assessment and Monitoring of Progress bb. INSTRUCTION: Response to Students cc. PROFESSIONAL RESPONSIBILITIES: Accuracy and Use in Future Teaching dd. PROFESSIONAL RESPONSIBILITIES: Information about Individual Students ee. PROFESSIONAL RESPONSIBILITIES: Professional Relationships with Colleagues and
Receptivity to Feedback from Colleagues ff. PROFESSIONAL RESPONSIBILITIES: Enhancement of Content Knowledge and
Pedagogical Skill gg. PROFESSIONAL RESPONSIBILITIES: Integrity and Ethical Conduct hh. PROFESSIONAL RESPONSIBILITIES: Decision Making ii. PROFESSIONAL RESPONSIBILITIES: Compliance with School and District Regulations
and Handling of Non-‐Instructional Records Go to Question 19

Appendix B: Initial Findings, 2013 First to the Top Survey-‐ 118
17. Think now about the observation feedback you received as part of the teacher evaluation process used at your school during this school year (2012-‐2013). From the list below please select the indicator on which you received the HIGHEST RATING from your evaluator. (If you received the same high rating on more than one performance item, select the one you believe is the strongest aspect of your teaching.) a. PLAN: Know your students in order to plan your instruction effectively b. PLAN: Site through-‐course and end-‐of-‐course goals c. PLAN: Create or adapt standards-‐based instructional plans and assessments guided by
pacing and content from instructional maps d. TEACH: Engage students in objective-‐driven lessons based on content standards e. TEACH: Explain content clearly and accurately f. TEACH: Engage students at all learning leaves in appropriately challenging work g. TEACH: Provide students multiple ways to engage with content h. TEACH: Use strategies that develop higher-‐level thinking skills i. TEACH: Check for understanding and respond appropriately during the lesson j. TEACH: Maximize instructional time k. CULTIVATE LEARNING ENVIRONMENT: Build a respectful, learning-‐focused
classroom community l. CULTIVATE LEARNING ENVIRONMENT: Develop classroom procedures and routines m. CULTIVATE LEARNING ENVIRONMENT: Use classroom space and resources to
support instruction n. CULTIVATE LEARNING ENVIRONMENT: Manage student behavior o. REFLECT AND ADJUST: Monitor progress relative to through-‐course and end-‐of-‐
course goals p. REFLECT AND ADJUST: Use student data to inform and modify instructional practice
Go to Question 19
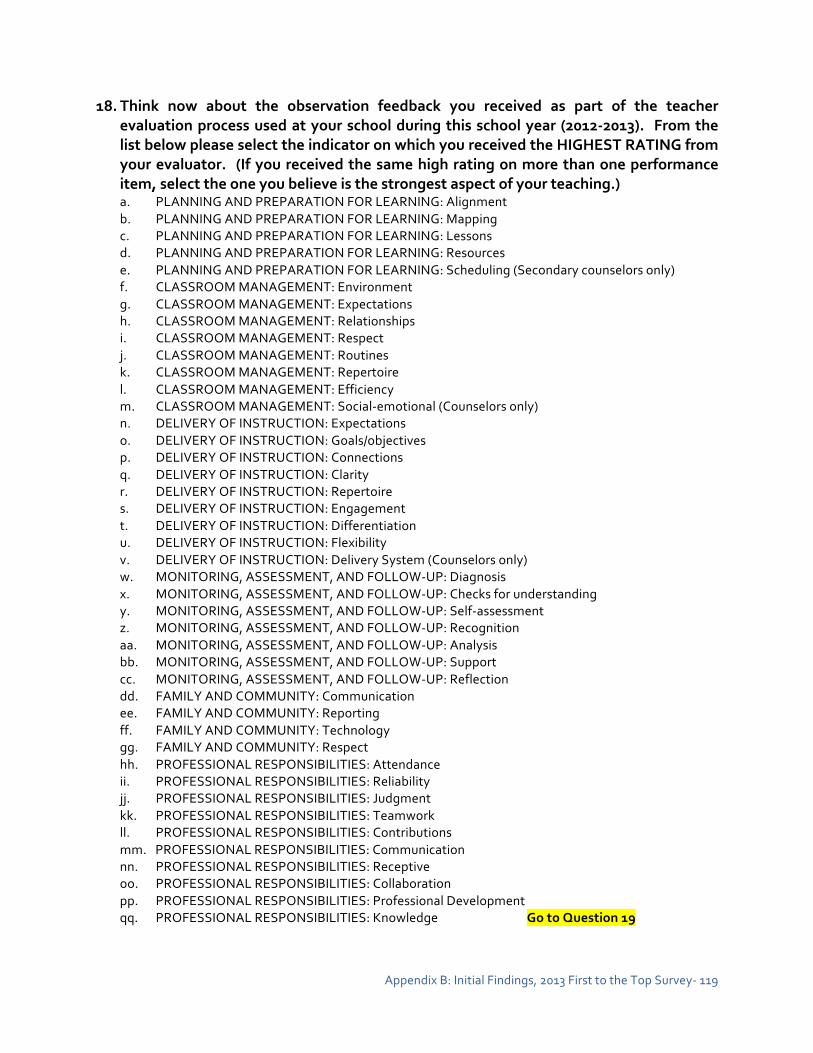
Appendix B: Initial Findings, 2013 First to the Top Survey-‐ 119
18. Think now about the observation feedback you received as part of the teacher evaluation process used at your school during this school year (2012-‐2013). From the list below please select the indicator on which you received the HIGHEST RATING from your evaluator. (If you received the same high rating on more than one performance item, select the one you believe is the strongest aspect of your teaching.) a. PLANNING AND PREPARATION FOR LEARNING: Alignment b. PLANNING AND PREPARATION FOR LEARNING: Mapping c. PLANNING AND PREPARATION FOR LEARNING: Lessons d. PLANNING AND PREPARATION FOR LEARNING: Resources e. PLANNING AND PREPARATION FOR LEARNING: Scheduling (Secondary counselors only) f. CLASSROOM MANAGEMENT: Environment g. CLASSROOM MANAGEMENT: Expectations h. CLASSROOM MANAGEMENT: Relationships i. CLASSROOM MANAGEMENT: Respect j. CLASSROOM MANAGEMENT: Routines k. CLASSROOM MANAGEMENT: Repertoire l. CLASSROOM MANAGEMENT: Efficiency m. CLASSROOM MANAGEMENT: Social-‐emotional (Counselors only) n. DELIVERY OF INSTRUCTION: Expectations o. DELIVERY OF INSTRUCTION: Goals/objectives p. DELIVERY OF INSTRUCTION: Connections q. DELIVERY OF INSTRUCTION: Clarity r. DELIVERY OF INSTRUCTION: Repertoire s. DELIVERY OF INSTRUCTION: Engagement t. DELIVERY OF INSTRUCTION: Differentiation u. DELIVERY OF INSTRUCTION: Flexibility v. DELIVERY OF INSTRUCTION: Delivery System (Counselors only) w. MONITORING, ASSESSMENT, AND FOLLOW-‐UP: Diagnosis x. MONITORING, ASSESSMENT, AND FOLLOW-‐UP: Checks for understanding y. MONITORING, ASSESSMENT, AND FOLLOW-‐UP: Self-‐assessment z. MONITORING, ASSESSMENT, AND FOLLOW-‐UP: Recognition aa. MONITORING, ASSESSMENT, AND FOLLOW-‐UP: Analysis bb. MONITORING, ASSESSMENT, AND FOLLOW-‐UP: Support cc. MONITORING, ASSESSMENT, AND FOLLOW-‐UP: Reflection dd. FAMILY AND COMMUNITY: Communication ee. FAMILY AND COMMUNITY: Reporting ff. FAMILY AND COMMUNITY: Technology gg. FAMILY AND COMMUNITY: Respect hh. PROFESSIONAL RESPONSIBILITIES: Attendance ii. PROFESSIONAL RESPONSIBILITIES: Reliability jj. PROFESSIONAL RESPONSIBILITIES: Judgment kk. PROFESSIONAL RESPONSIBILITIES: Teamwork ll. PROFESSIONAL RESPONSIBILITIES: Contributions mm. PROFESSIONAL RESPONSIBILITIES: Communication nn. PROFESSIONAL RESPONSIBILITIES: Receptive oo. PROFESSIONAL RESPONSIBILITIES: Collaboration pp. PROFESSIONAL RESPONSIBILITIES: Professional Development qq. PROFESSIONAL RESPONSIBILITIES: Knowledge Go to Question 19

Appendix B: Initial Findings, 2013 First to the Top Survey-‐ 120
19. Do you agree that this indicator is a teaching strength of yours? a. Yes b. No c. I don’t know
20. Did your evaluator provide suggestions targeted towards improving in this area?
a. Yes b. No c. I don’t know/I don’t remember
21. Did your evaluator provide suggestions for sharing this strength with others in your
school? a. Yes b. No c. I don’t know/I don’t remember
Branching Instructions Follow the branching rules in the sequence given below. Jump to the question as specified in the branching rule if all the conditions specified in the rule are satisfied. Rule 1: IF ANSWER TO Q1 is (1) THEN go to Question 22 Rule 2: IF ANSWER TO Q1 is (2) THEN go to Question 23 Rule 3: IF ANSWER TO Q1 is (3) THEN go to Question 24 Rule 4: IF ANSWER TO Q1 is (4) THEN go to Question 25
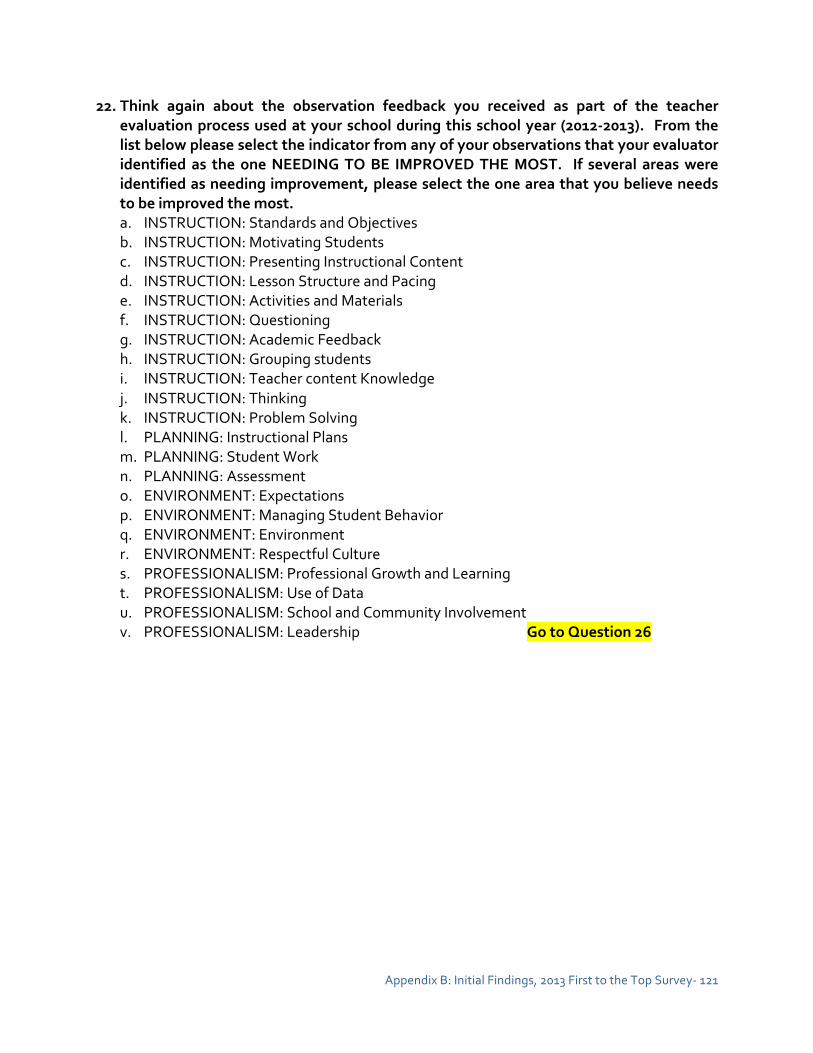
Appendix B: Initial Findings, 2013 First to the Top Survey-‐ 121
22. Think again about the observation feedback you received as part of the teacher evaluation process used at your school during this school year (2012-‐2013). From the list below please select the indicator from any of your observations that your evaluator identified as the one NEEDING TO BE IMPROVED THE MOST. If several areas were identified as needing improvement, please select the one area that you believe needs to be improved the most. a. INSTRUCTION: Standards and Objectives b. INSTRUCTION: Motivating Students c. INSTRUCTION: Presenting Instructional Content d. INSTRUCTION: Lesson Structure and Pacing e. INSTRUCTION: Activities and Materials f. INSTRUCTION: Questioning g. INSTRUCTION: Academic Feedback h. INSTRUCTION: Grouping students i. INSTRUCTION: Teacher content Knowledge j. INSTRUCTION: Thinking k. INSTRUCTION: Problem Solving l. PLANNING: Instructional Plans m. PLANNING: Student Work n. PLANNING: Assessment o. ENVIRONMENT: Expectations p. ENVIRONMENT: Managing Student Behavior q. ENVIRONMENT: Environment r. ENVIRONMENT: Respectful Culture s. PROFESSIONALISM: Professional Growth and Learning t. PROFESSIONALISM: Use of Data u. PROFESSIONALISM: School and Community Involvement v. PROFESSIONALISM: Leadership Go to Question 26
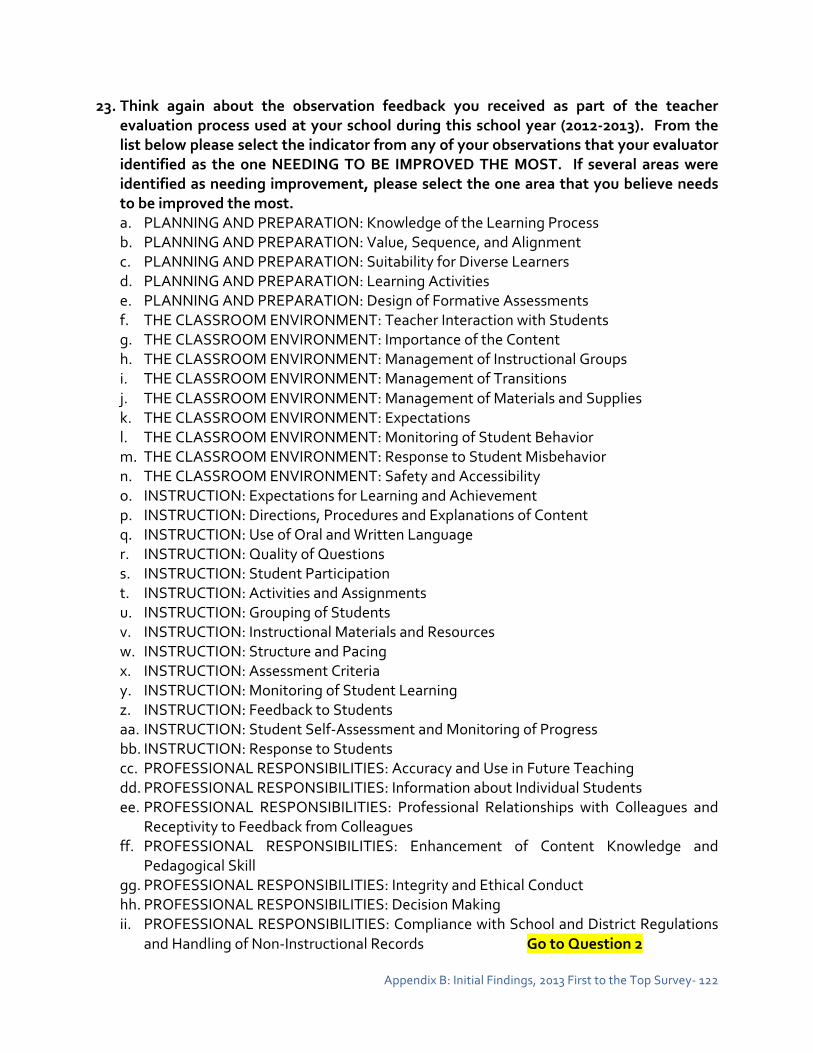
Appendix B: Initial Findings, 2013 First to the Top Survey-‐ 122
23. Think again about the observation feedback you received as part of the teacher evaluation process used at your school during this school year (2012-‐2013). From the list below please select the indicator from any of your observations that your evaluator identified as the one NEEDING TO BE IMPROVED THE MOST. If several areas were identified as needing improvement, please select the one area that you believe needs to be improved the most. a. PLANNING AND PREPARATION: Knowledge of the Learning Process b. PLANNING AND PREPARATION: Value, Sequence, and Alignment c. PLANNING AND PREPARATION: Suitability for Diverse Learners d. PLANNING AND PREPARATION: Learning Activities e. PLANNING AND PREPARATION: Design of Formative Assessments f. THE CLASSROOM ENVIRONMENT: Teacher Interaction with Students g. THE CLASSROOM ENVIRONMENT: Importance of the Content h. THE CLASSROOM ENVIRONMENT: Management of Instructional Groups i. THE CLASSROOM ENVIRONMENT: Management of Transitions j. THE CLASSROOM ENVIRONMENT: Management of Materials and Supplies k. THE CLASSROOM ENVIRONMENT: Expectations l. THE CLASSROOM ENVIRONMENT: Monitoring of Student Behavior m. THE CLASSROOM ENVIRONMENT: Response to Student Misbehavior n. THE CLASSROOM ENVIRONMENT: Safety and Accessibility o. INSTRUCTION: Expectations for Learning and Achievement p. INSTRUCTION: Directions, Procedures and Explanations of Content q. INSTRUCTION: Use of Oral and Written Language r. INSTRUCTION: Quality of Questions s. INSTRUCTION: Student Participation t. INSTRUCTION: Activities and Assignments u. INSTRUCTION: Grouping of Students v. INSTRUCTION: Instructional Materials and Resources w. INSTRUCTION: Structure and Pacing x. INSTRUCTION: Assessment Criteria y. INSTRUCTION: Monitoring of Student Learning z. INSTRUCTION: Feedback to Students aa. INSTRUCTION: Student Self-‐Assessment and Monitoring of Progress bb. INSTRUCTION: Response to Students cc. PROFESSIONAL RESPONSIBILITIES: Accuracy and Use in Future Teaching dd. PROFESSIONAL RESPONSIBILITIES: Information about Individual Students ee. PROFESSIONAL RESPONSIBILITIES: Professional Relationships with Colleagues and
Receptivity to Feedback from Colleagues ff. PROFESSIONAL RESPONSIBILITIES: Enhancement of Content Knowledge and
Pedagogical Skill gg. PROFESSIONAL RESPONSIBILITIES: Integrity and Ethical Conduct hh. PROFESSIONAL RESPONSIBILITIES: Decision Making ii. PROFESSIONAL RESPONSIBILITIES: Compliance with School and District Regulations
and Handling of Non-‐Instructional Records Go to Question 2

Appendix B: Initial Findings, 2013 First to the Top Survey-‐ 123
24. Think again about the observation feedback you received as part of the teacher evaluation process used at your school during this school year (2012-‐2013). From the list below please select the indicator from any of your observations that your evaluator identified as the one NEEDING TO BE IMPROVED THE MOST. If several areas were identified as needing improvement, please select the one area that you believe needs to be improved the most. a. PLAN: Know your students in order to plan your instruction effectively b. PLAN: Site through-‐course and end-‐of-‐course goals c. PLAN: Create or adapt standards-‐based instructional plans and assessments guided by
pacing and content from instructional maps d. TEACH: Engage students in objective-‐driven lessons based on content standards e. TEACH: Explain content clearly and accurately f. TEACH: Engage students at all learning leaves in appropriately challenging work g. TEACH: Provide students multiple ways to engage with content h. TEACH: Use strategies that develop higher-‐level thinking skills i. TEACH: Check for understanding and respond appropriately during the lesson j. TEACH: Maximize instructional time k. CULTIVATE LEARNING ENVIRONMENT: Build a respectful, learning-‐focused
classroom community l. CULTIVATE LEARNING ENVIRONMENT: Develop classroom procedures and routines m. CULTIVATE LEARNING ENVIRONMENT: Use classroom space and resources to
support instruction n. CULTIVATE LEARNING ENVIRONMENT: Manage student behavior o. REFLECT AND ADJUST: Monitor progress relative to through-‐course and end-‐of-‐
course goals p. REFLECT AND ADJUST: Use student data to inform and modify instructional practice
Go to Question 26

Appendix B: Initial Findings, 2013 First to the Top Survey-‐ 124
25. Think again about the observation feedback you received as part of the teacher evaluation process used at your school during this school year (2012-‐2013). From the list below please select the indicator from any of your observations that your evaluator identified as the one NEEDING TO BE IMPROVED THE MOST. If several areas were identified as needing improvement, please select the one area that you believe needs to be improved the most. a. PLANNING AND PREPARATION FOR LEARNING: Alignment b. PLANNING AND PREPARATION FOR LEARNING: Mapping c. PLANNING AND PREPARATION FOR LEARNING: Lessons d. PLANNING AND PREPARATION FOR LEARNING: Resources e. PLANNING AND PREPARATION FOR LEARNING: Scheduling (Secondary counselors only) f. CLASSROOM MANAGEMENT: Environment g. CLASSROOM MANAGEMENT: Expectations h. CLASSROOM MANAGEMENT: Relationships i. CLASSROOM MANAGEMENT: Respect j. CLASSROOM MANAGEMENT: Routines k. CLASSROOM MANAGEMENT: Repertoire l. CLASSROOM MANAGEMENT: Efficiency m. CLASSROOM MANAGEMENT: Social-‐emotional (Counselors only) n. DELIVERY OF INSTRUCTION: Expectations o. DELIVERY OF INSTRUCTION: Goals/objectives p. DELIVERY OF INSTRUCTION: Connections q. DELIVERY OF INSTRUCTION: Clarity r. DELIVERY OF INSTRUCTION: Repertoire s. DELIVERY OF INSTRUCTION: Engagement t. DELIVERY OF INSTRUCTION: Differentiation u. DELIVERY OF INSTRUCTION: Flexibility v. DELIVERY OF INSTRUCTION: Delivery System (Counselors only) w. MONITORING, ASSESSMENT, AND FOLLOW-‐UP: Diagnosis x. MONITORING, ASSESSMENT, AND FOLLOW-‐UP: Checks for understanding y. MONITORING, ASSESSMENT, AND FOLLOW-‐UP: Self-‐assessment z. MONITORING, ASSESSMENT, AND FOLLOW-‐UP: Recognition aa. MONITORING, ASSESSMENT, AND FOLLOW-‐UP: Analysis bb. MONITORING, ASSESSMENT, AND FOLLOW-‐UP: Support cc. MONITORING, ASSESSMENT, AND FOLLOW-‐UP: Reflection dd. FAMILY AND COMMUNITY: Communication ee. FAMILY AND COMMUNITY: Reporting ff. FAMILY AND COMMUNITY: Technology gg. FAMILY AND COMMUNITY: Respect hh. PROFESSIONAL RESPONSIBILITIES: Attendance ii. PROFESSIONAL RESPONSIBILITIES: Reliability jj. PROFESSIONAL RESPONSIBILITIES: Judgment kk. PROFESSIONAL RESPONSIBILITIES: Teamwork ll. PROFESSIONAL RESPONSIBILITIES: Contributions mm. PROFESSIONAL RESPONSIBILITIES: Communication nn. PROFESSIONAL RESPONSIBILITIES: Receptive oo. PROFESSIONAL RESPONSIBILITIES: Collaboration pp. PROFESSIONAL RESPONSIBILITIES: Professional Development qq. PROFESSIONAL RESPONSIBILITIES: Knowledge Go to Question 26

Appendix B: Initial Findings, 2013 First to the Top Survey-‐ 125
26. What was your initial rating on this indicator? a. 1 b. 2 c. 3 d. 4 e. 5 f. I don’t know/I don’t remember
27. Did you understand why your observer rated you at the level he or she did?
a. Yes b. No c. I don’t know
28. Do you agree with this initial rating? a. Yes b. No c. I don’t know
29. Which of the following actions/resources were RECOMMENDED to you as part of your
observation feedback to help you improve your performance in this area? Mark all that apply. a. Nothing was recommended to me to help me improve my performance in this area b. Professional development opportunities (workshops) available to all teachers within my
district c. Professional development opportunities (workshops) available to all teachers within my
school d. One-‐on-‐one work with a mentor teacher e. One-‐on-‐one work with an instructional coach f. College/University courses g. Self-‐directed reading/learning h. Informally consult with peers i. Observe other teachers j. Videos of model lessons k. Resources available from the Tennessee Department of Education l. Other (please specify) ________________
We are interested in knowing the actions you took and resources you utilized to improve your performance in this area. 30. Did you take steps to address the indicator from your observations your evaluator
identified as the one needing to be improved the most? a. Yes (Please CONTINUE to the next question) b. No (Please SKIP the next question)

Appendix B: Initial Findings, 2013 First to the Top Survey-‐ 126
Please indicate which of the following actions/resources YOU ACTUALLY PARTICIPATED IN OR USED to help improve your performance in this area. (Items may be checked here even if they were not checked on the recommended list.) If you participated in or utilized an action/resource, the please indicate the extent to which the utilized resource helped you improve your teaching within the second question.
31. Did you participate in or use the following? Mark all that apply. a. Professional development opportunities (workshops) available to all
teachers within my district |__| b. Professional development opportunities (workshops) available to all
teachers within my school |__| c. One-‐on-‐one work with a mentor teacher |__| d. One-‐on-‐one work with an instructional coach |__| e. College/University courses |__| f. Self-‐directed reading/learning |__| g. Informally consult with peers |__| h. Observe other teachers |__| i. Videos of model lessons |__| j. Resources available from the Tennessee Department of Education |__| k. Other |__| Note: Question 32 should be answered only if the answer to Question 31 is in Column 1. 32. Please indicate the extent to which the resource helped you improve your teaching.
a. Hindered my ability to improve my teaching b. Did not help me improve my teaching c. Helped me improve my teaching a little d. Helped me improve my teaching a lot
33. How many times did your observer follow up with you about your response to this area
identified as needing improvement? a. Never b. One time c. Between two and four times d. Five times or more

Appendix B: Initial Findings, 2013 First to the Top Survey-‐ 127
34. We would like to know more about how you perceive the feedback you received from the teacher evaluation process used at your school this school year (2012-‐2013). Was the feedback you received more focused on helping you improve your teaching or was it more focused on making a judgment about your performance? Please select one of the following three options: a. The feedback that I received from my evaluator was focused MORE on HELPING ME
IMPROVE my teaching than making a judgment about my performance. b. The feedback that I received from my evaluator was focused MORE on MAKING A
JUDGMENT about my performance than helping be improve my teaching. c. The feedback that I received from my evaluator was EQUALLY FOCUSED on helping
me improve my teaching and making a judgment about my performance. Think about the teacher evaluation process used in your school and respond to the following. 35. Please indicate the extent to which you agree or disagree with each statement about
the rubrics used as part of the teacher evaluation process used in your school. Strongly
Disagree Disagree Agree Strongly Agree
a. The specific indicators of teaching performance in the rubric(s) used in my school’s teacher evaluation process accurately reflect what teachers know and do.
1 2 3 4
b. My evaluator uses the rubric(s) from our teacher evaluation process as a basis for discussing feedback from teaching observations.
1 2 3 4
c. My evaluator uses the rubric(s) from our teacher evaluation process as a basis for suggesting how I can improve my teaching.
1 2 3 4
d. I believe I can achieve the highest rating on most elements of teaching performance defined in the rubric(s) used in my school’s teacher evaluation process.
1 2 3 4
e. Teachers must receive a score of 4 or higher on all indicators on the rubric(s) used for teaching observations to be rated as an effective teacher.
1 2 3 4
f. The rubric(s) used in my school’s teacher evaluation process clearly describe the teaching performance needed to earn each rating score.
1 2 3 4
g. The rubric(s) omit important aspects of teaching that should be considered when evaluating teachers.
1 2 3 4

Appendix B: Initial Findings, 2013 First to the Top Survey-‐ 128
36. Think about the measures and ratings used in the teacher evaluation process used in your school. How strongly do you agree or disagree with each of the following statements about these measures? Strongly
Disagree Disagree Agree Strongly Agree
a. I believe that the GROWTH MEASURE included in my overall effectiveness rating accurately reflects my contribution to student learning.
1 2 3 4
b. I believe that the ACHIEVEMENT MEASURE included in my overall effectiveness rating accurately reflects my contribution to student learning.
1 2 3 4
c. I believe that the QUALITATIVE MEASURE based on teaching observations and other qualitative measures (e.g., previous evaluations, student surveys) included in my overall effectiveness rating accurately reflects my contribution to student learning.
1 2 3 4
d. My evaluator and I agree on which approved measure to use for my ACHIEVEMENT MEASURE.
1 2 3 4
e. I understand how my overall teacher effectiveness rating is calculated.
1 2 3 4
We are interested in knowing more about the teacher evaluation scores you received from the 2011-‐2012 school year. For most teachers this was the first year that they participated in the new evaluation process. 37. Please indicate when you learned what your 2011-‐2012 teacher evaluation score was on
each of the following. (Column 1)
I have not yet
received this score
(Column 2) In the spring, 2012
semester
(Column 3) In the
summer of 2012
(Column 4) In the fall,
2012 semester
(Column 5) In the spring, 2013
semester a. 35% Growth Measure 1 2 3 4 5 b. 15% Achievement Measure 1 2 3 4 5 c. 50% Qualitative Measure 1 2 3 4 5 d. My overall effectiveness rating 1 2 3 4 5
Note: Question 38 should only be answered if the answer to Question 37 is in Column 2, 3, 4, or 5

Appendix B: Initial Findings, 2013 First to the Top Survey-‐ 129
38. Did you discuss this score with your evaluator?
Yes No a. 35% Growth Measure 1 2 b. 15% Achievement Measure 1 2 c. 50% Qualitative Measure 1 2 d. My overall effectiveness rating 1 2 Think about the following changes made to the teacher evaluation process used in your school this year (2012-‐2013), and respond to the following. 39. The following changes to the teacher evaluation process were implemented during the
2012-‐2013 school year. For each change, please indicate the extent to which you agree this change has improved the teacher evaluation process.
Strongly Disagree Disagree Agree
Strongly Agree
I am unaware of
this change/Not applicable
a. Decreasing observation requirements for teachers who previously scored a 5 on his or her overall evaluation or individual growth score was an improvement to the teacher evaluation process.
1 2 3 4 5
b. Requiring evaluators to conduct an initial coaching conversation with teachers who previously scored a 1 on his or her overall evaluation or individual growth score was an improvement to the teacher evaluation process.
1 2 3 4 5
c. Increasing the weighting for observations from 50% to 60% and decreasing the weighting for growth from 35% to 25% for teachers without an individual growth score (e.g., TVAAS) was an improvement to the evaluation process.
1 2 3 4 5
d. Including special education students in the calculation of individual growth scores was an improvement to the evaluation process.
1 2 3 4 5
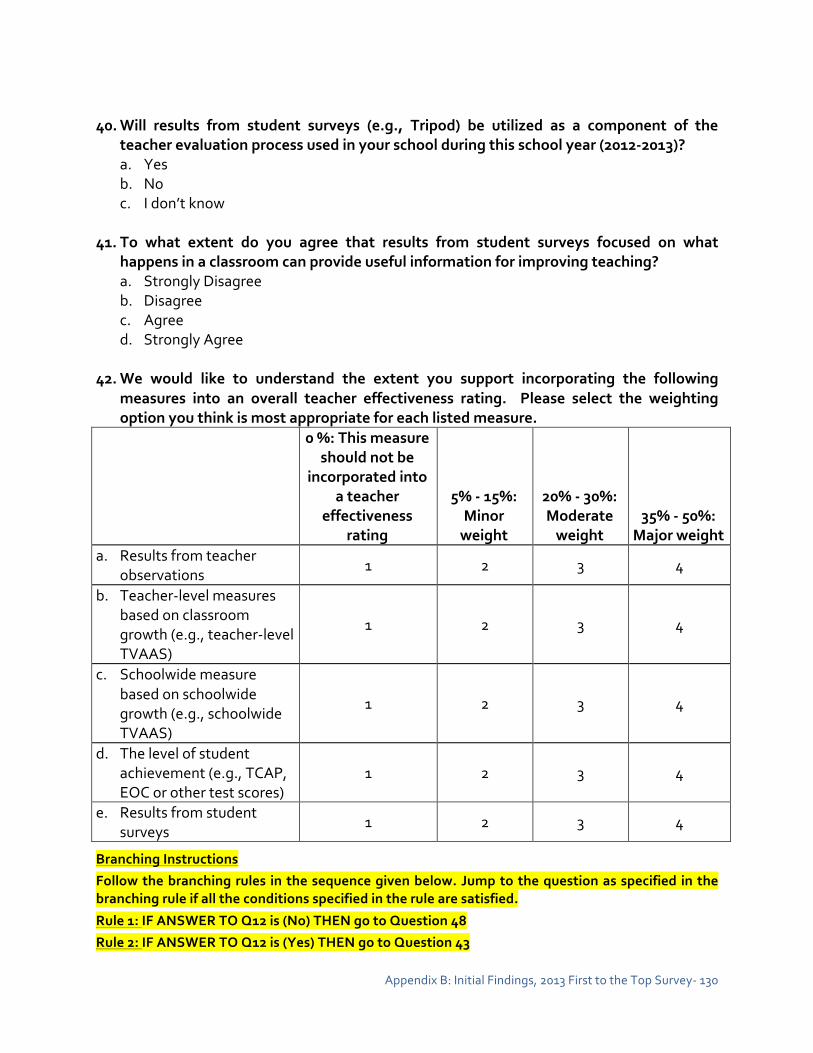
Appendix B: Initial Findings, 2013 First to the Top Survey-‐ 130
40. Will results from student surveys (e.g., Tripod) be utilized as a component of the
teacher evaluation process used in your school during this school year (2012-‐2013)? a. Yes b. No c. I don’t know
41. To what extent do you agree that results from student surveys focused on what
happens in a classroom can provide useful information for improving teaching? a. Strongly Disagree b. Disagree c. Agree d. Strongly Agree
42. We would like to understand the extent you support incorporating the following measures into an overall teacher effectiveness rating. Please select the weighting option you think is most appropriate for each listed measure. 0 %: This measure
should not be incorporated into
a teacher effectiveness
rating
5% -‐ 15%: Minor weight
20% -‐ 30%: Moderate weight
35% -‐ 50%: Major weight
a. Results from teacher observations
1 2 3 4
b. Teacher-‐level measures based on classroom growth (e.g., teacher-‐level TVAAS)
1 2 3 4
c. Schoolwide measure based on schoolwide growth (e.g., schoolwide TVAAS)
1 2 3 4
d. The level of student achievement (e.g., TCAP, EOC or other test scores)
1 2 3 4
e. Results from student surveys
1 2 3 4
Branching Instructions
Follow the branching rules in the sequence given below. Jump to the question as specified in the branching rule if all the conditions specified in the rule are satisfied.
Rule 1: IF ANSWER TO Q12 is (No) THEN go to Question 48
Rule 2: IF ANSWER TO Q12 is (Yes) THEN go to Question 43
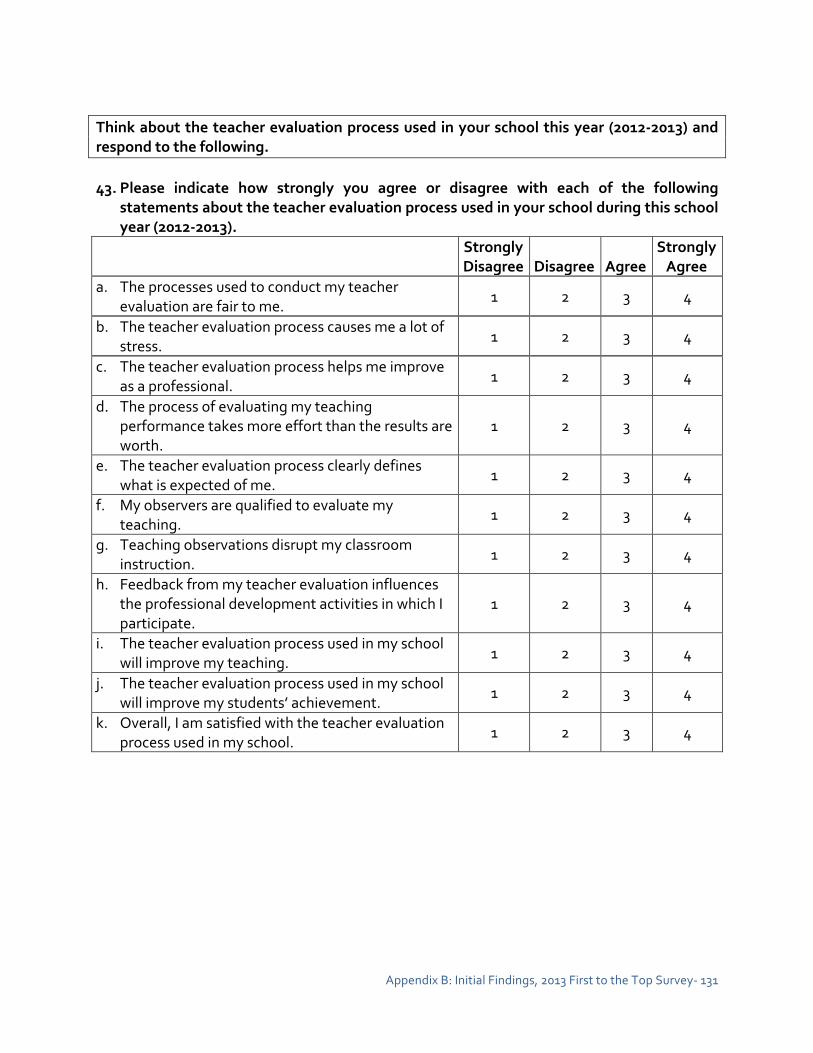
Appendix B: Initial Findings, 2013 First to the Top Survey-‐ 131
Think about the teacher evaluation process used in your school this year (2012-‐2013) and respond to the following. 43. Please indicate how strongly you agree or disagree with each of the following
statements about the teacher evaluation process used in your school during this school year (2012-‐2013). Strongly
Disagree Disagree Agree Strongly Agree
a. The processes used to conduct my teacher evaluation are fair to me.
1 2 3 4
b. The teacher evaluation process causes me a lot of stress.
1 2 3 4
c. The teacher evaluation process helps me improve as a professional.
1 2 3 4
d. The process of evaluating my teaching performance takes more effort than the results are worth.
1 2 3 4
e. The teacher evaluation process clearly defines what is expected of me.
1 2 3 4
f. My observers are qualified to evaluate my teaching.
1 2 3 4
g. Teaching observations disrupt my classroom instruction.
1 2 3 4
h. Feedback from my teacher evaluation influences the professional development activities in which I participate.
1 2 3 4
i. The teacher evaluation process used in my school will improve my teaching.
1 2 3 4
j. The teacher evaluation process used in my school will improve my students’ achievement.
1 2 3 4
k. Overall, I am satisfied with the teacher evaluation process used in my school.
1 2 3 4

Appendix B: Initial Findings, 2013 First to the Top Survey-‐ 132
44. Please indicate how strongly you agree or disagree with each of the following statements about how your school’s teacher evaluation process will affect YOUR SCHOOL. Strongly
Disagree Disagree Agree Strongly Agree
a. In general, teacher evaluation processes used in my school are fair to all teachers.
1 2 3 4
b. In general, I believe that the teacher evaluation process used in my school will improve teaching.
1 2 3 4
c. In general, I believe that the teacher evaluation process used in my school will improve student achievement.
1 2 3 4
d. In general, the teacher evaluation process used in my school takes more effort than the results are worth.
1 2 3 4
We would like to know your opinion about how results from the teacher evaluation process should inform decisions within your school. 45. To what extent should teacher effectiveness ratings be given importance when making
decisions concerning…
No
Importance Low
Importance Moderate Importance
High Importance
a. …professional development for teachers?
1 2 3 4
b. …teacher compensation? 1 2 3 4 c. …teacher advancement? 1 2 3 4 d. …teacher retention? 1 2 3 4 e. …teacher tenure? 1 2 3 4
46. Generally speaking, what BENEFITS have you experienced from the teacher evaluation
process being used at your school this year (2012-‐2013)? 47. Generally speaking, what CHALLENGES have you encountered with the teacher
evaluation process being used at your school this year (2012-‐2013)?

Appendix B: Initial Findings, 2013 First to the Top Survey-‐ 133
The state of Tennessee has committed to adopting the Common Core State Standards (CCSS) and associated assessments, and has begun training personnel and working with school districts to pilot implementation and support this transition. 48. Please indicate which of the following Common Core State Standards trainings you
have attended or plan to attend during the 2012-‐2013 school year. Mark all that apply. a. Tennessee Department of Education training session(s) during summer, 2012 b. Tennessee Department of Education training session(s) during summer, 2013 c. School-‐ or district-‐wide training conducted by my school or district d. Training conducted by an educational vendor e. I have not attended Common Core training nor do I have plans to attend Common Core
training this year. 49. Please indicate the degree to which you agree with the following statements about the
Common Core State Standards initiative. Strongly
Disagree Disagree Agree Strongly Agree
a. The state’s plans for transitioning to the Common Core State Standards have been clearly communicated to me.
1 2 3 4
b. The state’s plans for changing statewide assessments to reflect Common Core State Standards have been clearly communicated to me.
1 2 3 4
c. Teaching to the Common Core State Standards will NOT require me to change how I teach.
1 2 3 4
d. Moving to the Common Core State Standards will improve the quality of my teaching.
1 2 3 4
e. Moving to the Common Core State Standards will improve student learning.
1 2 3 4
50. Please indicate how you interacted with Common Core Coaches throughout the 2012-‐
2013 school year on issues related to Common Core State Standards implementation. Mark all that apply. a. I did not interact with any Common Core Coaches this school year. b. On a one-‐on-‐one basis c. Through small group training session(s) with my PLC, department team, or grade-‐level
team d. At school-‐level training session(s) e. At district-‐level training session(s)
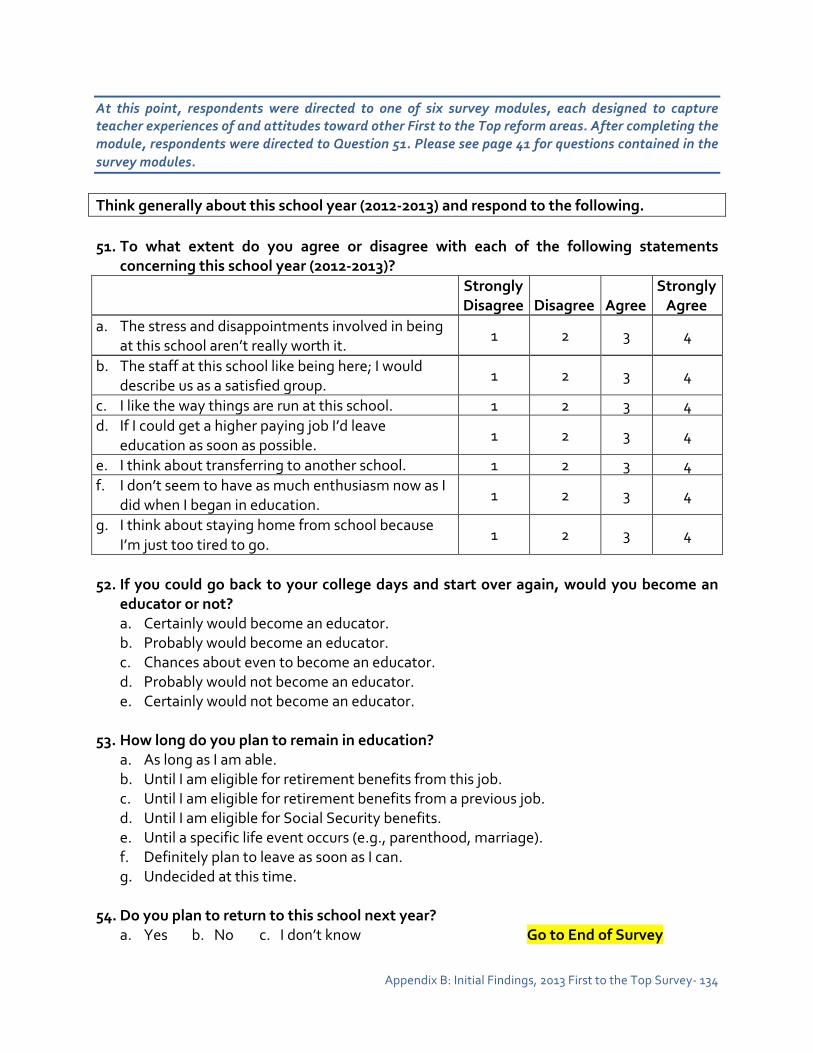
Appendix B: Initial Findings, 2013 First to the Top Survey-‐ 134
At this point, respondents were directed to one of six survey modules, each designed to capture teacher experiences of and attitudes toward other First to the Top reform areas. After completing the module, respondents were directed to Question 51. Please see page 41 for questions contained in the survey modules.
Think generally about this school year (2012-‐2013) and respond to the following. 51. To what extent do you agree or disagree with each of the following statements
concerning this school year (2012-‐2013)? Strongly
Disagree Disagree Agree Strongly Agree
a. The stress and disappointments involved in being at this school aren’t really worth it.
1 2 3 4
b. The staff at this school like being here; I would describe us as a satisfied group.
1 2 3 4
c. I like the way things are run at this school. 1 2 3 4 d. If I could get a higher paying job I’d leave
education as soon as possible. 1 2 3 4
e. I think about transferring to another school. 1 2 3 4 f. I don’t seem to have as much enthusiasm now as I
did when I began in education. 1 2 3 4
g. I think about staying home from school because I’m just too tired to go.
1 2 3 4
52. If you could go back to your college days and start over again, would you become an
educator or not? a. Certainly would become an educator. b. Probably would become an educator. c. Chances about even to become an educator. d. Probably would not become an educator. e. Certainly would not become an educator.
53. How long do you plan to remain in education?
a. As long as I am able. b. Until I am eligible for retirement benefits from this job. c. Until I am eligible for retirement benefits from a previous job. d. Until I am eligible for Social Security benefits. e. Until a specific life event occurs (e.g., parenthood, marriage). f. Definitely plan to leave as soon as I can. g. Undecided at this time.
54. Do you plan to return to this school next year?
a. Yes b. No c. I don’t know Go to End of Survey
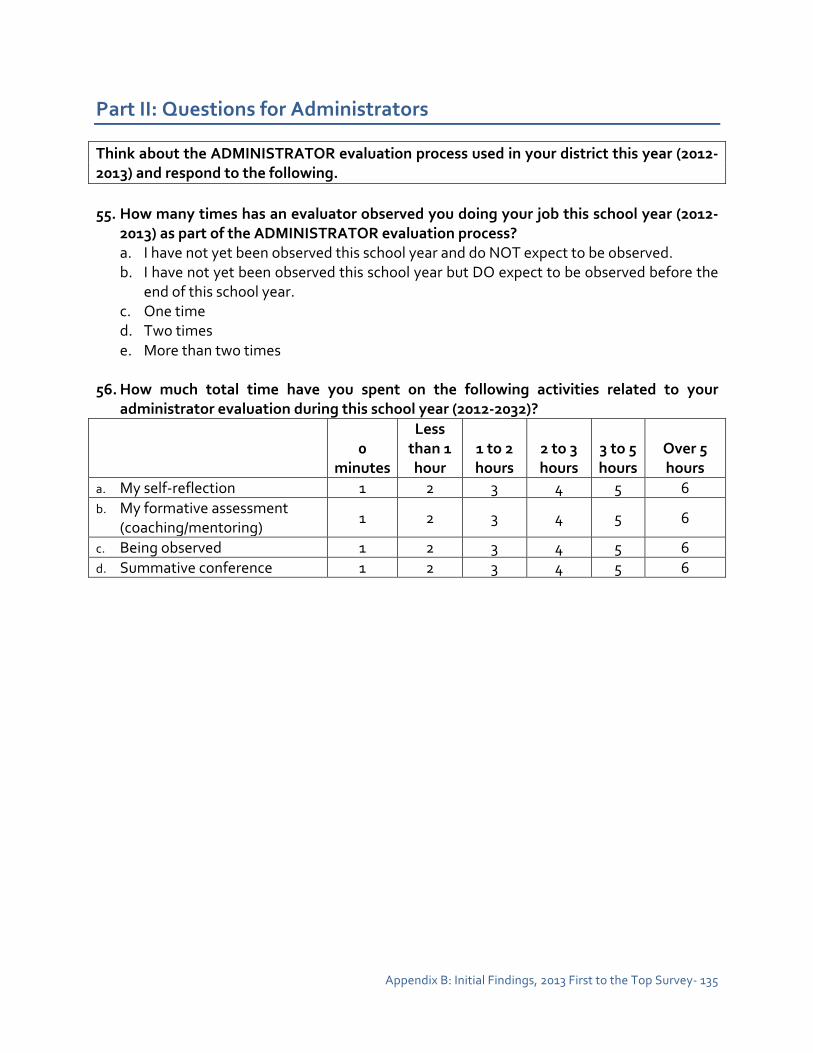
Appendix B: Initial Findings, 2013 First to the Top Survey-‐ 135
Part II: Questions for Administrators
Think about the ADMINISTRATOR evaluation process used in your district this year (2012-‐2013) and respond to the following. 55. How many times has an evaluator observed you doing your job this school year (2012-‐
2013) as part of the ADMINISTRATOR evaluation process? a. I have not yet been observed this school year and do NOT expect to be observed. b. I have not yet been observed this school year but DO expect to be observed before the
end of this school year. c. One time d. Two times e. More than two times
56. How much total time have you spent on the following activities related to your
administrator evaluation during this school year (2012-‐2032)?
0 minutes
Less than 1 hour
1 to 2 hours
2 to 3 hours
3 to 5 hours
Over 5 hours
a. My self-‐reflection 1 2 3 4 5 6 b. My formative assessment
(coaching/mentoring) 1 2 3 4 5 6
c. Being observed 1 2 3 4 5 6 d. Summative conference 1 2 3 4 5 6

Appendix B: Initial Findings, 2013 First to the Top Survey-‐ 136
57. How strongly do you agree or disagree with each of the following statements about the
administrator evaluation process used in your school during this school year (2012-‐2013)? Strongly
Disagree Disagree Agree Strongly Agree
a. I believe that the 35% SCHOOL-‐WIDE COMPOSITE GROWTH MEASURE included in my administrator summative rating accurately reflects my contribution to student learning in my school.
1 2 3 4
b. I believe that the 15% ACHIEVEMENT MEASURE included in my administrator summative rating accurately reflects my contribution to student learning in my school.
1 2 3 4
c. I believe that the 35% QUALITATIVE STANDARDS measure (based on TILS) included in my administrator summative rating accurately reflects my job performance.
1 2 3 4
d. I believe that the 15% STANDARD A: QUALITY OF TEACHER EVALUATIONS included in my administrator summative rating accurately reflects my job performance.
1 2 3 4
e. I understand how my administrator summative rating is calculated.
1 2 3 4
58. One component of each administrator’s evaluation is the quality of teacher evaluations
he or she conducted. Please indicate which of the following kinds of evidence your evaluator(s) used to determine your rating on this measure. Mark all that apply. a. I have not been rated on this measure. b. I do not know what kinds of evidence my evaluator(s) used. c. Observations of me conducting some or all parts of teacher evaluations (e.g., A co-‐
observation, observing a pre-‐ or post-‐conference, etc.) d. Reviewed documentation of the evaluation process (e.g., Reviewed sample sets of
evidence notes, reviewed sample sets of post-‐conference plans) e. Reviewed data from observations and evaluations I conducted (e.g., School level
reports from CODE, comparison of observation scores and benchmark assessment results, etc.)
f. Asked teachers (e.g., Conducted a staff survey or had one-‐on-‐one conversations with teachers)

Appendix B: Initial Findings, 2013 First to the Top Survey-‐ 137
59. How strongly do you agree or disagree with each of the following statements about Tennessee’s administrator evaluation process during this school year (2012-‐2013)? Strongly
Disagree Disagree Agree Strongly Agree
a. The processes used to conduct my administrator evaluation are fair to me.
1 2 3 4
b. The administrator evaluation process causes me a lot of stress.
1 2 3 4
c. The administrator evaluation process helps me improve as a professional.
1 2 3 4
d. The process of evaluating my professional practice takes more effort than the results are worth.
1 2 3 4
e. The Tennessee instructional leadership standards (TILS) clearly define what is expected of me as an administrator.
1 2 3 4
f. The individual responsible for completing my evaluation is qualified to evaluate my performance as an administrator.
1 2 3 4
g. Being observed interferes with my ability to complete my job duties.
1 2 3 4
h. Feedback from my administrator evaluation influences the professional development activities in which I participate.
1 2 3 4
i. Tennessee’s instructional leadership standards (TILS) clearly describe the performance needed to earn each rating score.
1 2 3 4
j. Tennessee’s instructional leadership standards (TILS) accurately define the important aspects of performance that should be considered when evaluating PRINCIPALS.
1 2 3 4
k. Tennessee’s instructional leadership standards (TILS) accurately define the important aspects of performance that should be considered when evaluating ASSISTANT PRINCIPALS.
1 2 3 4
l. Tennessee’s administrator evaluation process has improved my professional practice.
1 2 3 4
m. Tennessee’s administrator evaluation process has improved student learning in our school.
1 2 3 4
n. Overall, I am satisfied with Tennessee’s administrator evaluation process.
1 2 3 4
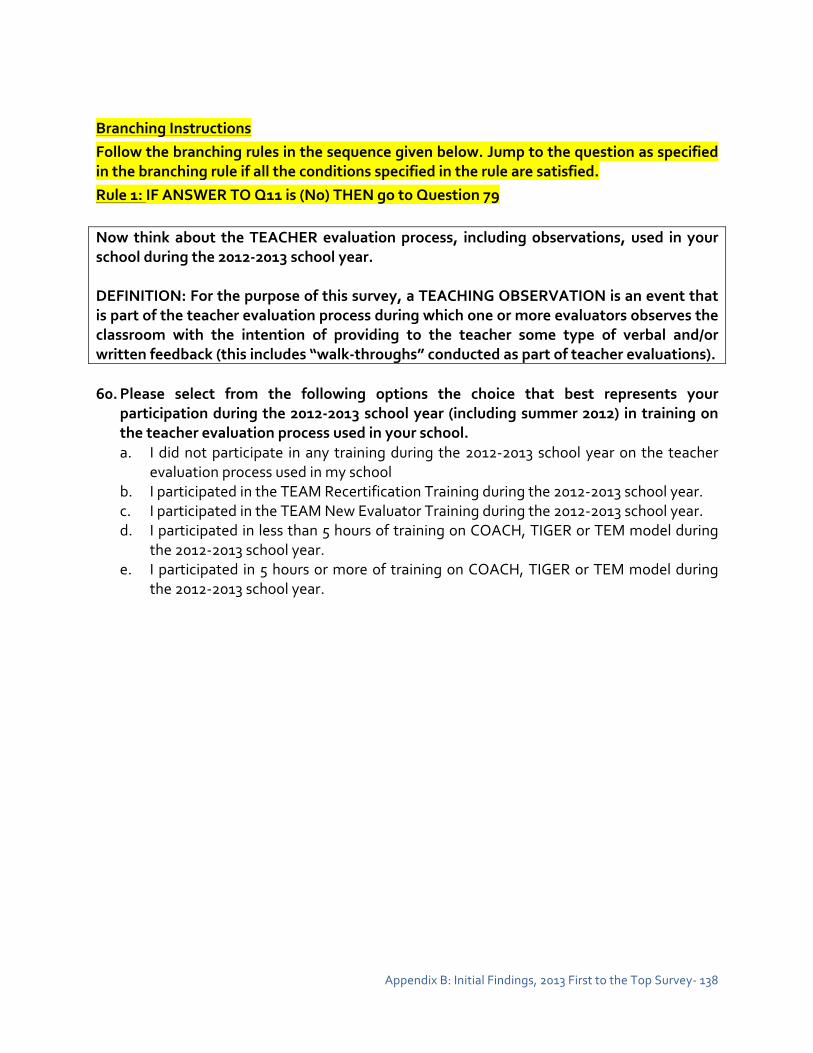
Appendix B: Initial Findings, 2013 First to the Top Survey-‐ 138
Branching Instructions Follow the branching rules in the sequence given below. Jump to the question as specified in the branching rule if all the conditions specified in the rule are satisfied. Rule 1: IF ANSWER TO Q11 is (No) THEN go to Question 79 Now think about the TEACHER evaluation process, including observations, used in your school during the 2012-‐2013 school year. DEFINITION: For the purpose of this survey, a TEACHING OBSERVATION is an event that is part of the teacher evaluation process during which one or more evaluators observes the classroom with the intention of providing to the teacher some type of verbal and/or written feedback (this includes “walk-‐throughs” conducted as part of teacher evaluations). 60. Please select from the following options the choice that best represents your
participation during the 2012-‐2013 school year (including summer 2012) in training on the teacher evaluation process used in your school. a. I did not participate in any training during the 2012-‐2013 school year on the teacher
evaluation process used in my school b. I participated in the TEAM Recertification Training during the 2012-‐2013 school year. c. I participated in the TEAM New Evaluator Training during the 2012-‐2013 school year. d. I participated in less than 5 hours of training on COACH, TIGER or TEM model during
the 2012-‐2013 school year. e. I participated in 5 hours or more of training on COACH, TIGER or TEM model during
the 2012-‐2013 school year.
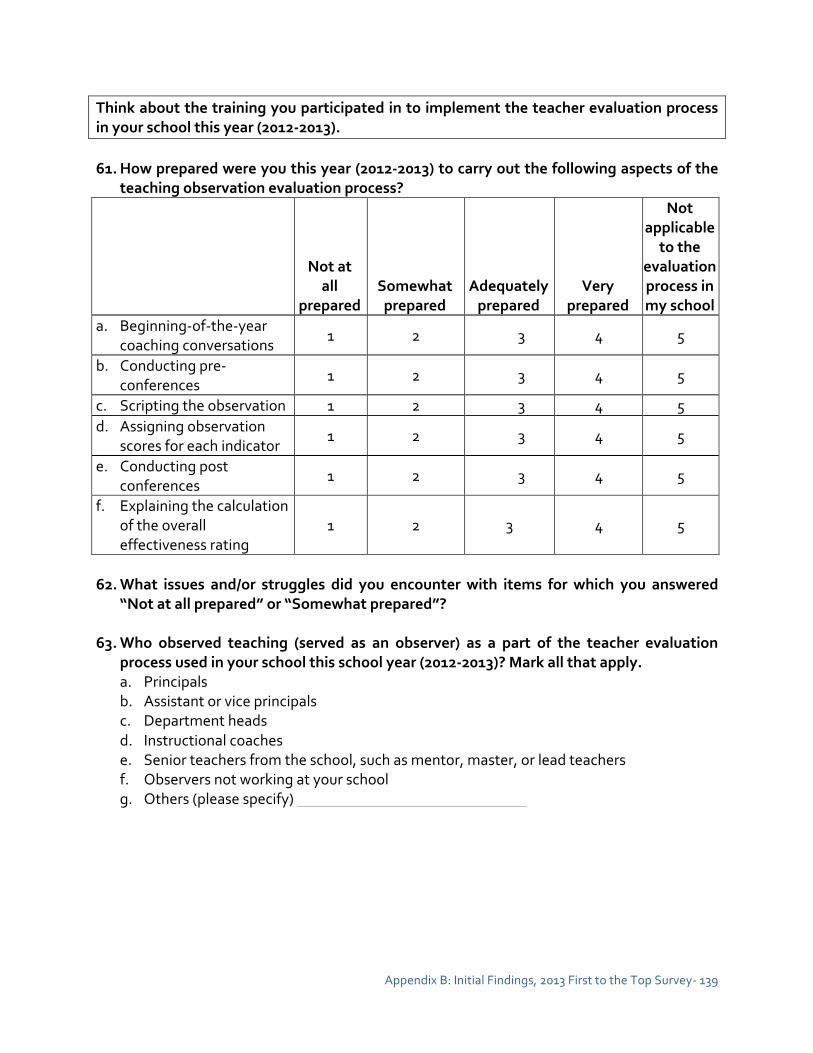
Appendix B: Initial Findings, 2013 First to the Top Survey-‐ 139
Think about the training you participated in to implement the teacher evaluation process in your school this year (2012-‐2013). 61. How prepared were you this year (2012-‐2013) to carry out the following aspects of the
teaching observation evaluation process?
Not at all
prepared Somewhat prepared
Adequately prepared
Very prepared
Not applicable to the
evaluation process in my school
a. Beginning-‐of-‐the-‐year coaching conversations
1 2 3 4 5
b. Conducting pre-‐conferences
1 2 3 4 5
c. Scripting the observation 1 2 3 4 5 d. Assigning observation
scores for each indicator 1 2 3 4 5
e. Conducting post conferences
1 2 3 4 5
f. Explaining the calculation of the overall effectiveness rating
1 2 3 4 5
62. What issues and/or struggles did you encounter with items for which you answered
“Not at all prepared” or “Somewhat prepared”? 63. Who observed teaching (served as an observer) as a part of the teacher evaluation
process used in your school this school year (2012-‐2013)? Mark all that apply. a. Principals b. Assistant or vice principals c. Department heads d. Instructional coaches e. Senior teachers from the school, such as mentor, master, or lead teachers f. Observers not working at your school g. Others (please specify)

Appendix B: Initial Findings, 2013 First to the Top Survey-‐ 140
64. To date, how many TOTAL times during this school year (2012-‐2013) have you conducted a teaching observation (including “walk-‐throughs”)? a. 1 to 5 b. 6 to 10 c. 11 to 20 d. 21 to 30 e. 31 to 40 f. 41 to 50 g. 51 to 60 h. 61 to 70 i. 71 to 80 j. 81 to 90 k. 91 to 100 l. Over 100
65. On average, how many hours per week did you spend on work related to teacher
evaluations (e.g., conducting pre-‐conferences and coaching conversations, observing teachers, preparing and sharing feedback, recording evaluation results, etc.) a. 0 to 3 b. 4 to 6 c. 7 to 9 d. 10 to 12 e. 13 to 16 f. Over 16 hours per week
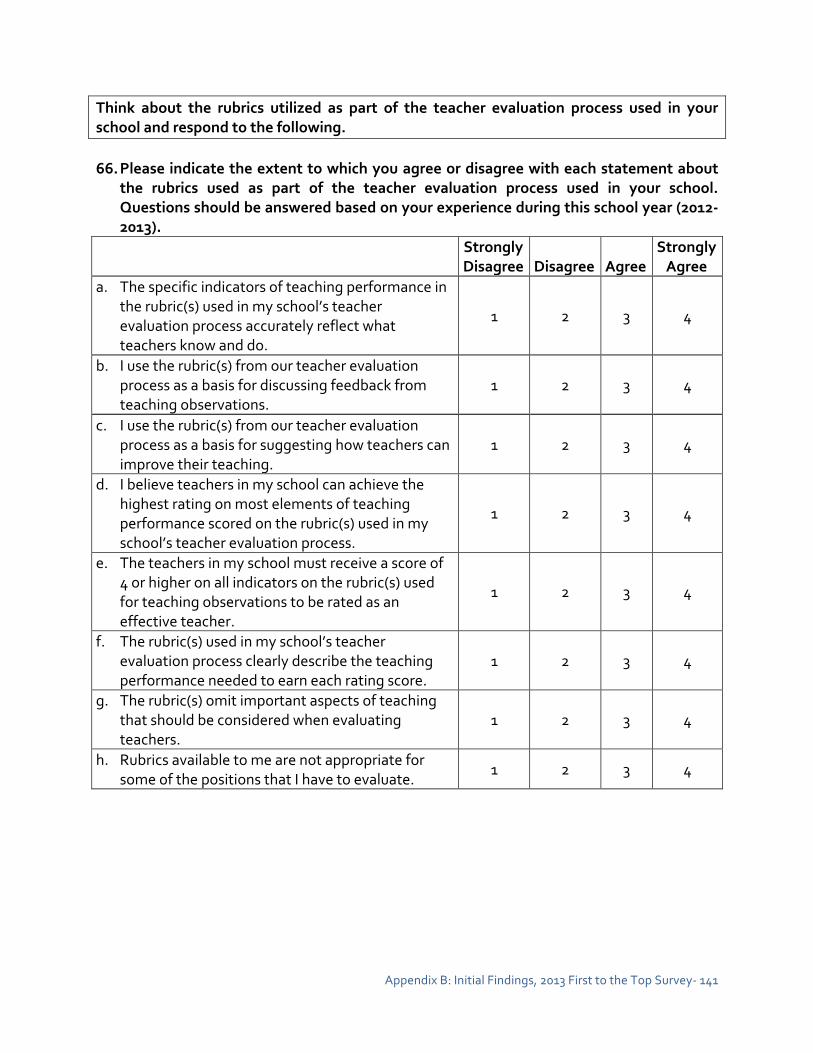
Appendix B: Initial Findings, 2013 First to the Top Survey-‐ 141
Think about the rubrics utilized as part of the teacher evaluation process used in your school and respond to the following. 66. Please indicate the extent to which you agree or disagree with each statement about
the rubrics used as part of the teacher evaluation process used in your school. Questions should be answered based on your experience during this school year (2012-‐2013). Strongly
Disagree Disagree Agree Strongly Agree
a. The specific indicators of teaching performance in the rubric(s) used in my school’s teacher evaluation process accurately reflect what teachers know and do.
1 2 3 4
b. I use the rubric(s) from our teacher evaluation process as a basis for discussing feedback from teaching observations.
1 2 3 4
c. I use the rubric(s) from our teacher evaluation process as a basis for suggesting how teachers can improve their teaching.
1 2 3 4
d. I believe teachers in my school can achieve the highest rating on most elements of teaching performance scored on the rubric(s) used in my school’s teacher evaluation process.
1 2 3 4
e. The teachers in my school must receive a score of 4 or higher on all indicators on the rubric(s) used for teaching observations to be rated as an effective teacher.
1 2 3 4
f. The rubric(s) used in my school’s teacher evaluation process clearly describe the teaching performance needed to earn each rating score.
1 2 3 4
g. The rubric(s) omit important aspects of teaching that should be considered when evaluating teachers.
1 2 3 4
h. Rubrics available to me are not appropriate for some of the positions that I have to evaluate.
1 2 3 4

Appendix B: Initial Findings, 2013 First to the Top Survey-‐ 142
67. We would like to know how you perceive the focus of the feedback you provided to teachers during the teacher evaluation process used at your school this school year (2012-‐2013). Overall, was the feedback you provided focused more on helping teachers improve their teaching or was it more focused on making a judgment about their performance? Please select one of the following three options: a. The feedback I provided was focused MORE on HELPING TEACHERS IMPROVE their
teaching than making a judgment about their performance. b. The feedback I provided was focused MORE on MAKING A JUDGMENT about
teachers’ performance than helping them improve their teaching. c. The feedback I provided was EQUALLY FOCUSED on helping teachers improve their
teaching and making a judgment about their performance.
68. During a typical post-‐conference, how much do you focus on each of the following topics?
None Only a Little Some
A Significant Amount
a. Reviewing the strategy and goal(s) discussed in the pre-‐conference
1 2 3 4
b. Using the rubric to explain the ratings you assigned based on the teaching observation
1 2 3 4
c. Discussing area(s) identified for refinement
1 2 3 4
d. Discussing area(s) identified for reinforcement
1 2 3 4
e. Suggesting resources teachers might pursue to address area(s) identified for refinement
1 2 3 4
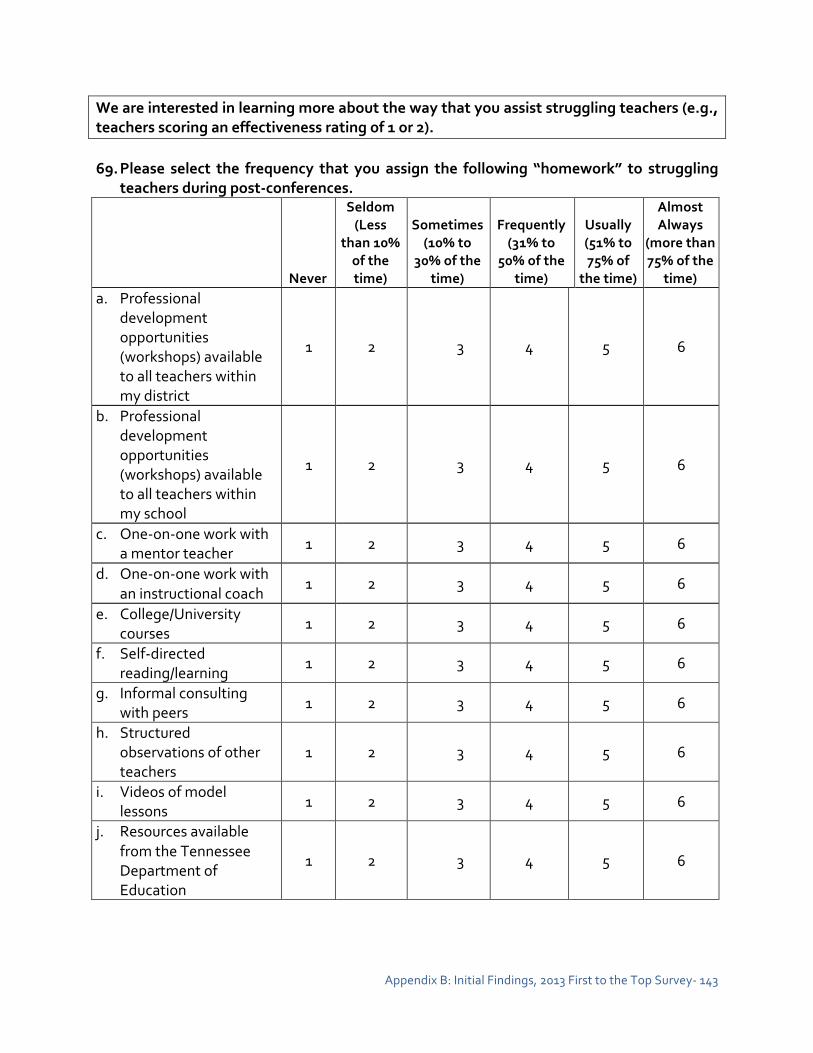
Appendix B: Initial Findings, 2013 First to the Top Survey-‐ 143
We are interested in learning more about the way that you assist struggling teachers (e.g., teachers scoring an effectiveness rating of 1 or 2). 69. Please select the frequency that you assign the following “homework” to struggling
teachers during post-‐conferences.
Never
Seldom (Less
than 10% of the time)
Sometimes (10% to
30% of the time)
Frequently (31% to
50% of the time)
Usually (51% to 75% of
the time)
Almost Always
(more than 75% of the
time) a. Professional
development opportunities (workshops) available to all teachers within my district
1 2 3 4 5 6
b. Professional development opportunities (workshops) available to all teachers within my school
1 2 3 4 5 6
c. One-‐on-‐one work with a mentor teacher
1 2 3 4 5 6
d. One-‐on-‐one work with an instructional coach
1 2 3 4 5 6
e. College/University courses
1 2 3 4 5 6
f. Self-‐directed reading/learning
1 2 3 4 5 6
g. Informal consulting with peers
1 2 3 4 5 6
h. Structured observations of other teachers
1 2 3 4 5 6
i. Videos of model lessons
1 2 3 4 5 6
j. Resources available from the Tennessee Department of Education
1 2 3 4 5 6

Appendix B: Initial Findings, 2013 First to the Top Survey-‐ 144
70. Please add additional pertinent information concerning the processes and resources you utilize to assist struggling teachers below.
Think about the measures and ratings used in the teacher evaluation process and respond to the following.
71. How strongly do you agree or disagree with each of the following statements about the
teacher evaluation process used in your school during this school year (2012-‐2013)? Strongly
Disagree Disagree Agree Strongly Agree
a. I believe that the GROWTH MEASURE included in my teachers’ overall effectiveness rating accurately reflects their contribution to student learning.
1 2 3 4
b. I believe that the ACHIEVEMENT MEASURE included in my teachers’ overall effectiveness rating accurately reflects their contribution to student learning.
1 2 3 4
c. I believe that the QUALITATIVE/OBSERVATION MEASURE included in my teachers’ overall effectiveness rating accurately reflects their contribution to student learning.
1 2 3 4
d. Generally speaking, teachers and I agree on which approved measure to use for the ACHIEVEMENT MEASURE.
1 2 3 4
e. I understand how a teacher’s overall teacher effectiveness rating is calculated.
1 2 3 4
f. Teachers understand how their overall teacher effectiveness rating is calculated.
1 2 3 4
72. Will results from student surveys (e.g., Tripod) be utilized as a component of the
teacher evaluation process used in your school during this school year (2012-‐2013)? a. Yes b. No c. I don’t know
73. To what extent do you agree that results from student surveys focused on what
happens in a classroom can provide useful information for improving teaching? a. Strongly Disagree b. Disagree c. Agree d. Strongly Agree
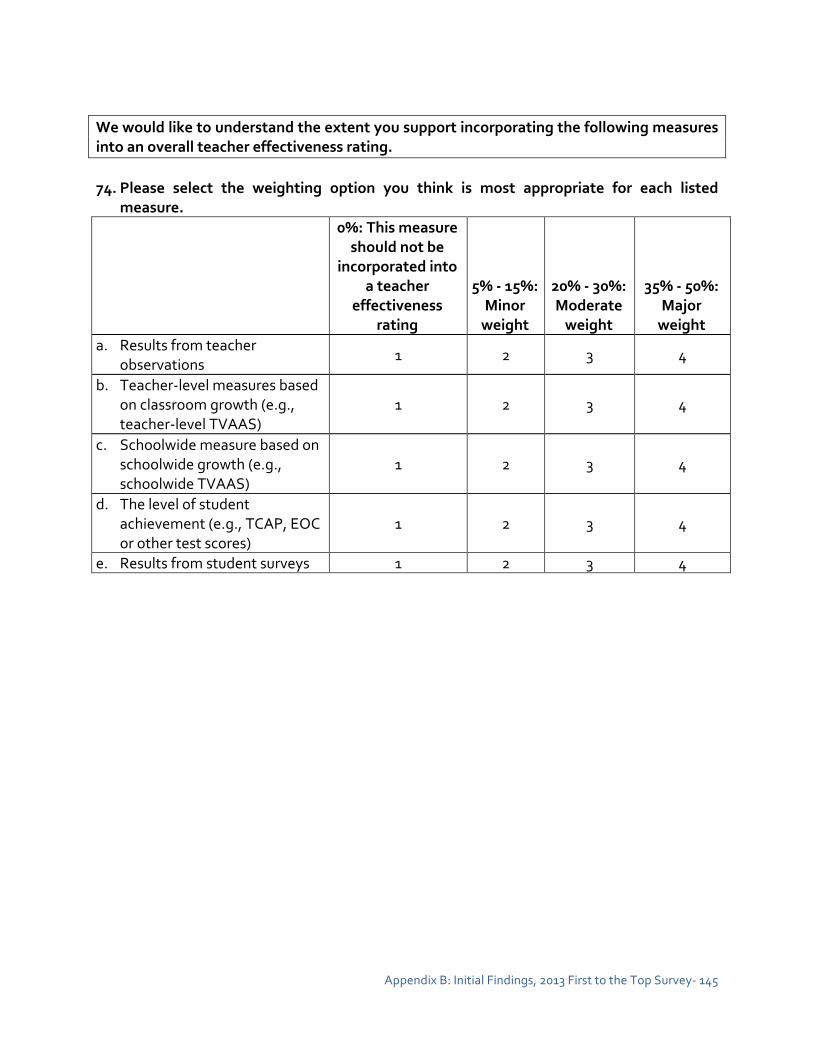
Appendix B: Initial Findings, 2013 First to the Top Survey-‐ 145
We would like to understand the extent you support incorporating the following measures into an overall teacher effectiveness rating. 74. Please select the weighting option you think is most appropriate for each listed
measure. 0%: This measure
should not be incorporated into
a teacher effectiveness
rating
5% -‐ 15%: Minor weight
20% -‐ 30%: Moderate weight
35% -‐ 50%: Major weight
a. Results from teacher observations
1 2 3 4
b. Teacher-‐level measures based on classroom growth (e.g., teacher-‐level TVAAS)
1 2 3 4
c. Schoolwide measure based on schoolwide growth (e.g., schoolwide TVAAS)
1 2 3 4
d. The level of student achievement (e.g., TCAP, EOC or other test scores)
1 2 3 4
e. Results from student surveys 1 2 3 4

Appendix B: Initial Findings, 2013 First to the Top Survey-‐ 146
Think about the teacher evaluation process used in your school this year (2012-‐2013) and respond to the following. 75. Please indicate how strongly you agree or disagree with each of the following
statements about the teacher evaluation process used in your school during this school year (2012-‐2013). Strongly
Disagree Disagree Agree Strongly Agree
a. Teacher evaluation processes used in my school are fair to my teachers.
1 2 3 4
b. The teacher evaluation process causes me a lot of stress.
1 2 3 4
c. The teacher evaluation process helps teachers to improve their teaching
1 2 3 4
d. The teacher evaluation process is burdensome for me.
1 2 3 4
e. Teacher evaluation outcomes influence the professional development activities conducted at my school.
1 2 3 4
f. Teaching observations disrupt classroom instruction
1 2 3 4
g. Feedback to individual teachers based on their evaluations influences the professional development in which they participate.
1 2 3 4
h. I am qualified to evaluate teaching. 1 2 3 4 i. In general, I believe that the teacher evaluation
process used in my school will improve student achievement.
1 2 3 4
j. In general, the teacher evaluation process used in my school takes more effort than the results are worth.
1 2 3 4
k. Overall, I am satisfied with the teacher evaluation process used in my school.
1 2 3 4

Appendix B: Initial Findings, 2013 First to the Top Survey-‐ 147
We would like to know your opinion about how results from the teacher evaluation process should inform decisions within your school. 76. To what extent should the overall teacher effectiveness rating factor into decisions
concerning each of the items listed below? No
Importance Low
Importance Moderate Importance
High Importance
a. Professional development for teachers
1 2 3 4
b. Teacher compensation 1 2 3 4 c. Teacher advancement 1 2 3 4 d. Teacher retention 1 2 3 4 e. Teacher tenure 1 2 3 4 f. Assigning students to teachers 1 2 3 4 g. Assigning mentors or coaches to
teachers 1 2 3 4
h. Developing or designing interventions for students
1 2 3 4
77. Generally speaking, what BENEFITS have you experienced from the teacher evaluation
process being used at your school this year (2012-‐2013)? 78. Generally speaking, what CHALLENGES have you encountered with the teacher
evaluation process being used at your school this year (2012-‐2013)?

Appendix B: Initial Findings, 2013 First to the Top Survey-‐ 148
Think about how you have spent your time and effort during this year (2012-‐2013) compared to last year (2011-‐2012) and respond to the following.
79. Please indicate if you increased or decreased the time and effort you spent in the
following kinds of activities during the current school year (2012-‐2013) compared to last year (2011-‐2012).
Less time and effort
than last year
The same amount of time and
effort as last year
More time and effort
than last year
Not Applicable
a. Identifying topics requiring more or less emphasis in teachers’ instruction
1 2 3 4
b. Encouraging parent involvement in student learning
1 2 3 4
c. Finding and engaging in professional development opportunities to improve my content knowledge
1 2 3 4
d. Finding and engaging in professional development opportunities to improve my pedagogical knowledge
1 2 3 4
e. Attending district-‐ or school-‐sponsored workshops
1 2 3 4
f. Disciplining students 1 2 3 4 g. Interacting with teachers about their teaching 1 2 3 4 h. Completing tasks required for teaching
observations and evaluation activities 1 2 3 4
i. Analyzing student performance data 1 2 3 4 j. Promoting and sustaining collaborative staff
efforts (e.g., professional learning communities)
1 2 3 4
k. Addressing “nuts and bolts” organizational issues such as building maintenance, budgeting, and technological infrastructure
1 2 3 4
l. Communicating with staff about district and state policy changes
1 2 3 4
m. Attending district-‐level meetings (e.g., committees, task forces, administrator meetings, etc.)
1 2 3 4
n. Building and supporting a positive school culture
1 2 3 4
o. Planning professional development for teachers
1 2 3 4
p. Locating instructional resources for teachers 1 2 3 4

Appendix B: Initial Findings, 2013 First to the Top Survey-‐ 149
80. For each subject shown below, indicate which source is MOST IMPORTANT to your teachers for determining what students should learn in their classrooms.
N/A, not
taught in my school
Tennessee Curriculum Standards
Common Core
Standards District
Curriculum Text-‐book(s)
Teacher-‐Developed Lesson Plans & Materials
Other Source
a. Mathematics (includes Algebra, Geometry, and other specialized high school math courses)
1 2 3 4 5 6 7
b. English / language arts
1 2 3 4 5 6 7
c. Science 1 2 3 4 5 6 7 d. Social Studies
(includes history, civics, general business, etc.)
1 2 3 4 5 6 7
e. Health and Physical Education
1 2 3 4 5 6 7
f. Art 1 2 3 4 5 6 7 g. Music 1 2 3 4 5 6 7 h. Family and
Consumer Science
1 2 3 4 5 6 7
i. Industrial Technology
1 2 3 4 5 6 7
j. Computer-‐Based Subjects
1 2 3 4 5 6 7
k. Career Education Programs (e.g., Marketing, Business, Health Occupations, Trade, Industrial programs, etc.)
1 2 3 4 5 6 7
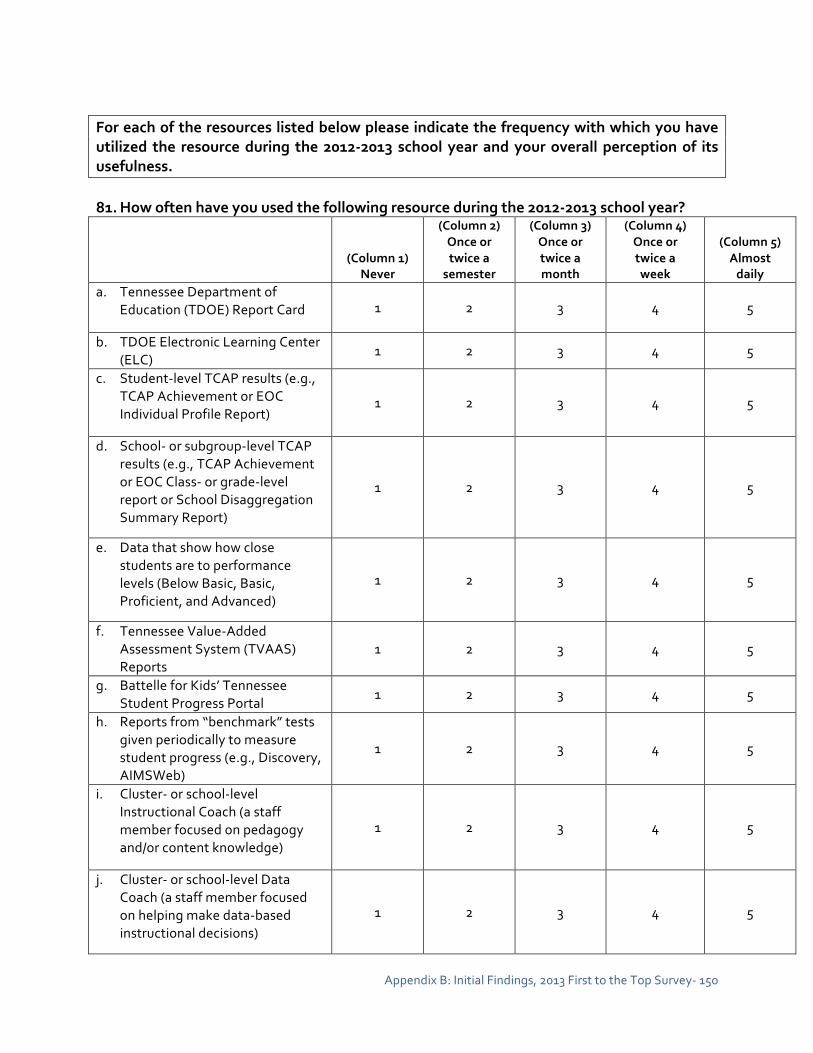
Appendix B: Initial Findings, 2013 First to the Top Survey-‐ 150
For each of the resources listed below please indicate the frequency with which you have utilized the resource during the 2012-‐2013 school year and your overall perception of its usefulness. 81. How often have you used the following resource during the 2012-‐2013 school year?
(Column 1) Never
(Column 2) Once or twice a
semester
(Column 3) Once or twice a month
(Column 4) Once or twice a week
(Column 5) Almost daily
a. Tennessee Department of Education (TDOE) Report Card 1 2 3 4 5
b. TDOE Electronic Learning Center (ELC)
1 2 3 4 5
c. Student-‐level TCAP results (e.g., TCAP Achievement or EOC Individual Profile Report)
1 2 3 4 5
d. School-‐ or subgroup-‐level TCAP results (e.g., TCAP Achievement or EOC Class-‐ or grade-‐level report or School Disaggregation Summary Report)
1 2 3 4 5
e. Data that show how close students are to performance levels (Below Basic, Basic, Proficient, and Advanced)
1 2 3 4 5
f. Tennessee Value-‐Added Assessment System (TVAAS) Reports
1 2 3 4 5
g. Battelle for Kids’ Tennessee Student Progress Portal
1 2 3 4 5
h. Reports from “benchmark” tests given periodically to measure student progress (e.g., Discovery, AIMSWeb)
1 2 3 4 5
i. Cluster-‐ or school-‐level Instructional Coach (a staff member focused on pedagogy and/or content knowledge)
1 2 3 4 5
j. Cluster-‐ or school-‐level Data Coach (a staff member focused on helping make data-‐based instructional decisions)
1 2 3 4 5

Appendix B: Initial Findings, 2013 First to the Top Survey-‐ 151
k. NIET Best Practices Portal 1 2 3 4 5 l. The CODE System Teacher
Evaluation Data Platform 1 2 3 4 5
m. The TNCore.org website 1 2 3 4 5 n. The Team-‐TN.org website 1 2 3 4 5 NOTE: Question 82 should only be answered if the answer to Question 81 is in Column 2, 3, 4, or 5 82. What is your overall perception about the usefulness of this resource? Not
Useful Somewhat
Useful Useful Very Useful
a. Tennessee Department of Education (TDOE) Report Card
1 2 3 4
b. TDOE Electronic Learning Center (ELC) 1 2 3 4 c. Student-‐level TCAP results (e.g., TCAP
Achievement or EOC Individual Profile Report) 1 2 3 4
d. School-‐ or subgroup-‐level TCAP results (e.g., TCAP Achievement or EOC Class-‐ or grade-‐level report or School Disaggregation Summary Report)
1 2 3 4
e. Data that show how close students are to performance levels (Below Basic, Basic, Proficient, and Advanced)
1 2 3 4
f. Tennessee Value-‐Added Assessment System (TVAAS) Reports
1 2 3 4
g. Battelle for Kids’ Tennessee Student Progress Portal
1 2 3 4
h. Reports from “benchmark” tests given periodically to measure student progress (e.g., Discovery, AIMSWeb)
1 2 3 4
i. Cluster-‐ or school-‐level Instructional Coach (a staff member focused on pedagogy and/or content knowledge)
1 2 3 4
j. Cluster-‐ or school-‐level Data Coach (a staff member focused on helping make data-‐based instructional decisions)
1 2 3 4
k. NIET Best Practices Portal 1 2 3 4 l. The CODE System Teacher Evaluation Data
Platform 1 2 3 4
m. The TNCore.org website 1 2 3 4 n. The Team-‐TN.org website 1 2 3 4

Appendix B: Initial Findings, 2013 First to the Top Survey-‐ 152
Think generally about this school year (2012-‐2013) and respond to the following.
83. To what extent do you agree or disagree with each of the following statements
concerning this school year (2012-‐2013)? Strongly
Disagree Disagree Agree Strongly Agree
a. The stress and disappointments involved in being at this school aren’t really worth it.
1 2 3 4
b. The staff at this school like being here; I would describe us as a satisfied group.
1 2 3 4
c. I like the way things are run at this school. 1 2 3 4 d. If I could get a higher paying job I’d leave
education as soon as possible. 1 2 3 4
e. I think about transferring to another school. 1 2 3 4 f. I don’t seem to have as much enthusiasm now as I
did when I began in education. 1 2 3 4
g. I think about staying home from school because I’m just too tired to go.
1 2 3 4
84. If you could go back to your college days and start over again, would you become an
educator or not? a. Certainly would become an educator. b. Probably would become an educator. c. Chances about even to become an educator. d. Probably would not become an educator. e. Certainly would not become an educator.
85. How long do you plan to remain in education?
a. As long as I am able. b. Until I am eligible for retirement benefits from this job. c. Until I am eligible for retirement benefits from a previous job. d. Until I am eligible for Social Security benefits. e. Until a specific life event occurs (e.g., parenthood, marriage). f. Definitely plan to leave as soon as I can. g. Undecided at this time.
86. Do you plan to return to this school next year?
a. Yes b. No c. I don’t know Go to End of Survey
Appendix B: Initial Findings, 2013 First to the Top Survey-‐ 153
87. This survey is targeted towards educators who work within a single school. Thank you for your time. Please share any feedback you have about educator evaluation in the box below.
End of Survey

Appendix B: Initial Findings, 2013 First to the Top Survey-‐ 154
Part III: Survey Modules for Teachers
Module 1: Great Teachers and Leaders
Think about interactions that you have had with other teachers in your school this year (2012-‐2013) and respond to the following. 1. How frequently have you done each of the following with other teachers in your school
during the 2012-‐2013 school year?
Never
Once or twice a
semester
Once or twice a month
Once or twice a week
Almost Daily
a. Shared and/or discussed beliefs about teaching and learning
1 2 3 4 5
b. Shared and/or discussed what was learned at a workshop or conference
1 2 3 4 5
c. Shared and/or discussed student work 1 2 3 4 5 d. Shared and/or discussed specific lessons
that were not successful 1 2 3 4 5
e. Shared and/or discussed specific lessons that were particularly effective
1 2 3 4 5
f. Shared and/or discussed effective instructional practices for English Language Learners
1 2 3 4 5
g. Shared and/or discussed effective instructional practices for low-‐performing students
1 2 3 4 5
h. Shared and/or discussed effective instructional practices for high-‐performing students
1 2 3 4 5
i. Shared and/or discussed effective instructional practices for students with disabilities
1 2 3 4 5
j. Shared and/or discussed instructional resources
1 2 3 4 5

Appendix B: Initial Findings, 2013 First to the Top Survey-‐ 155
Think about teachers and students in your school this year (2012-‐2013) and respond to the following. 2. To what extent do you agree or disagree with the following statements about your
school during the 2012-‐2013 school year. Strongly
Disagree Disagree Agree Strongly Agree
a. When making important decisions, teachers in this school always focus on what’s best for student learning.
1 2 3 4
b. Teachers in this school have high expectations for our students’ achievement.
1 2 3 4
c. Teachers in this school think it’s important that all students do well in their classes.
1 2 3 4
d. Teachers in this school encourage students to keep trying even when the work is challenging.
1 2 3 4
e. Students at this school are expected to master the content they are working on before moving to new topics.
1 2 3 4
f. Teachers in this school stress the importance of “trying hard” to the students.
1 2 3 4
g. Teachers in this school let students know that making mistakes is OK as long as they are learning and improving.
1 2 3 4
h. Teachers in this school place an emphasis on really understanding schoolwork, not just memorizing it.
1 2 3 4

Appendix B: Initial Findings, 2013 First to the Top Survey-‐ 156
Think about your principal’s leadership during this school year (2012-‐2013) and respond to the following. 3. To what extent do you agree or disagree with each of the following statements about
your principal during this school year (2012-‐2013)?
Strongly Disagree Disagree Agree
Strongly Agree
a. The principal at my school monitors student academic progress.
1 2 3 4
b. The principal at my school interacts regularly with students about their learning.
1 2 3 4
c. My principal is doing a good job. 1 2 3 4 d. The principal at my school presses teachers to
implement what they have learned in professional development.
1 2 3 4
e. The principal at my school communicates a clear vision for this school.
1 2 3 4
f. I am pleased with the way my principal runs this school.
1 2 3 4
g. The principal at my school sets high standards for student learning.
1 2 3 4
h. The principal at my school sets high standards for teaching.
1 2 3 4
i. I would be happy to continue working with my principal in the future.
1 2 3 4
j. The principal at my school makes clear to the staff his or her expectations for meeting instructional goals.
1 2 3 4
k. The principal at my school is available to teachers to discuss teacher evaluation results.
1 2 3 4

Appendix B: Initial Findings, 2013 First to the Top Survey-‐ 157
Think about your school during the 2012-‐2013 school year and respond to the following. 4. To what extent do you agree or disagree with the following statements about the
conditions at your school during the 2011-‐12 school year?
Strongly Disagree Disagree Agree
Strongly Agree
a. Leaders value teachers’ ideas. 1 2 3 4 b. Leaders in this school trust the professional
judgment of teachers. 1 2 3 4
c. Leaders take time to praise teachers that perform well.
1 2 3 4
d. Teachers are involved in the decision-‐making process.
1 2 3 4
e. Leaders in our school facilitate teachers working together.
1 2 3 4
f. Teachers are kept informed on current issues in the school.
1 2 3 4
g. Teachers’ involvement in policy or decision-‐making is taken seriously.
1 2 3 4
h. Teachers are rewarded for experimenting with new ideas and techniques.
1 2 3 4
i. Leaders support risk-‐taking and innovation in teaching.
1 2 3 4
j. Administrators protect instructional time. 1 2 3 4 k. Administrators protect planning time. 1 2 3 4 l. Teachers are encouraged to share ideas. 1 2 3 4 m. Teachers and leaders regularly engage in
conversations about improving instruction. 1 2 3 4
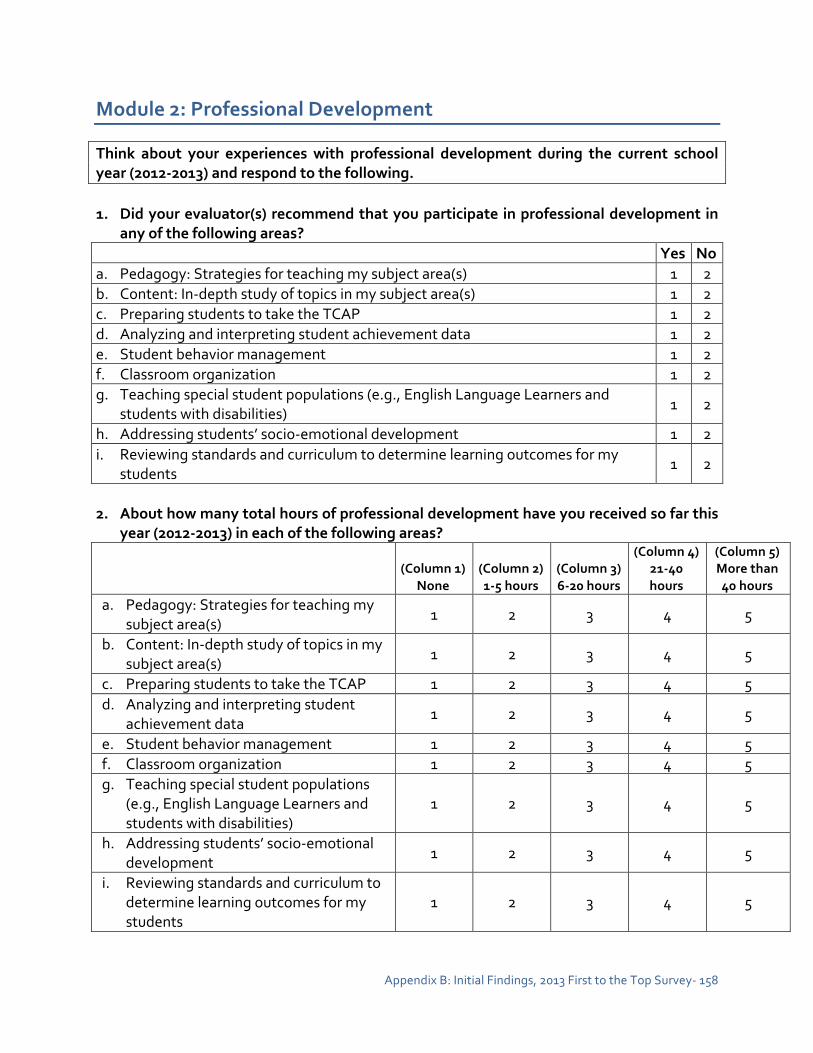
Appendix B: Initial Findings, 2013 First to the Top Survey-‐ 158
Module 2: Professional Development
Think about your experiences with professional development during the current school year (2012-‐2013) and respond to the following. 1. Did your evaluator(s) recommend that you participate in professional development in
any of the following areas? Yes No
a. Pedagogy: Strategies for teaching my subject area(s) 1 2 b. Content: In-‐depth study of topics in my subject area(s) 1 2 c. Preparing students to take the TCAP 1 2 d. Analyzing and interpreting student achievement data 1 2 e. Student behavior management 1 2 f. Classroom organization 1 2 g. Teaching special student populations (e.g., English Language Learners and
students with disabilities) 1 2
h. Addressing students’ socio-‐emotional development 1 2 i. Reviewing standards and curriculum to determine learning outcomes for my
students 1 2
2. About how many total hours of professional development have you received so far this
year (2012-‐2013) in each of the following areas?
(Column 1) None
(Column 2) 1-‐5 hours
(Column 3) 6-‐20 hours
(Column 4) 21-‐40 hours
(Column 5) More than 40 hours
a. Pedagogy: Strategies for teaching my subject area(s)
1 2 3 4 5
b. Content: In-‐depth study of topics in my subject area(s)
1 2 3 4 5
c. Preparing students to take the TCAP 1 2 3 4 5 d. Analyzing and interpreting student
achievement data 1 2 3 4 5
e. Student behavior management 1 2 3 4 5 f. Classroom organization 1 2 3 4 5 g. Teaching special student populations
(e.g., English Language Learners and students with disabilities)
1 2 3 4 5
h. Addressing students’ socio-‐emotional development
1 2 3 4 5
i. Reviewing standards and curriculum to determine learning outcomes for my students
1 2 3 4 5

Appendix B: Initial Findings, 2013 First to the Top Survey-‐ 159
NOTE: Question 3 should be answered only if the answer to Question 2 is in Column 2, 3, 4, or 5. 3. Please indicate how valuable you found this professional development for helping you
improve your teaching? Hindered
my ability to improve
my teaching
Did not help me improve
my teaching
Helped me
improve my
teaching a little
Helped me
improve my
teaching a lot
a. Pedagogy: Strategies for teaching my subject area(s)
1 2 3 4
b. Content: In-‐depth study of topics in my subject area(s)
1 2 3 4
c. Preparing students to take the TCAP 1 2 3 4 d. Analyzing and interpreting student
achievement data 1 2 3 4
e. Student behavior management 1 2 3 4 f. Classroom organization 1 2 3 4 g. Teaching special student populations (e.g.,
English Language Learners and students with disabilities)
1 2 3 4
h. Addressing students’ socio-‐emotional development
1 2 3 4
i. Reviewing standards and curriculum to determine learning outcomes for my students
1 2 3 4
4. Please rank how important each of the following factors was in determining which
professional development activities you participated in during this school year. The factor that had the most influence should be ranked 1, the factor that has the second most influence should be ranked 2, etc. For factors that had no influence please input a 0. a. __ Required attendance at school-‐based professional development b. __ Required attendance at district-‐based professional development c. __ Required attendance at professional development offered by the Tennessee DOE d. __ My personal assessment of areas where I need to improve e. __ Mandates from my administrator based on results from my teaching evaluation f. __ Suggestions from other teachers in my school

Appendix B: Initial Findings, 2013 First to the Top Survey-‐ 160
To what extent do you agree or disagree with the following statements concerning your experiences with professional development during the 2012-‐2013 school year? 5. Overall, professional development experiences this year (2012-‐2013)…
Strongly Disagree Disagree Agree
Strongly Agree
a. Included opportunities to work with teachers from other schools.
1 2 3 4
b. Included opportunities to try and evaluate new ideas.
1 2 3 4
c. Helped staff in my school work better together. 1 2 3 4 d. Improved my knowledge of the subject(s) I teach. 1 2 3 4 e. Helped me understand my students better. 1 2 3 4 f. Have been sustained and coherently focused. 1 2 3 4 g. Included opportunities to work with colleagues in
my school. 1 2 3 4
h. Led me to make changes in my teaching. 1 2 3 4 i. Addressed the needs of the students in my
classes. 1 2 3 4
j. Have included follow-‐up sessions or additional training.
1 2 3 4
k. Have been followed by support from school leaders in applying what I have learned.
1 2 3 4
l. Have been short term and unrelated. 1 2 3 4 m. Provided opportunities to address areas for
improvement noted in feedback from the teacher evaluation process used in my school.
1 2 3 4
n. Was aligned with my teaching assignment for the current school year (i.e., was job embedded).
1 2 3 4
o. Included opportunities to review student work related to classes I taught.
1 2 3 4
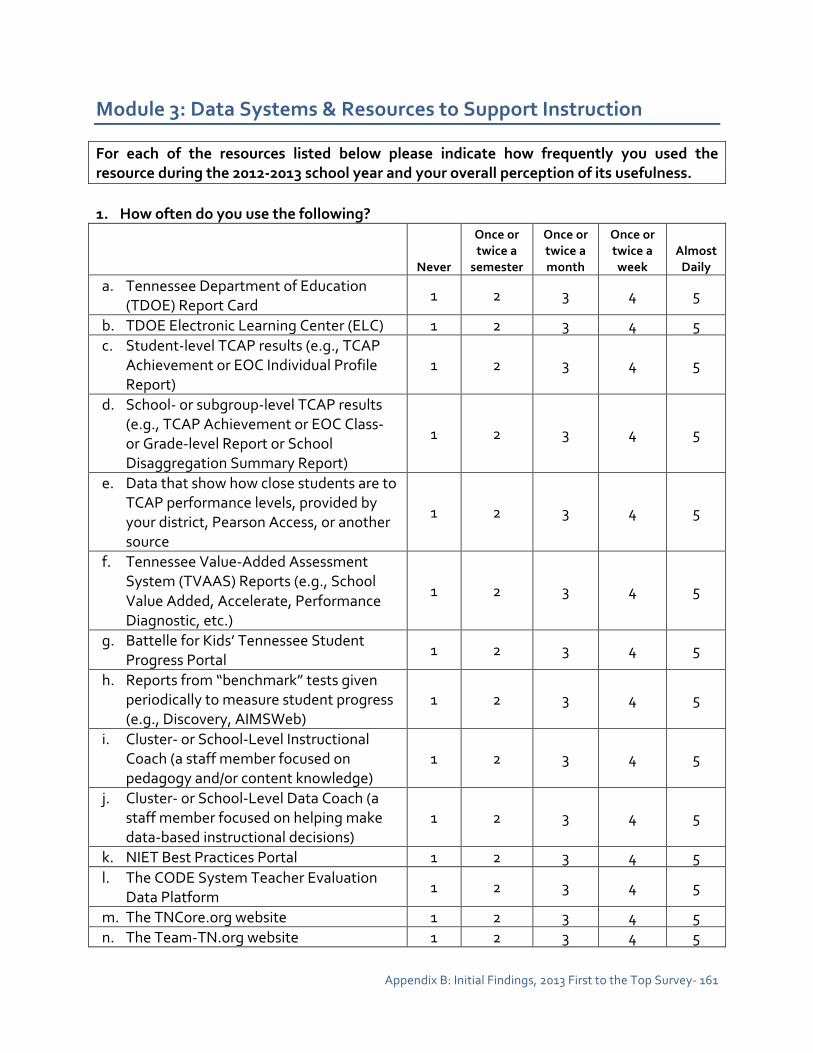
Appendix B: Initial Findings, 2013 First to the Top Survey-‐ 161
Module 3: Data Systems & Resources to Support Instruction
For each of the resources listed below please indicate how frequently you used the resource during the 2012-‐2013 school year and your overall perception of its usefulness. 1. How often do you use the following?
Never
Once or twice a
semester
Once or twice a month
Once or twice a week
Almost Daily
a. Tennessee Department of Education (TDOE) Report Card
1 2 3 4 5
b. TDOE Electronic Learning Center (ELC) 1 2 3 4 5 c. Student-‐level TCAP results (e.g., TCAP
Achievement or EOC Individual Profile Report)
1 2 3 4 5
d. School-‐ or subgroup-‐level TCAP results (e.g., TCAP Achievement or EOC Class-‐ or Grade-‐level Report or School Disaggregation Summary Report)
1 2 3 4 5
e. Data that show how close students are to TCAP performance levels, provided by your district, Pearson Access, or another source
1 2 3 4 5
f. Tennessee Value-‐Added Assessment System (TVAAS) Reports (e.g., School Value Added, Accelerate, Performance Diagnostic, etc.)
1 2 3 4 5
g. Battelle for Kids’ Tennessee Student Progress Portal
1 2 3 4 5
h. Reports from “benchmark” tests given periodically to measure student progress (e.g., Discovery, AIMSWeb)
1 2 3 4 5
i. Cluster-‐ or School-‐Level Instructional Coach (a staff member focused on pedagogy and/or content knowledge)
1 2 3 4 5
j. Cluster-‐ or School-‐Level Data Coach (a staff member focused on helping make data-‐based instructional decisions)
1 2 3 4 5
k. NIET Best Practices Portal 1 2 3 4 5 l. The CODE System Teacher Evaluation
Data Platform 1 2 3 4 5
m. The TNCore.org website 1 2 3 4 5 n. The Team-‐TN.org website 1 2 3 4 5

Appendix B: Initial Findings, 2013 First to the Top Survey-‐ 162
Note: Question 2 should be answered only if the answer to Question 1 is in Column 2, 3, 4, or 5. 2. What is your overall perception about the usefulness of each of the following
resources?
Not Useful
Somewhat useful Useful
Very Useful
a. Tennessee Department of Education (TDOE) Report Card
1 2 3 4
b. TDOE Electronic Learning Center (ELC) 1 2 3 4 c. Student-‐level TCAP results (e.g., TCAP
Achievement or EOC Individual Profile Report) 1 2 3 4
d. School-‐ or subgroup-‐level TCAP results (e.g., TCAP Achievement or EOC Class-‐ or Grade-‐level Report or School Disaggregation Summary Report)
1 2 3 4
e. Data that show how close students are to performance levels (Below Basic, Basic, Proficient, and Advanced)
1 2 3 4
f. Tennessee Value-‐Added Assessment System (TVAAS) Reports (e.g., School Value Added, Accelerate, Performance Diagnostic, etc.)
1 2 3 4
g. Battelle for Kids’ Tennessee Student Progress Portal
1 2 3 4
h. Reports from “benchmark” tests given periodically to measure student progress (e.g., Discovery, AIMSWeb)
1 2 3 4
i. Cluster-‐ or School-‐Level Instructional Coach (a staff member focused on pedagogy and/or content knowledge)
1 2 3 4
j. Cluster-‐ or School-‐Level Data Coach (a staff member focused on helping make data-‐based instructional decisions)
1 2 3 4
k. NIET Best Practices Portal 1 2 3 4 l. The CODE System Teacher Evaluation Data
Platform 1 2 3 4
m. The TNCore.org website 1 2 3 4 n. The Team-‐TN.org website 1 2 3 4 3. Did you log into the TVAAS restricted-‐use data website at any time during the 2012-‐
2013 school year using a personal login assigned to you? a. Yes b. No

Appendix B: Initial Findings, 2013 First to the Top Survey-‐ 163
How often do you use student test score data for each of the following purposes? Please consider all of different types of tests (TCAP, formative, classroom) when you answer. If you teach more than one subject or class, answer in terms of your typical practice in those classes in which tests are administered. 4. How often do you use student test score data for the following purposes?
Never
Once or twice a semester
Once or twice a month
Once or
twice a week
Almost Daily
a. Identify individual students who need additional assistance
1 2 3 4 5
b. Set learning goals for individual students 1 2 3 4 5 c. Tailor instruction to individual students’
needs 1 2 3 4 5
d. Develop recommendations for tutoring or other educational support services
1 2 3 4 5
e. Assign or reassign students to groups within my class
1 2 3 4 5
f. Identify topics requiring more or less emphasis in instruction
1 2 3 4 5
g. Encourage parent involvement in student learning
1 2 3 4 5
h. Identify areas where I need to strengthen my content knowledge or teaching skills
1 2 3 4 5
i. Discuss teaching and learning with my inquiry team or other teachers, coaches, etc.
1 2 3 4 5
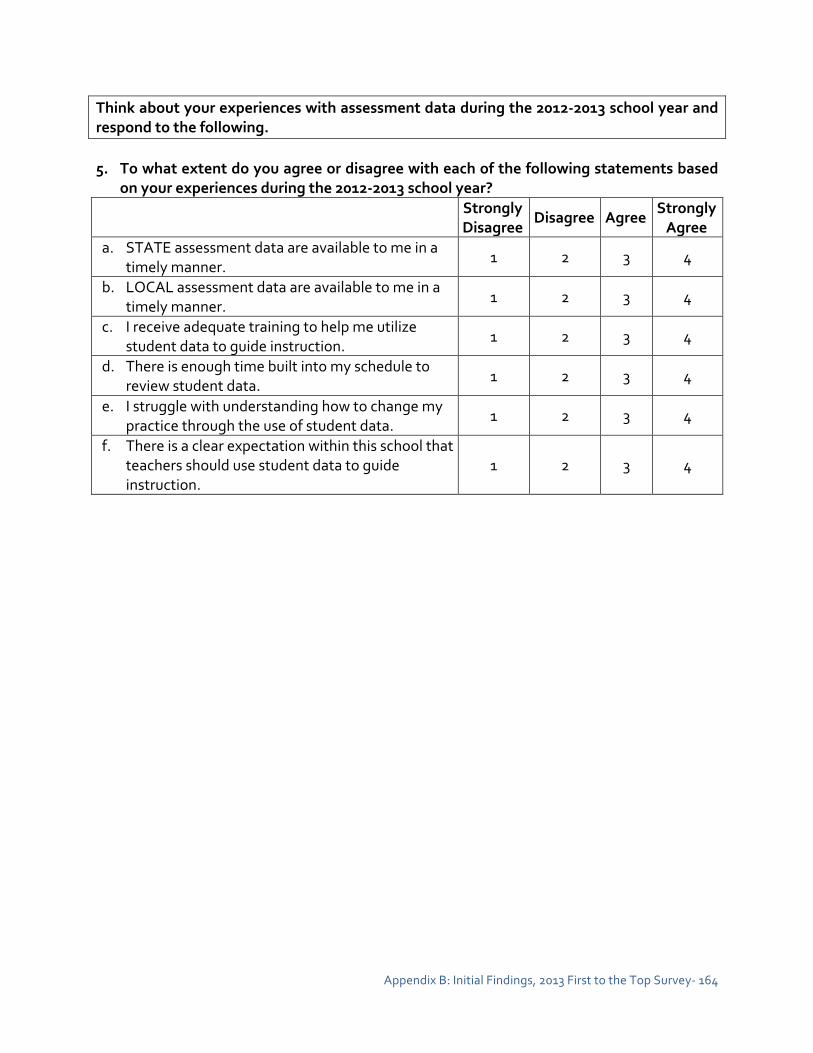
Appendix B: Initial Findings, 2013 First to the Top Survey-‐ 164
Think about your experiences with assessment data during the 2012-‐2013 school year and respond to the following. 5. To what extent do you agree or disagree with each of the following statements based
on your experiences during the 2012-‐2013 school year? Strongly
Disagree Disagree Agree
Strongly Agree
a. STATE assessment data are available to me in a timely manner.
1 2 3 4
b. LOCAL assessment data are available to me in a timely manner.
1 2 3 4
c. I receive adequate training to help me utilize student data to guide instruction.
1 2 3 4
d. There is enough time built into my schedule to review student data.
1 2 3 4
e. I struggle with understanding how to change my practice through the use of student data.
1 2 3 4
f. There is a clear expectation within this school that teachers should use student data to guide instruction.
1 2 3 4
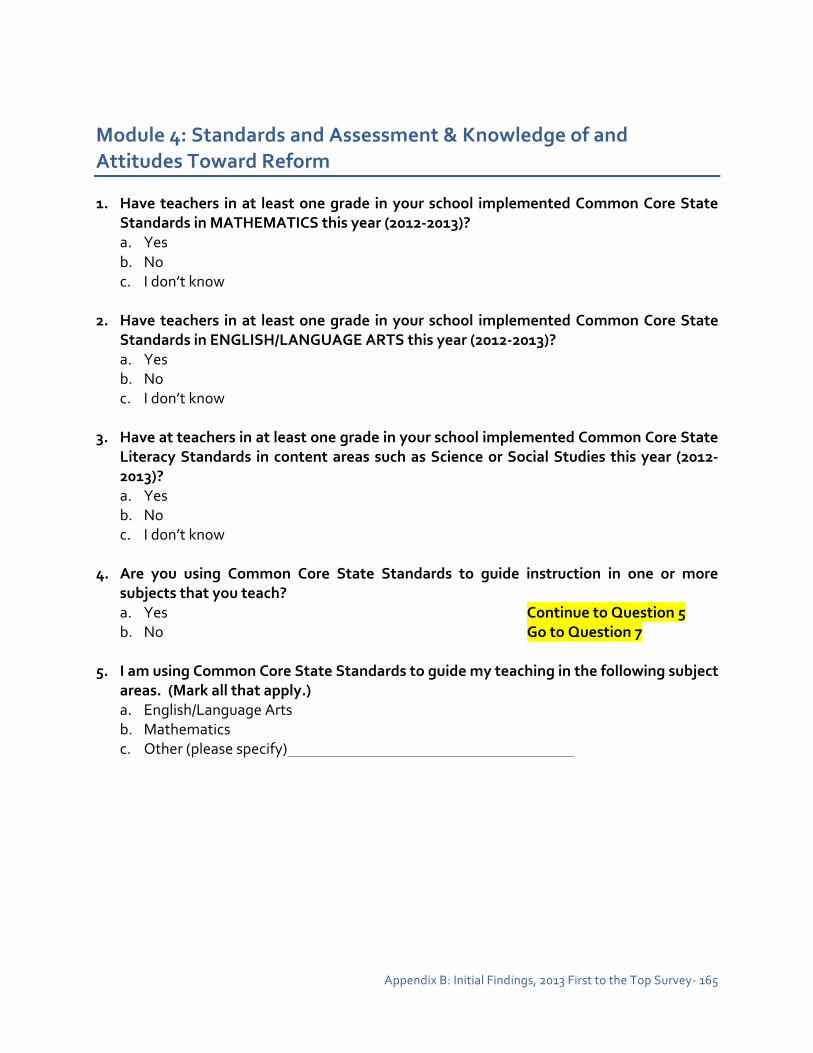
Appendix B: Initial Findings, 2013 First to the Top Survey-‐ 165
Module 4: Standards and Assessment & Knowledge of and Attitudes Toward Reform
1. Have teachers in at least one grade in your school implemented Common Core State
Standards in MATHEMATICS this year (2012-‐2013)? a. Yes b. No c. I don’t know
2. Have teachers in at least one grade in your school implemented Common Core State Standards in ENGLISH/LANGUAGE ARTS this year (2012-‐2013)? a. Yes b. No c. I don’t know
3. Have at teachers in at least one grade in your school implemented Common Core State Literacy Standards in content areas such as Science or Social Studies this year (2012-‐2013)? a. Yes b. No c. I don’t know
4. Are you using Common Core State Standards to guide instruction in one or more subjects that you teach? a. Yes Continue to Question 5 b. No Go to Question 7
5. I am using Common Core State Standards to guide my teaching in the following subject
areas. (Mark all that apply.) a. English/Language Arts b. Mathematics c. Other (please specify)

Appendix B: Initial Findings, 2013 First to the Top Survey-‐ 166
6. To what extent do you agree or disagree with the following statements about the Common Core State Standards?
Strongly Disagree Disagree Agree
Strongly Agree
a. I know how to access Common Core State Standards for the subject(s) that I teach.
1 2 3 4
b. I have received adequate training on Common Core State Standards for the subject(s) that I teach.
1 2 3 4
c. I am familiar with the Common Core State Standards for the subject(s) that I teach.
1 2 3 4
d. I would benefit from more guidance around the Common Core State Standards.
1 2 3 4
e. The Common Core State Standards communicate expectations clearly and concisely to TEACHERS.
1 2 3 4
f. There is sufficient time within the school year to adequately cover the Common Core State Standards for the grade(s) and subject(s) I teach.
1 2 3 4
g. I believe I can effectively use the Common Core State Standards for the grades and subject I teach.
1 2 3 4
h. The Common Core State Standards allow me sufficient flexibility to adapt my instruction to the needs of ALL of my students.
1 2 3 4
i. I have sufficient resources (textbooks, technology, instructional materials, etc.) to help my students master the Common Core State Standards in the grade(s) and subject(s) I teach.
1 2 3 4
j. I have adequate professional development to help my students master the Common Core State Standards in the grade(s) and subject(s) I teach.
1 2 3 4
k. I have adequate administrative support to help my students master the Common Core State Standards in the grade(s) and subject(s) I teach.
l. I feel prepared to help ALL of my students master the Common Core State Standards in the grade(s) and subject(s) I teach.
1 2 3 4

Appendix B: Initial Findings, 2013 First to the Top Survey-‐ 167
7. To what extent do you agree or disagree with the following statements about Tennessee’s Curriculum Standards?
Strongly Disagree Disagree Agree
Strongly Agree
a. I have received adequate training on Tennessee’s Curriculum Standards.
1 2 3 4
b. I would benefit from more guidance in interpreting Tennessee’s Curriculum Standards.
1 2 3 4
c. Tennessee’s Curriculum Standards communicate expectations clearly and concisely to TEACHERS.
1 2 3 4
d. Tennessee’s Curriculum Standards are attainable within the school year for the grade(s) and subject(s) I teach.
1 2 3 4
e. Tennessee’s Curriculum Standards allow me sufficient flexibility to adapt my instruction to the needs of ALL of my students.
1 2 3 4
f. I have sufficient resources (textbooks, technology, instructional materials, etc.) to help my students master Tennessee’s Curriculum Standards in the grade(s) and subject(s) I teach.
1 2 3 4
g. I have adequate support (professional development, administrative support etc.) to help my students master Tennessee’s Curriculum Standards in the grade(s) and subject(s) I teach.
1 2 3 4
h. I feel prepared to help ALL of my students master Tennessee’s Curriculum Standards in the grade(s) and subject(s) I teach.
1 2 3 4
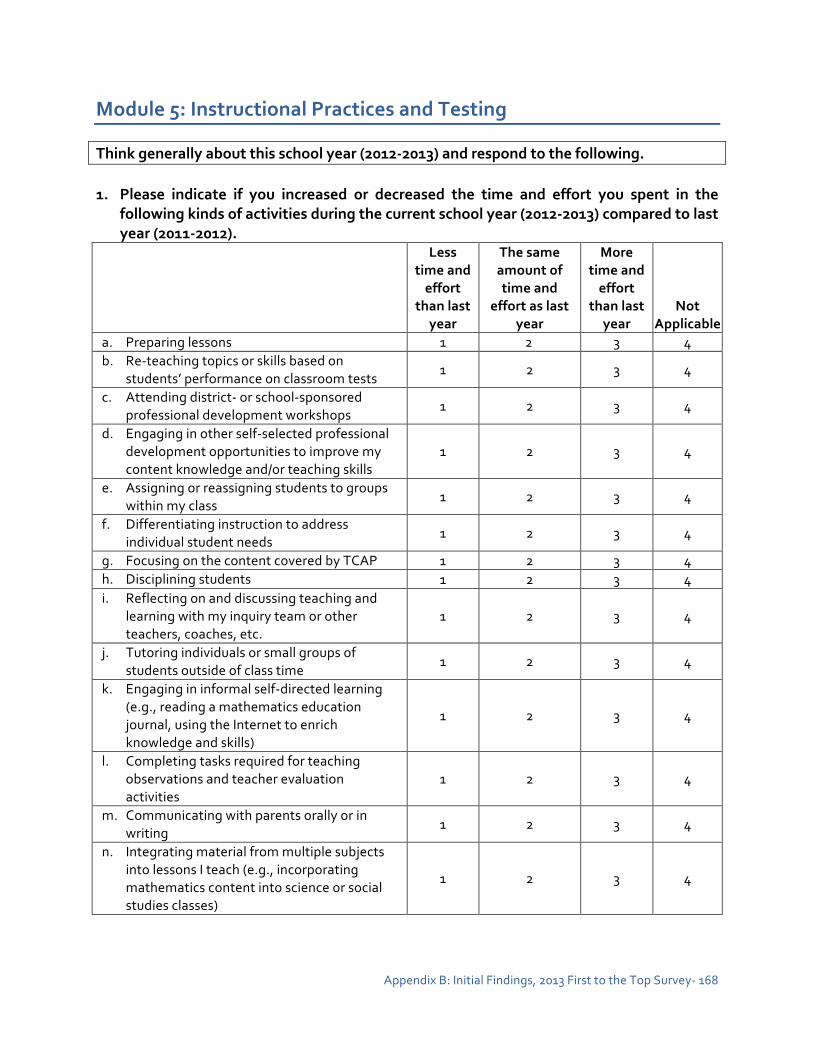
Appendix B: Initial Findings, 2013 First to the Top Survey-‐ 168
Module 5: Instructional Practices and Testing
Think generally about this school year (2012-‐2013) and respond to the following. 1. Please indicate if you increased or decreased the time and effort you spent in the
following kinds of activities during the current school year (2012-‐2013) compared to last year (2011-‐2012).
Less time and effort
than last year
The same amount of time and
effort as last year
More time and effort
than last year
Not Applicable
a. Preparing lessons 1 2 3 4 b. Re-‐teaching topics or skills based on
students’ performance on classroom tests 1 2 3 4
c. Attending district-‐ or school-‐sponsored professional development workshops
1 2 3 4
d. Engaging in other self-‐selected professional development opportunities to improve my content knowledge and/or teaching skills
1 2 3 4
e. Assigning or reassigning students to groups within my class
1 2 3 4
f. Differentiating instruction to address individual student needs
1 2 3 4
g. Focusing on the content covered by TCAP 1 2 3 4 h. Disciplining students 1 2 3 4 i. Reflecting on and discussing teaching and
learning with my inquiry team or other teachers, coaches, etc.
1 2 3 4
j. Tutoring individuals or small groups of students outside of class time
1 2 3 4
k. Engaging in informal self-‐directed learning (e.g., reading a mathematics education journal, using the Internet to enrich knowledge and skills)
1 2 3 4
l. Completing tasks required for teaching observations and teacher evaluation activities
1 2 3 4
m. Communicating with parents orally or in writing
1 2 3 4
n. Integrating material from multiple subjects into lessons I teach (e.g., incorporating mathematics content into science or social studies classes)
1 2 3 4

Appendix B: Initial Findings, 2013 First to the Top Survey-‐ 169
2. For each subject shown below, indicate which source is MOST IMPORTANT to you for determining what students should learn in your classroom.
N/A, I do not teach this
subject
Tennessee Curriculum Standards
Common Core
Standards District
Curriculum Text-‐book(s)
Teacher-‐Developed Plans and Materials
a. Mathematics (includes Algebra, Geometry, and other specialized high school math courses)
1 2 3 4 5 6
b. English / language arts
1 2 3 4 5 6
c. Science 1 2 3 4 5 6 d. Social Studies
(includes history, civics, general business, etc.)
1 2 3 4 5 6
e. Health and Physical Education
1 2 3 4 5 6
f. Art 1 2 3 4 5 6 g. Music 1 2 3 4 5 6 h. Family and
Consumer Science 1 2 3 4 5 6
i. Industrial Technology
1 2 3 4 5 6
j. Computer Science / applications
1 2 3 4 5 6
k. Career Education Program (e.g., Marketing, Business, Health Occupations, Trade and Industrial programs, etc.)
1 2 3 4 5 6
l. Other 1 2 3 4 5 6
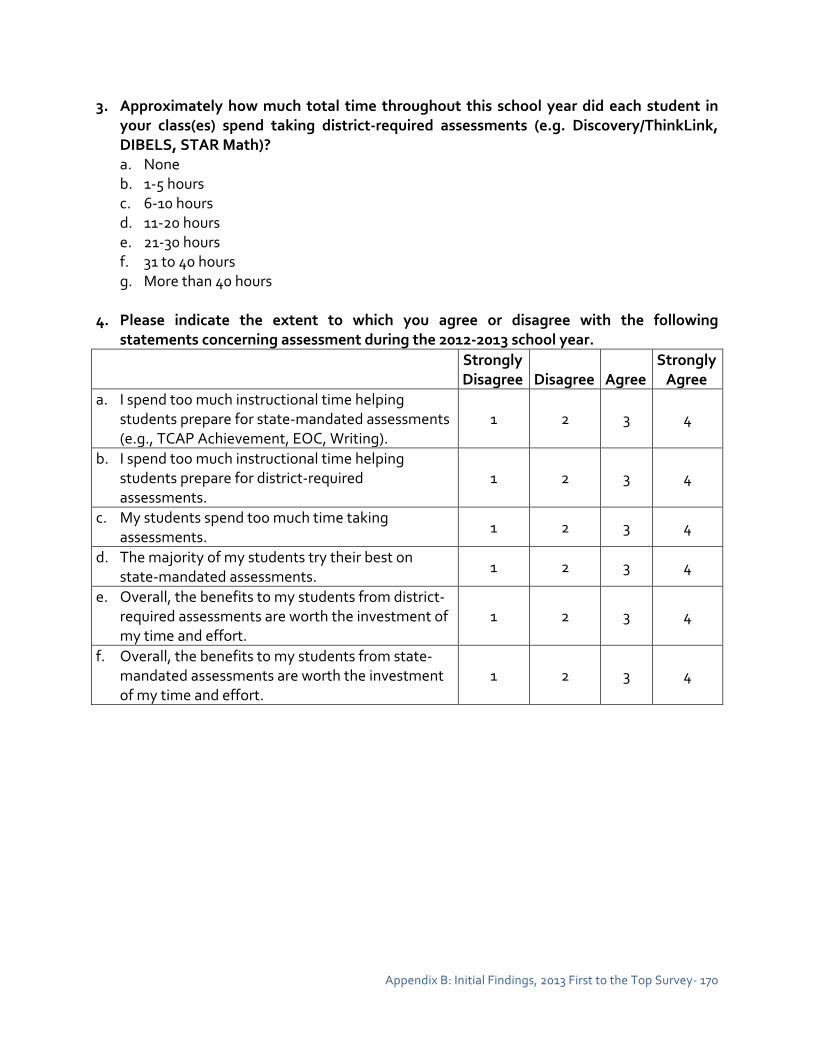
Appendix B: Initial Findings, 2013 First to the Top Survey-‐ 170
3. Approximately how much total time throughout this school year did each student in your class(es) spend taking district-‐required assessments (e.g. Discovery/ThinkLink, DIBELS, STAR Math)? a. None b. 1-‐5 hours c. 6-‐10 hours d. 11-‐20 hours e. 21-‐30 hours f. 31 to 40 hours g. More than 40 hours
4. Please indicate the extent to which you agree or disagree with the following
statements concerning assessment during the 2012-‐2013 school year. Strongly
Disagree Disagree Agree Strongly Agree
a. I spend too much instructional time helping students prepare for state-‐mandated assessments (e.g., TCAP Achievement, EOC, Writing).
1 2 3 4
b. I spend too much instructional time helping students prepare for district-‐required assessments.
1 2 3 4
c. My students spend too much time taking assessments.
1 2 3 4
d. The majority of my students try their best on state-‐mandated assessments.
1 2 3 4
e. Overall, the benefits to my students from district-‐required assessments are worth the investment of my time and effort.
1 2 3 4
f. Overall, the benefits to my students from state-‐mandated assessments are worth the investment of my time and effort.
1 2 3 4

Appendix B: Initial Findings, 2013 First to the Top Survey-‐ 171
Module 6: Teacher Compensation
We are interested in knowing your thoughts about how the statements below might be influenced – if at all – by the way in which teachers are paid. Compared to teachers being paid on the traditional salary schedule (i.e., based on experience and education/degree) without any pay tied to performance, do you believe each statement below is (1) more likely to occur, (2) less likely to occur, or (3) equally likely to occur if teachers are paid – at least in part – based on performance? Note: Performance pay could be based on measures of individual teacher performance, group performance, or school-‐wide performance. 1. Compared to teachers being paid on the traditional salary schedule without any pay
tied to performance…
Less likely to occur if
teachers are paid – at
least in part – based on
performance.
Equally likely to occur if
teachers are paid – at
least in part – based on
performance.
More likely to occur if
teachers are paid – at
least in part – based on
performance. a. Teachers will be successful at helping their
students learn. 1 2 3
b. Teachers will work together to identify and share successful teaching strategies and materials.
1 2 3
c. Individuals with the abilities to help students learn will be attracted to the teaching profession.
1 2 3
d. Teachers who are successful at helping their students learn will be more likely to remain in the teaching profession.
1 2 3
e. Teachers will resent the way in which they are compensated.
1 2 3
f. Teachers will feel satisfied with their jobs. 1 2 3 g. Teachers will feel valued as professionals. 1 2 3 h. Student learning will improve. 1 2 3

Appendix B: Initial Findings, 2013 First to the Top Survey-‐ 172
Imagine you are designing a new SALARY SCHEDULE for teachers that would be used to determine increases to teachers' annual base salary. Within the next question, please rate the importance of each of 12 possible factors that might be used to determine increases to teachers' base salary every year. 2. How important would each of the following factors be in determining increases to a
teachers’ annual base salary in a compensation program that you are designing? Not
Important Low
Importance Moderate Importance
Very Important
a. Time spent in professional development. 1 2 3 4 b. High test scores by students on a
standardized test. 1 2 3 4
c. Students' gains on TCAP as measured by the Tennessee Value-‐Added Assessment System (TVAAS).
1 2 3 4
d. The outcome of classroom observations completed under Tennessee's new teacher evaluation system, TEAM (or an alternative model being used in your school, such as TIGER) this 2012-‐13 school year.
1 2 3 4
e. Summative evaluation scores under Tennessee's new teacher evaluation system, TEAM (or an alternative model being used in your school, such as TIGER) this 2011-‐12 school year.
1 2 3 4
f. Teaching in hard-‐to-‐staff fields (i.e., subjects for which it is difficult to find and retain qualified and effective teachers).
1 2 3 4
g. Teaching in hard-‐to-‐staff schools (i.e., schools that have difficulty finding and retaining qualified and effective teachers).
1 2 3 4
h. Success at helping other teachers improve their professional practice (as reflected in their students' outcomes).
1 2 3 4
i. National Board for Professional Teaching Standards (NBPTS) certification.
1 2 3 4
j. Working with students outside of class time. 1 2 3 4 k. Years of experience teaching. 1 2 3 4 l. Level of education/degrees earned. 1 2 3 4
Tennessee Consortium on Research, Evaluation and Development
Peabody #44 | 230 Appleton Place | Nashville, Tennessee 37203
Phone 615-322-5538 | Fax 615-322-6018
www.tnconsortium.org