EDUCATIONAL PROJECT LAURENHILL ACADEMY 2019-2022
42
EDUCATIONAL PROJECT LAURENHILL ACADEMY 2019-2022
Transcript of EDUCATIONAL PROJECT LAURENHILL ACADEMY 2019-2022

EDUCATIONAL PROJECT
LAURENHILL ACADEMY
2019-2022

1
Table of Contents 1. Goal of the Educational Project………………………………………………………………………………...2
2. Legal and Regulatory Framework ……………………………………………………………………………..2
3. Groups that Collaborated in the Development of the Project…………………………...…………………...3
4. Groups Consulted in the Development of the Project………………………...………………………………3
5. School Profile…………………………………………………………………………………………………….4 6. School Mission & Values………………………………………………...……………………………………...5
7. Alignment to the EMSB’s Commitment-to-Success Plan………………………..…….…………………….. 7
8. EMSB Objectives and School Objectives …………………………………………..………………………….8
9. Implementation and Monitoring of the Project…………………………………………………….………..30
10. Signatories…………………………………………………………………………………………………..…..30
11. Resolution of the Governing Board Adoption of Educational Project………………….…………….…….31 12. APPENDIX 1: Strategies for Implementation of School Objectives…………………………………….…..32

2
The Educational Project
The educational project is a strategic tool for defining and making known to the educational community of a school the orientations, priorities for action and expected results to ensure the educational success of all students. It is developed in response to the characteristics and needs of the students attending the school and the community's educational expectations.
The goal of the educational project of a school makes it possible to share, with all its educational stakeholders (students, parents, teachers other school staff and representatives of the community and the School Board), a common vision of findings and challenges to create a mobilization around student-centered goals and objectives. The Educational Project describes what the school intends to do to ensure the educational success and well-being of all its students and the efforts that will be necessary to achieve it.
The Legal Framework
Article 36 of the Education Act states,
“In keeping with the principle of equality of opportunity, the mission of a school is to impart knowledge to students, foster their social development and give them qualifications, while enabling them to undertake and achieve success in a course of study. A school shall pursue its mission within the framework of an educational project.”
The law describes:
● the principal content of the educational project (Article 37) ● the period covered by the project (Article 37.1, 459.3) ● the role of the governing board and the various stakeholders involved in the school community (Article 74) ● the communication of the educational project and its evaluation to the public, in particular the parents and
school staff (Article 75)

3
● the role of the principal in the coordination of the process (Article 96.13) ● the role of the school board in ensuring coherence with the Commitment-to-Success Plan (Article 209.2)
Groups that Collaborated in the Development of the Project
● The governing board ● The school team, composed of a cross section of staff members, led by the principal
Groups Consulted in the Development of the Project
● The governing board ● The school’s parent community at large ● Community representatives (could include CSSS, Social Affairs, police department, community groups) ● Students ● All staff, including, teachers, professionals, support staff and daycare personnel

4
School Profile In the fall of 1992, a new high school combining the strengths of the two closing institutions, Sir Winston
Churchill High and St. Laurent High, was created. Teacher, Gail Ewing, created the name for the new school by taking the “Lauren” from St. Laurent and the “Hill” from Winston Churchill and uniting them to make LaurenHill Academy. In the fall of 1998, in order to consolidate the secondary education facilities in St-Laurent, LaurenHill Academy grew in two buildings: a Junior Campus in the old Father MacDonald building and a Senior Campus in the original LaurenHill building (Sir Winston Churchill).
LaurenHill Academy offers the best possible opportunities for all students in the community. In the fall of 1999, LaurenHill was the first school in the E.M.S.B. to implement a progressive Block Scheduling model (4 x 75 minute periods over a nine day cycle). In 2009, LHA adopted the common presence period concept in order to promote team work among the faculty members and facilitate the standardization of the curriculum. In 2010, LHA implemented the Français Langue d’Enseignement program, teaching the same course offered in French High Schools. In 2013, supported by a MELS derogation, a Cycle 1 Allongé program was created to address the needs of students with a significant academic delay.
LaurenHill administrators, faculty, support staff, parents and student body continue to work diligently to give LaurenHill Academy an enviable academic reputation in the community. With a graduation rate averaging around 92%, LaurenHill continues to innovate and to look at other ways to address the needs of its diversified clientele. Hence, LHA led again in 2013, and developed a Bring Your Own Device model in its innovative spirit, moving forward into the future of integration of technology in education. LaurenHill Academy is a beacon school and has the reputation of being a pedagogical leader within the English community.
5
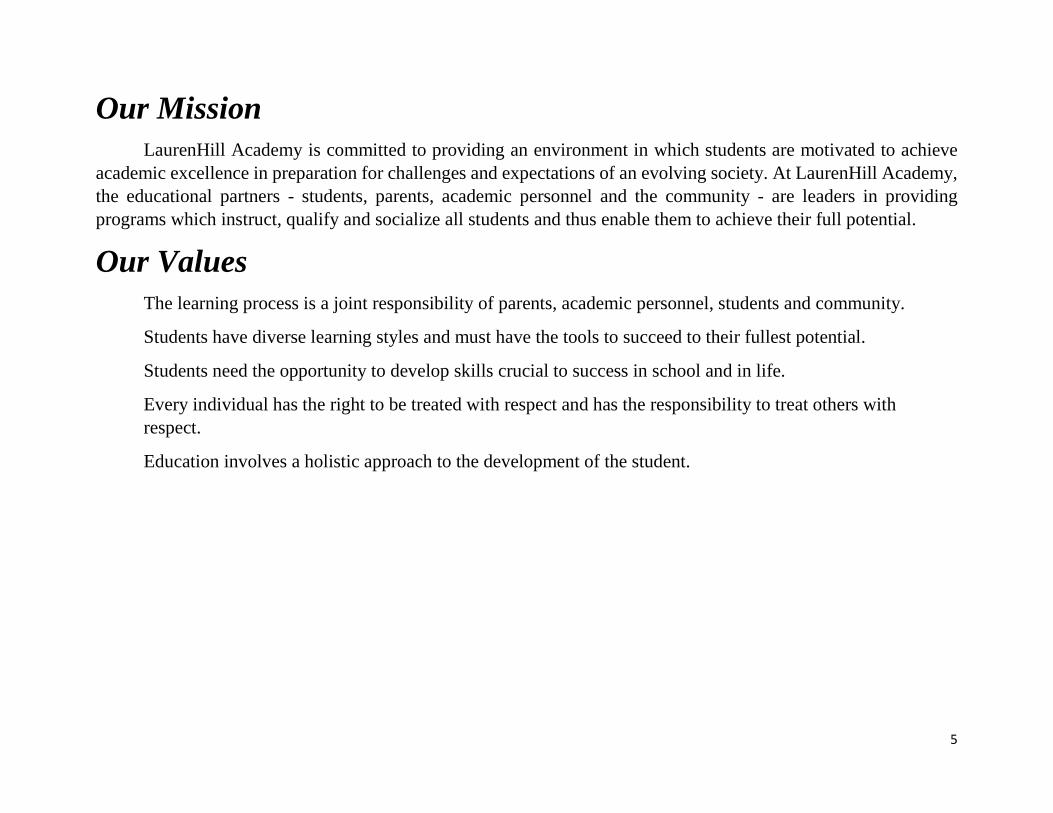
Our Mission LaurenHill Academy is committed to providing an environment in which students are motivated to achieve
academic excellence in preparation for challenges and expectations of an evolving society. At LaurenHill Academy, the educational partners - students, parents, academic personnel and the community - are leaders in providing programs which instruct, qualify and socialize all students and thus enable them to achieve their full potential.
Our Values The learning process is a joint responsibility of parents, academic personnel, students and community.
Students have diverse learning styles and must have the tools to succeed to their fullest potential.
Students need the opportunity to develop skills crucial to success in school and in life.
Every individual has the right to be treated with respect and has the responsibility to treat others with respect.
Education involves a holistic approach to the development of the student.

6
Our Goals Offer regular and enriched language programs which will give every student the opportunity to develop a high level of proficiency in both English and French.
Provide multi-level and enriched programs in Mathematics and Science, which prepare students for a fast evolving society.
Differentiate the curriculum to address the needs of all our student population.
Develop an appreciation and proficiency in the Creative Arts.
Use technology within all courses, thus being more in tune with our learners.
Provide Physical Education programs that inspire a commitment to lifelong fitness and health.
Encourage the development of a contemporary social consciousness, which promotes self- respect, respect for others and respect for the community in all its diversity.
Encourage and promote on-going communication among students, parents, and academic personnel.
Ensure a secure and stable environment which fosters pride, discipline and self-confidence. Instil a positive commitment towards lifelong learning to all our students.
7
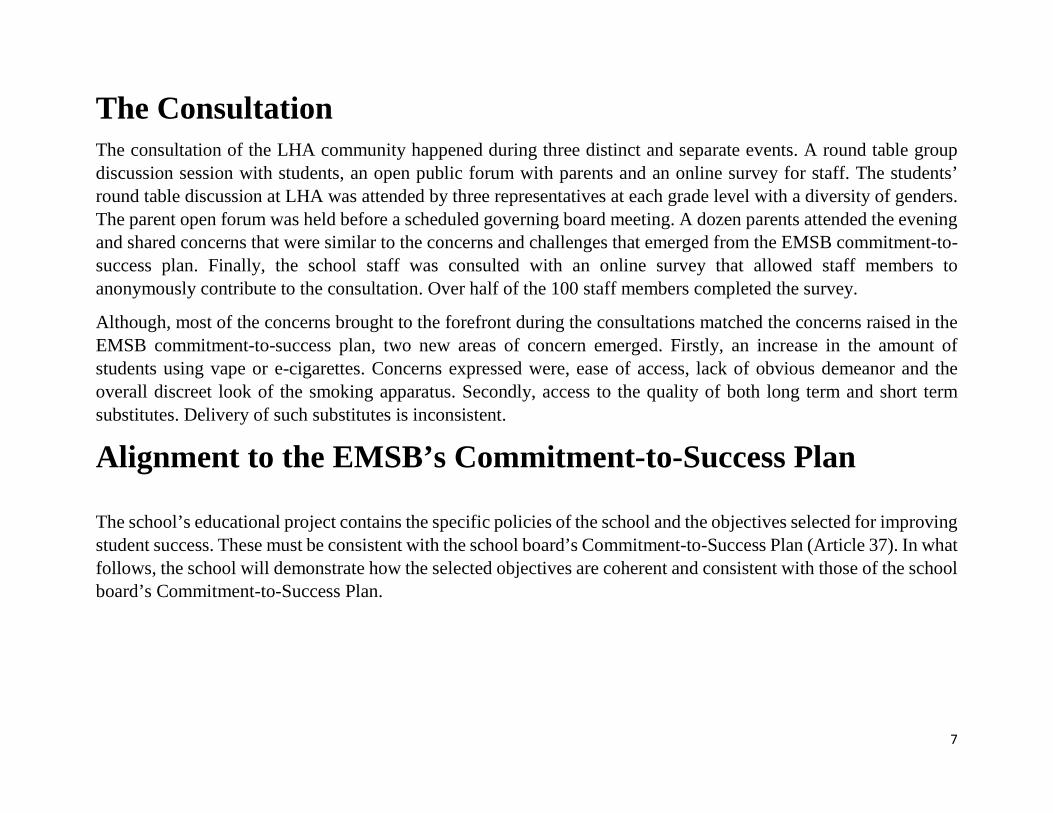
The Consultation The consultation of the LHA community happened during three distinct and separate events. A round table group discussion session with students, an open public forum with parents and an online survey for staff. The students’ round table discussion at LHA was attended by three representatives at each grade level with a diversity of genders. The parent open forum was held before a scheduled governing board meeting. A dozen parents attended the evening and shared concerns that were similar to the concerns and challenges that emerged from the EMSB commitment-to-success plan. Finally, the school staff was consulted with an online survey that allowed staff members to anonymously contribute to the consultation. Over half of the 100 staff members completed the survey.
Although, most of the concerns brought to the forefront during the consultations matched the concerns raised in the EMSB commitment-to-success plan, two new areas of concern emerged. Firstly, an increase in the amount of students using vape or e-cigarettes. Concerns expressed were, ease of access, lack of obvious demeanor and the overall discreet look of the smoking apparatus. Secondly, access to the quality of both long term and short term substitutes. Delivery of such substitutes is inconsistent.
Alignment to the EMSB’s Commitment-to-Success Plan The school’s educational project contains the specific policies of the school and the objectives selected for improving student success. These must be consistent with the school board’s Commitment-to-Success Plan (Article 37). In what follows, the school will demonstrate how the selected objectives are coherent and consistent with those of the school board’s Commitment-to-Success Plan.

8
EMSB Orientations, Objectives and School Objectives Orientation: Improved Academic Success
While the Board is able to report on a 7-year cohort as a result of tracking information obtained from the MEES, a school is only able to report on the success of their secondary 5 students at the end of a given academic year. The school’s graduation rate is determined by dividing the total number of secondary 5 students who receive a first diploma (SSD) by the total number of secondary 5 students registered on September 30th of that given year.
Table 1: Graduation Rate of Secondary 5 Students Registered on September 30th
Year Graduation Rate (%)
2015 96.4% (238/247)
2016 92.6% (238/257)
2017 92.0% (219/238)
2018 91.5% (225/246)
Source: LUMIX 2018
EMSB OBJECTIVE Graduation and qualification
To increase the percentage of students under the age of 20 who obtain a first diploma (SSD or DVS) or qualification after 7 years from 88.6% in 2016 to 91.0% by 2022

9
Table 1 shows that the graduation rate for secondary 5 students registered on September 30th has decreased gradually from 96.4% in 2015 to 91.5% in 2018. We have continued to maintain a graduation rate above 90% over the last 4 years presented in the table. In 2018, our graduation rate was 91.5% which represents a total of 225 graduates out of 246 students registered on September 30th.
In order to meet the board’s target for 2022, our challenge will be to improve our graduation rate by approximately 3%, and to maintain our graduation rate above 90%.
In determining our baseline* for our graduation rate, the school has chosen to average out the success rates for the last four years. The baseline* is 93.1%.
School Objective 1: To increase the graduation rate of secondary 5 students registered on September 30th who obtain their first diploma (SSD) from a baseline of 93.1% in 2018 to 95% by 2022. * A baseline is a starting point. In creating our baseline, we looked at two options: 1) to start with the 2018 graduation rate and 2) to take an average of the last four years. We recommend that the average of the four years is a more accurate baseline in that it presents a global picture of what is happening in the school.
Table 2: Qualification Ratio of Secondary Students Registered in Semi-Skilled on September 30th
(Not applicable for LaurenHill Academy)

10
Table 3: Global Success Rates in Secondary 4 Mathematics, Science and Technology, History of Quebec and Canada* and Histoire du Québec et du Canada** for LaurenHill Academy and EMSB (%)
LaurenHill Academy
Success Rates
English Montreal School Board
Success Rates
Year 2015 2016 2017 2018 2015 2016 2017 2018
Mathematics (CST) 70.6% 75.7% 86.2% 87.9% 50.8% 68.1% 63.3% 67.8%
Mathematics (SN) 96.2% 96.1% 89.0% 89.0% 92.7% 96.1% 86.7% 93.0%
Science & Technology 84.6% 86.4% 89.9% 88.1% 77.0% 79.3% 87.2% 85.5%
History of Quebec & Canada* 86.7% 78.0%
History and Citizenship Education 52.8% 75.8% 62.1% 65.5% 77.8% 74.6%
Histoire du Québec et du Canada** 90.3% 96.9%
Histoire et Citoyenneté 84.8% 89.4% 91.9% 88.3% 92.4% 94.6%
Source: Charlemagne, 2018 and DBMS 2018 *Prior to 2018, History of Quebec and Canada was called History and Citizenship Education. ** Prior to 2018, Histoire du Québec et du Canada Histoire et Citoyenneté.

11
Subjects
Mathematics Secondary 4 Cultural, Social & Technical Mathematics/Mathematics Secondary 4 Science
Table 4: Global Success Rates in Secondary 4 Mathematics (%) LaurenHill Academy Success
Rates EMSB Success Rates
Year 2015 2016 2017 2018 2015 2016 2017 2018
Mathematics (CST) 70.6% 75.7% 86.2% 87.9% 50.8% 68.1% 63.3% 67.8%
Mathematics (SN) 96.2% 96.1% 89% 89% 92.7% 96.1% 86.7% 93%
Source: Charlemagne, 2018
EMSB Objective: To increase the June global success rate of students in secondary 4 Mathematics (CS&T) from 63.3% in 2019 to 68.0% by 2022.

12
Mathematics CS & T is a compulsory course for graduation. The success in this course has a direct impact on the graduation rate. The teachers’ effort in implementing the multi-tier response to intervention approach has helped target students who are at risk of a poor success rate. The students have been given access to smaller class sizes with the goal of intense remediation groups addressing specific skills.
Nevertheless, there is room for improvement, and we have chosen to focus on increasing our success rate. In determining our baseline from the data in table 4, the school has chosen to average out the success rates for the last four years.* The baseline for Mathematics CST is 80.1% and the baseline for Mathematics SN is 92.6%.
School Objective 1.3.1: To increase the June global success rate of students in secondary 4 Mathematics CS&T from a baseline of 80.1% in 2018 to 83.1% by 2022.
School Objective 1.3.2: To increase the June global success rate of students in secondary 4 Mathematics SN from a baseline of 92.6% in 2018 to 94.0% by 2022. * A baseline is a starting point. In creating our baseline, we looked at two options: 1) to start with the 2018 graduation rate and 2) to take an average of the last four years. We recommend that the average of the four years is a more accurate baseline in that it presents a global picture of what is happening in the school.

13
Science and Technology Secondary 4
Table 5: Global Success Rates in Secondary 4 Science & Technology (%) LaurenHill Academy Success Rates English Montreal School Board Success
Rates
Year 2015 2016 2017 2018 2015 2016 2017 2018
Science & Technology 84.6% 86.4% 89.9% 88.1% 77.0% 79.3% 87.2% 85.5%
Source: Charlemagne, 2018
Secondary 4 Science and Technology is a compulsory course for graduation. The success in this course has a direct impact on the graduation rate. In reviewing our success rates for the past four years, we see that the current strategies in place have maintained a steady increase in the Secondary 4 Science & Technology course. Furthermore, the introduction of the STEAM program at the junior campus will help bolster the overall perception of the importance that should be placed on the Science & Technology course.
In determining our baseline, the school has chosen to average out the success rates for the last four years. The baseline is 87.3%.
School Objective 1.4: To increase the June global success rate of students in secondary 4 Science and Technology from a baseline of 87.3 % in 2019 to 89.1% by 2022.
EMSB Objective: To increase the June global success rate of students in secondary 4 Science & Technology from 87.2% in 2019 to 89.0% by 2022.

14
History/Histoire, Secondary 4
Table 6: Global Success Rates in Secondary 4 History of Quebec and Canada*, and Histoire du Québec et du Canada** (%)
LaurenHill Academy Success Rates EMSB Success Rates
Year 2015 2016 2017 2018 2015 2016 2017 2018
History of Quebec and Canada 86.7% 78.0%
History and Citizenship Education 52.8% 75.8% 62.1% 65.5% 77.8% 74.6%
Histoire du Québec et du Canada 90.3% 96.9%
Histoire et Citoyenneté 84.8% 89.4% 91.9% 88.3% 92.4% 94.6%
Source: Charlemagne, 2018, LUMIX 2018
*The results in Table 6 are for the course that, until 2017, has been called History and Citizenship. Henceforth, the course will be known as History of Quebec and Canada.
**The results in Table 6 are for the course that, until 2017, has been called Histoire et Citoyenneté. Henceforth, the course will be known as Histoire du Québec et du Canada.
EMSB Objective: To increase the June global success rate of students in secondary 4 History & Citizenship (History of Quebec and Canada*) from 74.6% in 2019 to 78.0% by 2022.
To maintain a global success rate of students in secondary 4 Histoire du Québec et du Canada* greater than 90% through 2022.

15
Secondary 4 History of Quebec and Canada is a compulsory course for graduation. The success in this course has a direct impact on the graduation rate. Table 6 shows the success rate increased from 52.8% in 2015 to 86.7% in 2018. In 2017, a significant increase of 10.7% was observed. One of the contributing factors to this increase was that the subject consultant worked with our History teachers to build on the possible best practices relating to the course content. As of 2017, the school success rates parallels the school board results, with greater results.
Secondary 4 Histoire du Québec et du Canada is a compulsory course for graduation. The success in this course has a direct impact on the graduation rate. Table 7 shows that the success rate increased from 84.8 % in 2015 to 91.9% in 2018. A comparison with the school board’s results shows that the school’s results are not as strong but still quite successful..
In both courses, there is room for improvement, therefore we have chosen to focus on increasing our success rate. In determining our baseline, the school has chosen to select the first year of the new program. The baseline is 86.7% (History) and 90.3% (Histoire).
School Objective 1.5: To increase the June global success rate of students in secondary 4 History from a baseline of 86.7% in 2019 to 89.7% by 2022. School Objective 1.6: To maintain the June global success rate of students in secondary 4 Histoire from a baseline of 90.3% in 2019 to 90.3% by 2022.

16
Orientation: Equity among Various Groups
The school board’s Commitment-to-Success Plan addresses the gap in success rates between:
● regular students and students with special needs ● advantaged and disadvantaged schools ● first generation immigrant students and non-immigrants ● males and females
For the aforementioned equity issues, the first three are difficult to compare using data because of the small sample size within each school and for each particular issue. The use of percentages in reporting on the success rates for a small sample size group can be misleading since a small change in numbers may produce a large fluctuation in the percentage. Because of the small sample size at the school level, the school will not address the first three issues.
The school’s educational project will only address the gap in success rates between males and females because these numbers are comparable.
EMSB OBJECTIVE Equity
To reduce the gap in success rates between males and females from 8.2% in 2016 to 6.2% by 2022.

17
Table 7: Graduation Success Rates of Males and Females Registered on September 30th and the Gap Between Them (%)
LaurenHill Academy Year 2016 2017 2018
Average (Male & Female) 92.6% 92.0% 91.5%
Males 92.6% 91.4% 90.4%
Females 92.5% 92.7% 92.5%
Gap (Males vs. Females) 0.1% 1.3% 2.1%
EMSB Average (Male & Female) 86.9% 86.1% 84.4%
Males 82.8% 84.7% 82.5%
Females 91.0% 87.8% 86.4%
Gap (Males vs. Females) 8.2% 3.1% 3.9%
Gap between EMSB and LaurenHill Academy (Males vs. Females)
8.1%
1.8%
1.8%
Source: LUMIX, 2018

18
Table 7 shows that the overall graduation rate of LaurenHill Academy decreased by 1.1% from 92.6% in 2016 to 91.5% in 2018, whereas the Board rate decreased by 2.5%.
There was a moderate decrease of 1.2% in the success rate of males from 92.6% in 2016 to 91.4% in 2017. There was a continued decrease of 1.0% the following year from 91.4% to 90.4%. For the females, while there was a slight increase of 0.2% from 2016 to 2017, there was a slight decrease back to the 2016 numbers the following year from 92.7% to 92.5%. The Board’s success rate gap between males and females has decreased from 8.2% in 2016 to 3.9% in 2018. The school’s gap marginally increased from 0.01% to 2.1%. However, the gap between the board and LaurenHill Academy narrowed from 8.1% to 1.8%.
Our 5-year graduation rate and the gap between the success rate of males and females is an area to be monitored. The baseline for the gap is determined by averaging the rates of the last three years. The baseline is 1.2%.
School Objective 2: To maintain the marginal gap in success rates between the males and females from a baseline gender difference of 1.2% in 2019 to a baseline gender difference of 1.2% in 2022.

19
Orientation: Mastery of Languages
EMSB OBJECTIVE Language Proficiency
English Language Arts
To maintain a global success rate of at least 95% in secondary 5 English Language Arts June MEES Examination through 2022.
To increase the average mark of secondary 5 students in English Language Arts June MEES Examination from 74.2% in 2019 to 76.0% by 2022. Français langue seconde, programme de base et enrichi
To maintain the success rate of 90% in the secondary 5 FLS June MEES Examination (programme de base), Reading Component, through 2022.
To increase the success rate of students in the secondary 5 FLS June MEES Examination (programme enrichi), Reading Component from 81.8% in 2019 to 85.0% by 2022.

20
English Language Arts, Secondary 5
Table 8: EMSB Global Success Rates and Global Average Mark in Secondary 5 English Language Arts in the June MEES Examination (%)
Year LaurenHill Academy
Global Success Rate
LaurenHill Academy
Global Average Mark
EMSB Global Success Rate
EMSB Global Average Mark
2015 99.6% 75.2% 95.3% 72.4%
2016 98.1% 73.6% 96.5% 73.6%
2017 98.8% 73.9% 96.8% 74.2%
2018 98.8% 73.8% 95.1% 74.8%
Source: Charlemagne, 2018

21
The secondary 5 MEES examination in English Language Arts is a requirement for graduation. The data in Table 8 shows that success rate of the Board has been relatively stable at above 95%. At the school level, the success rate increased slightly since 2016, from 98.1% to 98.8% in 2018. Table 8 shows that the Board’s average mark has marginally deteriorated from 96.5% in 2015 to 95.1% in 2018. Since 2016, the average mark at the school level has remained stable from 73.6% to 73.8% in 2018. Further analysis of possible contributing factors to maintenance of this result is required. In determining our baseline, the school has chosen to average out the success rates for the last four years. The baseline is 98.8%.
School Objective 4: To maintain the global success rate in secondary 5 English Language Arts June MEES examination from a baseline of 98.8% in 2019 to 98.8% through 2022. School Objective 4.1: To increase the average mark of secondary 5 students in the June English Language Arts MEES examination from a baseline of 74.2% in 2019 to 76.0% by 2022.

22
Français langue seconde (Secondary 5) Table 9: LaurenHill Academy Success Rates and Percentage Equivalents in Secondary 5 Français langue seconde (FLS) (de base and enrichi) in Reading Component of the June* MEES Examination (%)
Year LaurenHill
Academy Success Rate in FLS (de base) Reading
Component
EMSB Success Rate in FLS (de
base) Reading
Component
LaurenHill Academy Success Rate in MEES FLS (enrichi) Reading
Component
EMSB Success Rate in MEES FLS
(enrichi) Reading Component
2015 95.5% 83.0% - ** -**
2016 72.9% 83.2% - ** -**
2017 94.6% 90.4% 94.5% 81.8%
2018 82.0% 83.2% 87.3% 84.3%
Source: Charlemagne, 2018
*The numbers indicate the global success rate of the reading component.
** The Ministry-set examination in FLS (enrichi) was introduced for the first time in 2017. Prior to 2017, the FLS (enrichi) examination was set by the Board.

23
Secondary 5 French Second Language (programme de base) is one of the pathways for obtaining graduation requirements. Success in this course has a direct impact on the graduation rate. We have chosen to focus our energy on Français langue seconde, programme de base, specifically the Reading component.
Given that this population is small, the use of percentages in reporting on the success rate for this group can be misleading since a small change in numbers may produce a large fluctuation in percentages.
Table 9 shows the success ratio (percent equivalent) has decreased 13.5% over the years from 95.5% in 2015 to 82.0% in 2018 for the FSL Programme de base. For the past four years, the success rate of our students has been fluctuating below and above the success rate of students in our school board. There was a significant decline in 2016 from 2015, in that three fewer students were successful (percent equivalent decrease of 22.6%). While the percent equivalent for 2017 and 2015 is more or less the same. This presents an area of concern that will be addressed in our strategies.
Table 9 also shows that the success ratio (percent equivalent) in Français langue seconde, programme enrichi decreased 7.2% from 94.5% to 87.3%. The success rate of the school in this program parallels that of the school board.
In determining our baseline for Secondary 5 French Second Language (programme de base), the school has chosen to average out the success rates for the last four years. The baseline is 86.3%.
In determining our baseline for Secondary 5 French Second Language (enrichi)), the school has chosen to average out the success rates for the last 2 years. The baseline is 90.9%.
School Objective 4.2: To increase the success rate of students in secondary 5 FSL programme de base on the June MEES Examination Reading Component from a baseline of 86.3% in 2019 to 90% by 2022. School Objective 4.3: To maintain the success rate of students in secondary 5 FSL programme enrichi on the June MEES Examination Reading Component from a baseline of 90.9% in 2019 to 90.9% through 2022.

24
Orientation: Well-being of the School Community
EMSB OBJECTIVE A welcoming, safe, and caring living environment:
An educational living environment must be one that has a sense of safety and physical and psychological well-being forall. In this respect, a healthy and safe environment means that the educational setting must be free of bullying, discrimination, radicalization, intolerance and any other form of physical, sexual, emotional or psychological violence. To decrease the rate of secondary students who report victimization resulting from bullying on the OURSCHOOL Survey from 16.0% in 2019 to 14.0% by 2022. To increase the rate of secondary students who report feeling safe attending school on the OURSCHOOL Survey from 59.0% in 2019 to 62.0% by 2022. To decrease the rate of moderate to high-level anxiety as reported by secondary school students on the OURSCHOOL Survey from 22.0% in 2019 to 20.0% by 2022.

25
Students’ Perception of Bullying, Perception of School Safety and Sense of Anxiety: Table 10: LaurenHill Academy Secondary Students’ Perception of Bullying, Perception of School Safety and Sense of Anxiety (%)
Year LaurenHill Academy Bullying*
EMSB Bullying
LaurenHill Academy
School Safety**
EMSB School Safety
LaurenHill Academy
Anxiety***
EMSB Anxiety
2015-2016 JR/SR
17%/21% 16%
JR/SR
61%/59% 59%
JR/SR
16%/22% 23%
2016-2017 JR/SR
22%/17% 16%
JR/SR
49%/48% 59%
JR/SR
19%/26% 22%
2017-2018 JR/SR
23%/17% 17%
JR/SR
52%/45% 58%
JR/SR
27%/24% 24%
Source: OurSchool Survey (The Learning Bar)
* Students who are subjected to physical, social, or verbal bullying or are bullied over the internet ** Students who feel safe at school as well as going to and from school *** Students with moderate or high level of anxiety

26
The OURSCHOOL Survey tabulates the results presented in the table above. This survey allows students to convey their perceptions of the social atmosphere of the school. Secondary students anonymously complete the survey once a year. The survey covers a variety of subjects including bullying, school safety, the students’ sense of belonging, student anxiety and student-teacher relationships. This survey is one of many tools that schools use to implement the Ministry’s policy on bullying intimidation (Safe School Action Plan). It should be noted that students are asked what they have perceived in the 30 days preceding the survey.
Table 10 shows the percentage of students who perceive victimization by bullying for the past three years.
Junior The school’s rate of victimization resulting from bullying has been relatively stable with a baseline of about 20%, but higher than the school board. This component of the survey asked about the time and the location of observed bullying (before, during or after school; on a bus; on school grounds; during class; or recess).
Table 10 also shows students’ perception of feeling safe at school, as well as going to and from school for the past three years. This perception has decreased from 61% in 2016 to 52% in 2018, and it is currently lower than the overall students’ perception at the Board level.
The rate of anxiety perceived among students at the Board level has remained relatively stable at about 23%. The school’s rate of perceived anxiety has increased from 16% in 2016 to 27% in 2018. The factors measured under the “anxiety” category concern self-esteem: ridicule, worry, peer attitudes, etcetera.

27
Senior The school’s rate of victimization resulting from bullying has been relatively stable with a baseline of about 18%, but slightly higher than the school board. This component of the survey asked about the time and the location of observed bullying (before, during or after school; on a bus; on school grounds; during class; or recess).
Table 10 also shows students’ perception of feeling safe at school, as well as going to and from school for the past three years. This perception has decreased from 59% in 2016 to 45% in 2018, and is currently lower than the overall students’ perception at the Board level.
The rate of anxiety perceived among students at the Board level has remained relatively stable at about 23%. The school’s rate of perceived anxiety has increased marginally from 22% in 2016 to 24% in 2018. The factors measured under the “anxiety” category concern self-esteem: ridicule, worry, peer attitudes, etcetera.
In an effort to further examine the results of the OURSCHOOL Survey, we decided to take the overall school result for each category and break it down by gender.

28
Table 11: LaurenHill Academy Secondary Student’s Perception of Bullying, Perception of School Safety and Sense of Anxiety by Gender (%)
Year Bullying Males*
Bullying Females*
School Safety
Males**
School Safety
Females**
Anxiety Males***
Anxiety Females***
2015-2016 JR/SR
15%/24%
JR/SR
20%/18%
JR/SR
60%/62%
JR/SR
61%/57%
JR/SR
9%/17%
JR/SR
25%/27%
2016-2017 JR/SR
19%/20%
JR/SR
28%/15%
JR/SR
57%/52%
JR/SR
39%/45%
JR/SR
24%/16%
JR/SR
14%/33%
2017-2018 JR/SR
22%/16%
JR/SR
21%/16%
JR/SR
57%/44%
JR/SR
49%/49%
JR/SR
16%/14%
JR/SR
37%/34%
Source: OurSchool Survey (The Learning Bar)
* Students who are subjected to physical, social, or verbal bullying or are bullied over the internet ** Students who feel safe at school as well as going to and from school *** Students with moderate or high level of anxiety

29
Table 11 shows that bullying is relatively the same for both males and females in our school. However, in the area of school safety, the data shows that females feel less safe than the males. Similarly, in the area of anxiety, the data shows that females are more anxious than males. While it is our intent to improve the situation in all areas, we need targeted strategies for the female students.
In establishing our baselines, we have chosen to take the average of the last three years for each indicator.
School Objective 5.0: To decrease the rate of our secondary students who report victimization resulting from bullying on the OURSCHOOL Survey from a baseline of 20%(JR) and 18%(SR) in 2019 to 18%(JR) and 16%(SR) by 2022.
Objective 5.1: To increase the rate of secondary students who report feeling safe attending school on the OURSCHOOL Survey from a baseline of 54%(JR) and 57%(SR) in 2019 to 57%(JR) and 61%(SR) by 2022. School Objective 5.2: To decrease the rate of moderate to high level anxiety as reported by secondary school students on the OURSCHOOL Survey from a baseline of 20.6%(JR) and 24%(SR) in 2019 to 18.6%(JR) and 22%(SR) by 2022.

Implementation and Monitoring ofthe ProjectThe school will report to its community on the Educational Project on an annual basis. This has been determined mcollaboration with the school board.
Signatory Parties
ON BEHALF OF THE SCHOOL
GOVERNLNG BOARD CÏHAIRPERSON ^^^^y^[^^^\
AL
ON BEHALF OF THE SCHOOL BOARD
DIRECTOR GENERAL
30

GOVERNING BOARD RESOLUTION
LaurenHill Academy HIGH SCHOOL EDUCATIONAL PROJECT 2019-2022
WHEREAS The Education Act requires that the school develops an educational project;
WHEREAS The Educational Project was developed with the participation ofthe various stakeholders involved in the school,including: the goveming board, parents, school staff, students, community and school board representatives;
WHEREAS The Educational Project is coherent with the School Board's Commitment-to-Success Plan;
WHEREAS the period covered by the Educational Project is harmonized with the Commitment-to-Success Plan period covered by theSchool Board;
rr\ tol k i n AND RESOLVED THAT the Educational Project of 2019-2022 be adopted by theIT WAS MOVED BYGoveming Board.
IT WAS FURTHER MOVED BYAn^rPYV A^QrnS^ND RESOLVED THAT a copy ofthe Educational Project be sent to the SchoolBoard for its adoption.
IT WAS FURTHER MOVED BYÎI-m^ra VJOU^AND RESOLVED THAT upon adoption ofthe Educational Project by SchoolBoard, the Educational Project will be made public and communicated to the parents and school staff.
î)eA^^ -Sl<Q(jl<oçGoveming Board Chairperson / March 19th, 2019
'̂onO^ Mqn^S
Principal/Marchl9th,2019
31

32
Appendix 1 Strategies for Implementation of School Objectives Graduation and qualification: Objective 1: To increase the graduation rate of secondary 5 students registered on September 30th who obtain their first diploma (SSD) from a baseline of 93.1% in 2018 to 95% by 2022.
Indicator Target Strategies
The graduation rate of secondary 5 students registered on September 30th who obtain their first diploma (SSD)
To increase the graduation rate of secondary 5 students registered on September 30th who obtain their first diploma (SSD) from a baseline of 93.1% in 2019 to 95 % by 2022.
1. The school administration will ensure that all Secondary 5 students will have the required number of credits (54) necessary for graduation, including: (Secondary 4 Mathematics, Secondary 4 Science & Technology, Secondary 4 History and Citizenship, Secondary 5 English Language Arts & Secondary 5 French Second Language (de base or enrichi) /French Langue D’enseignement (FLE). Secondary 5 Physical Education or Secondary 5 ERC.
2. We will continue to identify students entering high school with an academic delay of more than 4 years. A pre-identified group of no more than 17 students will be placed in a modified program for year 1 and adapted for year 2 and 3 in order to complete Cycle 1 in 3 years and work towards getting them to an acceptable academic level. Students will then be directed to an educational program suitable for their success.
33
Indicator Target Strategies
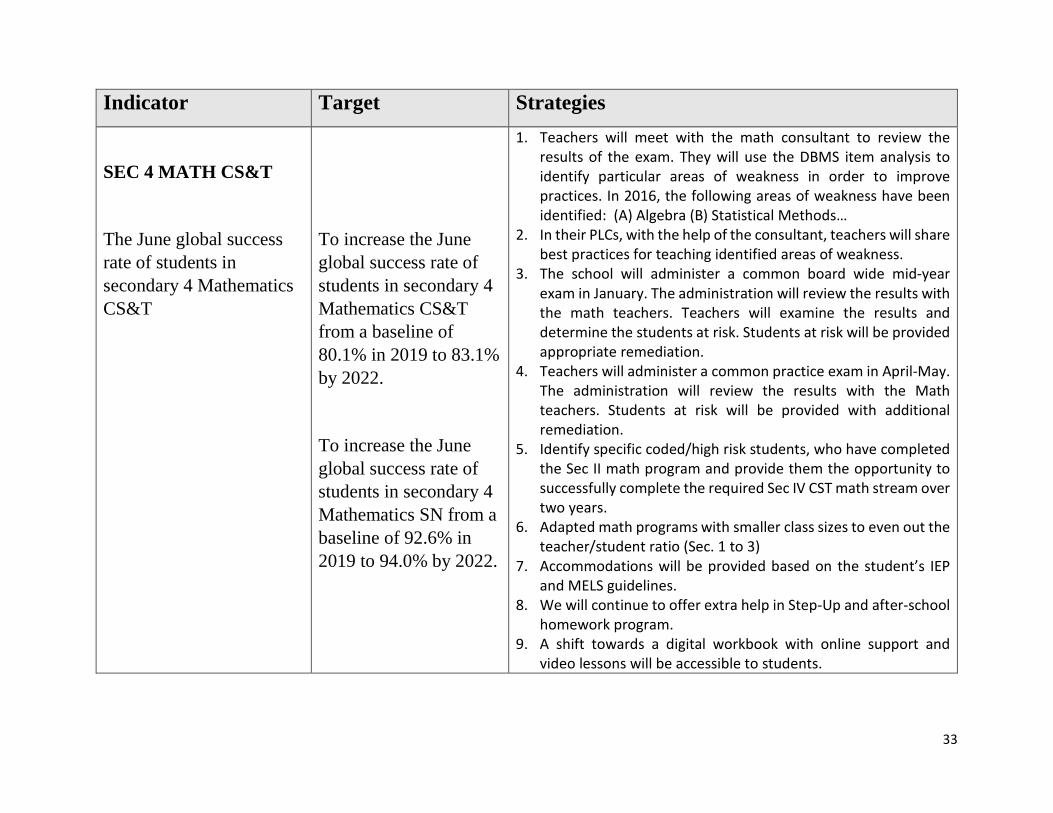
SEC 4 MATH CS&T
The June global success rate of students in secondary 4 Mathematics CS&T
To increase the June global success rate of students in secondary 4 Mathematics CS&T from a baseline of 80.1% in 2019 to 83.1% by 2022.
To increase the June global success rate of students in secondary 4 Mathematics SN from a baseline of 92.6% in 2019 to 94.0% by 2022.
1. Teachers will meet with the math consultant to review the results of the exam. They will use the DBMS item analysis to identify particular areas of weakness in order to improve practices. In 2016, the following areas of weakness have been identified: (A) Algebra (B) Statistical Methods…
2. In their PLCs, with the help of the consultant, teachers will share best practices for teaching identified areas of weakness.
3. The school will administer a common board wide mid-year exam in January. The administration will review the results with the math teachers. Teachers will examine the results and determine the students at risk. Students at risk will be provided appropriate remediation.
4. Teachers will administer a common practice exam in April-May. The administration will review the results with the Math teachers. Students at risk will be provided with additional remediation.
5. Identify specific coded/high risk students, who have completed the Sec II math program and provide them the opportunity to successfully complete the required Sec IV CST math stream over two years.
6. Adapted math programs with smaller class sizes to even out the teacher/student ratio (Sec. 1 to 3)
7. Accommodations will be provided based on the student’s IEP and MELS guidelines.
8. We will continue to offer extra help in Step-Up and after-school homework program.
9. A shift towards a digital workbook with online support and video lessons will be accessible to students.

34
10. A new remediation program will be developed, identifying students at risk and placing them into intense remediation groups serviced by our teacher, with specific skills targeted.
SEC 4 SCIENCE& TECHNOLOGY
The June global success rate of students in secondary 4 Science and Technology
To increase the June global success rate of students in secondary 4 Science and Technology from a baseline of 87.3% in 2019 to 89.1% by 2022.
1. Proper placement of students with IEPs in the various levels of Math, English, French and Science (Sec IV only).
2. A half year review course for students having failed Sec IV science.
3. Increasing overall awareness of science by the introduction of a S.T.E.A.M: Science, Technology, Engineering, Arts and Mathematics initiative program piloted at the Junior Campus beginning in 2018. The program involves the creation of a maker space location within the school and the implementation of cross curricular STEAM projects by our lead teachers.
Indicator Target Strategies
SEC 4 HISTORY OF QUEBEC & CANADA
The June global success rate of students in secondary 4 History & Citizenship (History of Quebec and Canada*)
To increase the June global success rate of students in secondary 4 History & Citizenship (History of Quebec and
1. Teachers will meet with the Social Studies consultant to review the results of the exam. They will use the DBMS item analysis to identify particular areas of weakness in order to improve practices. In 2016, the following areas of weakness have been identified making inferences and reading documents
2. In their PLCs, with the help of the consultant, teachers will share their best practices for teaching identified areas of weakness.
3. The school will administer a common board wide mid-year exam in January. The administration will review the results with the history teachers. Teachers will examine the results and identify the students at risk. Students at risk will be provided appropriate remediation.

35
SEC 4 HISTOIRE DU QUÉBEC ET DU CANADA
The global success rate of students in secondary 4 Histoire du Québec et du Canada*
Canada*) from a baseline of 86.7% in 2019 to 89.7% by 2022.
To maintain the June global success rate of students in secondary 4 Histoire from a baseline of 90.3% in 2019 to 90.3% by 2022.
4. Teachers will administer a common practice exam in April-May. The administration will review the results with the history teachers. Students at risk will be provided with additional remediation.
5. Accommodations will be provided based on the student’s IEP and MELS guidelines.
6. We will continue to offer extra help in Step-Up and after-school homework program.
7. Half year review courses in History and Science for students having failed those courses in Sec IV.
8. Our history teachers piloted the secondary 4 course in 2017 and hence received first hand training from the MEES. Pilot teachers along with those from LBPSB and Western Quebec created a common mid/year exam and the Ministry provided a supplemental exam in June. There are many things which could explain the considerable increase in the success rate.

36
Equity: Objective 2: To maintain the low gap in success rates between the males and females from 1.2% in 2019 to 1.2% through 2022.
Indicator Target Strategies
The gap in success rates between the males and females
To maintain the marginal gap in success rates between the males and females from a baseline gender difference of 1.2% in 2019 to a baseline gender difference of 1.2% in 2022.
1. Identify individual learning needs through tracking progress and targeted support.
2. Gendered physical education classes. 3. A diverse array of teaching and assessment approaches that
appeal to both genders. 4. Provide academic performance data on how boys faired versus
the girls within the school. 5. Challenge gender roles and provide positive role models that
counteract negative perceptions of learning.

37
Language Proficiency: Objective 4: To maintain the global success rate in secondary 5 English Language Arts June MEES examination from a baseline of 98.8% in 2019 to 98.8% through 2022.
Objective 4.1: To increase the average mark of secondary 5 students in English Language Arts June MEES examination from a baseline of 74.2% in 2019 to 76.0% by 2022.
Objective 4.2: To increase the success rate of students in secondary 5 FSL programme de base on the June MEES Examination Reading Component from a baseline of 86.3% in 2019 to 89.3% by 2022.
Objective 4.3: To maintain the success rate of students in secondary 5 FSL programme enrichi on the June MEES Examination Reading Component from a baseline of 90.9% in 2019 to 90.9% through 2022.
Indicator Target Strategies The global success rate in secondary 5 English Language Arts June MEES examination
To maintain the global success rate in secondary 5 English Language Arts June MEES examination from a baseline of 98.8% in 2019 to 98.8 % through 2022.
1. Promoting cross-curricular literacy across all subject areas. 2. Teacher modeling of reading and writing skills. 3. Spelling and Public Speaking competitions in English. 4. Enriched and adapted ELA classes 5. Language specialists (train & develop teacher skills in English literacy

38
The average mark of secondary 5 students in English Language Arts June MEES examination
To increase the average mark of secondary 5 students in English Language Arts June MEES examination from a baseline of 74.2% in 2019 to 76.0% by 2022.
1. Continuing to identify, purchase and train (when needed) on new technologies which support language learning in English.
2. Purchase of class resources including English text based tools, books and media
3. Resource Team (Support teachers & students in English classrooms) 4. Advanced 5 program (Jr. campus level) 5. English Authors (to work with students) 6. In-class libraries updated and increased. 7. Rosetta Stone
The success rate of students in secondary 5 FSL programme de base on the June MEES Examination Reading Component
To increase the success rate of students in secondary 5 FSL programme de base on the June MEES Examination Reading Component from a baseline of 86.3% in 2019 to 89.3% by 2022.
1. Continuing to identify, purchase and train (when needed) on new technologies which support language learning in French
2. Purchase of class resources including French text based tools, books and media.
3. Continuing the introduction of teaching History & Geography classes, in Sec. I & II, in the French Language.
4. Promoting cross curricular literacy across all subject areas. 5. Teacher modeling of reading and writing skills. 6. Spelling and Public Speaking competitions in French 7. Language specialists (train & develop teacher skills in French literacy 8. Resource Team (Additional personnel tasked to support teachers &
students in French classrooms). 9. Hire additional resource personnel in FSL classrooms. 10. French Authors (to work with students) 11. In-class libraries updated and increased. 12. Rosetta Stone 13. Exposure to cultural events
39
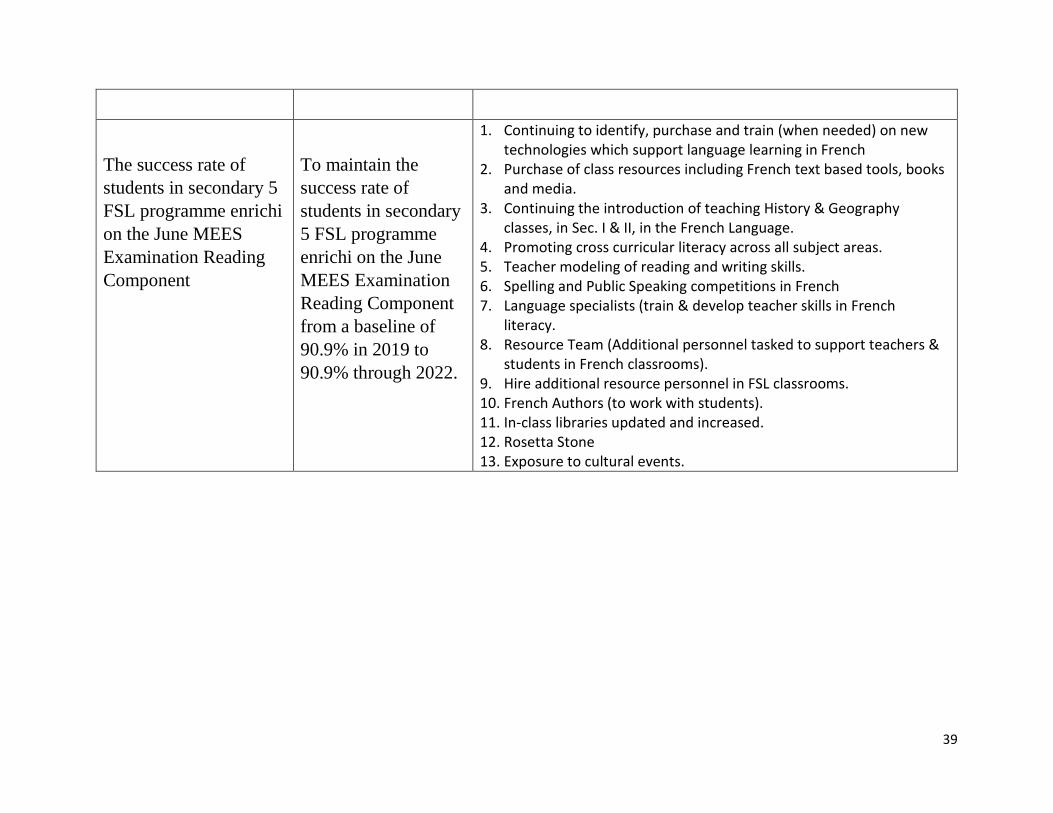
The success rate of students in secondary 5 FSL programme enrichi on the June MEES Examination Reading Component
To maintain the success rate of students in secondary 5 FSL programme enrichi on the June MEES Examination Reading Component from a baseline of 90.9% in 2019 to 90.9% through 2022.
1. Continuing to identify, purchase and train (when needed) on new technologies which support language learning in French
2. Purchase of class resources including French text based tools, books and media.
3. Continuing the introduction of teaching History & Geography classes, in Sec. I & II, in the French Language.
4. Promoting cross curricular literacy across all subject areas. 5. Teacher modeling of reading and writing skills. 6. Spelling and Public Speaking competitions in French 7. Language specialists (train & develop teacher skills in French
literacy. 8. Resource Team (Additional personnel tasked to support teachers &
students in French classrooms). 9. Hire additional resource personnel in FSL classrooms. 10. French Authors (to work with students). 11. In-class libraries updated and increased. 12. Rosetta Stone 13. Exposure to cultural events.

40
The Living Environment: Objective 5.0: To decrease the rate of our secondary students who report victimization resulting from bullying on the OURSCHOOL Survey from a baseline of 20%(JR) and 18%(SR) in 2019 to 18%(JR) and 16%(SR) by 2022. Objective 5.1: To increase the rate of secondary students who report feeling safe attending school on the OURSCHOOL Survey from a baseline of 54%(JR) and 57%(SR) in 2019 to 57%(JR) and 61%(SR) by 2022. Objective 5.2: To decrease the rate of moderate to high level anxiety as reported by secondary school students on the OURSCHOOL Survey from a baseline of 20.6%(JR) and 24%(SR) in 2019 to 18.6%(JR) and 22%(SR) by 2022. Indicator Target Strategies The rate of our secondary students who report victimization resulting from bullying on the OURSCHOOL Survey
To decrease the rate of our secondary students who report victimization resulting from bullying on the OURSCHOOL Survey from a baseline of 20%(JR) and 18%(SR) in 2019 to 18%(JR) and 16%(SR) by 2022
Maison Jean Lapointe for Sec. I Project Pride for Sec. II MADD speaker for Sec. V Fosters Program established at Senior Campus Police intervention (punitive and preventative) Hiring of student monitor Project LOVE (Sr. Campus) Big Brothers/Big Sisters (Jr. Campus) Police Community rep. Guest speakers NANS money Guidance Counselor Social Worker

41
The rate of secondary students who report feeling safe attending school on the OURSCHOOL Survey
To increase the rate of secondary students who report feeling safe attending school on the OURSCHOOL Survey from a baseline of 54%(JR) and 57%(SR) in 2019 to 57%(JR) and 61%(SR) by 2022.
Maison Jean Lapointe for Sec. I Project Pride for Sec. II MADD speaker for Sec. V Fosters Program established at Senior Campus Police intervention (punitive and preventative) Hiring of student monitor Project LOVE (Sr. Campus) Big Brothers/Big Sisters (Jr. Campus) Police Community rep. Guest speakers NANS money Guidance Counselor Social Worker
The rate of moderate to high level anxiety as reported by secondary school students on the OURSCHOOL Survey
To decrease the rate of moderate to high level anxiety as reported by secondary school students on the OURSCHOOL Survey from a baseline of 20.6%(JR) and 24%(SR) in 2019 to 18.6%(JR) and 22%(SR) by 2022.
Maison Jean Lapointe for Sec. I Project Pride for Sec. II MADD speaker for Sec. V Fosters Program established at Senior Campus Police intervention (punitive and preventative) Hiring of student monitor Project LOVE (Sr. Campus) Big Brothers/Big Sisters (Jr. Campus) Police Community rep. Guest speakers NANS money Guidance Counselor Social Worker