Education The Economic Impact of the MSU Pa vilion for ...
14
See discussions, stats, and author profiles for this publication at: https://www.researchgate.net/publication/334305172 The Economic Impact of the MSU Pavilion for Agriculture and Livestock Education Technical Report · July 2019 DOI: 10.13140/RG.2.2.25243.82721 CITATIONS 0 READS 9 1 author: Some of the authors of this publication are also working on these related projects: 2018 Senior PGA Championship in Benton Harbor - Economic Impact View project Center for Economic Analysis View project Steven R Miller Michigan State University 94 PUBLICATIONS 100 CITATIONS SEE PROFILE All content following this page was uploaded by Steven R Miller on 08 July 2019. The user has requested enhancement of the downloaded file.
Transcript of Education The Economic Impact of the MSU Pa vilion for ...

See discussions, stats, and author profiles for this publication at: https://www.researchgate.net/publication/334305172
The Economic Impact of the MSU Pavilion for Agriculture and Livestock
Education
Technical Report · July 2019
DOI: 10.13140/RG.2.2.25243.82721
CITATIONS
0READS
9
1 author:
Some of the authors of this publication are also working on these related projects:
2018 Senior PGA Championship in Benton Harbor - Economic Impact View project
Center for Economic Analysis View project
Steven R Miller
Michigan State University
94 PUBLICATIONS 100 CITATIONS
SEE PROFILE
All content following this page was uploaded by Steven R Miller on 08 July 2019.
The user has requested enhancement of the downloaded file.

The Economic Impact of the
MSU Pavilion for Agriculture and Livestock Education
Michigan State University
Product Center Food-Ag-Bio
Center for Economic Analysis
Steven Miller, Ph.D.
July 2019
Abstract and Introduction
We estimate the economic impact of the MSU Pavilion for Agriculture and Livestock Education. The MSU
Pavilion is a state of the art, multi-arena, indoor and outdoor exhibit and sports facilities on the MSU
campus in East Lansing, MI. It’s main arena seats 2,000 and has over 23,000 square feet of floor space. It
also houses a 364 seating auditorium, a 77,000 square foot exhibit space, on-site campgrounds amongst
other features. The last assessment of the economic impact of the MSU Pavilion was undertaken in
2008. This report, applying different approaches to estimation and assumptions updates those
estimates and finds that the MSU Pavilion is a significant source of economic activity in the Lansing-East
Lansing metropolitan area, contributing about 93 jobs to the regional economy and generating some
$5.7 million in net earnings. Over the 27 years of operations, we assert the Pavilion has contributed just
under $160 million in business and household earnings in this region. Using interviews with event hosts,
we assert that the current facilities limit the size and number of events hosted at the Pavilion. The
planned expansion of the MSU facilities would likely result in an immediate increase in visits by some 25
percent.

2
Introduction
The MSU Pavilion for Agriculture and Livestock Education, or as commonly known as the MSU Pavilion,
was built in 1996 as part of Michigan’s investment in the Animal Agriculture Initiative to buoy Michigan’s
livestock industry. The initial 1993 initiative, made up of a collaboration between the state’s animal
agriculture industries and MSU, continues today under the name Michigan Alliance for Animal Agriculture
to support industry needs and to advance the science and industry of Michigan’s animal agriculture. One
of those investments was the establishment of the MSU Pavilion.
The MSU Pavilion’s impact extends well beyond the traditional impacts of public investment in higher
education and research typical of land grant universities in that the Pavilion hosts events with broad public
appeal. These hosted events include livestock shows and auctions, educational opportunities like the MSU
Exploration Days, spectator sporting events like the Spartan Stampede Rodeo, trade shows like the
Lansing Annual Home and Garden shows, and others. These events have broad appeal and attract visitors
to the Lansing-East Lansing area with the potential to contribute to the economic growth of the region.
The contributions of the MSU Pavilion to the East Lansing community will be 23 years in the making this
year. Throughout this 23-year history, there has been no major renovations or expansion of the Pavilion,
aside from the installation of the South Barn, which added 140 stalls to the facility, the main Pavilion
facilities largely remain unchanged since 1996. The South Barn was added in 1999 through funding
provided by donations, including $80,000 from the Michigan Horse Council and $75,000 from the
Michigan Quarter Horse Association, amongst other notable contributions.
The MSU Department of Animal Science has proposed a 40,000 square foot addition to the east side of
the Pavilion to meet the needs of Michigan’s agricultural community. The proposal is to encompass the
outdoor arena space within a permanent cover and has an expected cost of $3 million. Funding for this
expansion will be sought through donations from industry and individuals.
The proposed expansion will facilitate increased number and size of shows and public events held at the
Pavilion. This expansion is expected to increase the size and scope of currently hosted events and to
attract new events to the MSU Pavilion (Rancour 2019). More specifically, hosts of larger events held at
the MSU Pavilion have indicated that they can attract more participants at their events if the Pavilion had
more covered space. This expansion will also allow the Pavilion to play host to more simultaneously-held
events, where space is a limiting factor. It is not uncommon for more than one event to be hosted at a
given time and broadening the footprint of the Pavilion will improve the logistics of and ability to host
simultaneous events.
This report reviews the sources of economic impact the MSU Pavilion provides, develops an approach for
measuring those impacts and provides baseline estimates of the ongoing economic impact of the MSU

3
Pavilion on the four-county region making up the Lansing-East Lansing metropolitan statistical area
(MSA).1 It concludes with an estimate of the post-expansion impacts based on interviews of event hosts.
Background
The MSU Pavilion largely comprises a single structure encompassing a 2,000 person Arena with over
23,000 square foot of floor space, a 364-person auditorium and over 77,000 square foot of exhibit space.
It also houses in-facility and an on-site barn for housing livestock. It houses four meeting rooms entailing
some 13,000 square feet of meeting space. The grounds host an outdoor arena and just under 100 camp-
site connections. The site is conveniently located just off of Michigan 127 with ample lodging to facilitate
non-camping overnight guests.
The MSU Pavilion hosts some 96 events a year, attracting over 920000 people to the facility, each year.
These events cover a wide swath of event types and sizes but are generally events that benefit from the
open space afforded by the MSU Pavilion. Notable events include the Spartan Stampede Rodeo, the
Michigan Beef Expo, the Michigan Great Lakes International Draft Horse Show and numerous horse shows
sponsored by the Michigan Quarter Horse Association and the Michigan Horse Council. In addition to
these events, the MSU Pavilion is host to the annual Lansing Family RV Show and the Lansing Home and
Garden Show. These and other events attract visitors from inside and outside the local region and
generate measurable contributions to the regional economy.
Methods and findings
Two sources of impacts are modeled. The first is that which arise from the operations and maintenance
(O&M) of the MSU Pavilion. O&M impact estimates are justified in that these expenditures do not
supplant other expenditures that would have taken place in the Lansing-East Lansing area in the absence
of the MSU Pavilion. The assumption of no substitution may overstate the impacts to the extent that
events hosted at the Pavilion would have been hosted at other Lansing-East Lansing area sites in the
absence of the Pavilion. For some events, like the Home and Garden Show or the RV show, alternative
venues may exist. Even for livestock-related events, there may be alternative facilities, like the Ingham
County Fairgrounds that can provide substitute venues. However, as indicated with interviews of Pavilion
event hosts, much of the draw of hosting events at the Pavilion is the facilities itself. We assert, by
assumption, that these events likely would not take place in the absence of the pavilion and hence
earnings required to support O&M would also not be generated. The second source of impact is from
participants that travel to the area to participate in hosted events.
We identified 77 distinct events, defined across multiple categories scheduled for 2019 (Table 1). Other
events may be added as the year progresses, but these events represent the cornerstone events with long
lead times for planning. Events were categorized into one of six categories, where one event escapes
categorizing. Most events fall into the category of horse-related events. Horse shows and auctions are
somewhat legendary in the amount of expenditures they generate in the local economy (Rephann 2011).
The Pavilion is also expected to host 15 livestock-related events in 2019. Livestock shows include livestock
competitions and auctions and can generate significant participation. They exclude small animal shows
that include dog and rabbit shows attracting both spectators and contestants. Spectator events include
1 Currently defined as Clinton County, Eaton County, Ingham County and Shiawassee County
4
contests and have a general audience draw, while trade shows and meets have a mixed draw of
enthusiasts, as in the train show and the the RV and Home and Garden shows.
Event Type Count Share
Educational 3 3.9% Horse 40 51.9% Livestock 15 19.5% Small Animals 9 11.7% Spectator 4 5.2% Trade show/Meet 5 6.5% NA 1 1.3%
Total 77 100.0% Table 1: 2019 Scheduled Events
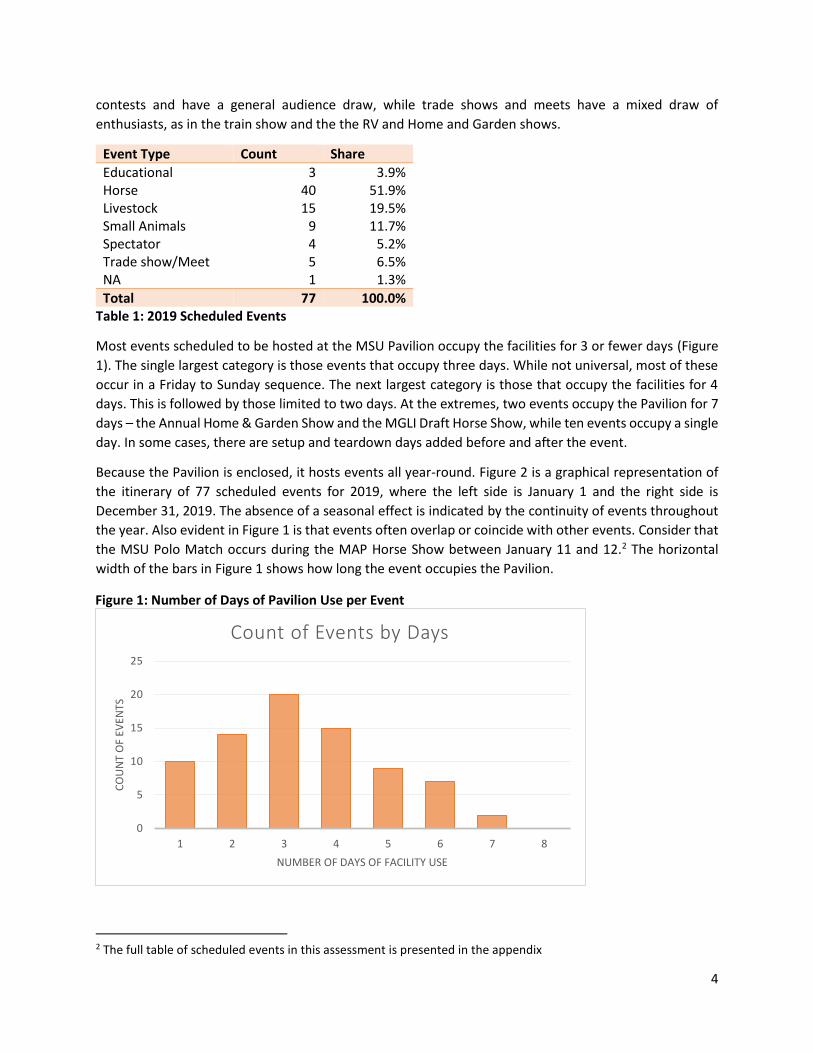
Most events scheduled to be hosted at the MSU Pavilion occupy the facilities for 3 or fewer days (Figure
1). The single largest category is those events that occupy three days. While not universal, most of these
occur in a Friday to Sunday sequence. The next largest category is those that occupy the facilities for 4
days. This is followed by those limited to two days. At the extremes, two events occupy the Pavilion for 7
days – the Annual Home & Garden Show and the MGLI Draft Horse Show, while ten events occupy a single
day. In some cases, there are setup and teardown days added before and after the event.
Because the Pavilion is enclosed, it hosts events all year-round. Figure 2 is a graphical representation of
the itinerary of 77 scheduled events for 2019, where the left side is January 1 and the right side is
December 31, 2019. The absence of a seasonal effect is indicated by the continuity of events throughout
the year. Also evident in Figure 1 is that events often overlap or coincide with other events. Consider that
the MSU Polo Match occurs during the MAP Horse Show between January 11 and 12.2 The horizontal
width of the bars in Figure 1 shows how long the event occupies the Pavilion.
2 The full table of scheduled events in this assessment is presented in the appendix
Figure 1: Number of Days of Pavilion Use per Event
0
5
10
15
20
25
1 2 3 4 5 6 7 8
CO
UN
T O
F EV
ENTS
NUMBER OF DAYS OF FACILITY USE
Count of Events by Days

5
Our economic impact assessment will use
the number of days and stalls leased for
assessing visitor impacts on the local
economy. In this, events that occupy more
days and more stalls, costs more money to
host. Because they are more costly to host,
the event must impart more participation
to cover the higher hosting costs. Hence,
the more days and stalls the event occupies
the larger the visitation and the associated
economic impact, holding all else constant.
Other factors go into the calculation,
including the type of event being hosted. A
livestock or horse show generally require
expenditures for hauling and housing
animals relative to spectator events.
However, since most events entail some
level of farm animal activity, most events
will generate some level of expenditure for
transporting and housing animals.
To use event days and event types for
estimating the economic draw, we survey a
random sample of event hosts to gather
minimal baseline data. Interviews were
conducted between May 2 and June 6 of
2019. These informal telephone interviews
follow the discussion questions shown in
Appendix B. This simple instrument is
designed to be unobtrusive and short to
encourage candid responses. At the core of
the impact estimates is how many
individuals traveled to the Lansing-East
Lansing area to attend the hosted event.
Hence, we ask about the attendance and
perception of the geographic extent of
event participants. We also inquire
whether the event host resides in the local
economy and what expenditures the hosts
made in the local economy during the
event.
Once completing the telephone surveys, a
model of visitor counts by event type and
number of days is created do extrapolate
Figure 2: 2019 Calendar of Pavilion Events
1/1 4/11 7/20 10/28
MI Horseshoers Clinic and Contest
Spartan Puppy Match
MSU Polo Match
MAP Horse Show
MSU Horsemen's Clinic
RV Show
4-H Rabbit & Cavy Expo
Green & White Hog Show
IHSA Horse Show
MQHA Horse Show
MQHYA Tack Swap
4-H Benefit Clinic
MAP Horse Show
AGR Beef Preview Show
Spartan Stampede Rodeo
S. MI Paint & Qtr. Horse Auction
Quiet Water Symposium & MI State Rabbit…
MI State Rabbit BreedersShow
Stallion Expo
Annual Home & Garden Show
Spring Dairy Show & Sale
4-H/FFA Horse Judging Contest & Equine Expo
MI Beef Expo
Pattern-O-Rama Horse Clinic/Hairy Horse…
FFA AG Skills Contest
Small Animal’s Day
MQHYA Easter Extravaganza
MQHYA Spartan Spectacular Horse Show
All Arabian Horse Show
Great Lakes Quarter Horse Show
Apple Blossom Classic Horse Show
All Morgan Horse Show
Half Arabian Horse Show
Junior Beef Show
Jr Sheep Show
GL Buckskin Horse Show
Junior Swine Show
Open Swine Show
Exploration Days
State 4-H Goat Show
MI Arab Assoc Show
POA East World Show
Apple Blossom Classic
MI Livestock Expo
4-H/FFA Livestock Judging Contest
4-H Dairy Days & Dairy Expo
GoShow Midwest Horse Show
Arabian Horse Show
MAPHA Sizzler Horse Show
4-H State Dog Show
State 4-H Horse Show
MAPHA Classic Horse Show
DALMAC
Llamafest
GL Buckskin Horse Show
MI Morgan Breeders Futurity
MQHA Futurity
B & B Little I
MSU Polo Match
Apple Blossom Classic
MQHA Horse Show
Buckskin Congress
ASHAM Horse Show
MGLI Draft Horse Show
Paint Horse Show
MHSA Horse Show
Autumnfest
MSU Horseman’s Association Green & White …
Model Train Show
So. MI Paint & Quarter Horse Sale
Michigan Rabbit Breeders State Show
Cowboy Christmas
Specialty Dog Show
Ingham Kennel Club Dog Show
Winter Beef Show
ShoMe Holiday ShoDown Horse Show
Holiday Harvest Dairy Sale

6
across other events for which an interview was not conducted. The surveyed counts of attendance and
visitors, along with that from extrapolation are then aggregated to estimate total number of visitors draws
to the MSU Pavilion for these 77 events.
Understanding the economic impacts of expenditures requires understanding and categorizing
expenditures visitors make while attending the MSU Pavilion events. We are careful to only designate
expenditures by visitors and not include those of local residents attending events, because the local
expenditures made by local residents are likely to simply supplant other expenditures in the local economy
in the absence of the hosted event. Site studies with visitor expenditure are used to generate expenditure
profiles by event type per visitor day used in this assessment (Flanders, Wolfe et al. 2006, Barta, Anderson
et al. 2010, Penn State Center for Economic & Community Development 2014, Rephann 2014, Consulting
2017). That is, each visitor party is assigned an expenditure profile depending on the type of event and
whether an overnight stay is anticipated for that visitor party. Estimates of the infusion of economic
activity from all visitor parties is estimated as the aggregate of the estimated expenditures of all visitor
parties over the calendar year.
Basing the economic impact of hosted events on visitor expenditures risks underestimating the economic
contribution of such events. Efforts will be made to assign hosting expenditures in the local economy, as
discussed above, but estimating other economic benefits would require a detailed analysis that is largely
outside the scope of this work. Such sources of economic impacts may include the amount of expenditures
from local residents captured in the region because the resident does not need to travel outside the local
region to participate in the attended event. Livestock producers in Eaton County, for example, are able to
stay local when attending livestock auctions at the MSU Pavilion, thereby increasing their budgets for
other expenditures. Hence, the expenditures they would have made in another region, should that
auction take place outside the region, would be considered captured by the MSU Pavilion. Ascertaining a
basis for estimating local expenditures captured would require extensive on-site surveying and therefore,
are not approximated in these estimates. In addition, “stemming from effects” which arise because of the
Pavilion but not of the Pavilion, will not be considered. Stemming from effects may include the
development of industry connections in the local economy or business formation drawn to the local
economy because of or through exposure with the Pavilion. A hypothetical example may clarify. Consider
a Michigan livestock producer association that exists in Michigan. Since they host their annual show at the
Pavilion, they may be drawn to the Lansing-East Lansing area to establish a branch office or to headquarter
their operations. In addition, the presence of their annual show may spark interest in local producers take
up this commodity production. Similar potential impacts may arise through other types of events, but
largely remain outside the scope of this study.
Economic impacts of new expenditures are modeled using an IMPLAN Pro. 3.1 model specified for the
three-county Lansing-East Lansing metropolitan area.3 IMPLAN is a commonly applied economic impact
simulation model for estimating the economic impacts of changes in expenditures and reports how direct
changes in expenditures drive secondary transactions as dollars recirculate throughout the economy. That
is, as one party makes an expenditure, the receiving business gains revenues. Part of those revenues will
be spent in the local economy as wages, for business services (like printing, accounting, etc.), utilities, rent
and possibly for inventory for future sales. The size of the multipliers is an expression of the extent to
3 Includes Clinton, Eaton and Ingham Counties.

7
which dollars re-circulate within the local economy and vary by industry, but specific to the modeling
region.
The IMPLAN model provides multiple measures of economic impact, including sales, employment, labor
income and contributions to gross regional product (GRP: a measure of total regional income). GRP
includes labor income, proprietors’ income (profits) and indirect business taxes earned. All impacts are
derived from estimates of sales, including all secondary transactions that arise through dollars circulating
throughout the economy. Non-sales impacts are estimated using fixed ratios of averages to the value of
sales. For example, if the industry average employment to sales ratio is 1 job for every $1 million in sales,
then increase in sales of $10 million will provide an employment impact of 10 jobs. These fixed ratios are
industry-specific and specific to the modeling region.
Findings
we assert that revenues generated at the MSU Pavilion contributes to the overall economic impacts of
these facilities. The annual operating budget of the Pavilion is about $789,000. Of that over half of that
expense is tied to payroll, about $76,000 is for the purchase of new equipment and maintenance and
repair of the facilities. The remainder is operations and includes the purchase of agricultural inputs,
including bedding, that is sold to event hosts and participants, utilities and other expenditures required in
the course of operating these facilities.
It is difficult to verify the estimates of the number of visitors attending Pavilion-hosted events. We
compare our estimates against those of similar facilities (Flanders, Wolfe et al. 2006, Barta, Anderson et
al. 2010, Penn State Center for Economic & Community Development 2014, Rephann 2014, Consulting
2017), but because the mix and expanse of events hosted at such events differ across multiple studies,
we can only assert whether our visitation counts are reasonable. The share of visitors visiting from outside
the region was assessed by event type using interviews and ranged significantly depending on the event.
Averages were used by event type and checked against the expansive survey of visitors at the Farm Show
Complex & Expo Center survey for validation. Because only expenditures from visitors arriving from
outside the Lansing area are asserted to generate an economic impact, we attribute visitor expenditure
impacts only to those not residing in the Lansing-East Lansing area.
In total, we estimate that the Pavilion creates 68,000 visitor days in the Lansing-East Lansing area and just
under 34,000 visitor overnight stays. We assert that most stays are accommodated with hotel stays, but
that a sizable share also use the on-site campgrounds or other accommodations. We assert that average
lodging costs per visitor night is $79 per party (average party size is assumed 2.5 persons), while meals
and other expenditures total $25 per person-day.4 Total estimated expenditures from out of town visitors
is estimated to be $4,378,795 per year. This excludes expenditures by local residents.
Adding these expenditures to the IMPLAN Pro. 3.1 economic impact simulation model for the three-
county area, breaking out visitor expenditures into lodging based on visitor night estimates and
distributing meals and other expenditures based using survey data from a similar facility (Penn State
Center for Economic & Community Development 2014) provides our final estimates of the overall
4 Non-meal expenditures making up the per-person expenditures that are spent on retail purchases apply margins to net out the cost of goods sold. That is, if a visitor purchases a t-shirt, the cost of acquiring that t-shirt for sale is subtracted, as the t-shirt was likely not produced in the local economy.

8
economic impacts of the MSU Pavilion. The findings show that once accounting for all secondary
transactions, the MSU Pavilion generates about $5.7 million in earnings for Lansing-East Lansing
businesses. This includes earnings paid to labor, proprietors, and profits to firms. Of this, about $3.4
million is payments to labor, covering some 93 area jobs.
A similar study, employing a different approach to estimating economic impacts of the MSU Pavilion, was
performed in 2008 by the MSU Center for Economic Analysis, concluding that the Pavilion contributed just
over $5 million in earnings for the Lansing-East Lansing businesses. Conjecturing a linear trend between
the 2008 and today, an exponential growth from zero in 1993 (year of establishment), we estimate that
the MSU Pavilion has contributed about $128 million in nominal regional earnings over the current life of
the Pavilion. Measured in today’s dollars, that estimate is $160.7 million in regional earnings over the 27-
years of operations.
During interviews with event hosts, we asked respondents if expansion of the number of stalls and the
show space at the MSU Pavilion would encourage them to 1) expand their existing show and 2) consider
adding another event to at the Pavilion. The responses largely suggest that many of the hosts of larger
events feel the Pavilion’s current limitation constrains the size of their events, and that expanding the
Pavilion size would allow them to increase the draw of their events. Others lamented that they compete
with other shows hosted in congruence with their show, where species may not be compatible. By adding
additional space between shows, they project the expansion will improve their show attendance. Of the
smaller shows, an expansion may not impact the shows currently hosted, but multiple respondents
suggested that expansion of the facilities may free up capacity to add additional shows. To be sure, many
of the Pavilion event hosts indicated hosting more than one event a year at the Pavilion and on many
weekends, more than one show takes place. For both small and large event hosts, there was expressed
interest in adding additional shows should new slots at the MSU Pavilion be available. Based on these
discussions, we conjecture that the Pavilion’s total impact may increase by about 25 percent, should the
planned expansion be implemented. That is, should the Pavilion undertake the planned expansion, the
annual contribution to the Lansing-East Lansing economy would be to support some 116 jobs with annual
salaries of $4.2 million and contributing $7.2 million to regional earnings.
Conclusions
Economic impact estimates provided here reflect the influx of revenue from outside of the region because
of the MSU Pavilion for Agriculture and Livestock Education. Visitors from outside the region bring in
outside revenues that are spent in the local economy, while local businesses re-spend these earnings to
generate a larger regional economic impact. This report details the expected economic impacts of
earnings generated by the MSU Pavilion.
The approach of delineating direct impacts by where visitors travel from has the potential to
underestimate the true impacts of Pavilion events. Expenditures by local patrons are netted out to
maintain consistency in tracing visitor spending. However, Pavilion events may attract local attendees
who may otherwise travel outside of the region in the absence of the Pavilion. Hence, the Pavilion also
has the potential to capture local dollars that would have been spent outside the state. This report does
not attempt to incorporate such local expenditures captured by Pavilion events, nor conjecture how the
Pavilion has changed the mix and expanse of Lansing-East Lansing commercial activities. The impact
estimates relate to some 77 events hosted at the MSU Pavilion, showing that the Pavilion supports some
93 regional jobs and $5.7 million to regional earnings. Over the 27-year span of operations, this amounts

9
to just under $161 million to business and household earnings in the Lansing-East Lansing metropolitan
area. The Pavilion seeks to expand the facilities by adding stalls and a covered arena. As the Pavilion hosts
events year-round, adding this covered space has potential to increase it’s draw in the wintertime, where
the current outdoor arena is exposed to the elements. This addition would also provide needed space for
larger events that are currently constrained by the current facilities, as indicated with interviews of event
hosts. We conjecture that the proposed expansion will result in about a 25 percent increase in visitation
and use of the MSU Pavilion, such that the post-expansion impact would support some 116 regional jobs
with about $7.2 million in regional earnings.

Appendix A
10
List of 2019 Events
Event Start End Days Type
MI Horseshoers Clinic and Contest 01/02/19 01/05/19 4 Horse Spartan Puppy Match 01/05/19 01/06/19 2 Small Animals MSU Polo Match 01/11/19 01/11/19 1 Spectator MAP Horse Show 01/11/19 01/12/19 2 Horse MSU Horsemen's Clinic 01/11/19 01/13/19 3 Horse RV Show 01/17/19 01/20/19 4 Trade show/Meet 4-H Rabbit & Cavy Expo 01/25/19 01/26/19 2 Small Animals Green & White Hog Show 01/25/19 01/27/19 3 Livestock IHSA Horse Show 01/27/19 01/27/19 1 Horse MQHA Horse Show 01/31/19 02/03/19 4 Horse MQHYA Tack Swap 02/01/19 02/02/19 2 Horse 4-H Benefit Clinic 02/01/19 02/02/19 2 Educational MAP Horse Show 02/08/19 02/09/19 2 Horse AGR Beef Preview Show 02/08/19 02/10/19 3 Livestock Spartan Stampede Rodeo 02/12/19 02/17/19 6 Spectator S. MI Paint & Qtr. Horse Auction 02/22/19 02/24/19 3 Horse Quiet Water Symposium & MI State Rabbit Breeders 03/01/19 03/02/19 2 Small Animals MI State Rabbit Breeders Show 03/02/19 03/03/19 2 Small Animals Stallion Expo 03/05/19 03/10/19 6 Horse Annual Home & Garden Show 03/11/19 03/17/19 7 Trade show/Meet Spring Dairy Show & Sale 03/19/19 03/23/19 5 Livestock 4-H/FFA Horse Judging Contest & Equine Expo 03/24/19 03/24/19 1 Horse MI Beef Expo 03/26/19 03/31/19 6 Livestock Pattern-O-Rama Horse Clinic/Hairy Horse Show 04/05/19 04/06/19 2 Horse FFA AG Skills Contest 04/12/19 04/12/19 1 Spectator Small Animal’s Day 04/13/19 04/13/19 1 Small Animals MQHYA Easter Extravaganza 04/16/19 04/21/19 6 Horse MQHYA Spartan Spectacular Horse Show 04/25/19 04/28/19 4 Horse All Arabian Horse Show 04/30/19 05/05/19 6 Horse Great Lakes Quarter Horse Show 05/09/19 05/12/19 4 Horse Apple Blossom Classic Horse Show 05/17/19 05/19/19 3 Horse All Morgan Horse Show 05/22/19 05/26/19 5 Horse Half Arabian Horse Show 05/29/19 06/02/19 5 Horse Junior Beef Show 06/07/19 06/09/19 3 Livestock Jr Sheep Show 06/07/19 06/09/19 3 Livestock GL Buckskin Horse Show 06/07/19 06/09/19 3 Horse Junior Swine Show 06/14/19 06/15/19 2 Livestock Open Swine Show 06/16/19 06/16/19 1 Livestock Exploration Days 06/19/19 06/21/19 3 Educational State 4-H Goat Show 06/21/19 06/22/19 2 Livestock MI Arab Assoc Show 06/21/19 06/23/19 3 Horse POA East World Show 06/27/19 06/30/19 4 Horse Apple Blossom Classic 07/05/19 07/07/19 3 Horse MI Livestock Expo 07/10/19 07/14/19 5 Livestock 4-H/FFA Livestock Judging Contest 07/12/19 07/12/19 1 Livestock 4-H Dairy Days & Dairy Expo 07/15/19 07/19/19 5 Livestock Go Show Midwest Horse Show 07/19/19 07/21/19 3 Horse Arabian Horse Show 07/24/19 07/28/19 5 Horse MAPHA Sizzler Horse Show 08/02/19 08/04/19 3 Horse 4-H State Dog Show 08/09/19 08/10/19 2 Small Animals State 4-H Horse Show 08/15/19 08/18/19 4 Horse MAPHA Classic Horse Show 08/21/19 08/25/19 5 Horse DALMAC 08/26/19 08/29/19 4 Educational Llamafest 08/30/19 09/01/19 3 Livestock GL Buckskin Horse Show 08/30/19 09/01/19 3 Horse

Appendix A
11
Event Start End Days Type MI Morgan Breeders Futurity 09/04/19 09/08/19 5 Horse MQHA Futurity 09/10/19 09/15/19 6 Horse B & B Little I 09/17/19 09/22/19 6 NA MSU Polo Match 09/19/19 09/19/19 1 Spectator Apple Blossom Classic 09/20/19 09/22/19 3 Horse MQHA Horse Show 09/26/19 09/29/19 4 Horse Buckskin Congress 10/02/19 10/06/19 5 Horse ASHAM Horse Show 10/09/19 10/12/19 4 Horse MGLI Draft Horse Show 10/14/19 10/20/19 7 Horse Paint Horse Show 10/24/19 10/27/19 4 Horse MHSA Horse Show 10/31/19 11/03/19 4 Horse Autumnfest 11/08/19 11/09/19 2 Trade show/Meet MSU Horseman’s Association Green & White Horse Show 11/10/19 11/10/19 1 Horse Model Train Show 11/10/19 11/10/19 1 Trade show/Meet So. MI Paint & Quarter Horse Sale 11/15/19 11/17/19 3 Horse Michigan Rabbit Breeders State Show 11/22/19 11/24/19 3 Small Animals Cowboy Christmas 11/22/19 11/24/19 3 Horse Specialty Dog Show 11/27/19 11/29/19 3 Small Animals Ingham Kennel Club Dog Show 11/30/19 12/01/19 2 Small Animals Winter Beef Show 12/05/19 12/08/19 4 Livestock ShoMe Holiday ShoDown Horse Show 12/12/19 12/15/19 4 Horse Holiday Harvest Dairy Sale 12/16/19 12/19/19 4 Trade show/Meet

Appendix B
12
Interview Instrument
1 What is the attendance at your event? a Who are the primary attendees? (Sellers, exhibitors, contestants, spectators) b If counting by number of visitors, about how many people attend in a party
2 Do you have a good perception of where attendees travel from to get to your event? a Can you conjecture the share that travel from outside of the Ingham, Eaton, Clinton area?
3 Does participation in your event require or encourage participation over multiple days?
4 Who pays admission to your event (if any)?
5 Where is your organization located?
6 Can you provide a rough estimate of the amount of money your organization spends in the Lansing-East Lansing area while hosting this event? a Goods and services for the event b personal expenditures while attending to the event.

13
Bibliography
Barta, S., N. Anderson, L. Brooks, J. Frye and D. Shideler (2010). The Economic Impact of Visitors to The Payne County Expo Center In 2009. Stillwater, OK, Oklahoma State University Extension. Consulting, M. (2017). Proposed Western Kentucky Ag Expo Center: Market Demand Assessment Summary. Maple Grove, MN, Markin Consulting. Flanders, A., K. Wolfe and J. McKissick (2006). Economic Impact of the Sunbelt Agricultural Exposition. Athens, GA, University of Georgia. Penn State Center for Economic & Community Development (2014). The Economic Impact of the Farm Show Complex & Expo Center, Harrisburg. State College, PA, Penn State University Rephann, T. J. (2011). The Economic Impact of the Horse Industry in Virginia. Charlottesville, VA, University of Virginia: Weldon Cooper Center for Public Service. Rephann, T. J. (2014). Appalachian Agricultural Exposition Center Economic Impact Study. Charlottesville, VA, University of Virginia.
View publication statsView publication stats