The Internship Progressive Report at Mixa Foods and Beverages Kisumu Kenya posted by alex

432 Park Avenue South, 13th Floor, New York, NY, 10016, United States Phone: +1-646-884-7422/7418; Fax: +1-212-548-5720
Website: http://mci.ei.columbia.edu .
MCI SOCIAL SECTOR WORKING PAPER SERIES No 01/2008
EDUCATION NEEDS ASSESSMENT FOR KISUMU CITY, KENYA
Prepared by
Moumié Maoulidi
December 2008

1
This needs assessment was researched and written by Moumié Maoulidi. The field research was conducted by Moumié Maoulidi and Mrs. Pauline Mwangi, United Nations Volunteer and MDG Program Officer, Bungoma District.

2
Map 1. Map of Kenya Showing Kisumu Municipality
Source: Oxford Cartographers

3
ACKNOWLEDGEMENTS
I would like to thank the following people and institutions whose assistance made this project possible. In particular, I wish to thank the Kisumu District Education Office and Municipal Education Office staff for the support given to make our fieldwork successful and for being cooperative as we dealt with the field work challenges. Kisumu Municipal Education Office 1. Mrs. Pamela Akello (Municipal Education Officer) 2. Mr. George Omondi (Deputy Municipal Education Officer) Kisumu District Education Office 3. Mr. Abdilkhadir M. Kike (District Education Officer in 2007) 4. Mrs. Rebecca Butalanyi (District Education Officer in 2008) 5. Mrs. Jane Mata (Area Education Officer and Quality Assurance Officer) 6. Mr. Sampson Kodade (District Statistics Officer, Retired) Kisumu District Statistics Office 7. Mr. Richard Abayo (District Statistics Officer) Kisumu Town Planning Office 8. Mr. Charles Ngira (Kisumu Municipal Town Planning Officer) Ministry of Education Science and Technology (MOE) 9. Mr. Steve Karaba (Director, Ministry of Education – Nairobi) 10. Mrs. Leah Rotisch (Director, Basic Education, Ministry of Education – Nairobi) 11. Mr. Charles Obiero (NFE liaison, Ministry of Education – Nairobi) Teacher Service Commission 12. Mr. C. Ayabei (Assistant Deputy Secretary – Finance) District Adult Education Office 13. Mrs. Caroline Omenda (Kisumu District Adult Literacy Officer) 14. Mr. Otieno Jimmylaus (Deputy District Adult Literacy Officer) MDG Support Team, Bureau for Development Policy, UNDP 15. Ms. Emily Bosch (Research Associate) 16. Ms. Lily Hailu (Research Associate) UNICEF Kenya 17. Ms. Jane Mbagi-Mutua (Project Officer, ECD) Columbia University 18. Dr. Susan M. Blaustein (Co-Director, Millennium Cities Initiative, Earth Institute) 19. Ms. Ashley Hufft (Former Project Manager, MCI Kisumu) 20. Dr. Mary Mendenhall (Teachers College)
21. Ms. Leocadie Welling (Former Administrative Assistant, Millennium Cities Initiative)

4
TABLE OF CONTENTS ACKNOWLEDGEMENTS .......................................................................................................... 3 ABBREVIATIONS ....................................................................................................................... 6 EXECUTIVE SUMMARY ........................................................................................................... 7 I. INTRODUCTION ............................................................................................................... 10
1.1 Background ................................................................................................................... 10 1.2 Objectives ..................................................................................................................... 11 1.3 Goal ............................................................................................................................... 11 1.4 Methodology ................................................................................................................. 11 1.5 Demographics ............................................................................................................... 14 1.6 The Provision of Education in Kisumu ........................................................................ 16 1.7 The Free Primary Education Initiative ......................................................................... 21
II. PERSPECTIVE ON EDUCATION SUB-SECTORS ........................................................ 23 2.1 Pre-Primary Education (Early Childhood Development) ............................................. 23 2.2 Primary Education ........................................................................................................ 27 2.3 Secondary Education .................................................................................................... 32 2.4 Tertiary Education ........................................................................................................ 36 2.5 Non-Formal Education (NFE) ...................................................................................... 39 2.6 Adult Literacy ............................................................................................................... 43 2.7 HIV/AIDS and its Impact on the Education Sector in Kisumu .................................... 44 2.8 Gender Perspectives ...................................................................................................... 46
III. FINANCING EDUCATION IN KISUMU ...................................................................... 48 3.1 Financial Resources for Primary and Secondary Education ......................................... 48 3.2 Unit Costs ..................................................................................................................... 50 3.3 The Model ..................................................................................................................... 52
IV. CONCLUSION AND RECOMMENDATIONS ............................................................. 56 REFERENCES ............................................................................................................................ 59
Annex 1: List of Key Informants ............................................................................................ 63 Annex 2: Research Team ........................................................................................................ 63 Annex 3: Targets and Interventions ....................................................................................... 64 Annex 4: Estimated Costs for Classroom and Toilet Construction ......................................... 65 Annex 5: Per Student Unit Costs for Infrastructure ................................................................ 67 Annex 6: Kisumu Municipality- Non-Formal Schools and Education Centers ...................... 68 Annex 7: NGOs and CBOs Assisting Orphans and Vulnerable Children in Kisumu ............. 69 Annex 8: Donors/International Agencies and Educational Activities ..................................... 70
LIST OF TABLES
Table 1. 2006 Kisumu Population Projections by Age Cohorts and Gender .............................. 15 Table 2. Number of Different Types of Education Institutions (2006) ...................................... 17 Table 3. Number of Schools sponsored by Different ECD Stakeholders in Kisumu (2006) ...... 24 Table 4. Primary School Infrastructure Needs as at October 2006 ............................................. 30 Table 5. Instructional Materials Provided by FPE ...................................................................... 31 Table 6. Secondary Schools Bursary Awards and Scholarships, 2005/2006 .............................. 35 Table 7. Non-Formal Schools Infrastructure Needs as of October 2006 .................................... 40 Table 8. Kisumu Non-Formal Schools that received FPE Funds in 2006 .................................. 41 Table 9. Sources and Types of Support to NFE Schools and Centers in Kisumu....................... 41 Table 10. Distinguishing Features of Formal & Non-Formal Education Systems ..................... 42 Table 11. Free Primary Education Expenses (2006) ................................................................... 51

5
Table 12. Classroom, Teachers and Investment Requirements 2010-2015 ................................ 54 Table 13. Efficiency Indicators ................................................................................................... 54
LIST OF FIGURES
Figure 1: Trends in Pre-Primary Enrollments (2000-2006) ........................................................ 24 Figure 2: Number of Pre-Primary Institutions (2000-2006) ....................................................... 26 Figure 3: Trends in Primary School Enrollments (2000-2006) ................................................... 28 Figure 4: Number of Primary Schools (2000-2006) ................................................................... 28 Figure 5: Ages of Public Primary Schools .................................................................................. 29 Figure 6: Trends in Secondary School Enrollments (2000-2006) ............................................... 33 Figure 7: Number of Secondary Schools (2000-2006) ............................................................... 34 Figure 8: Enrollment Trends at Tertiary Institutions, by Gender (2001 – 2006) ........................ 37 Figure 9: Trends in Enrollments in Adult Literacy Classes, by Gender (2003-2006) ................ 44 Figure 10: Recurrent Costs, All Levels Except Tertiary ............................................................. 55
LIST OF MAPS
Map 1. Map of Kenya Showing Kisumu Municipality ................................................................ 2 Map 2. Kisumu Municipality (Main Areas and Sub-locations) ................................................... 9 Map 3. Poverty in Kisumu Municipality .................................................................................... 13 Map 4. Map of Informal Settlements in Kisumu Municipality .................................................. 14 Map 5: Population Density in Kisumu Municipality .................................................................. 18 Map 6: Kisumu ECD/Pre-Primary Schools, by Type ................................................................. 19 Map 7: Kisumu Primary Schools, by Type ................................................................................. 20 Map 8: Kisumu Secondary Schools, by Type ............................................................................. 21

6
ABBREVIATIONS ANPPCAN African Network for the Prevention and Protection against Child Abuse
and Neglect BOG Board of Governors CBS Central Bureau of Statistics CBO Community-Based Organization CDF Constituency Development Fund DEO District Education Office ECCE Early Childhood Care and Education ECEC Early Childhood Education Centers ECD Early Childhood Development EMIS Education Management Information Systems FPE Free Primary Education GIS Geographic Information System GDP Gross Domestic Product GER Gross Enrollment Rate KDDAE Kisumu District Department of Adult Education KDSP Kisumu District Strategic Plan KESSP Kenya Education Sector Support Program KMC/KCC Kisumu Municipal Council/Kisumu City Council MEO Municipal Education Office MOE Ministry of Education MOEST Ministry of Education Science and Technology NFE Non-Formal Education NFSs Non-Formal Schools NFEC Non-Formal Education Centers NGO Non-government Organization PTA Parent Teacher Association PTR Pupil-to-Textbook Ratio SEBF Secondary School Education Bursary Fund TIVET Technical, Industrial Vocational and Entrepreneurship Training TSC Teacher Service Commission UNDP United Nations Development Program UNESCO United Nations Educational, Scientific and Cultural Organization UN-HABITAT United Nations Centre for Human Settlements UNICEF United Nations Children's Fund

7
EXECUTIVE SUMMARY In January 2006, Kisumu was officially designated the world’s first Millennium City thereby launching a set of activities aimed at identifying existing assets and challenges in achieving the Millennium Development Goals (MDGs). The main objective of these activities is to generate a comprehensive urban development strategy and substantially improve the standard of living of city residents.
The current needs assessment report takes stock of recent achievements in the education sector and highlights remaining challenges that need to be addressed in order for Kisumu to achieve the MDGs by the target date of 2015, which means ensuring that all children have access to primary education and reducing gender disparities at every level. It presents the work of a Columbia University Teachers College doctoral candidate and a Kenyan United Nations Volunteer who traveled to the city in July/August 2007 to assess challenges facing the education sector. The mission was vital in gathering the ground information used in the drafting of this report and provided opportunities to conduct key informant interviews.
Data and information gathered during the mission indicate that the demand for education in Kisumu has surged since the introduction of free primary education (FPE) in 2003 and that there has been progress towards greater parity between boys and girls at the primary school level. The abolition of school fees has been critical in efforts to achieve universal primary education and gender parity. However, this needs assessment finds that the city still faces several challenges that threaten to undermine the attainment of the MDGs in education. For instance, there are not enough classrooms or latrines for the increasing number of students; repetition and drop-out rates are high; and student-teacher ratios need to be reduced. In-service training programs also need to be actively implemented so that teachers are equipped with effective teaching methodologies. Moreover, socio-economic factors such as the HIV/AIDS pandemic, poverty and a cultural bias against educating girls are having a negative impact on academic progress and school completion rates.
Many existing primary schools are in poor physical condition. There are schools that require renovation, better water and sanitation facilities and electricity. New schools should also be built in informal settlements (slums). The Kenyan Ministry of Education, Science and Technology (MOEST), with financial support from the World Bank and the United Kingdom’s Department for International Development (DFID), has developed a New Classrooms Construction and School Improvement Grants Program, providing KShs. 100,0001
[$1,250] per year to schools in the poorest districts. Such programs are vital for improvements in access to primary education because school construction boosts enrollment (Rugh, 2000).
Another key challenge facing primary schooling in Kisumu Municipality is that, while an increasing number of students are enrolling in primary schools, many girls do not complete the primary school cycle, suggesting that addressing gender-specific needs is critical to achieving gender parity (MDG 2). Initiatives that make schools more “girl friendly,” such as improving sanitation facilities, providing sanitary products and guaranteeing school meals, need to be actively supported. Such measures not only enhance girls’ participation and retention, they are critical for achieving and sustaining gender parity (World Bank, 2001). 1 1 USD = 80 Kenyan Shillings (KShs) in August 2007. Source: http://www. exchangerate.com.

8
In order for Kisumu to meet the MDGs in education, the central government needs to continue providing Free Primary Education (FPE) funding for instructional materials and operating costs. National and local authorities must also address issues of quality by training teachers and must enhance equity by targeting vulnerable groups such as girls and poor children. Sub-sectors such as pre-primary, secondary and non-formal education also need to be strengthened: the education MDGs cannot be attained by focusing solely on primary schooling. This report is divided into two sections. The first section identifies priority problems and issues that may interfere with the attainment of the MDGs. It introduces the general problems facing the provision of education to the school-age population in Kisumu and analyzes specific issues that need to be addressed in different sub-sectors in order to increase enrollments and reduce gender disparities. The second section focuses on capacities and identifies available financial resources as well as unit costs. It also presents findings using a spreadsheet-based simulation model that first projects population and then makes projections of budgetary needs based on enrollment rates, teacher requirements and infrastructure needs.

9
Map 2. Kisumu Municipality (Main Areas and Sub-locations)
• Total Area 417 sq. km
• Dry Land 297 sq. km
• Under Water 120 sq. km
• Population (2006) 392,616 (Projected)
• Male to Female Ratio
1 : 1
• Annual Pop. Growth Rate:
2.8%
• Poverty Rate 53-63%
• HIV Prevalence Rate (2006)
15-18.4%

10
I. INTRODUCTION 1.1 Background Kisumu is the third largest city in Kenya, with an estimated 2006 population of 392,616. The city is located in Western Kenya on the shores of Lake Victoria and covers a total area of 417 sq. km, of which 297 km is land and 120 sq. km is water mass. The city was founded in 1901 and currently serves as the capital of Nyanza Province and Kisumu District.2 Present-day Kisumu consists of 25 sub-locations that can be grouped into 10 main locations.3
It is a regional transportation and trade hub that is undergoing an economic resurgence. It is anticipated that improvements in rail, air and ferry services, along with foreign direct investments in agriculture, agro-processing and aquaculture, will transform the city into the leading commercial, industrial and administrative center in the Lake Victoria Basin.
Kisumu faces several challenges as it endeavors to achieve the MDGs in education. It is a city with high poverty levels, high HIV/AIDS prevalence rates and a rapidly growing urban population. It is estimated that in 2006, about half of the city inhabitants were poor, 15 percent were HIV-positive and over 60 percent lived in peri-urban informal settlements (UN-HABITAT, 2006). In addition to HIV/AIDS, malaria, cholera, typhoid and diarrhea are also major health threats. Other challenges the city faces include housing shortages, lack of adequate water and sanitation facilities and high levels of unemployment. Many residents derive their livelihoods from subsistence fishing, agriculture or the informal sector, known as Jua Kali4
, and earn between KShs. 3,000 and 4,000 [$37.50-50] per month (UN HABITAT, 2006).
With adequate support, the education MDGs can be met in Kisumu by 2015. Trends indicate that since 2003, the abolition of primary school fees have led to improvements in enrollment rates and increases in the ratio of girls to boys in primary and secondary schools. However, free primary education by itself will not result in the attainment of the MDGs in education. Additional classrooms and other facilities have to be built, new teachers must be recruited, existing teachers need to be trained and strategies to mitigate the effects of poverty and HIV/AIDS on the education sector, such as school feeding programs, should be implemented. As stated above, the first section of this report summarizes the structure of the education system in Kisumu and identifies the needs and priorities in different sub-sectors. It focuses on the following interventions to help achieve universal primary education and gender equality: the provision of learning materials, including textbooks and writing materials; ensuring that there are adequate numbers of teaching and support staff; infrastructure improvement, including construction/rehabilitation of classrooms, toilets (especially toilets for girls) and other facilities such as libraries, and school feeding programs. The second section is concerned with schooling expenditures, total costs and unit costs. Financial resources needed for the education system in Kisumu are estimated on the basis of a simulation model (EPSSIM) that uses projected
2 Administratively, Kenya is divided into eight provinces which are further subdivided into 71 districts. Kisumu District is one of 12 Districts in Nyanza Province. 3 A map of Kisumu showing the main locations can be found on page 13. See page 8 for a map showing sub-locations. 4 “Jua Kali” literally means “hot sun” in Kiswahili, indicating that workers in this sector work outdoors.

11
population and enrollment data as well as information on staffing levels, infrastructure and instructional materials. The major physical facilities considered in the analysis are classrooms, student toilets, libraries, laboratories, workshops and resource centers. In cases where data on infrastructure were not available, estimates were used. These estimates were derived by using infrastructure data from sample schools and by extrapolation. Teacher-related indicators considered in this study include numbers of teaching and non-teaching staff5
, student-to-teacher ratios and the teaching workload of secondary school teachers. The study also takes into account whether a teacher recently received training. The underlying assumption here is that teacher training is instrumental to quality education.
1.2 Objectives • To assess challenges facing Kisumu Municipality in its efforts to achieve universal
primary education and eliminate gender disparities in education by 2015.
1.3 Goal • To identify interventions that can improve access to primary education and reduce
gender disparities. 1.4 Methodology This needs assessment of the education sector in Kisumu Municipality utilizes quantitative data and qualitative information collected during a field mission in July/August 2007. The mission, sponsored by the Millennium Cities Initiative of The Earth Institute at Columbia University, was vital in obtaining 2006 raw data on enrollments and schools. The main sources of quantitative data are Education Management Information Systems (EMIS) forms, Teacher Service Commission (TSC) forms, and Monthly School Statistics Returns. Key informant interviews provided background information. EMIS school data returns are an ideal data source for education needs assessment exercises because they contain most of the required data. They include information on student enrollments, staffing profiles, classroom profiles (number of streams, whether the classroom is open air or non-open air, number of desks, chalkboards, etc) and data on orphans and students with disabilities. In 2006, the Kenyan EMIS forms were redesigned and upgraded to include additional information, namely detailed data on teaching and learning materials, school facilities and school finances.6
5 For support staff I estimate the number of staff required.
All public and private schools in Kenya are required by law to complete and submit the EMIS school data returns. However, in 2006 the Kisumu Municipal
6 This included total number of textbooks purchased, information on school facilities (whether a school had a library, laboratory, computer labs, a kitchen, pit latrines or flash toilets for boys and girls), data on school finances (total amounts of grants received) and expenditure details (expenses on textbooks, classroom construction, water and sanitation facilities, electricity) as well as information on school fees, parental contributions, and exam performance

12
Education Office (MEO) did not distribute EMIS forms to pre-primary and primary schools within the municipality.7
For primary school data, the Kisumu MEO provided the researcher with summarized enrollment and teacher establishment data in lieu of EMIS forms, but the enrollment data were not disaggregated by gender or grade. As a result, alternative sources with disaggregated data on enrollments, such as Teacher Service Commission (TSC) forms and Monthly School returns, were consulted. This assessment relies on Third Term TSC forms for public primary school enrollments, numbers of classes and information on teachers. Data on enrollments and teachers at private primary schools was provided by the MEO and was supplemented with primary data collected from select primary schools. For pre-primary schooling, the study relies on Monthly School Statistics Returns, which provide data on enrollments, teachers, as well as information on whether a school provided school feeding. EMIS forms for the third term in 2006 provided data on secondary schools. A questionnaire prepared by the researcher was used to collect data on student enrollment, teachers and infrastructure at tertiary institutions.
Data on teacher salaries were solicited from the TSC, while the Ministry of Education was consulted for missing information on pre-primary and non-formal education institutions. However, neither the MEO nor the Ministry of Education could provide data on non-teaching staff, as auxiliary staff are paid by schools or Board of Governors. To address such data gaps, the study relies on the review of secondary sources. Important and often overlooked sources for proximate information that were consulted include administrative data, Central Bureau of Statistics (CBS) publications, government official records and reports by UN agencies.
Written records were obtained from computers and file rooms at the Kisumu MEO and DEO, to cross-check information given by informants. The data were also compared with the TSC data to ensure accuracy and consistency. Some of the records provided valuable information on instructional materials and infrastructure needs. Others, such as DEO Education Briefs and School Inspection Reports, provided insightful information on the status of schools. Semi-structured interviews were conducted with key officials at the Municipal Education Office, the District Education Office, the Provincial Education Office, the District Statistics Office and the District Development Office. Through the use of this technique, we obtained insights on education and challenges facing schools. The study also benefited from visits to various primary and secondary schools in Kisumu Municipality. These visits provided an opportunity to observe physical facilities and witness some of the conditions described in School Inspection Reports. Data analysis was done using the EPSSIM tool developed by UNESCO. This Excel-based tool projects primary and secondary enrollments, teacher requirements and other resource requirements using the data collected during the field mission.
7 The reason given is that the Ministry of Education did not send the forms to the MEO. The Kisumu District Education Office (DEO), on the other hand, did manage to distribute EMIS forms to all public and private secondary schools within the municipality, even though some private schools either did not complete the forms or completed them but failed to return them to the DEO.

13
Map 3. Poverty in Kisumu Municipality
Poverty is pervasive in Kisumu Municipality as well as in other parts of Kisumu District and Nyanza Province. The proportion of city residents living under the poverty line is estimated to range between 53 and 63 percent, but these rates are usually based on district-level data and mask sub-location variations (GOK, 2005b). Map 3 presents the proportion of Kisumu residents living below the urban poverty line of KShs. 2,648 [$33] per adult per month in the different sub-locations (CBS, 2003).
The extremely high poverty rates in areas such as East Kisumu, South West Kisumu, and East and West Kolwa threaten to undermine efforts to address international commitments such as achieving the MDGs by 2015. Although FPE has contributed to increased numbers of children joining primary schools across Kisumu, escalating poverty has contributed to high drop-out and low completion rates (Kosgei, 2006). Moreover, a number of major informal settlements (slums) are located in East Kisumu and Kolwa West, where there are relatively few public primary schools. As a result, some children living in these slum areas are still not benefiting from free primary education (FPE).

14
Map 4. Map of Informal Settlements in Kisumu Municipality
Source: Moumié Maoulidi, MCI, The Earth Institute, Columbia University
Kisumu Municipality hosts some of the largest informal settlements in Kenya- outside of Nairobi and Mombasa. Its position as a regional economic center is luring numerous job seekers from rural areas within 100 km radius to informal settlements such as Bandani (aka Kogony), Kaloleni, Obunga (aka Kanyakwar), Manyatta, Nyalenda and Nyamasaria. The defining characteristics of these areas include high population density, high poverty levels and inadequate access to housing, health services and water and sanitation facilities. Residents of informal settlements also lack adequate access to basic education services, mainly because there are few public schools relative to the number of school-age children. For instance, in 2006, the population densities of Bandani and Obunga (located in East Kisumu) each exceeded 1,000 people per sq. km. The main primary school serving both sub-locations, Kudho Primary, subsequently enrolled more than 1,000 students and experienced classroom and staff shortages. 1.5 Demographics According to the 1999 Kenya Population and Housing Census, Kisumu Municipality had a population of 322,734 at the time the census was conducted. This figure represented about 64 percent of the district population of 504,539. Central Bureau of Statistics data and projections by the Kisumu District Education Office show that, assuming a population growth rate of 2.8 percent, in 2006 the Kisumu district and municipal populations stood as follows.

15
Table 1. 2006 Kisumu Population Projections by Age Cohorts and Gender Whole Kisumu District
(2006) Projected Municipal Population
(2006) Male Female Total Male Female Total
0-4 52,731
63,176 115,907
30,294 30,500 60,794
5-9 34,337
39,572 73,909 25,535 25,394 50,,928
10-14 18,690 19,625 38,315 27,095 27,650 54,745
15-19 16,773
17,960 34,733 23,880 25,703 49,583
20-24 24,782
30,518 55,300 19,924 21,970 41,894
25-29 24,980
29,661 54,641 15,043 15,198 30,241
30-34 23,393
24,268 47,661 11,605 11,596 23,201
35-39 20,410
19,472 39,882 9,531 10,045 19,576
40-44 16,359
13,559 29,918 7,584 7450 15,034
45-49 12,527
9,629 22,156 6,122 5838 11,961
50-54 7,785
5,787 13,572 5,116 4335 9451
55-59 5,568
4,097 9,665 3,022 3200 6222
60-64 4,526
3,595 8,121 2,511 2971 5482
65-69 3,289
2,796 6,085 1,920 2485 4405
70-74 2,126
2,034 4,160 1,443 1814 3257
75-79 1,375
1,374 2,749 904 1022 1926
80+ 1,936
2,315 4,251 2,097 1819 3916
Total 271,587 289,438 561,025 193,627 198,989 392,616 Note: Municipal projected population assumes a population growth rate of 2.8% (Source: CBS, 1999 Census Analytical Report , Vol. 1 and IV).

16
Kisumu’s 2006 projected population of 392,616 was predominantly youthful, with more than half (66 percent) of the population aged below 25 years.8
21.7 percent of the population consisted of primary school-age children (6-13), and about 14 percent were secondary school-age youth (14-18). This young population has put pressure on the available educational facilities. The economically active population (15-49) stood at 191,489 and represented about 49 percent of the population. The life expectancy rate was 43.2 years for women and 37.8 for men.
1.6 The Provision of Education in Kisumu In Kenya, the Ministry of Education (MOE) is responsible for the provision of administrative and professional services in education at the national, provincial and district levels. However, the MOE delegates the management of primary schools and Early Childhood Education Centers (ECEC) in Kisumu to the Municipal Council of Kisumu. As a result, the Municipal Education Office (MEO) is in charge of all ECEC and primary schools in the city. The District Education Office (DEO) is responsible for all secondary schools in the municipality and the district, as well as all Early Childhood Development (ECD) programs and primary schools lying within the district but outside the municipality. The MEO and DEO are housed in different locations and operate independently from each other. The formal education system in Kisumu, as in the whole country, is commonly referred to as the 8-4-4 system (eight years of primary education, four years of secondary education and four years at a university). This system was introduced in Kenya in 1985 to meet the increasing demands of the economy for technically and professionally qualified personnel. The 8-4-4 system is the only system available at public schools. A few wealthy parents prefer the GCE system of education (which has six years of secondary schooling), because of its international standing, especially for students who may want to go abroad for higher education. Kisumu has several types of educational institutions, including pre-primary institutions, primary and secondary schools, non-formal education schools/centers (NFEs), technical institutions serving students who fail to qualify for secondary schools and tertiary institutions. Pre-primary education lasts for three years and prepares children for primary schooling. The primary education cycle has eight grades, commonly called ‘Standards.’ Secondary education lasts for four years, and grades are referred to as ‘Forms.’ The duration of tertiary education is two to fours years, depending on whether a student enrolls in a Technical, Industrial Vocational and Entrepreneurship Training (TIVET) institution or a university, and whether a student pursues a certificate, a diploma or a bachelor’s degree. In 2006, there were 159 primary schools and 36 secondary schools in Kisumu municipality. The city also had 404 ECD schools, 21 officially recognized non-formal education schools/centers and several institutions of higher learning, including: Kisumu Polytechnic, Ramogi Institute of Advanced Technology (RIAT), Tom Mboya Labor College and Maseno University. Table 2 shows the different types of education institutions in Kisumu in 2006.
8 The projected population of 392,616 is higher than the 345,312 estimate in (UN-HABITAT, 2006).

17
Table 2. Number of Different Types of Education Institutions (2006)
Pre-
Primary (Public)
Pre-Primary (Private)
Primary Std 1-8 (Public)
Primary Std 1-8
(Private)
Secondary Form 1-4 (Public)
Secondary Form 1-4 (Private)
Non Formal
Tertiary (Public/ Private)
210 194 114 45 28 8 21 10+
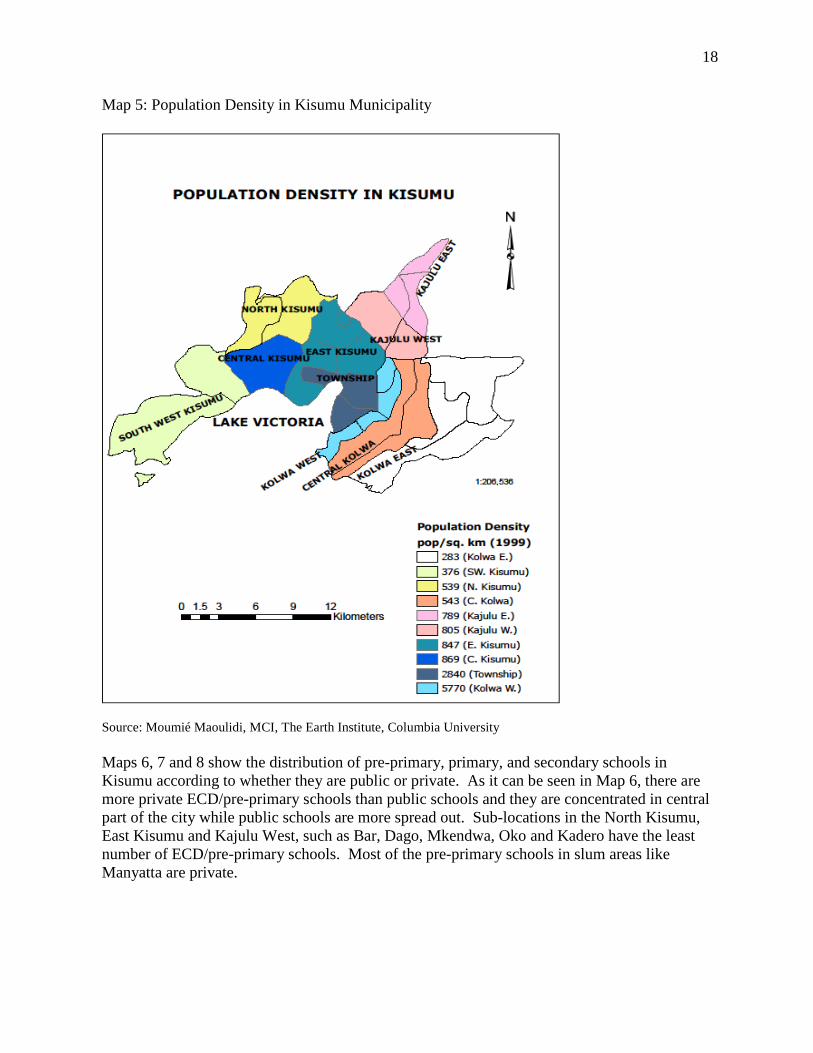
Total 404 159 36 21 10+ Source: Author’s calculation based on MEO data and consultations with MOE officers. Prior to 2000, schools in Kisumu Municipality- and other areas of the country- faced several major problems, including: low enrollments in primary schools due to high cost of education, and high repetition and drop-out rates. In 2003, when the new government of President Mwai Kibaki assumed power, the government introduced measures aimed at improving educational access, equity and quality at the primary and secondary school levels. The first step was to implement the Free Primary Education (FPE) scheme, which abolished school fees at the primary level. The next step was rehabilitating existing infrastructure and building new classrooms to ensure that there were enough physical facilities to meet increasing primary school enrollments as a result of FPE. The third step consisted of improving the provision of instructional and learning materials. In addition to efforts to enhance access, the Government also committed itself to improving quality and equity. Strategies to improve teacher quality include teacher training while strategies to improve equity include targeting students from poor households and increasing enrollments in informal settlements. Map 5 presents the population densities in the 10 main areas that make up Kisumu Municipality. It reveals that areas with high population density (>805 people per square kilometer) include Central Kisumu, Township and Kolwa West.9
9 Based on 1999 census data.
The population density in areas such as East Kisumu, Kajulu East and Kajulu West was between 789 and 805 people per square kilometer. Areas with relatively low population densities (<550 people per square kilometer) include Central Kolwa, Kolwa East, and North and South West Kisumu.
18
Map 5: Population Density in Kisumu Municipality
Source: Moumié Maoulidi, MCI, The Earth Institute, Columbia University Maps 6, 7 and 8 show the distribution of pre-primary, primary, and secondary schools in Kisumu according to whether they are public or private. As it can be seen in Map 6, there are more private ECD/pre-primary schools than public schools and they are concentrated in central part of the city while public schools are more spread out. Sub-locations in the North Kisumu, East Kisumu and Kajulu West, such as Bar, Dago, Mkendwa, Oko and Kadero have the least number of ECD/pre-primary schools. Most of the pre-primary schools in slum areas like Manyatta are private.

19
Map 6: Kisumu ECD/Pre-Primary Schools, by Type
Map 7 shows that there are many more public than private primary schools in Kisumu Municipality. Moreover, private primary schools are concentrated in the central part of the city whereas public primary schools are more evenly distributed. Sub-locations such as Dago in East Kisumu, Kasule in Central Kolwa and Got Nyabondo in Kajulu East have the fewest primary schools.

20
Map 7: Kisumu Primary Schools, by Type
Map 8 focuses on secondary schools and shows that, compared to ECD/Pre-primary and primary schools, there are relatively few secondary schools in Kisumu. However, the distribution pattern is the same, with private schools concentrated in the central part of town and public schools more evenly distributed.

21
Map 8: Kisumu Secondary Schools, by Type
1.7 The Free Primary Education Initiative Since 2003, the government education policy has focused on providing free primary education. In Kisumu Municipality, the FPE scheme has led to marked growth in primary school student enrollments, from 44,179 in 2002 to over 70,278 in 2006. Like many other schools in Kenya, Kisumu municipality schools were initially unprepared for the rapid increase in enrollments. In a city where there was already a shortfall in teaching staff, the introduction of FPE worsened student/teacher ratios. Average class sizes rose to over 50 per class, while the number of teaching staff remained the same. The high enrollments also resulted in a shortage of textbooks and stationery and overstretched facilities such as toilets. In many cases one toilet was shared by more than 70 students and in some schools boys and girls used the same facility.

22
The launch of the FPE initiative in 2003 was not the first time Kenya has attempted to introduce free primary education. After achieving independence in 1963, the government committed itself to providing free primary education as a long-term objective. The Universal Primary Education policy adopted by the government produced dramatic increases in the enrollments at primary level in the 1970s and early 1980s. However, economic growth faltered in the late 1970s, and, during the 1980-85 period, Kenya’s deteriorating economic performance was exacerbated by factors such as world economic recession and natural disasters. By 1985, Kenya implemented structural adjustment programs (SAPs) as a pre-condition for getting loans and/or grants from IMF-World Bank and other donors to tackle economic issues the country was facing. The adoption of SAPs and the persistent macroeconomic crises of the 1980s made it extremely difficult for the government to sustain its ambitious FPE policy, and in 1988, the government introduced a cost-sharing policy in education. Under this policy, the government was responsible for paying teachers’ and administrators’ salaries, while parents were responsible for tuition, textbooks and examinations fees. However, the introduction of cost-sharing created a heavy burden on many poor households. Unable to meet the direct costs of education, many poor households withdrew their children from school, which eventually resulted in the erosion of gains in enrollment that were made in the 1970s. Enrollments continued to decline in the 1990s and only picked up again following the new drive to achieve EFA and MDG goals by 2015. Kenya’s (re)introduction of free primary education in 2003 was, therefore, largely spurred by the international movement to achieve the EFA/MDG target of universal access to primary education by 2015. The latest FPE initiative has produced dramatic increases in enrollments, but has also resulted in a number of unintended consequences and challenges. For instance, some of the newly enrolled students were overage children who had never previously attended school (UNESCO, 2005). This fact, along with large class sizes, has at times made it difficult for teachers to maintain discipline and order in classrooms. An additional unforeseen consequence is that FPE has been misinterpreted by some parents to mean that they should not contribute to their children’s education in any way. As a result, whereas before the introduction of FPE, the financing of education was shared by the government, parents and communities, in the post-FPE era, many parents have adopted the belief that it is the government’s exclusive responsibility to provide all the necessary resources for primary education (Education Sector Report, 2006). Another factor that has affected the achievement of universal primary education is that even though school fees were abolished under FPE, primary education is still not compulsory, i.e., parents/caretakers are not required by law to send their children to school. Given that fees are not the only component of schooling costs—parents still must cover other direct costs, such as uniforms, supplementary tutoring and transportation—many poor parents have been unable to meet these costs and have opted to not enroll their children. The civil unrest following the disputed December 2008 elections has also disrupted learning activities and impeded progress towards meeting the MDGs in education. Although the post-election unrest was not confined to one locality in Kenya, Kisumu Municipality was the center of much of the violence. According to a Kisumu City Council situation analysis, numerous individuals “were injured or died in the skirmishes, while property worth millions of shillings

23
was gutted out by fire.”10
Many schools were closed, numerous families were displaced, hundreds of individuals lost their lives and countless children and teachers were traumatized by the violence. Some of the displaced people took refuge in police stations, churches and offices of humanitarian organizations as well as schools. As a result, when the violence subsided and schools eventually re-opened in February 2008, education authorities in Kisumu were faced with additional challenges, namely, rehabilitating schools affected by the violence, meeting unanticipated additional costs resulting from the unrest, and providing psycho-social counseling to students and educators.
Kisumu is making progress towards Millennium Development Goal Two (MDG 2) which seeks to ensure that all children will be able to complete a full course of primary schooling by 2015, and Millennium Development Goal Three (MDG3), which aims to eliminate gender disparity at all school levels by 2015. While Goal Two refers specifically to achieving universal primary education, the MOE and education officials in Kisumu recognize that this goal cannot be achieved unless measures to expand secondary, as well as pre-primary, tertiary and non-formal education are also undertaken. Moreover, promoting access to and completion of primary schooling is of utmost importance because it ensures sustainable literacy (i.e., literacy that lasts a lifetime). The following section presents the needs and priorities in different education sub-sectors in Kisumu. II. PERSPECTIVE ON EDUCATION SUB-SECTORS 2.1 Pre-Primary Education (Early Childhood Development) Pre-primary education is important for the achievement of the MDGs in education. Studies such as those by Riechi, Mbiti and Kisilu (2006) have shown that pre-school education has a decisive effect on how well a child learns throughout his/her life. Early Childhood Education11
is not compulsory in Kisumu/Kenya, nor is it part of basic education. The mission of pre-primary education institutions is to prepare children to enter the primary education system.
The pre-primary cycle lasts for three years and has three grades: Baby, Nursery, and Pre-Unit. The official entry age to these institutions is three years old, and children are expected to leave this cycle before they are six years old, but there are several two-year-olds as well as children over six attending pre-primary schools. Most children under three years old are cared for at home. Before 1980, pre-primary education was exclusively the responsibility of local communities, individual investors and non-governmental organizations such as churches and voluntary organizations. The government assumed responsibility for pre-school education in 1980. Currently, management of ECD programs is decentralized: at district level, there are District Centers for Early Childhood Education (DICECE), and at the municipal level there are Municipal Centers for Early Childhood Education (MUCECE). The DICESE and MUCECE
10 Minutes from stakeholders’ meeting at Aga Khan Hall, March 19, 2008. 11 In Kisumu/Kenya, ECCE institutions are known by a wide range of terms, including day care centers, nursery schools, kindergarten and pre-schools. In this report, pre-primary schools will be used to refer to all institutions catering to children below six years.

24
are responsible for implementing the ECD program, training pre-school teachers, inspecting schools and carrying out parental and community awareness programs. To enhance adequate provision of pre-primary services, the Ministry of Education encourages partnerships with a broad spectrum of stakeholders, including parents, local communities, religious organizations and NGOs, as well as bilateral and multilateral partners. The cost of teacher salaries, however, continues to be mostly met by local communities and non-governmental agencies. Table 3 shows the number of pre-primary schools sponsored by different stakeholders in 2006.
Table 3. Number of Schools sponsored by Different ECD Stakeholders in Kisumu (2006) PTA
(Public) Religious Groups
Private Local Authority
Other
Number of Schools 119 82 194 4 5 Source: Kisumu MEO As can be seen in Table 3, most of the schools are either private or sponsored by PTAs. PTA sponsored schools rely on the harambee12
system, where parents and local communities provide funds for the construction and maintenance of physical facilities, purchase furniture and other materials and defray the costs of feeding programs.
Enrollment in pre-primary schools/centers has increased from 13,499 in 2000 to 25,398 in 2006. Figure 1 shows trends in pre-primary enrollments since the adoption of the MDGs. As can be seen, there is low gender disparity at this level. However, enrollment in public institutions has been increasing rapidly since 2003, while enrollment in private institutions has been fluctuating. Parents’ ability to pay teacher salaries have contributed to this fluctuation: parents withdraw children when they are unable to pay and re-enroll them when they can pay.
Figure 1: Trends in Pre-Primary Enrollments (2000-2006)
Pre-Primary Enrollment, by Gender and Type of
School (2000-2006)
0
2,000
4,000
6,000
8,000
2000 2001 2002 2003 2004 2005 2006
Year
Enro
llmen
t
Public Male Public FemalePrivate Male Private Female
Source: Kenya Ministry of Education.
12 “Harambee” can be roughly translated to mean, “coming together for self-help.”

25
On average, the child-per-teacher ratio was 20 to 1, but in some educational zones, such as Central and Rweya, the child/ teacher ratio was very high (between 28 and 50 children per teacher). A key challenge faced by pre-primary institutions in Kisumu in 2006 was the relative shortage of trained teachers. More than a third of Kisumu pre-school teachers lacked the requisite training and qualifications in 2006, and many non-teaching staff had not completed any formal training in childcare. In January 2006, the government launched the National Early Childhood Education Development Service Standard Guidelines, which stipulate that untrained teachers could only work as teaching assistants, while non-teaching staff must undergo training courses as a condition for employment. These guidelines were a step forward, but it is unclear whether they were operational by the end of 2006. Funding for in-service training of pre-primary teachers and non-teaching staff was also needed. Another problem is that low and irregular pay have made the pre-school teaching profession unattractive, particularly in community-owned pre-primary institutions, where remuneration tends to be low and salaries fluctuate each month depending on the level of contribution from parents. On average, teachers at community-owned pre-primary schools earned KShs. 2,000-3,000 [$25-37] per month, while teachers at Local Authority-supported pre-schools earned KShs 7,000-10,000 [$87-125] per month (UNESCO & MOE, 2005). These conditions have forced many qualified ECD teachers to leave their jobs for more lucrative employment opportunities or for private schools in or out of the town. To avert further attrition, qualified pre-primary teachers deserve a minimum salary guarantee from the government which could be supplemented by parental contribution. The government plans to start paying all pre-primary teachers in 2010, when it is expected that early childhood will be integrated into the basic education program. Until then, the Ministry of Education has been providing community support grants to a limited number of community-managed centers. In 2006 the government provided community support grants totaling KShs. 300 million [$3.75 million] to 4,000 ECCE centers around the country. Kisumu municipality received KShs. 2,270,373 (one percent of the total funding), and the funds benefited 1,533 students at 21 institutions. Each school was granted KShs. 1,481 [$18.51] per child, and the funds were used to pay for some teachers’ salaries, infrastructure improvements and the purchase of some learning materials. ECD management committees decided how much was allocated to salaries, infrastructure and learning materials. There were 404 officially recognized pre-primary schools in Kisumu Municipality in 2006. Many of these pre-primary schools were attached to primary schools, but there were also community-owned schools. The number of institutions was fairly constant between 2000 and 2004, but, as Figure 2 shows, the number of public pre-primary institutions has been increasing.

26
Figure 2: Number of Pre-Primary Institutions (2000-2006)
Source: Ministry of Education. In informal settlements (slums), poverty has hindered the establishment of pre-primary schools and limited enrollments. There are schools sponsored by parents and local communities, but many have semi-permanent buildings (i.e., mud floors, walls of wood and roofs of iron sheeting) and lack furniture and play materials. The typical ECCE facility in informal settlements is a single room, as shown in the picture below, shielding children from the weather.
A nursery school in Kisumu slums. Photo: © UN-HABITAT. School inspection reports compiled by the MEO in 2006 indicate the need to improve physical facilities at numerous pre-primary institutions. Priority infrastructure needs include more permanent classrooms, toilets and fencing. Another challenge is that a significant number of pre-primary schools in Kisumu do not have feeding programs. Monthly statistical returns provided by schools show that in May/June 2006, only 44.3 percent of the 404 pre-primary schools had school feeding programs, while 47.8 percent did not, and 7.9 percent did not provide data. Institutions with feeding programs
Number of ECD Centers by Type, 2000-2006
0
200
400
600
Year
Num
ber o
f Sch
ools/
Cent
ers
Public Private Total
Public 130 131 119 118 119 169 210
Private 210 212 173 191 185 172 194
Total 340 343 292 309 304 341 404
2000 2001 2002 2003 2004 2005 2006v

27
typically offered children enriched porridge (uji) and/or milk. The World Food Programme (WFP), the main UN agency providing school feeding in Kenya, estimates that it costs about KShs. 15.20 to feed a student per day [$0.19]. WFP has committed to feeding 500,000 children in urban informal settlements, but most of this support has been allocated to learners in Nairobi slums. According to MEO informants, in 2006, Kisumu pre-primary schools did not receive any school feeding assistance from WFP or the government. Health services such as de-worming programs, immunization campaigns or school-based malaria control initiatives are also lacking at Kisumu pre-primary institutions. Organizations such as ANPPCAN further note that many institutions lack basics such as First Aid kits (ANPPCAN, 2005). The government, NGOs and other stakeholders can improve students’ health status by equipping pre-primary schools with First Aid kits and supporting health/immunization.
2.2 Primary Education Primary schooling in Kisumu, as in other parts of Kenya, officially starts when a child is six and runs for eight years. The main purpose of primary education is to prepare children to participate fully in the social, political and economic development of the nation. Children receive instruction in language, mathematics, history, science, geography and religion. At the end of the primary school cycle students take the Kenya Certificate of Primary Education (KCPE) examination.
Students at a primary school in Kisumu Municipality Photo: © Help Kenya Kids.
The primary school population in the municipality in 2006 was 77,659, with 90 percent attending public schools and 10 percent attending private schools. Enrollment in public primary schools increased from 44,179 in 2002 to 70,278 in 2006.13
13 According to TSC records, in October 2006, there were 70,278 public primary school students.
Figure 3 shows trends in primary school enrollments since the adoption of the MDGs in 2000.

28
Figure 3: Trends in Primary School Enrollments (2000-2006)
Primary School Enrollment, by Gender and Type of School (2000-2006)
010,00020,00030,00040,000
2000 2001 2002 2003 2004 2005 2006
Year
Enr
ollm
ent
Public Male Public FemalePrivate Male Private Female
Source: Kenya Ministry of Education and TSC.
It can be seen that both male and female enrollments have increased substantially since 2002 and that gender parity has been mostly achieved. The improvements in enrollment rates and girls’ participation during the 2003-2006 period can be largely attributed to FPE. Despite this performance, some children in slum areas still do not attend primary school because their parents cannot afford to pay for other costs associated with schooling such as costs for uniforms, books and supplies. Moreover, primary education continues to experience a number of other challenging conditions not conducive to learning, including overcrowding (particularly in slums areas) and lack of adequate infrastructure. As Figure 4 shows, the number of public schools has not really changed much since 2001.
Figure 4: Number of Primary Schools (2000-2006)
Number of Primary Schools by Type, 2000-2006
0
100
200
Year
Num
ber o
f Sc
hool
s/Cen
ters
Public Private Total
Public 99 114 114 115 112 114 114
Private 35 40 45 20 45 23 45
Total 134 154 159 135 157 137 159
2000 2001 2002 2003 2004 2005 2006v
Source: Ministry of Education.
The teacher-student ratio in 2006 stood at 1:57, which is high. The number of non-teaching staff at each school varied. Some schools only had a watchman and/or an accountant to

29
maintain proper records for auditing purposes and to ensure that funds were being utilized for intended purposes.
School and MEO officials were generally tentative about providing repetition and drop-out data. As one publication notes, the MOE does not allow schools to force children to repeat classes, and educators are under so much pressure to ensure successful implementation of FPE that they are careful not to discuss issues that would irk officials at the Ministry of Education (OWN and Associates, 2005). The MEO did not provide specific figures on the number of students repeating and dropping out, but did inform MCI that repetition rates were about six percent for boys and girls, except in Standards 7 and 8, where the repetition rate for girls was 16 percent and the drop-out rate was 15 percent.14
DEO Briefs confirm these high rates, noting that, at the district level, repetition rates in Standards 2, 3 and 7 were 16 percent (Kosgei, 2006). The high repetition rate for Standard 7 can be explained by the fact that many students repeat this year in order to improve their performance on the Kenya Certificate of Primary Education (UNESCO, 2005).
In terms of infrastructure, about 40 percent of the existing public primary schools were built before independence in 1963. There is clearly a need to renovate some of these schools, and, to keep pace with the increasing enrollments, new schools also need to be built.
Figure 5: Ages of Public Primary Schools
Source: Kisumu MEO 2005 EMIS Database (in Access format).
Kisumu MEO documents show that there were 50 schools in need of additional classrooms and latrines.15
14 Information provided by the Kisumu Deputy Municipal Education Officer, George Omondi.
According to the documents, in October 2006 enrollment was 70,036 and there were 885 permanent toilets: hence, the average toilet-to-student ratio was 1:79. The ideal number of
15 MEO Spreadsheet, see Annex 4.
0
2
4
6
8
10
12
2004
1998
1992
1987
1985
1983
1980
1978
1976
1974
1972
1969
1966
1963
1961
1958
1956
1954
1952
1949
1947
1945
1942
1937
1935
1917
Num
ber o
f Sch
ools
Year Established
Ages of Public Primary Schools in Kisumu City
Number of Public Schools

30
toilets (at 30 students per cubicle) was identified as 2,308, and it was estimated that there was a shortage of 1,435 toilets. The MEO also identified that three new schools had to be built in the slum areas of Bandani, Kajulu and Nyalenda, along with 10 resource centers. Table 4 summarizes infrastructure needs as of October, 2006. Table 4. Primary School Infrastructure Needs as at October 2006 Item No. Item No. Item No. No. Ideal number of classrooms @ 40 students per class
1810 Existing permanent classrooms
1116 Shortage of permanent classrooms
739* 694§
Ideal number of latrines @ 30 students per cubicle
2308 Existing permanent toilet/latrine cubicles
885 Shortage of permanent toilet/latrine cubicles
1435* 1423§
New Primary School Needed 3 Teachers’ Resource Centers Needed 10 Libraries Needed 24 Primary Schools in Need of Electricity 77 Water Tanks Needed 87 Boreholes Needed 9 Primary Schools in Need of Fencing 76
Source: Kisumu Municipality MEO. (* designates MEO figure while § refers to Author’s calculation). It is unclear how the MEO determined the shortage of classrooms and toilets. As a result, Table 4 presents the MEO’s figures as well as the author’s calculation of shortages, which is simply the difference between the desired number of classrooms/toilets and the available number of classrooms/toilets.
Unfortunately, the MEO documents do not indicate the toilet distribution by gender. This is important because toilets at some schools do not meet the specific requirements of girls, and some lack sufficient privacy.16
According to School Inspection Reports, some of the girls’ and boys’ toilets were too close together and needed to be further apart in order to ensure privacy. Such issues need to be accorded primacy because many parents tend to withdraw girls from school if there are no separate toilets for boys and girls.
To date, several toilet construction projects have been undertaken by different stakeholders in Kisumu. For instance, funds from the Constituency Development Fund (CDF), as well as support from private companies such as Coca Cola, have enabled schools to construct toilets and boreholes. Non-governmental organizations such as Sana International, World Vision and HelpKenyaKids have also built toilets. Moreover, partnerships between the government and UN agencies, such as the UN-HABITAT and UNICEF, have resulted in the construction of toilets at several schools. Additional support for toilet construction in several schools has been acquired via the Kenya Slums Upgrading Programme (KENSUP), under the Ministry of Housing. 16 Interview with Mrs. Rose Odoyo, 10 February 2005; C.E.O. of ANPPCAN-Kenya Chapter.

31
In Standards 7 and 8, there is also a need to provide girls with sanitary products, as many girls lose as many as five school days each month due to lack of supplies during menstruation. (During their menses, many girls do not attend school because they cannot afford sanitary pads.) This translates to 50 lessons per month or 450 lessons per year.17
Groups that have provided sanitation pads, such as Girl Child Network, are lobbying the Government to issue these products as a right and argue that, for girls, sanitary products are as important as pens and books.
Regarding instructional materials, the student-to-textbook ratio (PTR) has improved since the government began disbursing capitation grants in 2003. According to Kisumu MEO records, in 2006, schools reported an average PTR of 1:3 in lower primary classes (Standards 1 to 4) and 1:2 in upper primary classes (Standards 5 to 8). In terms of PTR by subject, the Kiswahili and English PTR average was around 1:2 to 1:3 in lower and upper primary, while the mathematics and science PTR ranged from 1:3 and 1:5, indicating that reductions in PTR are needed for math and science subjects. The provision of free instructional materials has been one of the great successes of FPE. This initiative ensures that students have access to materials that facilitate learning, and teachers have access to reference and teaching materials they need for effective curriculum delivery. Table 5 shows the instructional materials items that FPE provides for teachers and students. The supplementary reading materials are provided so that every school will be able to establish a simple library, thereby enhancing reading habits.
Table 5. Instructional Materials Provided by FPE
Lower Primary (Standards 1-4) Upper Primary (Standards 5-8) Basic packet of school stationery Basic packet of school stationery Chalk Chalk Teachers’- preparation book Teachers’ preparation book Enrollment and attendance registers Enrollment and attendance registers 6 core textbooks & 8 core teachers' guides 6 core textbooks & 8 core teachers' guides 1 textbook per 3 students for each subject 1 textbook per 2 students for each subject Supplementary reading materials in English Supplementary reading materials in English Supplementary reading books in Kiswahili Supplementary reading books in Kiswahili 1 Science Kit for Standard 1-4 per school 1 Science Kit for standard 5 – 8 Wall maps of the world, Africa, and Kenya English dictionary of Standards 6,7 and 8 Kamusi for Standards 6,7 and 8
Source: Kisumu Municipality MEO. As far as school feeding is concerned, there are several types of primary school feeding programs in existence, including WFP-supported programs, parent-assisted programs and NGO-assisted programs, as well as those sponsored by the National School Feeding Council of Kenya. Students are mainly fed a lunch meal of rice and beans, nyonto (maize and beans) or ugali (cornmeal) and vegetables. These school feeding programs need to be actively supported, because there is evidence that they promote the attainment of MDG goals in education. For instance, they have been particularly effective in improving the enrollment rates of girls, poor 17 “5/30 Sanitary Towel Campaign” brochure, developed by Girl Child Network (GCN), Childlife Trust and others.

32
children and orphans and have also proven effective in preventing children from dropping out (WFP, 2004). Efforts also need to be made to enhance students’ security. Many of the schools have used FPE funds for non-teaching staff to hire watchmen. However, expenditures on items such as school fences are also necessary to ensure that the school property is secure and that children are able to learn in a safe environment. Fences are important because they not only prevent theft/damage to school property, they also deter physical violence against students and teachers. As Table 4 shows, 76 of the 114 primary schools were in need of fences in 2006. 2.3 Secondary Education Secondary school education officially starts at 14 years of age and runs for four years. The secondary school curriculum covers six major areas: communication (English, Kiswahili and foreign languages), mathematics, science (physical and biological), humanities (geography, history, government, religious education and social studies), applied education (agriculture, industrial education, wood technology, metal technology, business education, home science, etc.) and physical education. The curriculum is geared towards meeting the needs both of students who may elect to terminate their education after Form IV and those who may want to proceed to tertiary education. The Kisumu City Council estimates that in 2005, 24.6 percent of the urban population had completed secondary school (KCC, 2005). In 2006 there were 28 public and eight private secondary schools in Kisumu Municipality. Public secondary schools are jointly funded by the government and parents and are managed by boards of governors (BOGs18
). BOGs monitor school performance, pay non-teaching staff and report to District Education Offices. Parent-teacher associations (PTAs) also monitor school performance, raise funds to supplement the school budgets and participate in decisions regarding the use of funds. Given the overlapping responsibilities, the two bodies are often in conflict. Private secondary schools are established and managed by private individuals or organizations, including missionary groups.
Public secondary schools in Kisumu/Kenya are also classified into three categories: National, Provincial or District. The national schools have the most stringent admission standards and receive the most generous funding and resources, followed by provincial and then district schools. In 2006, there were eight provincial and 20 district secondary schools in the city. Data from the MOE clearly show that between 2000 and 2003 enrollments in public and private secondary school were declining. Public secondary school enrollment data is not available for 2004, but MOE records show that by 2005, enrollments at public schools had increased, whereas enrollment at private secondary schools has been consistently low. Moreover, it is clear that in public schools there is a persistent gap between male and female enrollment, whereas in private schools the trend has been towards gender parity. The gender gap in public secondary schools might be due to the fact that many girls either do not enroll or do not stay long enough to complete the secondary school cycle. Figure 6 shows secondary school enrollment trends in Kisumu since 2000.
18 BOGs were created by the Kenyan Education Act (KEA) in 1966 to establish a direct link between the MOE and secondary schools.

33
Figure 6: Trends in Secondary School Enrollments (2000-2006)
Source: Ministry of Education. Based on student enrollments and the number of teachers at municipal schools, the student-teacher ratio at public secondary schools in 2006 was 17:1, where over 96 percent of these teachers were trained. According to the DEO, there was a shortfall of 106 teachers.
Secondary education is also plagued by other challenges. First, there are a limited number of secondary schools. Second, the transition rate from primary to secondary schools has been low (<50%). Third, according to DEO Education Briefs and the District Development Plan, repetition and drop-out rates in Kisumu’s secondary schools have been over five percent.
The limited number of schools is a key challenge facing the secondary education sub-sector in Kisumu Municipality. The fact that the total number of public primary schools in 2006 was 114 while secondary schools were a meager 28 is a matter of concern. With the successful implementation of FPE, the number of primary school graduates wishing to transition to secondary schools is likely to increase in coming years. The number of secondary schools needs to expand to accommodate them. Figure 7 shows the number of secondary schools since 2000, with public schools outnumbering private schools.
02,0004,0006,0008,000
10,000
2000 2001 2002 2003 2004 2005 2006
Year
Enr
ollm
ent
Public Male Public FemalePrivate Male Private Female

34
Figure 7: Number of Secondary Schools (2000-2006)
Number of Secondary Schools by Type
0
50
100
Year
Num
ber
of S
choo
ls
Public Private Total
Public 40 45 45 49 50 52 60
Private 7 6 6 6 6 2 10
Total 47 51 51 55 56 54 70
2000 2001 2002 2003 2004 2005 2006
Source: Ministry of Education.19
Increasing the number of secondary schools in coming years is necessary to meet expected increases in the demand for secondary education. It is also vital because the availability of secondary education is known to increase parents’ incentive to send children to primary school, while a dearth of schools undermines the attainment of goals such as universal primary education (UNESCO, 2005).
The reasons for high drop-out rates include lack of funds, early marriage and early pregnancy (for girls). Both young males and females are likely to drop-out of school, but the rate is higher for young females, who are more vulnerable because many households (particularly poor households), tend to invest less in girls’ education because they expect that when young women get married and move in with the husband’s family, their own families will not benefit from their daughters’ schooling. Girls are also more likely to be withdrawn from school so that they can take care of siblings or sick family members. A significant number of female youth either do not progress to secondary education or drop out before completing secondary schooling. As a result, whereas there is almost near-gender parity at the primary school level, a gender gap is evident at the secondary level.
Efforts also need to be made to improve transition rates from primary to secondary school. The low transition rates (<50%) are the result of a combination of factors, including poverty and limited places in public schools. All secondary schools in Kisumu charge fees, and many households cannot afford tuition or other expenses associated with secondary schooling, such as school supplies, uniforms, exam fees and room and board. A 2003 analysis of education financing in Kenya revealed that although there was regional variation in proportions of household income spent on secondary education, urban household spent about KShs. 34,923 per child [$436] (IPAR, 2003). An international NGO working in Kisumu estimates that fees at a
19 Figure 6 uses historic data from the MOE which includes all schools in the district. 2006 data is from the DEO. Half of the public schools and 80 percent of the private schools were in the municipality.

35
secondary school were about KShs. 14,896 [$186] per year, which is prohibitive to many parents (HelpKenyaKids, 2006). Information on fees in EMIS forms provided by 13 of the 28 schools reveals that fees were on average about KShs. 17,530 [$219] per year. To put this in perspective, an average working adult male earns about KShs. 150-200 [$1.80-2.50] per day, or KShs. 52,650-70,200 [$658-878] per year. Such an individual clearly cannot afford the cost of a secondary education his/her child.
In an attempt to make secondary schools more affordable, in 2003 the government issued guidelines requiring national and provincial secondary schools to charge KShs. 26,000 and KShs. 22,000 [$325-275] per year, respectively. Most secondary schools have openly disregarded the fees guidelines and charged significantly higher amounts than permitted. District day schools typically charge around KShs. 8,500 per year [$106]. It is important to understand, though, that secondary school costs include a multiplicity of payments made by parents, and tuition fees only constitute 15 percent of the total cost (IPAR, 2007). Tuition fees are typically used to purchase books and instructional materials, but parents still have to pay for uniforms, repair, maintenance and improvement, electricity, water and conservation, transportation, laundry, room and board.
The government has also sought to reduce the cost burden on parents by providing bursaries to needy students. The bursaries aim to increase secondary school enrollment and completion rates by targeting disadvantaged students, particularly female students, students from poor families, students from informal settlements and orphans. However, these have fallen victim to politicization (IPAR, 2007). One of these bursary schemes, the SEBF, has been criticized for mismanagement in funds allocation, due mainly to the fact that schools were initially not given clear guidelines on how to identify needy students, nor were they instructed on methods to calculate allocations per student (IPAR, 2003). The regional allocation was also inequitable, as students in provinces like Nyanza (where Kisumu is located) got lower allocations per student (KShs. 224.70) than students in five other provinces (IPAR, 2003). A more straightforward formula would allocate funding to secondary schools on the basis of the constituency poverty index and the student enrollment in each constituency. Table 6 shows the secondary school bursary awards and scholarships received by students in Kisumu in 2005/06. Table 6. Secondary Schools Bursary Awards and Scholarships, 2005/2006
Location
First disbursement (KShs.)
Second disbursement
(KShs.)
Third disbursement (KShs.)
Kisumu Town West 1,000,000 1,349,703 1,313,774 Kisumu Town East 1,000,000 1,423,881 1,385,977 Kisumu Rural 1,000,000 1,399,814 1,362,552 TOTAL (Kisumu Town) 2,000,000 2,773,584 2,699,751
Source: Kisumu District Education Office, Bursary Award and Scholarship General File No. KSM/SCH/9/NO IV In addition to increasing access to secondary schooling, there is a need for the government and stakeholders (e.g., parents and development partners) to build or improve facilities such as laboratories and libraries. EMIS forms show that only six of the 28 schools had libraries, and 23 schools had laboratories. DEO documents confirm that secondary schools do not have adequate libraries or laboratories and science equipment. Funds from the Constituency Development Fund are being used to improve facilities at some schools, but there is also a need

36
to invest in laboratory equipment. According to the Ministry of Education, 10 schools each received KShs. 203,000.00 for laboratory equipment in 2006.20
There is clearly a need for additional resources, particularly if secondary school enrollments are expected to increase in coming years.
To further alleviate the cost burden borne by parents while enhancing access to secondary schooling, the government could provide teaching and learning materials and consider measures such as increasing bursary allocations (IPAR, 2007). This could improve secondary school participation because, according to EMIS data, the average bursary per student in Kisumu was KShs. 5,454.00 [$68] in 2006, which was not enough to attend most schools.
Other measures proposed by IPAR include:
a) Introducing free public secondary education in Kenya. According to IPAR, this approach is justifiable because secondary schooling enhances workers’ productivity, thereby giving rise to classical externalities or spillover effects. Introducing free secondary education is, hence, beneficial, because it would increase the level of education of workforce and expand production possibilities. b) Abolishing public boarding secondary schools. According to IPAR, this is an appealing alternative because boarding schools are expensive and boarding school costs are a major burden for poor households.
In the summer of 2007, President Kibaki positioned free secondary education as a key plank in his re-election campaign. Preliminary estimates indicate that this would cost about KShs. 400 billion [$5 billion] per year (Kimani, 2007). Given financial constraints, increasing the bursary allocation to KShs. 10,000.00 [$125] per student would represent a less costly, but potentially equally effective, investment for increasing secondary school enrollments than making secondary schooling free. 2.4 Tertiary Education Upon completion of secondary school, students in Kisumu can attend university, pursue vocational training or enter the job market. Students who do well on the Form IV exam, known as the Kenya Certificate of Secondary Education (KCSE), are either admitted to university or may enroll in technical training schools, depending on their grades on the exam. Kisumu municipality has two fully fledged public universities, Maseno University and Great Lakes University, as well as several other types of tertiary institutions. These include Kisumu Polytechnic, Ramogi Institute of Advanced Technology (RIAT), Tom Mboya Labor College (TMLC) and several private colleges. Universities like Moi, Jomo Kenyatta and Kenya College of Accountancy also offer courses in Kisumu. Maseno University was founded in 1991 and became a full-fledged university in 2001. Kisumu Polytechnic was initially a technical secondary school, but in the mid-1990s the institution was upgraded to a polytechnic to ease the strain on national polytechnics21
20 Information provided by Mr. Newton Akwasa, Ministry of Education.
. RIAT was established in
21 There are three other national Polytechnics in Kenya, at Eldoret, Nairobi and Mombasa.

37
1976 and is named after a famous Luo ancestral warrior. Tom Mboya Labor College is named after a renowned Luo trade unionist and Cabinet Minister. Since 1991, TMLC has been marred by a financial crisis and mismanagement, and its uncertain status prompted its exclusion from this study. Maseno, RIAT and Kisumu Polytechnic offer courses tailored to careers such as law, engineering, medicine and accounting, as well as for careers in business management and marketing, computer and information sciences, electronics and social sciences. A secondary school certificate is the minimum prerequisite for admission into these institutions of higher learning, and most students are recruited from top-tier secondary schools.
As Figure 8 shows, enrollment for both males and females at Maseno University was constant between 2002 and 2004 and then declined in 2005.22
This is likely due to the low transition rate from secondary school to university (DEO, 2006). Enrollment at Kisumu Polytechnic, on the other hand, has steadily increased, reaching a high point in 2006.
Figure 8: Enrollment Trends at Tertiary Institutions, by Gender (2001 – 2006)
Source: Ministry of Education and Economic Survey 2007. Tertiary institutions have three cadres of staff: academic, administrative and support staff. The academic staff typically consists of lecturers, while administrative staff consists of a principal and deputy principal, an accountant and account clerks. Support staff include administrative secretaries, librarians and library assistants, laboratory assistants, telephonists/typists, messengers, drivers, security staff, a chief head cook and an assistant cook, kitchen attendants and janitorial staff. According to Altbach and Damtew (2003), keeping track of the ratio of students to academic and support staff “is essential in evaluating resource utilization in any university because researchers have found that there is over-employment at public universities in Kenya.” In recent years, the average staff-to-student ratio at Maseno has been around 1:12, while ratio of support staff to students has been approximately 1:3 (Commission for Higher Education, 2000). This shows that there is over-employment and indicates a need to reduce personnel costs. 22 Enrollment at RIAT is not presented on the graph, due to the lack of historical data.
-
1,000
2,000
3,000
4,000
2001 2002 2003 2004 2005 2006
Year
Enr
ollm
ent
Maseno Male Maseno FemaleKisumu Poly Male Kisumu Poly Female

38
Due to logistical constraints, a comprehensive assessment of the requirements for infrastructure and instructional materials was not possible in this needs assessment. However, documents provided by the tertiary institutions in Kisumu and secondary sources specify some of the requisite facilities. These include: an administrative block consisting of 6-10 offices, a reception area, lecture rooms and a staff room; a library block consisting of a library, assembly hall, gymnasium and office; a printing block with a large printing space, offices and a reception area; a kitchen and dinning hall; canteens and a hostel for students; a staff quarters' block, flats for support staff, laundry rooms and a recreational centre. RIAT’s Corporate Strategic Plan states that existing facilities can accommodate 24 different classes and 840 students. Hostel accommodation is limited to 450 boarding students, while total enrollment (including day scholars) is confined to about 500 students. The 2002-2008 Kisumu District Development Plan identifies some of the ongoing projects/plans aimed at improving infrastructure as: campus renovations at Maseno University; the construction of new dining halls and hostels at RIAT and Maseno, and the construction of a workshop complex and a laboratory at RIAT. Regarding gender parity, female students constituted 35 percent of the total enrollment in 2006. At the tertiary level, therefore, male students outnumber female students by about three to one. Data provided by tertiary institutions, as well as secondary sources on girls’ and women’s education in Kenya,23
confirm that during the past half-decade, women’s enrollment in tertiary education has ranged between 30 and 39 percent. Although female participation in higher education institutions is improving, the gender gap needs to be reduced further. There is also a need to improve gender parity in some academic fields, as many female students tend to pursue such “traditionally feminine fields” as laboratory technician (MOE, 2003; Chege and Sifuna, 2006).
Female students are under-represented in technical courses for a variety of reasons, including admission requirements that place a strong emphasis on high scores in secondary school mathematics and science courses, teachers’ tendencies to favor male students and employment discrimination. To overcome gender-typing and gender streaming, there is a need to support young women to do better in primary and secondary school mathematics and science courses and to alter mindsets in the teaching and employment spheres. In addition to gender disparities in enrollment, a major challenge that has faced post-secondary education in Kisumu is shrinking revenues. Public universities such as Maseno receive limited government and donor support, but revenues from the government have been shrinking, while deficits and debts have been escalating (Atchoarena and Delluc, 2002; Altbach and Damtew, 2003). Revenues from fees have met some costs related to operations and maintenance. Universities such as Maseno and RIAT have sought to bridge the shortfall by introducing various income-generating activities, including: offering consultancy services; hiring of facilities and business ventures such as photocopying services, bee-keeping and farming. However, to date, consultancy services have mostly benefitted academics, rather than the institutions, and the sustainability of income-generating schemes appears questionable.
23 Chege and Sifuna (2006).

39
To assist higher education, the Kenyan government provides capitation grants. The government’s grant per university is computed by multiplying the total number of students in the university by US$933, which is the government’s annual grant per student. In 2005/06 capitation grants to universities totaled KShs. 10,300.70 [$128] million (MPER, 2007). Another worrisome issue facing tertiary education is the high fees charged by polytechnic and technical colleges. Annual fees per student at schools such as Kisumu Polytechnic are estimated to be over KShs. 33,450 (Atchoarena and Delluc, 2002). According to the World Bank, the exorbitant fees at Technical, Industrial Vocational and Entrepreneurship Training (TIVET) institutions reflect the fact that the cost of attending a TIVET is usually a multiple of the cost of secondary schools (World Bank, SEIA, 2007). On average, per-student cost in technical/vocational education are 134% of GDP per capita, mainly because class sizes are usually much smaller, and the cost of equipment, supplies and specialized facilities is much higher than in general education programs. Private technical colleges undoubtedly provide many students with a chance to benefit from university education, but, given that only students from rich families can afford high fees, these private institutions also exacerbate social inequality by excluding poor students and socially disadvantaged groups from participation. Loans from Higher Education Loan Board (HELB) help some but not all disadvantaged students. Government subsidies, income from tuition and fees and business ventures are not enough to sustain operations at Kisumu tertiary institutions. Consequently, higher education institutions rely on external sources for donations of teaching and learning materials and funding for physical infrastructure (Altbach and Damtew, 2003). In 2005 six US foundations announced that universities in Kenya, along with universities in six other African countries, would receive USD200 million.24
These funds were to be used to expand higher education, train teachers and improve access to the internet. It is unclear whether any of these funds were allocated to Kisumu in 2006. The private sector represents an alternative source of funds whose participation in tertiary education needs to be actively promoted (PER, 2006).
2.5 Non-Formal Education (NFE) Most Non-Formal Education (NFE) institutions in Kisumu target school-age children (6-13 years old) who for whatever socio/economic reason are unable to attend formal schools. A majority of children/youth in institutions offering NFE are marginalized or disadvantaged, including orphans, street children, child workers and adolescent parents. Non-formal education is particularly popular in informal urban settlements, and its emergence as an alternative mode of schooling is often associated with high drop-out rates from formal schooling (Abagi and Owino, 2000). In fact, the term “non-formal” has been misinterpreted to mean “informal,” but in Kenya it was actually first used to refer to the “schools without uniforms” that surfaced in informal settlements. Some of the earliest NFE institutions in Kisumu were established by missionaries with the objective of providing literacy and numeracy education as well as vocational training. During the past decade, the municipality has witnessed an increase in the number of non-formal
24 The foundations include Rockefeller Foundation, Carnegie Corporation of New York, Ford Foundation. MacArthur Foundation, Andrew W. Mellon Foundation and William and Flora Hewlett Foundation.

40
schools. In the early 1990s the Municipality had three centers with an enrollment of 250 students, but by 1998, this figure had grown to 11 centers with an enrollment of 1,114 children (GOK, 1999). According to the Ministry of Education, in 2006, there were 21 non-formal schools (NFSs) recognized by the MEO, with a total enrollment of 2,580 (1,246 males and 1,262 females).25 The number of teachers stood at 126, hence, the teacher-student ratio was one 1:20.26
It is difficult to enumerate precisely the NFE institutions in Kisumu because some are often not registered as schools. However, institutions offering non-formal education can be classified into three categories: Non-Formal Schools (NFSs); Non-Formal Education Centers (NFECs) and Community-Based Organizations (CBOs). The main difference between NFSs and NFECs is that the former offer a full, formal curriculum while the latter provide limited education services. Moreover, due to the fact that NFE learners have diverse needs, institutions offering non-formal education services use different curricula including: the curriculum used by formal schools, a basic literacy curriculum and a vocational skills curriculum. Annex 5 lists some NFSs/NFECs/CBOs identified by the Kisumu MEO. The main challenges facing institutions providing non-formal education include overcrowding, inadequate infrastructure and teaching/learning resources, as well as difficulties in financing operating costs. Although non-formal schools are an attractive alternative for disadvantaged students in slum areas, these institutions lack the physical facilities and instructional materials necessary to ensure the provision of quality education. Almost all the NFS schools in Kisumu have toilet facilities, with some having separate toilets for boys and girls (Ekundayo-Thompson, 2001). Table 7 shows the physical facilities needs of NFSs identified by the MEO. Table 7. Non-Formal Schools Infrastructure Needs as of October 2006
Source: Kisumu MEO. The Ministry of Education has started providing some FPE funding to NFS and has initiated action to assign Teachers’ Service Commission (TSC) teachers to select non-formal schools. In 2006, only nine out of the 21 NFS in Kisumu benefited from FPE funds. A total of 1,271 students each received a KShs. 1,020 [$12.75] capital grant, allocated as follows: KShs. 650 [$8.12] per year to cover teaching and learning materials; and KShs. 370 [$4.63] per year to cover various operational costs, including wages for support staff, repairs, maintenance, quality assurance, water and electricity. Table 8 lists the NFS schools that benefited from FPE.
25 Data provided by Mr. Charles Obiero of MOE on September 26, 2007. 26 Data on the qualifications of teachers at NFE institutions was not available.
Item Number Item Number Existing Classrooms 88 Classrooms Needed 73 Existing Latrines/Toilets 38 Toilets Needed 84
Non-Formal Schools in Need of Library 1 Non-Formal Schools in Need of Electricity 6 Non-Formal Schools Needing Water Tanks 10 Non-Formal Schools in Need of Fencing 1

41
Table 8. Kisumu Non-Formal Schools that received FPE Funds in 2006 SCHOOL ENROLLMENT FUNDS @ 1020 per child Disciples of Mercy 129 KES 131,580.00 New Generation 110 KES 112,200.00 Life of Faith 50 KES 51,000.00 Madoma 195 KES 198,900.00 Ring Road 227 KES 231,540.00 Dunga 228 KES 232,560.00 Joodon 186 KES 189,720.00 Young Generation 108 KES 110,160.00 Ober 38 KES 38,760.00 TOTAL 1271 KES 1,296,420.00
Source: MOE, Data provided by Mr. Charles Obiero. According to these figures, in 2006 Kisumu NFSs received 16. 4 percent of the KShs. 7,897,850.00 [$98,723.13] allocated to NFS in other municipalities in Kenya (Mombasa, Eldoret, Nakuru and Nairobi). International organizations like UNICEF also actively support NFE in Kenya, but the support is mostly directed to projects in northeastern and northern Kenya. UNICEF staff confirm that the agency does not have many NFE activities in Kisumu.27
Lack of financing from government is a key impediment facing non-formal schools in their efforts to provide quality education. Table 9 lists some of the stakeholders involved with NFE and the type of support they provide. It can be seen that the community, NGOs/CBOs and religious organizations provide most of the support needed by non-formal schools. Table 9. Sources and Types of Support to NFE Schools and Centers in Kisumu Source of Support Type of Support Ministry of Education Administrative (inspection)
Provision of teachers, FPE funds for teaching/learning materials Children’s Department Inspection Community Payment of teacher salaries
Provision of building materials Fund raising School/center management (PTA)
UNICEF Provision of desks, text books, equipment (sewing machines) NGOs/CBOs Payment of rent, provision of books, clothes, food Church Accommodation Private Sector Donations
Source: Adapted from Ekundayo-Thompson (2001). Most of the Municipal Education Office employees consulted during the needs assessment exercise perceive NFE as an alternative method of education delivery geared towards the rehabilitation of deviant learners in the society. Some regarded it as an opportunity for overage learners who want a chance to learn but who cannot easily fit in the formal school. Interviewees
27 Information provided by Ms. Jane Mbagi-Mutua, UNICEF Project officer.

42
suggested that such learners should attend NFE and be allowed to re-enter formal schools at upper classes once they have developed basic skills in numeracy and literacy. Table 10 summarizes distinguishing characteristics of NFEs and FE systems.
Table 10. Distinguishing Features of Formal & Non-Formal Education Systems Characteristics Non-Formal Education (NFE) Formal Education
Learners Non-enrolled or dropouts; Socially/economically;
disadvantaged/marginalized, e.g. young mothers, working children, house girls, urban poor.
School-aged population.
Staff Voluntary/part-time/full time; Lower remuneration, status; Can tap experts in community
(not necessarily literate).
Training/certification used as a basis for placement;
Mostly full-time. Time Flexible
Often part-time Short term and present oriented
Fixed time/routine; Future oriented.
Administration Run by NGOs and philanthropic organizations;
Decisions are made at local level;
Local control and decision-making.
Co-ordinated by MOE;
Decision-making is mainly centralized.
Source: Adapted from Ruto (2004:28).
A major challenge facing the non-formal sub-sector is the lack of linkage with the formal sector.28
The marginalization of NFE can be attributed to lack of a clear government policy towards NFEs. A draft NFE policy has also been completed, but there are several other initiatives that can promote fruitful interaction between formal and non-formal schooling that need to be undertaken. For instance, basic education subjects taught in formal primary schools can be introduced into non-formal institutions- and Teacher Training Colleges can design courses focused on NFE teaching methodologies and train NFE teachers.
The non-formal education sub-sector needs increased attention in order for the MDGs to be achieved. Until recently, only a ‘desk’ in the MOE, rather than a unit or department, was in charge of NFE. The Ministry of Education has established a department to coordinate non-formal education and developed a draft NFE policy (ADEA WGNFE Newsletter, 2005). Such initiatives are likely to revamp the sub-sector, but there remains a need to provide schools with instructional materials as well as funds for operating costs and teacher salaries.
28 Recent studies on NFE advocating a closer link between NFE and FE include a survey of NFE centers in Kisumu, Mombasa and Nairobi, by Ekundayo-Thompson (2000), and a doctoral dissertation by Ruto (2004).

43
2.6 Adult Literacy In 2005, Kisumu had an adult literacy rate of 48 percent (KCC, 2005). According to the 2006 Kenya National Adult Literacy Survey, factors contributing to illiteracy include poverty, low primary school completion rates and low enrollment rates in adult literacy education programs. The government’s goal of improving adult literacy levels by 50 percent by 2010 is based on the premise that literate parents will contribute to the achievement of the MDGs in education because they have a better understanding of the importance of educating children. Moreover, a functionally literate adult population contributes more effectively to the economy because literate workers are more productive. Adult education and literacy programs in Kenya are coordinated by the Department of Adult Education, in the Ministry of Culture and Social Services. As a result, in Kisumu Municipality, adult literacy programs are provided by the Department of Adult Education’s District Office, an entity separate from MOE.29
The Department of Adult Education is responsible for the provision of adult education teachers and the payment of their salaries.
The adult literacy program in Kisumu provides learners with the following services: instruction in literacy and numeracy; language instruction (English and Kiswahili); leadership skills training (women and youth groups); and basic life skills training (vocational training in carpentry, fishing and bicycle repair). Two distinct types of populations receive these services: prisoners (inmates) and non-prisoners (non-inmates). Prisoners are provided literacy courses and basic skills training as part of their rehabilitation process. Non-inmate students include adult learners as well as female youth aged 15-24 years old who drop-out of school because of teen pregnancy. The majority of adult learners, however, are farmers and petty traders from low-income areas who view literacy as a means to improve their lives. The literacy program has three modules: a basic literacy module, non-formal education and post-literacy. The basic literacy module covers Stages 1 through 4 and seeks to ensure that students learn how to read and write. The duration ranges from nine months to a year, depending on the learner’s rate of progress. The non-formal education module covers Stages 5 and 6 and prepares students for a proficiency test. At the completion of this stage, graduates are issued certificates on September 8, during the annual International Literacy Day celebration. The post-literacy module covers Stages 7 and 8 and helps learners to acquire sustainable literacy. At the completion of this stage, students sit for the Kenya Certificate of Primary Education (KCPE). Enrollment in adult literacy classes in Kisumu is extremely low. According to one study, enrollment in 2005 was only 0.253 percent (Oluoch, 2006). One of the main reasons for low enrollment is male insecurity.30
29 According to Mrs. Leah Rotisch, Director of Basic Education, adult education now falls under the Ministry of Education.
Few men attend literacy classes because they believe that their status as household heads would diminish if they revealed that they were illiterate. Some men also do not want to attend literacy classes because they fear that women might perform better
30 Interview with Kisumu Deputy Adult Literacy Officer.

44
than they would. Figure 9 shows enrollments in adult literacy classes in recent years, by gender.
Figure 9: Trends in Enrollments in Adult Literacy Classes, by Gender (2003-2006)
Source: Kisumu District Department of Adult Education. There are two types of adult literacy teachers: full-time teachers, who are government employees and work eight hours per day, five days a week; and part-time teachers, who are volunteers and are paid a KShs. 2,000 honorarium per month. Since 2005 the numbers of teachers has been steadily declining, mainly due to poor terms and conditions of service.31
In 2006, there were eight full time teachers, 12 part time teachers and four volunteers. The teacher-student ratio was 1:24.
The Department of Adult Education has no permanent classrooms. As a result, instruction takes place at churches, community halls and schools. In 2005 and 2006, there were 20 adult literacy centers in the city. The adult education sub-sector is also hampered by a lack of teaching and learning materials. These realities have led researchers such as Oluoch (2006) to advocate the streamlining of adult literacy in the education system, so that learners can have adequate institutional facilities and resources.
2.7 HIV/AIDS and its Impact on the Education Sector in Kisumu HIV/AIDS is arguably the greatest health challenge in Kisumu Municipality. In 2006, the HIV/AIDS prevalence rate in Nyanza Province (15 percent) was more than double the national prevalence rate of 6.1 percent (UNAIDS, 2006). Official statistics show that Kisumu District’s prevalence rate in 2006 was 11.1 percent, and the prevalence rate in Kisumu Municipality was 15 percent or higher (UN-HABITAT, 2006). The HIV/AIDS pandemic presents several major challenges for schools. It affects the supply of education by decimating the ranks of teachers, and it impacts the demand for education by
31 Information provided by Kisumu District Department of Adult Education.
0100200300400500600700
2003 2004 2005 2006
Enro
llmen
t
Year
Enrollments in Adult Literacy Classes, by Gender (2003-2006)
Male Female

45
exacerbating poverty, thereby making it more difficult for households to afford education costs. It also reduces the rates of retention and completion rates within the formal education system. Poverty has been identified as one of the main reasons why children affected by HIV/AIDS drop-out of school (Ainsworth and Filmer, 2002; Badcock-Walters, 2002; Bicego, Rutstein et al. 2003; Case, Paxman et al., 2003). HIV-related deaths among teachers in Kisumu are also alarming. While the DEO and MEO were unable to provide specific data on teacher deaths, according to the District Education Staffing Officer, in 2006 three teachers died of AIDS-related deaths in Kisumu District every month.32
It is clear that if the issue of HIV-related deaths is not urgently addressed, the high teacher mortality rate will become an obstacle to achieving the MDGs in education since it will contribute to faculty shortages.
A key challenge facing the education system is the increasing number of orphans, presumably also due to high HIV prevalence rates33. Data on orphans collected by the Kisumu MEO and DEO since 2004 clearly show that the number of orphans has been increasing. In 2006, the numbers of orphans in ECD institutions, primary schools and secondary schools were 3210, 6901 and 1048, respectively.34
The education needs of orphans must be accorded special attention because there is evidence that they are less likely to be in school and more likely to fall behind or drop out, compromising their abilities and prospects (Connolly and Monasch, 2003). Providing educational support to keep orphans and other vulnerable children in school is critical to breaking the cycle of poverty.35
If current OVCs do not receive a quality education, the future cost to society is likely to be greater, as these children are likely to mature into unproductive adults.
The Ministry of Education policy towards orphans and vulnerable children (OVCs) is to enroll all those who are out of pre-primary and primary schools, retain those who are in school and re-enlist those who have dropped out. To be effective, the policy towards OVCs needs to be implemented in partnership with NFS and those Community-Based Organizations (CBOs) already assisting orphans. The government provides OVCs with free education and textbooks, but OVCs also need items such as uniforms, school bags and counseling, and it is the CBOs which meet these other needs.36 Appendix 3 lists some of the organizations and the types of assistance they provide to orphans.37
Primary school children affected by HIV/AIDS face numerous challenges, including lack of concentration in class due to feelings associated with imminent or recent parental loss. Their 32 Memo compiled by Beatrice Lukalo, Kisumu DEO Staffing Officer. 33 An orphan is defined as someone below the age of 18 who has lost one or both parents. There are three types of orphans: paternal orphans (those who have lost a father), maternal orphans (those who have lost a mother) and double orphans (those who have lost both parents). 34 According to UNICEF’s “Children on the Brink” studies, the total number of orphans is equal to the sum of maternal and paternal orphans, minus double orphans (because they are counted in both the maternal and paternal categories). The orphan totals in this report differ from MEO totals because the latter calculated total orphans as the sum of partial and double orphans. 35The World Bank uses unit cost of US $50 to enroll one OVC for one year. 36 The MOE, in collaboration with DPs, is now providing KShs. 100,000 per school for schools to provide OVCs with uniforms, school bags and shoes. 37 Unfortunately, CBOs usually do not provide records of recurrent expenditures, save for amounts listed on grant proposals submitted to funding agencies.

46
learning experience is also detrimentally affected by other psycho-social impacts of HIV/AIDS such as stigma, worry, despair and depression. The MOE has provided training on HIV/AIDS to all principals and deputy principals at public and private schools, but there remains a need to train all staff to help provide psycho-social counseling to affected students. At the very least, all teachers need to be sensitized to address the needs of children affected by or infected with HIV during pre-service and in-service training (Nzioka et al. 2006).
At the secondary school level, HIV/AIDS is forcing many Kisumu female youth to drop-out of school, either because of HIV infection or because of the need to work or care for sick relatives. A 1999 study found a wide divergence between HIV infection rates of 15-19 year old youth in Kisumu, with 3.5 percent of male teenagers infected compared with 23 percent of female teenagers (WHO, 2004). Youth infected with HIV/AIDS are generally viewed as lacking a future – investing in their education is, therefore, perceived by some as a waste of precious resources.
Kisumu educational institutions have a critical role to play in reducing HIV infection, mainly because of their capacity to reach very large numbers of young people with life-saving information and skills. Ensuring that children complete primary schooling is important for achieving MDG 1 and for reducing HIV rates, as studies have shown that a complete primary education can halve the risk of HIV infection for young people (Boler and Jellema, 2005). Moreover, there is evidence that secondary and higher education reduce women’s likelihood of HIV infection by reducing their vulnerability to prostitution as well as their dependence on men, both of which contribute to high HIV infection rates (Kelly, 2000) To ensure that OVCs continue attending school, the central government needs to provide bursaries and to support NFS and CBOs that provide education services to children affected by HIV/AIDS. There is also a need for guidance and counseling for infected/affected students and teachers. Finally, students and teachers need to be provided regularly with information and messages that raise awareness regarding the control and prevention of HIV/AIDS and that promote healthy lifestyles.
2.8 Gender Perspectives Half of the population in Kisumu is female. The city’s former mayor and chair of the education committee were female, and the city used to have a female Municipal Education Officer. Moreover, more than half the teachers at the primary school level and about half the secondary school teachers are female. Despite this, for the most part, women in Kisumu lack decision-making power and access to resources and information (GOK, 2005b). The attainment of MDG 2 (gender equality and empowering women) is impeded by several factors, including cultural bias. One of the key factors, in some communities, is that parents still prefer to educate boys rather than girls. As the Kisumu District Strategic Plan 2005-2010 observes, “The bias against girl-child education is there but not pronounced. The level of gender awareness is quite low” (GOK, 2005b). This suggests that there is a need to sensitize parents and communities to discard cultural practices that inhibit girls’ effective participation.
Parents cite many reasons for not enrolling or for withdrawing girls from school, including that girls will get married, hence there is no need to invest in them, and that girls attending school have a higher risk of getting pregnant. Research on factors impacting female schooling has also

47
shown that households tend to invest less in female education because labor market discrimination and wage differentials between men and women have led them to anticipate lower rates of return from girls’ education (Narayan, 1997). Impoverished parents often feel that they need their daughters' labor for extra income or to perform household chores such as collecting water or firewood, caring for siblings and nursing ailing relatives.
In order to address the above challenges, additional support to girls is needed to ensure that they enroll in school and complete at least their primary education. Initiatives such as FPE and secondary school bursaries are important in that they permit poor female students greater access to education, but there is also a need to build parental trust and to convince them that investing in their daughters’ education is actually profitable. For instance, parents might be convinced to invest more in girls’ education if they knew that research has shown this is beneficial for the girls themselves, for their families and for macro-economic growth (World Bank, 2001).
Several studies have shown that girls’ education is one of most profitable investments developing nations can make, because it is associated with higher private returns as well as high social returns, including several health benefits (World Bank 1995). For instance, as mentioned above, secondary education is viewed as important for combating HIV/AIDS. Some studies have shown that young women with secondary education are less likely to be HIV-positive than their uneducated peers, whereas when the formal schooling of adolescent female students is cut short, they often resort to survival strategies that include sexual transactions, which expose them to higher risks of HIV transmission (UNAIDS/UNFPA/UNIFEM, 2004).
Interventions such as targeted support programs for girls and hiring more female teachers have all been shown to increase girls' enrollment. Initiatives that make schools more girl-friendly, such as measures to provide sanitary products and adequate latrine facilities for girls, are equally important for higher enrollment and retention rates for girls. However, some additional interventions could also promote gender awareness and gender parity, such as giving girls more positions of responsibility in primary and secondary schools, or appointing them as prefects or speakers at various school functions. At the tertiary level, proposed measures affecting admissions and enrollment, such as ensuring that women comprise at least one-third of the student population and increasing the proportion of female students studying sciences, need to be avidly promoted.
Overall, there is a need to sustain any increases in girls’ enrollment at all levels of the education system, by reducing repetition and drop-out rates and by improving completion rates, as well as girls’ performance on examinations such as the KCPE. MOE records show that fewer girls register for the KCPE and that boys tend to perform better. Kisumu Municipality is likely to achieve gender parity at the primary and secondary levels by 2015. In 2005, the first MDG benchmark year for gender parity, the primary school gross enrollment rates for boys and girls were respectively, 51 and 49 percent. At the university level, attaining gender parity is likely to take longer, due to such factors as early marriage and early pregnancy. Girls who drop out in upper primary or secondary school due to pregnancy can resume their studies, but the MOE needs to raise awareness about this policy, as many parents are unaware that girls who drop out of school due to pregnancy and/or early marriage can in fact pursue their studies.

48
III. FINANCING EDUCATION IN KISUMU Identifying the annual education budget for Kisumu Municipality is challenging because such data are not readily or publicly available and are rarely adhered to even when made available. In spite of a growing decentralization movement proposing that local authorities should have their own budgets and be responsible for services such as education, the capacity of local authorities such as the Kisumu City Council (KCC) to finance education remains limited. As a recent article notes, KCC has even failed to present its budget to the National Finance Committee, which makes it difficult to review or to make allocations to the education sector.38
An alternative approach to determining an education budget at the municipal level is to identify the contributions of major stakeholders. For instance, in Kisumu, education is financed by the central government, households, development partners (donors and international agencies), non-governmental organizations and individuals/private companies. Although it is beyond the scope of this study to identify the precise contributions of each stakeholder, it is still possible to approximate the contributions of major stakeholders, such as the central government.39
This section first delineates the available resources for education in Kisumu and identifies local unit costs. It then presents estimates of those financial resources needed to achieve the MDGs in education, based on the EPSSIM model developed by UNESCO.40
We have utilized this tool to get a clearer picture of the needs and obstacles. The simulation focuses on primary, secondary and tertiary schooling, but takes into account expenditures for pre-primary and non-formal education. Expenditures for adult literacy are not included in the model, as this is the responsibility of the Department of Adult Education in the Ministry of Culture and Social Services.
3.1 Financial Resources for Primary and Secondary Education
The central government and households make the largest contributions to education in Kisumu. The contributions of development partners (both bilateral and multilateral) to education in Kisumu are also noteworthy.41
This study does not separately identify contributions by development partners, which typically provide grants and loans to sector-wide education plans such as the Kenya Education Sector Strategic Plan (KESSP) 2005-2010.
The central government contributes towards the municipality’s annual education budget via the TSC (which pays teacher salaries); the School Instructional Management Book Account (SIMBA); the General Purpose Account (Account II); bursaries (scholarships), as well as several decentralized funds that target the vulnerable members of the society (orphans, low income children). These funds include the Constituency Development Fund (CDF), and the
38 The Standard Online, “History is made as councils table budgets”' Friday, June 29, 2007. Available at http://www.eastandard.net/hm_news/news.php?articleid=1143970595 39 This approach is valid because although municipal and city councils are supposedly semi-autonomous in matters of education, their revenue base depends mostly on transfers from the central government. 40 The EPSSIM instrument was designed to be applied at the national level but has been adapted in this study at the municipal level. 41 Major development partners and donors supporting the education sector in Kenya include the World Bank, UNICEF, USAID, Japan International Development Agency (JICA), UK Department for International Development (DFID), Italy Development Cooperation, Africa Development Bank and OPEC.

49
Local Authority Transfer Fund (LATF), the Education Bursary Fund (SEBF), HIV/AIDS Fund and the recently established Youth and Women Development Funds.
The SIMBA and GPA accounts are primarily for the procurement of learning and teaching materials as well as the payment of operating costs. The CDF and LATF provide funding for a wide range of infrastructure projects, including school construction and rehabilitation of physical facilities. The LATF is a decentralized mechanism for channeling five percent of the national income tax to local authorities. The SEBF makes it possible for poor and disadvantaged children to attend secondary school. The HIV/AIDS Fund targets individuals infected with and affected by HIV/AIDS and channels funds to AIDS Control Units, as well as to NGOs. The government, with support from development partners, also contributes towards in-service training of teachers.
Local authorities such as the KCC receive revenue from central government block grants and from locally raised taxes, fees and charges. To be eligible for LATF funding, local authorities are required to produce service delivery action plans known as Local Authority Service Delivery Process (LASDAPs) and must allocate at least 50 percent of their budget to service delivery. In 2006, education accounted for 29 percent of total local government expenditures (Economic Survey, 2007). Despite their high dependence on the central government for education funding, a recent article notes that City Councils such as the KCC also ‘have ample land and collect huge revenue’, which they could use to supplement the efforts of the central government by building schools in poor urban areas (Kimutai, V., Ngamau, M. and Mureu, L., 2006).
Households contribute to education budgets by paying fees as well as via mechanisms such as the PTA, Harambee [community self-help events and various fundraising projects], Board of Governors and School Development Funds. They pay for indirect costs (uniforms, school meals, transport to and from school, activity fees), healthcare and physical facilities. During the cost-sharing era - i.e., the decade prior to the introduction of FPE in 2003 - parents and local communities were responsible for primary schools’ physical infrastructure, as well as for providing instructional materials, while the government was responsible for policy and curriculum development, administration, inspection/supervision services and paying teachers' salaries. It is estimated that in the early 1990s, household contributions met 34 percent of the total costs of primary education in Kenya (Buckland, 1995). Cost-sharing created such a heavy burden on households that, as poverty levels deepened during the 1990s, parents were unable to meet their share of education costs, prompting the demise of the cost-sharing policy. Now, in the FPE era, schooling costs covered by households are still substantial. The 2005/2006 Kenya Integrated Household Budget Survey (KIHBS) observes that average spending on education per household in Kisumu District was KShs. 487 [$6.09] per month. Since students attend school for three terms (nine months) each year, average spending on education per annum per household amounts to KShs. 4,383.00 [$55],42
with urban households spending more than 2.5 times this average (i.e. KShs. 10,957.50 or [$137]).
42 This figure is close to an estimate in the 1997-2010 Master Plan on Education and Training, stating that the average yearly expenditure on schooling (for all children, not per student) by all households in late 1990s stood at Ksh, 4,730.

50
At the pre-primary and secondary school levels, households continue to defray most of the educational costs. In addition to fee payments, parents make significant contributions toward the financing of projects to improve physical facilities. In these endeavors, parents not only contribute money and materials, but also volunteer their labor and time. 3.2 Unit Costs A key challenge in identifying local unit costs is that many studies provide national rather than local unit costs. Moreover, standard government accounting systems are designed to account for expenditures rather than costs (Levin and Schwartz, 2006). As a result, this Needs assessment exercise resorts to using local expenditures per student as a proxy for unit costs. It also consults secondary sources such as national planning documents, national expenditure reviews, and CBOs' and NGOs' project budgets. Unit costs are calculated as follows: first, the total cost/expenditure to deliver a particular service/intervention is estimated, and this amount is divided by the total number of enrolled students benefiting from a given expenditure. Ideally, the unit cost per student at a particular education level should take into account recurrent and capital expenditures. Recurrent expenditures consist of spending on teachers’ wages (the largest spending item), instructional materials and operating expenses; capital expenditures consist of the costs of building a classroom and equipping it with desks, of constructing a toilet and of furnishing a classroom with electricity. The unit cost of educating a pre-primary child depends on a number of features, including the range of services offered, personnel ratios and the qualifications of the personnel. Generally, pre-primary costs are mostly influenced by the number of highly qualified full time staff and whether the institution provides services such as transportation, health and nutrition. Unqualified and part time ECCE personnel tend to not have a major impact on costs (Levin and Schwartz, 2006). The estimated pre-primary unit cost for Kisumu in our simulation is KShs. 2,180 per student. This amount is based on what the government provided to cover instructional materials, non-teaching staff costs and operating costs in 2006. The primary school unit cost is based on teacher salaries,43 FPE allocations for instructional materials and operating costs, as well as expenditures on physical facilities. Using data provided by the TSC, this study finds that Kisumu primary school teachers’ earnings are about 2.4 times GDP per capita.44
43 According to the 2007 Education Sector Report, about 80 percent of Kenya’s education sector’s recurrent spending went towards primary and secondary education, and most of this spending was for the payment of teachers’ salaries.
Each school also received Ksh 1,020 for each enrolled student for instructional materials and operating expenses. The funds were allocated to two accounts: the SIMBA (Account I) and General Purpose Account (Account 2). The KShs. 650 per student disbursement in the SIMBA Account represents the unit cost for instructional materials, while the KShs. 370 per child deposited in the GPA Account represents the unit cost for operations and maintenance. In 2006, the 114 Municipal public primary schools received a total of KShs. 95.5 million for FPE expenses from the central government.
44 Note: this is based on the GDP at the District level. Recent studies indicate that at the national level average primary and secondary teacher salaries are relatively high and correspond to about 5.3 to 6.1 percent of GDP per capita (Ulf, 2004, PER, 2006).

51
An evaluation of FPE argues that the KShs. 1,020 [$12.75] per child allocated to FPE by the MOE is insufficient because, on average, the per-year cost of educating a primary school student is about KShs. 6,154 [$76] per child (OWN & Associates, 2004). This means that the per child capitation grant of KShs. 1,020 leaves a shortfall of about KShs. 5,134 [$64], which parents or development partners and/or NGOs have to meet. The estimated total unit cost for primary schooling in our simulation is KShs. 9,671 [$121] per year. Table 11 lists the items funded by FPE and their costs. Table 11. Free Primary Education Expenses (2006) SIMBA Account (Account I) KShs. 650 for each student per year to all primary schools to be used to purchase:
General Purpose Account (GPA) KShs. 370 sent to all primary school to support:
Item Unit Cost (KShs)
Item Unit Cost (KShs)
Textbooks & Exercise books 486.00 Support staff wages 112.00 Supplementary readers and reference
128.00 Repairs, maintenance and improvements
126.00
Pencils 20.00 Support activities
44.00
Dusters, Chalk Register
8.00 Quality assurance (Examinations)
28.00
Charts and wall maps 8.00 Local Transport and Travel 22.00 Electricity, water, phone,
postage, etc. 38.00
Total Allocation per Student 650.00 370.00 Source: Kisumu MEO. November 23, 2006 Memo to Provincial Education Officer and October 2, 2006 by Mr. Steve Karaba, Director of Basic Education to District and Municipal Education Officers. Ref: FPE/CIR./06.
The unit costs for infrastructure at the primary level include KShs. 300,000 [$3,750] to construct one classroom and KShs. 50,000 [$625] to construct one toilet.45
Additional infrastructure unit costs taken into account include the unit cost for desks, which is based on total CDF allocation for the school desk project; the cost of constructing a school fence, which is estimated by the NGO HelpKenyaKids as KShs. 64,050.00 [$800] per school, and the unit cost for electrifying a school which is assumed to be KShs. 100,000 [$1,250] per school.
At the secondary school level, the KShs. 33,221 [$415] per year (2006) unit cost is composed of several elements, including teacher salaries, bursaries, expenses on instructional materials, operation expenses recorded on EMIS forms and infrastructure costs. This unit cost is based on a sample of 24 schools with 7311 students. At the post-secondary level, the unit cost of training, defined as the amount of money an institution spends on one student per year, is estimated to be between KShs. 110,000 and 120,000 [$1,375-1,500], which is unaffordable to
45 NGOs such as HelpKenyaKids have built basic pit latrines at a cost of KShs. 69,865 for a 3-toilet block. These classroom and toilet figures were derived from a MEO document showing the number of classes and latrines required at 50 schools and the estimated cost to build these facilities. Per-class and per-toilet unit costs are used instead of unit costs based on enrollments because, as Annex 4 shows, there is considerable variation in per student unit costs for classroom and toilet construction.

52
many families (Abagi and Owino, 1997; GOK 2007). This underscores the need for adequate bursaries to assist students joining polytechnics and technical institutions. 3.3 The Model The simulation model uses various policy assumptions about the school-age population growth rate, teachers, student-teacher ratio, flow rates (repetition and drop-out) and class size as key parameters in estimating resource needs. The major premises are that universal primary education can be achieved by providing students and teachers with instructional materials, expanding education facilities and reducing repetition and drop-out rates, especially for girls. Demand-side incentives that enhance primary school attendance and completion, such as school feeding programs, are also taken into account.
The main underlying assumptions are as follows: first, the local and central government are committed to attaining MDGs 1 and 2. Second, although the time frame for KESSP is 2005-2010, we assume that central government support to recurrent and development expenditures at Kisumu schools will be sustained through 2015. Specifically, the central government will continue paying for instructional materials (SIMBA Account) and operating costs (GPA Account). Third, for physical facilities, it is assumed that schools in Kisumu will also receive grants for school improvements through mechanisms such as the CDF and the School Improvement Fund, similar to the 2005/06 and 2006/07 allocations. Since physical facilities require substantial initial capital investments, funds for capital projects are spread out over a period of three to five years. The required costs derived in this study are based on targets specified in various policy documents, such as Sessional Paper No. 1 of 2005, KESSP 2005-2010, and Kisumu District Strategic Plan 2005-2010. These targets include:
i) student-classroom ratio - primary (40:1); secondary (35:1). ii) student-teacher ratio - (40:1) in primary, secondary (30:1). iii) Achievement of a transition rate of 70 percent from primary to secondary school.
While the determination of priorities needed to achieve the MDGs is a matter for local authorities, this study suggests possible frameworks of priorities and their costs. Three scenarios are simulated for the education sub-sectors: a baseline scenario; an efficiency scenario and a fast-track scenario. The policy options (targets) in each scenario are described below.
3.3.1 Baseline Scenario This scenario estimates the cost of reaching the MDG target of universal primary education and gender parity in primary education by 2015. At the primary school level, the target is to reduce student teacher ratio from 57 to 40 students per teacher and to decrease class size from 43 to 40 students per class both by 2015. At the secondary level, the student-teacher ratio is increased from 17 to 30 students per teacher and class size decreased from 41 to 30 students per class also by 2015. To ensure that education quality is maintained, an amount equivalent to five percent of teacher salaries is allocated each year to teacher training and staff development. The transition rate between primary to secondary school reaches 70 percent by 2015.

53
3.3.2 Efficiency Scenario This scenario is based on the notion that there is a need to improve efficiency and reduce wastage rates by 2015. Efficiency is achieved by reducing repetition and drop-out rates and by slightly reducing the number of teachers required. Repetition is also inefficient because when a student repeats a grade twice (or even three times), two (or three) times as many resources are used in the completion of a grade. It is equally important to significantly reduce the drop-out rate, because students who enroll in school but drop out before completing the full cycle of primary or secondary education represent a waste of resources. To improve efficiency, this study proposes that repetition rates should be lowered to at least one percent by 2015. There is also a need to further the effective and efficient use of teachers at the secondary school level, because EMIS forms show that the average teaching loads for secondary teachers in Kisumu in 2006 was 18 lessons per week. On average, teachers are expected to handle an average teaching load (ATL) of 20-23 lessons per week, if BOG teachers are not considered (Education Sector Report, 2006). It is important to ensure efficient use of available teaching staff because unnecessarily low teaching loads increase the costs per student (WB SEIA Report, 2007).
3.3.3 Fast-Track Scenario This scenario seeks to achieve the MDG goals in a shorter time frame: the targets specified in the Baseline scenario would be achieved in seven as opposed to nine years. Repetition is not allowed at the primary level; at the secondary level, repetition is reduced to 1-2 percent. Emphasis is placed on primary education, improving adult literacy rates and strengthening NFE. Salaries of primary school teachers are increased to 3 percent of GDP, while salaries of NFE teachers doubled to 2.6 percent of GDP. More funds are allocated to capital investments than in the other two scenarios.
Lack of classroom and teacher shortages are major challenges to the effort to achieve Universal Primary Education. Table 12 shows projections of the numbers of classrooms and teachers required, as well as estimates of required education expenditures for the Baseline in 2006 and for the Efficiency and Fast-Track scenarios in 2015. In the Baseline scenario, 1,116 existing primary school classes and 1,416 additional classrooms need to be built by 2015. In the Efficiency scenario, only the 696 classrooms identified as shortages by MEO in October 2006 would be built between 2007 and 2015. In the Fast-Track scenario, a total of 1,596 additional classrooms will be built by 2015. At the secondary school level, the number of classes starts to increase in 2011, when the cohort that started primary school in 2003 will begin Form 1.
To ensure that all children complete primary schooling by 2015, it is also assumed that the number of teachers has to increase. According to the simulation model, Kisumu would need to increase the number of primary teachers by about 90 percent if all children were to be in primary school in classes with an average size of 40 students. The dilemma is that recruiting more teachers obviously requires additional funds. Nevertheless, increasing the number of teachers would seem to be feasible given that simulation results show that only 54 percent of recurrent expenditure is for salaries.

54
Table 12. Classroom, Teachers and Investment Requirements 2010-2015 2010 2011 2012 2013 2014 2015 Average
BaselinePrimary School Costs Per Capita- (KShs) 2,354 2,500 2,662 2,834 3,008 3,097 2,743 Primary School Costs Per Capita- (USD) 31 33 35 38 40 41 37 Classrooms Required 1,812 1,992 2,172 2,352 2,532 2,712 Teachers Required 1,812 1,965 2,138 2,326 2,521 2,715
Secondary School Costs Per Capita (KShs) 765 868 940 1,020 1,121 1,241 992 Secondary School Costs Per Capita (USD) 10 12 13 14 15 17 13 Classrooms Required 391 436 491 631 771 971 Teachers Required 493 550 585 623 671 736 EfficiencyPrimary School Costs Per Capita- (KShs) 1,872 1,953 2,039 2,123 2,196 2,206 2,065 Primary School Costs Per Capita- (USD) 25 26 27 28 29 29 28 Classrooms Required 1,812 1,812 1,812 1,812 1,812 1,812 Teachers Required 1,756 1,874 2,001 2,131 2,252 2,360
Secondary School Costs Per Capita (KShs) 766 873 949 1,037 1,146 1,263 1,006 Secondary School Costs Per Capita (USD) 10 12 13 14 15 17 13 Classrooms Required 391 436 491 556 641 751 Teachers Required 500 561 600 644 699 764 Fast TrackPrimary School Costs Per Capita- (KShs) 2,505 2,715 2,956 3,096 3,150 3,169 2,932 Primary School Costs Per Capita- (USD) 33 36 39 41 42 42 39 Classrooms Required 1,812 1,992 2,172 2,352 2,532 2,712 Teachers Required 1,944 2,160 2,413 2,661 2,740 2,785
Secondary School Costs Per Capita (KShs) 806 954 1,081 1,214 1,434 1,619 1,185 Secondary School Costs Per Capita (USD) 11 13 14 16 19 22 16 Classrooms Required 391 436 491 631 771 971 Teachers Required 507 586 646 703 842 972
Source: Author’s calculations, based on EPSSIM simulations.
On the basis of the baseline simulation model, the average per capita investment needed for primary education during the period between 2006 and 2015 is $37. Simulation results show that between 2006 and 2015, salaries consume between 51 and 60 percent of the total recurrent expenditure at the primary and secondary levels, which implies that there should be sufficient resources left for operations and maintenance. In terms of access and equality, the projections show that 100 percent GER is attained by 2010, while gender parity is attained at each education sub-sector by 2015, except at the tertiary level. In terms of quality and efficiency, survival rates are over 100 percent for most of the 2006-2015 period, while the wastage rate drops from about 50 percent in 2006 to about 4 percent in 2011, indicating a high level of retention and lower incidence of drop-out. Table 13 presents some efficiency indicators.
Table 13. Efficiency Indicators
Primary 2006 2010 2015 Survival rate M 95.5% 102.4% 98.3% Survival rate F 102.0% 103.6% 100.0% Wastage rate M 51.7% 11.1% -1.2% Wastage rate F 48.8% 10.4% -2.5% Coefficient of efficiency M 65.9% 90.0% 101.3% Coefficient of efficiency F 67.2% 90.6% 102.6%

55
The hypotheses which generated the three alternative scenarios, discussed earlier, are summarized below.
Figure 10 shows the recurrent costs for formal and non-formal education under the three scenarios. Figure 10: Recurrent Costs, All Levels Except Tertiary
Baseline Efficiency Fast Track At the primary level, reduce pupil-teacher ratio from 57 to 40, and reduce class size from 43 to 40 by 2015. At the secondary level, increase pupil-teacher ratio from 17 to 30 students per teacher, and reduce class size from 41 to 35 by 2015. At the tertiary level, increase pupil-teacher ratio by reducing number of teaching posts.
Efficiency is achieved by slightly reducing the number of teachers needed at primary (-261), secondary (-152) and tertiary (-66). In addition, only the 696 primary classrooms identified as shortages by MEO are built between 2007 and 2015 (about half of schools built in Baseline). Efficiency is also achieved by reducing repetition and drop-out rates and increasing lessons per week taught by secondary school teacher from 20 to 23.
Frontloading is introduced to achieve targets faster. The number of years to achieve targets is reduced to 7. Repetition is not allowed at primary level. At secondary level, repetition is reduced to 1-2%. Salaries of primary school teachers are increased to 3% of GDP, salaries of NFE teachers doubled to 2.6% of GDP. 100% of teachers are trained.
Recurrent Costs: All Levels Except Tertiary
0
500,000,000
1,000,000,000
1,500,000,000
2,000,000,000
2,500,000,000
3,000,000,000
2006 2010 2015 2018
Baseline Efficiency Fast Track

56
Figure 10 shows that the Efficiency scenario is the least costly alternative for Kisumu Municipality to attaining the education MDGs, while the Fast-Track is the most costly alternative. Moreover, between 2010 and 2015, recurrent costs increase much faster than during the period between 2006 and 2010. This suggests that, even under the Efficiency scenario, additional resources from international development partners will be needed. 3.3.4 School Mapping In an attempt to obtain a picture of the city’s existing educational resources, one of the activities undertaken during the needs assessment exercise was to produce a map showing distribution of educational facilities in Kisumu Municipality. School mapping is a valuable tool for monitoring achievements toward the Millennium Development Goals because it can provide visible explanations to available quantitative information. For instance, a Geographic Information System (GIS) database can be complemented with EMIS data on enrollments, number of teachers and educational resources to assist policy makers in obtaining answers to questions such as, where are new schools needed, or where is the nearest location to where students can obtain primary or secondary education? This can be done by first identifying the location of each school and then linking this information to corresponding education statistics and indicators databases. The government of Kenya recognizes the importance of school mapping and has initiated fieldwork aimed at getting the spatial data in all 72 districts and four municipalities in the country. This includes obtaining the names of the schools, their locations (latitudes and longitudes) and the salient features within the school environment. At the time the Kisumu Education Needs assessment mission was conducted, however, the Kisumu Town Planning Office had not yet mapped schools using a global positioning system.46
The school mapping exercise was completed in 2008 and the Ministry of Education provided spatial data used to compile the maps on pages 19-21. It should be noted, however, that when this report was completed, the data has not been validated. Nonetheless, maps showing the distribution of schools can help policy makers identify underserved areas as well as locations where the neediest populations are located.
IV. CONCLUSION AND RECOMMENDATIONS The findings of this needs assessment show that, in fact, Kisumu Municipality is on track to meeting the Millennium Development Goals (MDGs) for the education sector by 2015. The disbursement of per capita grants to primary schools by the central government has promoted access to education by easing the cost burden borne by parents. Bursary funds have enabled many eligible low-income students to attend secondary school. Progress has also been made in reducing gender disparities at all levels of education. Nonetheless, significant challenges still remain. First, public primary schools in Kisumu need additional physical facilities such as classrooms, toilets, libraries, laboratories and desks. In coming years, it will be critical to continue renovating existing facilities to accommodate increasing numbers of students. Second, girls, poor children and orphans are vulnerable to dropping out before completing six years of primary schooling. This trend needs to be addressed as it leads to inefficiency and a waste of 46 The school mapping exercise was completed in 2008.

57
resources. School feeding programs and targeted assistance to disadvantaged students can reduce drop-out rates and enhance completion rates. Third, existing initiatives that strengthen education quality, such as teacher training and the provision of instructional materials, need to be vigorously implemented. Fourth, there is a need to improve timely collection of EMIS data in Kisumu. EMIS is an important tool because it can reliably capture enrollment and other key educational statistics. As a recent Association for the Development of Education in Africa (ADEA) newsletter article observes, “Well-managed …statistical information services are essential to viable policy formulation and efficient investments in education.”47
Distributing EMIS forms and collecting up-to-date EMIS data are both critical to tracking performance and progress against global policy goals such as the MDGs or EFA. The following summarizes additional recommendations based on this study’s findings.
At the pre-primary level, a significant portion of the pre-primary teaching and support staff are untrained; hence there is an urgent need for in-service training investments. The MOE could also integrate four- to five-year-old children into primary education, thereby extending the education system from 8-4-4 to 2-8-4-4. However, this possibly carries the risk that some parents will opt not to enroll their children in pre-primary institutions and will choose to wait to enroll their children until they are old enough to attend primary school. A preferable alternative is to make pre-primary education free and compulsory for all children between the ages of four and five year olds. At the primary school level, the priority need is for the central government to continue 1) providing capitation grants to primary schools for instructional materials and operational needs, and 2) investing in physical infrastructure. There is also a need to reduce repetition and drop-out rates, as well as high student/teacher ratios in some schools. Moreover, school feeding programs, particularly in the city’s slum areas, need to be actively supported, as they increase enrollments and reduce student attrition. In addition to addressing the aforementioned challenges, the government also needs to make primary education compulsory. This policy should clearly delineate penalties for parents and guardians who fail to enroll their children in school. Such a policy might reduce gender disparities and other inequities in education, because poor families tend to favor educating sons rather than daughters.48
Schools also need to become more 'girl-friendly.’ Programs such as the construction of school latrines and the provision of sanitary products deserve to be supported and strengthened by all stakeholders, as they have been shown to increase girls’ participation in school.
At the secondary school level, the most pressing challenge is low participation rates due mostly to prohibitive costs and low primary-to-secondary transition rates. To ensure that poor segments of Kisumu’s population are not excluded from participating in secondary school, the bursary scheme needs to be strengthened. To accommodate increases in primary school enrollments, the number of secondary schools also needs to increase. At the tertiary level, there is a need to reduce gender disparities and to provide bursaries and loans to poor students who have been accepted to universities. For instance, initiatives such as 47 The article was written by the Coordinator of the Working Group on Statistics and published during the August 6-10, 2007 Conference of African Ministers of Education (COMEDAF III) held in South Africa. 48 Research has shown that poorer families tend to assume that male children will care for them in old age, but that they perceive investing in the education of daughters as a waste because daughters will live with their husbands' families.

58
the Revolving Loan Fund, which seeks to assist low-income earners who cannot access credit from banks, need to be promoted. The resources needed to finance the education sector are undoubtedly likely to increase in coming years. The central government and households will find it difficult to defray mounting costs unless they continue to work closely with development partners and expand public-private partnerships. Public-private partnerships can take several forms, including 1) encouraging private entities to deliver education or 2) governments providing incentives such as tax rebates to investors in education. Such initiatives could reduce the costs borne by the central government and parents, while widening the local human capital pool that private companies can tap into. In addition to financial support, private firms and wealthy individuals can also contribute material and logistical support to schools in the communities where they operate. It is also important to recognize that the city experiences high levels of unemployment for both skilled and unskilled labor. With limited job opportunities in Kisumu, unless initiatives to create job opportunities for graduates are implemented, the city will be inundated with too many educated people and too few job opportunities. In 2006 Kisumu already had a 30 percent unemployment rate (UN-HABITAT, 2006). If high unemployment rates persist, and if upon graduation, young people cannot find employment, they are likely to be disillusioned and resort to destructive lifestyles, including prostitution and crime. Therefore, no education MDGs can actually be considered to have been achieved until a substantial number of local job opportunities that capitalize on an educated population have been created. In this, as in other areas (e.g. public health, gender equality, community empowerment), it cannot be overemphasized that the education MDG targets will only be achieved with active support from all stakeholders, parents, the central government, local authorities, development partners and the private sector.

59
REFERENCES Abagi, O. (1997). “Public and private investment in primary education in Kenya: An agenda for
action,” Nairobi: Institute of Policy Analysis and Research Discussion Paper No 005/97 Abagi, O. and Owino, W. (2000). “Cost sharing in education and health in Kenya,” Nairobi:
Institute of Policy Analysis and Research (IPAR). Altbach, G. and Damtew, T., eds.(2003). African higher education: An international reference
handbook. (Bloomington: Indiana University Press). ANPPCAN (2005). Review of the status of provision of education to all children in Kenya
(Nairobi: Strategic Public Relations and Research Ltd). Arnott, A. (2007, August 10). “Keeping track is vital,” ADEA Newsletter Special Issue
COMEDAF III, Mail &Guardian. Atchoarena, D. and Delluc, A. (2001). “Revisiting technical and vocational education in Sub-
Saharan Africa: An update on trends, innovations, and challenges,” IIEP/Prg. DA/01.320. (Paris: UNESCO International Institute for Educational Planning)
Bharadwaj, S. and Patkar, A. (2004). “Menstrual hygiene and management in developing
countries: Taking stock,” Available at http://www.schoolsanitation.org/Resources/Readings/Bharadwai-2004-Menstrual.doc
Boler, T. and Jellema, A. (2005). “Deadly inertia: A cross-country study of educational
responses to HIV/AIDS,” Brussels: Global Campaign for Education. Buckland, P. (1995). “Making quality basic education affordable: what have we learned?” Central Bureau of Statistics (2005). “Geographic dimensions of well-being in Kenya: Who and
where are the poor?” Ministry of Planning and National Development, Nairobi: Government of Kenya. Available at http://www.worldbank.org/research/povertymaps/kenya/volume_index.htm
-- (2002). “Analytical report on population dynamics, Kenya 1999 Population and Housing Census, Vol. 3” Ministry of Planning and National Development, Nairobi: Government of Kenya. -- (1999). Kenya Population Census 1999: Analytical Reports (10 volumes). Nairobi, Government Printer.
Chege, F. and Sifuna (2006). “Girls’ and women’s education in Kenya: Gender perspectives and
trends,” Nairobi: UNESCO. Connolly, M. and Monasch, R. (2003). Africa’s orphaned generations (New York: UNICEF)

60
Ekundayo J.D.T. (2001). “Non-formal education in urban Kenya: Findings of a study in Kisumu, Mombasa and Nairobi,” ADEA/GTZ.
Government of Kenya (1999). “Commission of inquiry into education system of Kenya, totally
integrated quality education and training,” Nairobi: Government Printer. Government of Kenya/United Nations – Kenya. (2003). “Millennium Development Goals:
Progress Report for Kenya.” Government of Kenya, Ministry of Planning and National Development (2004). “Achieving
Millennium Development Goals: A needs assessment and costing report.” Government of Kenya, Ministry of Planning and National Development (2005a). “Sessional
Paper No. 1 and 2 of 2005 - a policy framework for education, training and research,” Nairobi: Government Printer.
Government of Kenya (2005b). “Kisumu District Strategic Plan (2005 – 2010) for the
implementation of the national population policy for sustainable development,” Nairobi: National Coordinating Agency for Population and Development.
Government of Kenya (2006a). “Public expenditure review [PER]: Enhancing the effectiveness
of public spending: special focus on the social sector.” Government of Kenya (2006b). Education Sector Report, Nairobi: Government Printer. Government of Kenya (2007). Education Sector Report, Nairobi: Government Printer. Government of Kenya (1998). Master Plan on Education and Training, 1997-2010. Nairobi:
Government Printer. Government of Kenya, Central Bureau of Statistics (2007). Economic Survey 2007. Nairobi,
Government Printer. IPAR (1999). “Pre-Budget Analysis of the Education Sector,” Policy Quarterly, Issue 1.
- (2003). “Education Financing in Kenya,” Policy Brief, 9(2).
- (2007). “Making Public Secondary Education Affordable,” Policy View, Issue 3. Kelly, M. J. (2000). “Standing Education on its head: aspects of schooling in a world with
HIV/AIDS,” Current Issues in Comparative Education 3 (1): 1-7. Kenya NGO CRC Committee (2006). “Implementation of the United Nations Convention on
the Rights of the Child (UNCRC) in Kenya.” Kimani, M. (2007, October 25) “Schools Told Not to Budget for 2008 without Decree.”
Business Daily, Available at http://allafrica.com/stories/200710251267.html

61
Kisumu City Council (2005). “The Kisumu City Environmental Profile on Sustainable Urban Mobility.”
Kimutai, V., Ngamau, M. and Mureu, L. (2006) “Answer to urban woes.” Kosgei, K.C. (2006). “DEO Education Brief presented to the Parliamentary Education
Committee in March 2006 and to the Ministry of Education in July 2006.” OWN and Associates (2004). “Monitoring of the free primary education and establishing the
unit cost of primary education in Kenya,” Nairobi: Center for Research and Development.
Nafula, N. N. (2001). “Achieving sustainable universal primary education through debt relief:
The case of Kenya,” Paper presented at a conference on Debt Relief and Poverty Reduction, World Institute for Development Economic Research, Helsinki, Finland.
Narayan, D. (1997): “Voices of the poor: poverty and social capital in Tanzania,” Washington
DC: World Bank. Ngware, M. W. and Nafukho, F. M. (2002). “The Quality and utilization of technical education
trainers in Kenya,” Journal of Industrial Teacher Education, 39 (2). Ngome, C. (2003). “Overview of skills development in Kenya: constraints and prospects”
NORRAG NEWS 32 August, Centre of African Studies, University of Edinburgh, Edinburgh. http://www.strathmorefoundation.org/IFCNewsletteraboutKenyaEd.html
Nzioka, C., Korongo, A. and Njiru, R. (2006). “Mitigating the impact of HIV and AIDS in
teacher training colleges in Kenya,” Paris: Available at: http://hivaidsclearinghouse.unesco.org/ev_en.php?ID=7457_201&ID2=DO_TOPIC
Oluoch, P. A. (2002). “Low participation in adult literacy classes: Reasons behind it.” Riechi, A.M., Mbiti, D. M., and Kisilu, B. (2006). “Policy gaps and suggested strategies of
enhancing access to early childhood development and education in Kenya,” IPAR Discussion Paper No. 089/2006.
Rugh, A. (2000). “Starting Now: strategies for helping girls complete primary,” Washington
DC: Academy for Educational Development, SAGE Project. Ruto, S.J. (2004). “The contribution of non-formal schools in enhancing the provision of basic
education in Kenya,” PhD dissertation, University of Heidelberg Germany. Society for International Development [SID] (2006). Readings on Inequality in Kenya: Sectoral
Dynamics and Perspectives, Nairobi: Regal Press Kenya Ltd. Ulf, Fredriksson (2004). “Quality education: The key role of teachers,” Education International
Working Papers no. 14.

62
UNAIDS/UNFPA/UNIFEM (2004) Women and HIV/AIDS: Confronting the Crisis, New York: UNAIDS/UNFPA/UNIFEM.
UNESCO (2005). “Challenges of implementing free primary education in Kenya: Experiences
from the districts,” Nairobi: UNESCO. UNESCO and Kenya Ministry of Education. (2005). “The Background Report of Kenya: A
report for the UNESCO/OECD Early Childhood Policy Review Project,” ED/BAS/EIE/7.
UNDP (2006). Kenya National Human Development Report: Human security and human
development. Nairobi: UNDP. UNICEF/UNAIDS/USAID (2004). Children on the Brink: A Joint Report on Orphan Estimates
and a Framework for Action. New York: UNICEF. UN-HABITAT (2006). “Managing the HIV/AIDS Pandemic at the Local Level: Experience
from Kisumu.” Available http://www.unhabitat.org/downloads/docs/4058_85367Kisumu.pdf
WFP (2004). “HIV/AIDS and school feeding: Children at risk,” Available at
http://www.wfp.org WHO (2004). “Kenya Epidemiological Fact Sheet,” Available at
http://data.unaids.org/Publications/Fact-Sheets01/Kenya_EN.pdf World Bank (1997). “Staff Appraisal Report Republic of Kenya Early Childhood Development
Project,” Africa Technical Human Development, Eastern and Southern Africa Region. Report No. 15426-KE.
---- (2001) Engendering Development. World Bank Policy Research Report: Washington
D.C., and Oxford: World Bank and Oxford University Press.
--- (2007). Secondary Education in Africa (SEIA) Synthesis Report: Available at http://web.worldbank.org/WBSITE/EXTERNAL/COUNTRIES/AFRICAEXT/EXTAFRREGTOPEDUCATION/EXTAFRREGTOPSEIA/0,,contentMDK:21196809~pagePK:34004173~piPK:34003707~theSitePK:732077,00.html

63
Annex 1: List of Key Informants Key Informants 1. Mrs. Pamela Akello (Transferred) 2. Mr. George Omondi
Municipal Education Officer Deputy Municipal Education Officer
3. Mr. Richard Abayo District Statistics Officer 4. Mr. Abdilkhadir Kike (Transferred) 5. Mrs. Beatrice Lukalo
District Education officer Staffing Officer
6. Mrs. Jane Mata 7. Mr. Sampson Kodade (Retired)
Area Education Officer (Winam) and Quality Assurance Officer
8. Mr. Steve Karaba (Retired) 9. Mr. Yator
Director, Basic Education at Ministry of Education Assistant to Mr. Karaba
10. Mr. Charles Obiero 11. Mr. Newton Akwatsa
Ministry of Education – Non-Formal Education
12. Mrs. Caroline Omenda 13. Mr. Otieno Jimmynaws
Kisumu District Adult Literacy Officer Deputy District Adult Literacy Officer
14. Mr. Charles Ngira (Transferred) Kisumu Municipal Town Planning Officer 15. Mr. G.M. Mailu National Project Coordinator- MDG Unit 16. Mr. Simon Ochieng Kisumu District Development Officer 17. Mrs. Jane Rono District Children’s Officer 18. Mr. Daniel Okuta District Statistics Officer, Kisumu 19. Mrs. Rebecca Butalanyi District Education Officer, Kisumu East Annex 2: Research Team Moumié Maoulidi, Columbia University Teachers College. Mrs. Pauline Mwangi, United Nations Volunteer and MDG Program Officer, Bungoma District.

64
Annex 3: Targets and Interventions Targets Pre-primary education • 100 percent pre-primary education coverage by 2015. Primary education • Universal primary enrollment should be achieved by 2011, 100 percent primary completion rate should be achieved by 2015. • 70 percent of primary school children should transition from primary to secondary school. Secondary education • 70 percent of primary school children should transition from primary to secondary school. • Gender parity at the secondary level should be achieved by 2015. Adult literacy • 100 percent adult literacy rate by 2015. Interventions Interventions with the potential to increase enrollment and completion. Pre-primary education • Provision by government of funding for learning materials and operating costs. • Teacher training. • Physical facilities. Primary education • Infrastructure provision, including classrooms and toilets (especially toilets for girls). • Human resources, including hiring and training teachers and non-teaching support staff. • Learning materials, including textbooks, writing materials. • School feeding programs and provision of clean drinking water. Secondary education • Infrastructure provision, including classrooms, toilets, laboratories, libraries. • Hiring and training of teachers. • Continued provision of bursaries. Tertiary Education • Infrastructure provision, including construction of buildings (classrooms, laboratories, offices and dormitories). Non-Formal Education • Provision of learning materials, including textbooks and writing materials. • Funding for operating costs and payment of teaching staff salaries.

65
Annex 4: Estimated Costs for Classroom and Toilet Construction
SCHOOL ENROLLMENT CLASSES REQUIRED
LATRINES REQUIRED
ESTIMATED COST IN KSHS (MIL)
WESTERN DIVISION Akingli 191 6 6 2.1 Bara 222 6 4 2 Dago-Thim 713 2 6 0.9 Gee 279 4 6 1.5 Kanyamony 206 6 4 2 Kodiaga 1064 4 6 1.6 Lisuka 324 6 6 2.1 Nawa 118 4 6 1.5 Ngege 147 8 6 2.7 Ogongo 305 4 6 1.5 Ongalo 501 6 4 2 Osiri 347 4 4 1.4 Oyiengo 320 8 8 2.8 Rota 295 8 4 2.6 Thim-Bonde 246 4 6 1.5 Usari 390 4 3 1.35 Usoma 283 4 4 1.4 Yath-Rateng 354 6 6 2.1 EASTERN DIVISION Angira 222 8 4 2.6 Bungu 210 6 5 2.05 Bwanda 124 4 5 1.45 Got Nyabondo 383 4 5 1.45 Kibos 394 5 6 1.8 Kindu R.C 453 3 6 1.2 Kondele 1313 4 6 1.5 Kunya 325 4 5 1.45 Nyaimbo 259 6 5 2.05 Nyamonge 429 4 4 1.4 Obinju 758 5 4 1.7 Obino 378 4 6 1.5 Obwolo 13.5 4 6 1.5 Ofunyu 336 5 5 1.75 Ogango 667 4 6 1.5 Okago 266 4 6 1.5 Omungi 264 5 6 1.8 Oyola 287 6 4 2 Ragumo 319 4 6 1.5 Renja 375 4 6 1.5 Rweya 312 5 6 1.8 St. John Oriang 484 5 5 1.75

66
SCHOOL ENROLLMENT CLASSES
REQUIRED LATRINES REQUIRED
ESTIMATED COST IN KSHS (MIL)
URBAN DIVISION Joel Omino 1661 3 4 1.1 Kaloleni 290 2 4 0.8 Kassagam 1457 4 10 1.7 M.M Shah 1115 4 6 1.5 Manyatta Arab 329 4 6 1.5 Mathew Ondiek 434 4 4 1.4 Pandpieri 1690 4 10 1.7 St. Mark’s Nyabera 791 3 4 1.1 Xaverian 746 2 4 0.8 Victoria 947 2 4 0.8 TOTAL 24336.5 229 268 82.2 Source: Kisumu Municipal Education Office. Document MEO/ADM/10/VOL XIII(116), 7 September 2006.

67
Annex 5: Per Student Unit Costs for Infrastructure UNIT COST PER PUPIL (INFRASTRUCTURE) - URBAN DIVISION
0
500
1000
1500
2000
2500
3000
3500
4000
4500
5000
Joel Omino Kaloleni Kassagam M.M Shah ManyattaArab
MathewOndiek
Pandpieri St . MarkÕsNyabera
Xaverian V ictoria
SCHOOL NAM E
UNIT
COST
UNIT COST PER PUPIL UNIT COST PER PUPIL (INFRASTRUCTURE ) - WESTERN DIVISION
0
2000
4000
6000
8000
10000
12000
14000
16000
18000
20000
Akingli
Ba ra
Dago-Thim Gee
Kanyam
onyKodiag
aLisu
kaNaw
aNgeg
e
OgongoOngalo Osiri
Oyiengo
Rota
Thim-Bonde Usari
Usoma
Yath-Rate
ng
SCHOOL
UNIT
COST
UNIT COST PER PUPIL UNIT COST PER PUPIL (INFRASTRUCTURE) - EASTERN DIVISION
0
20000
40000
60000
80000
100000
120000
AngiraBungu
Bwanda
Got Nyabondo Kibos
Kindu R.C
Kondele
Kunya
Nya imbo
Nya monge
Obinju
Obino
ObwoloOfunyu
Ogango
Okago
Omungi
Oyola
Ragumo
RenjaRweya
St. John O
riang
SCHOOL NAME
UNIT
COST
UNIT COST PER PUPIL

68
Annex 6: Kisumu Municipality- Non-Formal Schools and Education Centers SCHOOL NAME 1. Korando Faith Widow & Orphans 2. Disciples of Mercy (now a formal school) 3. Orongo Widow and Orphans 4. Covenant 5. Lapema Women Group 6. Young Generation 7. Dago Widows and Orphans 8. Ring Road 9. Dunga Orphanage 10. Obambo Perspective 11. Bungu Orphans and Widow 12. Life of Faith 13. Wakilisha Self Help Group 14. St. Rita Women Group 15. Bandani Muslim 16. Mary Magdaline Women Group 17. Joordon Children Centre 18. Agape Children’s Home 19. Kadhiga Community Development 20. Osari 21. Good Hope Orphans Support 22. Zerafath 23. Little Gokul 24. Umbrella 25. Ober 26. Ondire Source: MEO/ADM/NFEC/02. Document prepared for Principal Secretary Ministry of Education, 2006.49
49 Some of the documents retrieved from the MEO list 21 schools, while others list 26 NFE schools/centers.
.

69
Annex 7: NGOs and CBOs Assisting Orphans and Vulnerable Children in Kisumu
NAME OF NGO ASSISTANCE OFFERED Christian Children Fund Care and Support of Vulnerable Children Africa Now Child-to-Child Peer Education World Vision School Building Improvement and
provision of learning equipment. HelpKenyaKids School Construction, Sanitation Sustainable Aid in Africa (SANA) Water and Sanitation Activities Pandpieri Non-Formal Education and Support to
OVCs, including street children Undugu Society Support to Street Children, including skills
training.
NAME OF CBO ASSISTANCE OFFERED St. Rita Women Group Education, Clothing, Medication, Feeding Korando Faith Widow & Orphans Education, Clothing, Medication, Feeding Orongo Widow and Orphans Feeding , Clothing, Medication Lapema Women Group Education, Feeding, Clothing Bungu Orphans and Widow Education, Feeding, Clothing Wakilisha Self Help Group Education, Clothing, Medication, Feeding Bandani Muslim Clothing, Uniform, Counseling Mary Magdaline Women Group Education, Feeding, Clothing Agape Children’s Home Education, Feeding, Shelter, Clothing Good Hope Orphans Support Group Clothing, Uniforms, Medication, Feeding Zerafath Education, Feeding, Clothing Little Gokul Education, Clothing, Medication, Feeding Umbrella Education, Clothing, Medication Ondire Education, Mediation, Clothing, Feeding Source: MEO/ADM/NFEC/02 compiled by Elius Oganda.

70
Annex 8: Donors/International Agencies and Educational Activities
NAME
CATEGORY
ACTIVITIES/PROGRAMS
REGIONS/DISTRICTS
COVERED UNICEF
UN
• Non-formal education • Girl child education (EFA
follow up) • Early childhood care and
development • Aids prevention
education in schools
Kisumu, Mombasa, Nairobi, Baringo, Garissa, Kwale, Kisumu Municipality, Kisumu District, Nairobi, Homa Bay, Migori, Busia, Kwale, Mombasa
UNESCO UN • Institutional support and training
• Policy and advocacy • Research, M & E
National Programs
WORLD BANK
Multi Lateral • ECD and Strengthening of Education at Primary and Secondary levels
National Programs
DFID Bilateral • Strengthening Primary Education (SPRED)
• Primary School management (PRISM)
• In-service Teacher Training
National Programs
SIDA Bilateral • FPE National Programs IDA Multi-lateral • Public Universities
Investment Project All the public universities through the Commission for higher Education (CHE).
WFP Multi-lateral • School feeding Programs (Primary & Pre-primary schools)
• Assistance to
disadvantaged urban children
Moyale, Marsabit, Wajir, Garissa, Mandera, Samburu, Turkana, Isiolo, Tana River, Baringo, Koibatek, Kajiado, Narok, Laikipia, Mwingi, Mbeere, Kilifi, Kwale, Lamu and West Pokot. Mukuru and Kariobangi slums
Source: (OWN & Associates, 2004).