Education spending in the UK › ... · Education spending in the UK By Paul Bolton Contents: 1....
24
www.parliament.uk/commons-library | intranet.parliament.uk/commons-library | [email protected] | @commonslibrary BRIEFING PAPER Number 1078, 9 October 2019 Education spending in the UK By Paul Bolton Contents: 1. Definitions of education spending and breaks in time series 2. UK public expenditure on education since 1979 3. Expenditure on student loans 4. Long term trends in public expenditure 5. International comparisons 6. Reference tables 7. Appendix –Trends in education spending v population change
Transcript of Education spending in the UK › ... · Education spending in the UK By Paul Bolton Contents: 1....
www.parliament.uk/commons-library | intranet.parliament.uk/commons-library | [email protected] | @commonslibrary
BRIEFING PAPER
Number 1078, 9 October 2019
Education spending in the UK
By Paul Bolton
Contents: 1. Definitions of education
spending and breaks in time series
2. UK public expenditure on education since 1979
3. Expenditure on student loans 4. Long term trends in public
expenditure 5. International comparisons 6. Reference tables 7. Appendix –Trends in
education spending v population change

2 Education spending in the UK
Contents Summary 3
1. Definitions of education spending and breaks in time series 5
2. UK public expenditure on education since 1979 6 2.1 Education expenditure since 1979 6 2.2 Education spending and population change 8 2.3 Education and training since 1987 9 2.4 Breakdown of spending in recent years 10
Expenditure by region and nation 12
3. Expenditure on student loans 14 3.1 ONS review 14 3.2 Impact of including spending on loans from 2011-12 14
4. Long term trends in public expenditure 16
5. International comparisons 18
6. Reference tables 19
7. Appendix –Trends in education spending v population change 21

3 Commons Library Briefing, 9 October 2019
Summary Since 1979…
The real level of public spending on education in the UK was static in the early 1980s. It increased gradually from the mid-1980s to the early 1990s before falling slightly in 1995-96 and 1996-97. After then it increased to new record levels in each year to the peak in 2010-11. The Government has removed spending on the subsidy element of student loans from data from 2011-12 onwards. Despite this break in the series there was a clear decline in spending in the five years from 2012-13 to 2017-18. The increase in 2018-19 was the first since 2010-11.
When expressed as a proportion of GDP, education spending peaked in 2009-10 and 2010-11 at around 5.7%, its highest since the mid-1970s. The subsequent decline has taken it down to 4.2%. There was a small increase in 2018-19, the first since 2009-10.
Since 1950…
Public expenditure on education increased as a proportion of GDP throughout the 1950s, 1960s and early 1970s. It peaked at 5.8% in 1975-76 before declining for the rest of the decade and much of the 1980s. It briefly increased in the early 1990s before
UK public expenditure on education, £bn% of GDP
'Consolidated current and capital expenditure
by the public sector'
'Education and related expenditure by public
authorities' 'GGE/TME/Expenditure on services -education'
0%
1%
2%
3%
4%
5%
6%
0%
1%
2%
3%
4%
5%
6%
1950-51 1960-61 1970-71 1980-81 1990-91 2000-01 2010-11
2017-18 prices % of GDP
Public expenditure on education
-
£20bn
£40bn
£60bn
£80bn
£100bn
1979-80 1986-87 1993-94 2000-01 2007-08 2014-150%
1%
2%
3%
4%
5%
6%
1979-80 1986-87 1993-94 2000-01 2007-08 2014-15
education and trainingeducation
4 Education spending in the UK
falling back to a recent low of 3.9% in the late 1990s. From the late 1990s it increased in each of the next 12 years to 5.5% in 2010-11. A break in the series in 2011-12 limits the comparisons with later years, however, it is clear than education spending fell as a % of GDP in each year from 2011-12 to 2017-18. This was the longest continuous period of decline in this measure for the period covered here.
By level… Almost 80% of education spending went on schools -primary and secondary education. The relatively low share going on tertiary (higher) education reflects the fact that the data exclude the subsidy element of student loans which forms the majority of higher education spending in England.
Within the UK… Public spending per head on education in 2016-17 was highest in Scotland at around £1,550, followed by £1,490 in London and £1,440 in Northern Ireland. It was lowest in the South East and South West of England at around £1,200.
If spending on loans was added back in… Spending still fell in real terms and as a percentage of GDP after 2010, but by a smaller amount than official figures (currently) show. Real spending levels have stabilised or increased slightly in the past few years.
Compared to other countries… OECD analysis puts UK public spending on education at 4.2% of GDP in 2016. This was 12th highest out of the 34 OECD members with data on this measure and higher than the OECD average of 4.0%. If private expenditure on education is included then the UK’s total spending on education in 2016 was 6.2% of GDP, Only Norway (6.5%), New Zealand (6.4%) and Chile (6.3%) had higher figures.
This paper looks at trends in public sector education expenditure in the UK. Some more detail can be found in Public expenditure statistical analysis 2018 including a breakdown of total expenditure by type of education and spending in total and per head in the different parts of the UK. The annual report and accounts of the Department for Education includes more technical detail of spending in the most recent year and, in appendices, plans to the end of the current spending review period. Chapter B of the OECD’s Education at a Glance 2018 compares education spending across OECD and other countries.
The briefing paper Higher education funding in England looks in detail at spending on higher education in England. The Department for Education publishes a wide range of data and analysis on school funding and expenditure in England under different headings. The most useful can be found at: Statistics: local authority/school finance data, School and college funding and finance and Section 251 documents.
Where did spending go in 2018-19?
£bn % of total
Pre-primary 4.2 5%Primary 26.4 30%Secondary 43.1 49%Tertiary 4.5 5%Subsidiary services 3.5 4%R&D 2.5 3%Training 2.2 3%Other 1.4 2%
Total 87.9 100%

5 Commons Library Briefing, 9 October 2019
1. Definitions of education spending and breaks in time series
Section 2 of this paper looks at two main series; total UK public expenditure on education and total UK public spending on education and training. These have not been explicitly distinguished in recent official statistics on public spending, but this note uses the former descriptions where ‘education’ excludes the ‘education not elsewhere classified’ sub-function1 and ‘education and training’ includes it. The definition of this sub-function has not changed, but official statistics now use education to refer to what was known as education and training in the past.
This paper retains the distinction between the terms for two reasons. First the education and training series only goes back to the late 1980s, while the education series goes back much further, even with some breaks in the series the concept remains the same. Second the education and training series is more consistent over the period it is available for. The spending data are regularly revised. These revisions can change the total figure, or move items of expenditure from one sub-function to another. The detailed breakdown by sub-function is only revised back five years. This presents a problem with consistency when trying to compile long-term series based on sub-functions and the authors warn against simply splicing one set of data with another pre and post-revision. The education and training series in this paper is therefore consistent for its entire length, other than the break in 2011-12 detailed below. The education series is not and although revisions are generally quite small, readers should be careful when drawing conclusions from this data, especially those based on small differences.
The Government has recently removed the subsidy element of student loans from its public spending data. Previously a proportion of the face value of loans made each year2 counted towards public spending. This causes a break in the series, in 2011-12, but also means that trends afterwards are affected as an increased amount of funding for higher education in England shifted from direct public spending to loans. Section 3 looks at the impact of this and plans to bring it back within public spending data.
The detailed breakdown of education spending by level includes all expenditure on academies in England under ‘secondary education’ despite many academies being primary or special schools. This skews trends in spending by level and affects comparisons within the UK.
1 The Government uses the UN Classifications of the Functions of Government to
classify spending by function and sub-function. 2 The present value of the amount the Government forecast would not be repaid.

6 Education spending in the UK
2. UK public expenditure on education since 1979
2.1 Education expenditure since 1979 Real spending levels have gone through five distinct phases as illustrated below; no change in the early 1980s, growth through to the mid-1990s, no change to the end of the 1990s, rapid growth in spending to 2010-11 and cuts in real spending from 2011-12 to 2017-18. The recent falls in spending were the first since the mid-1990s, but, despite spending falling from its peak, levels in 2017-18 were still higher than in 2004-05 or any previous year. The real increase in 2018-19 was the first since 2010-11.
The growth in spending from 1998-99 to 2010-11 is very clear, as is the fact that absolute annual increases were much larger than in the previous sustained period of increase (mid 1980s to mid 1990s). The only periods where real spending fell for two consecutive years were 1983-84 to 1985-86, 1994-95 to 1997-98 and 2012-13 to 2017-18. Spending in 2018-19 was £86.8 billion; more than double the level seen in the mid-1980s.
Sources: See table 1
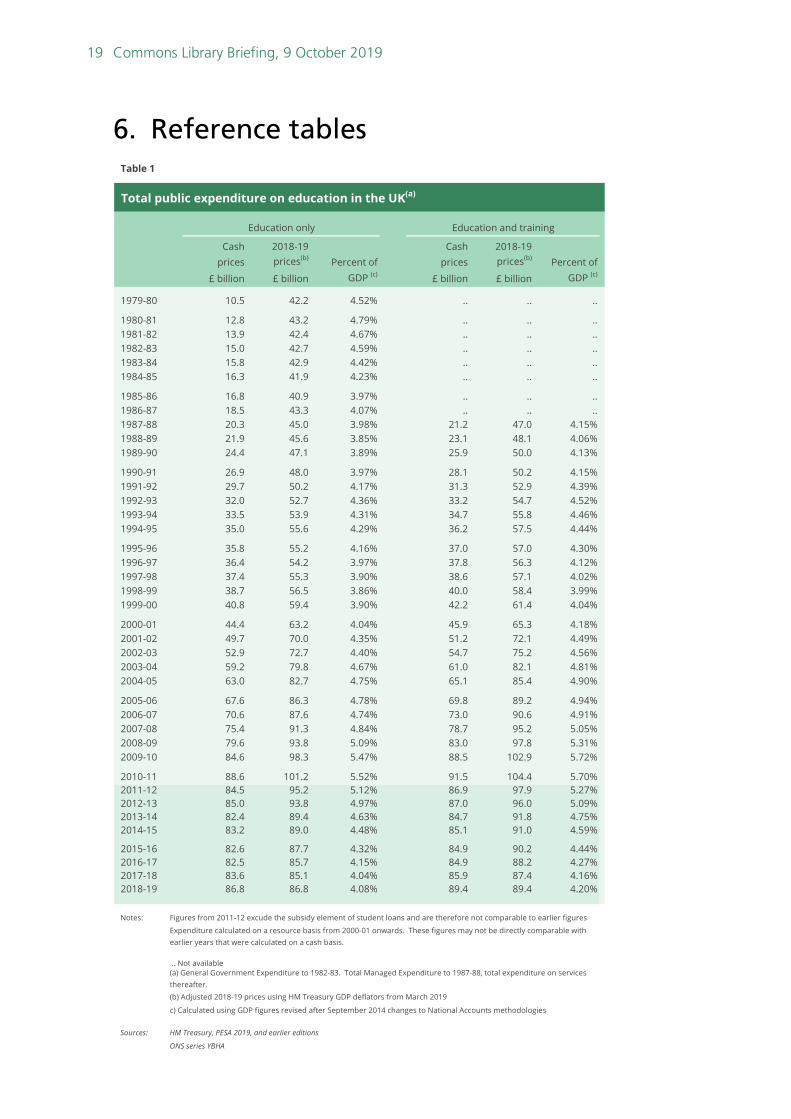
Table 1 at the end of this note shows education spending in cash and real terms and as a percentage of GDP for each financial year since 1979-80 and education and training expenditure since 1987-88.
Peak spending in real terms was in 2010-11 at £101.2 billion (2018-19 prices). This figure is inflated to a certain extent by some one-off accounting adjustments to the subsidy element of student loans. These adjustments were to revalue the existing stock of loans to reflect lower than expected repayments.3 The additional expenditure was ‘scored’
3 For revised assumptions regarding the base rate cap and the decision to use OBR
data on short term earnings and RPI, rather than long term assumptions.
Public expenditure on education in 2018-19 prices
-
£20bn
£40bn
£60bn
£80bn
£100bn
1979-80 1986-87 1993-94 2000-01 2007-08 2014-15
7 Commons Library Briefing, 9 October 2019
against the year in which these decisions were made, despite the facts that lower repayments will often not be realised for many years to come and the loans in question were taken out from the end of the 1990s onwards. Spending on tertiary education was (at the time) recorded as £15.8 billion in 2010-11 compared to £13.2 billion in 2009-10 and £13.1 billion in 2011-12.
These accounting adjustments are large enough to have a noticeable impact on the trend in overall public spending on education.
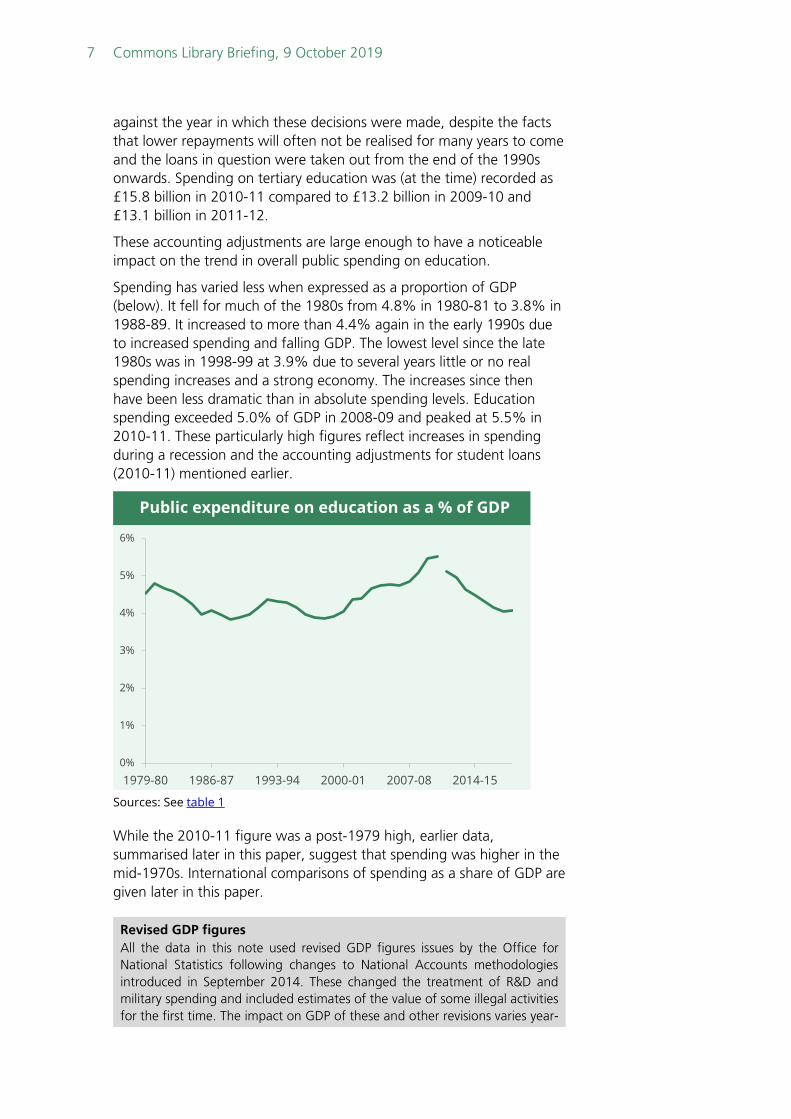
Spending has varied less when expressed as a proportion of GDP (below). It fell for much of the 1980s from 4.8% in 1980-81 to 3.8% in 1988-89. It increased to more than 4.4% again in the early 1990s due to increased spending and falling GDP. The lowest level since the late 1980s was in 1998-99 at 3.9% due to several years little or no real spending increases and a strong economy. The increases since then have been less dramatic than in absolute spending levels. Education spending exceeded 5.0% of GDP in 2008-09 and peaked at 5.5% in 2010-11. These particularly high figures reflect increases in spending during a recession and the accounting adjustments for student loans (2010-11) mentioned earlier.
Sources: See table 1
While the 2010-11 figure was a post-1979 high, earlier data, summarised later in this paper, suggest that spending was higher in the mid-1970s. International comparisons of spending as a share of GDP are given later in this paper.
Public expenditure on education as a % of GDP
0%
1%
2%
3%
4%
5%
6%
1979-80 1986-87 1993-94 2000-01 2007-08 2014-15
Revised GDP figures All the data in this note used revised GDP figures issues by the Office for National Statistics following changes to National Accounts methodologies introduced in September 2014. These changed the treatment of R&D and military spending and included estimates of the value of some illegal activities for the first time. The impact on GDP of these and other revisions varies year-
8 Education spending in the UK
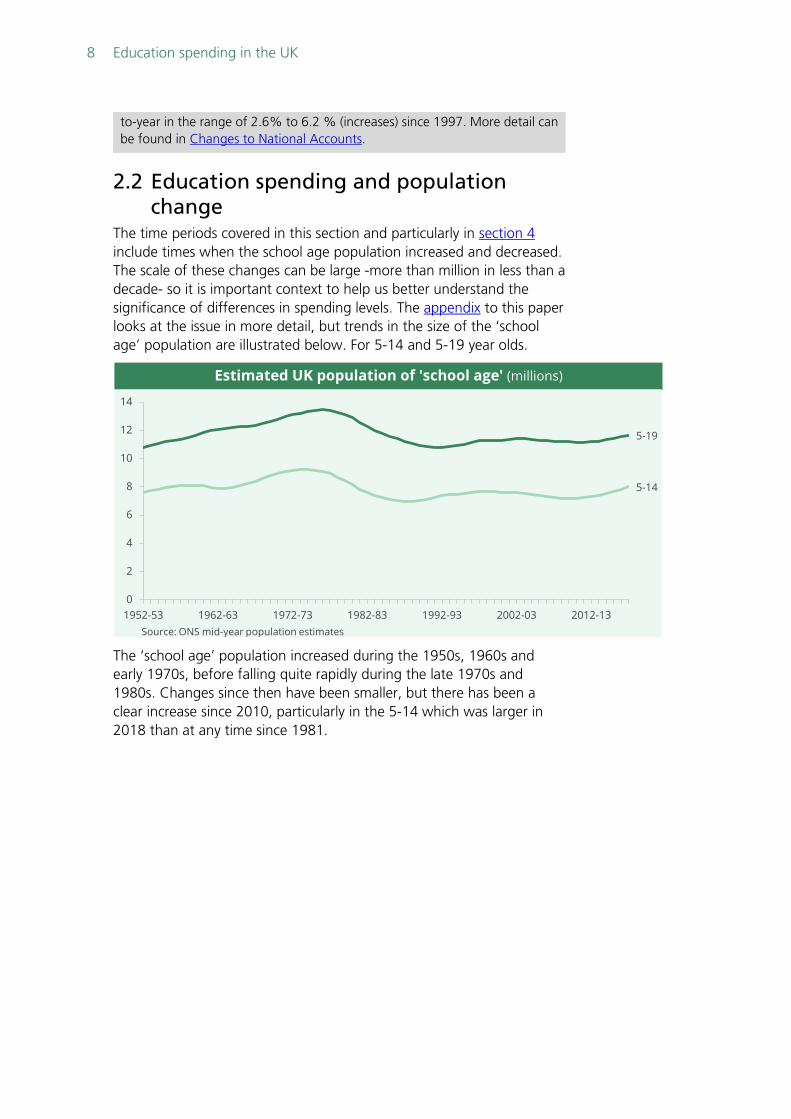
2.2 Education spending and population change
The time periods covered in this section and particularly in section 4 include times when the school age population increased and decreased. The scale of these changes can be large -more than million in less than a decade- so it is important context to help us better understand the significance of differences in spending levels. The appendix to this paper looks at the issue in more detail, but trends in the size of the ‘school age’ population are illustrated below. For 5-14 and 5-19 year olds.
The ‘school age’ population increased during the 1950s, 1960s and early 1970s, before falling quite rapidly during the late 1970s and 1980s. Changes since then have been smaller, but there has been a clear increase since 2010, particularly in the 5-14 which was larger in 2018 than at any time since 1981.
Estimated UK population of 'school age' (millions)
5-19
5-14
0
2
4
6
8
10
12
14
1952-53 1962-63 1972-73 1982-83 1992-93 2002-03 2012-13Source: ONS mid-year population estimates
to-year in the range of 2.6% to 6.2 % (increases) since 1997. More detail can be found in Changes to National Accounts.

9 Commons Library Briefing, 9 October 2019
2.3 Education and training since 1987 Trends in expenditure on education and training are also given in Table 1 at the end of this note and illustrated below.
Sources: See table 1
The inclusion of training expenditure has little impact on the ‘shape’ of either trend. Real spending on education and training peaked at £104 billion (2018-19 prices) in 2010-11 and at 5.7% of GDP in 2009-10.
The following table concentrates on spending covered by the 2004 and later spending reviews. Readers should note the impact of removing the subsidy element of student loans from 2011-12 onwards (described earlier).
Education and training expenditure in the UK, 2005-06 to 2018-19
Total change change Total change change
£ billion £ billion percentage £ billion £ billion percentage
2005-06 69.8 +6.8 +10.7% 89.2 +6.5 +7.9%2006-07 73.0 +3.2 +4.6% 90.6 +1.4 +1.6%2007-08 78.7 +5.7 +7.7% 95.2 +4.7 +5.1%2008-09 83.0 +4.3 +5.5% 97.8 +2.6 +2.7%2009-10 88.5 +5.5 +6.6% 102.9 +5.0 +5.1%2010-11 91.5 +3.0 +3.4% 104.4 +1.6 +1.5%
2011-12 86.9 .. .. 97.9 .. ..2012-13 87.0 +0.1 +0.1% 96.0 -1.8 -1.9%2013-14 84.7 -2.3 -2.7% 91.8 -4.2 -4.4%2014-15 85.1 +0.4 +0.4% 91.0 -0.8 -0.8%2015-16 84.9 -0.1 -0.2% 90.2 -0.9 -1.0%2016-17 84.9 -0.0 -0.0% 88.2 -2.0 -2.2%2017-18 85.9 +1.0 +1.2% 87.4 -0.7 -0.8%2018-19 89.4 +3.5 +4.1% 89.4 +2.0 +2.3%
.. +0.4 +0.4% .. -1.2 -1.3%
Note: Excludes the subsidy element of student loans from 2011-12 onwards
(a) Adjusted using HM Treasury GDP deflators as at March 2019
Sources: HM Treasury, PESA 2019, and earlier editions
Cash prices 2018-19 prices(a)
Ave. change 2011-12to 2018-19
2018-19 prices % of GDP
Public expenditure on education and training
-
£20bn
£40bn
£60bn
£80bn
£100bn
1987-88 1994-95 2001-02 2008-09 2015-160%
1%
2%
3%
4%
5%
6%
1987-88 1994-95 2001-02 2008-09 2015-16
10 Education spending in the UK
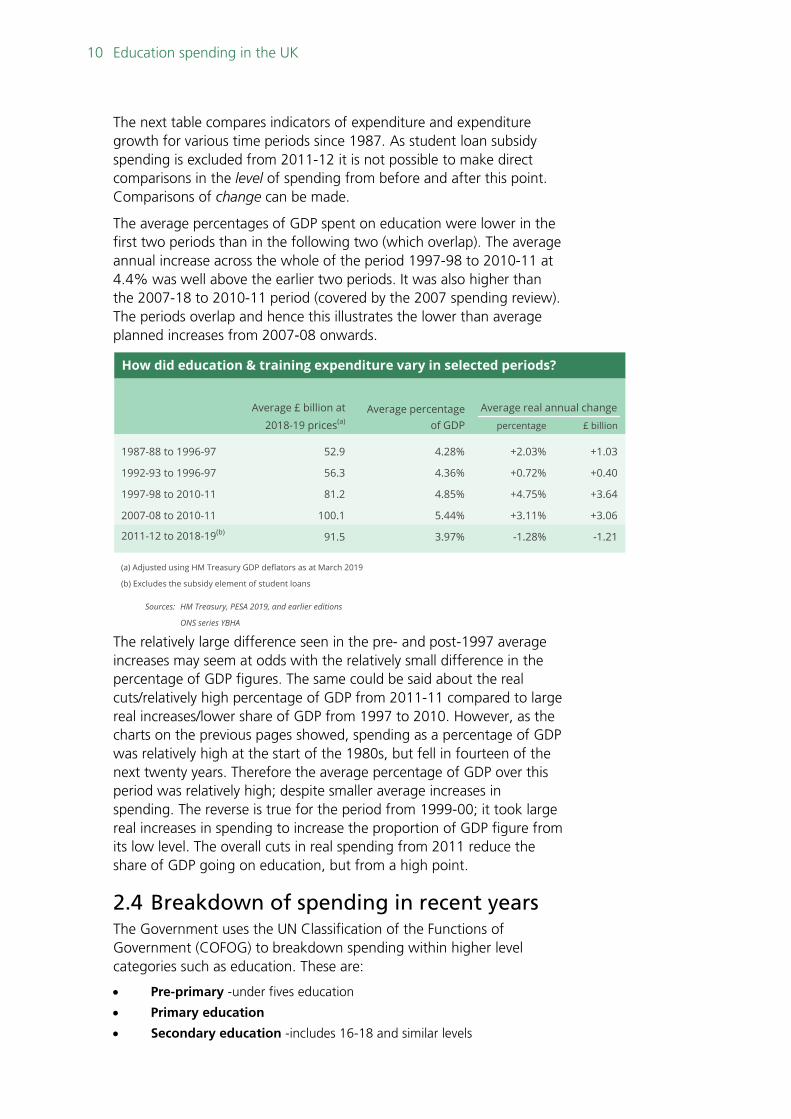
The next table compares indicators of expenditure and expenditure growth for various time periods since 1987. As student loan subsidy spending is excluded from 2011-12 it is not possible to make direct comparisons in the level of spending from before and after this point. Comparisons of change can be made.
The average percentages of GDP spent on education were lower in the first two periods than in the following two (which overlap). The average annual increase across the whole of the period 1997-98 to 2010-11 at 4.4% was well above the earlier two periods. It was also higher than the 2007-18 to 2010-11 period (covered by the 2007 spending review). The periods overlap and hence this illustrates the lower than average planned increases from 2007-08 onwards.
The relatively large difference seen in the pre- and post-1997 average increases may seem at odds with the relatively small difference in the percentage of GDP figures. The same could be said about the real cuts/relatively high percentage of GDP from 2011-11 compared to large real increases/lower share of GDP from 1997 to 2010. However, as the charts on the previous pages showed, spending as a percentage of GDP was relatively high at the start of the 1980s, but fell in fourteen of the next twenty years. Therefore the average percentage of GDP over this period was relatively high; despite smaller average increases in spending. The reverse is true for the period from 1999-00; it took large real increases in spending to increase the proportion of GDP figure from its low level. The overall cuts in real spending from 2011 reduce the share of GDP going on education, but from a high point.
2.4 Breakdown of spending in recent years The Government uses the UN Classification of the Functions of Government (COFOG) to breakdown spending within higher level categories such as education. These are:
• Pre-primary -under fives education
• Primary education
• Secondary education -includes 16-18 and similar levels
How did education & training expenditure vary in selected periods?
percentage £ billion
1987-88 to 1996-97 52.9 4.28% +2.03% +1.03
1992-93 to 1996-97 56.3 4.36% +0.72% +0.40
1997-98 to 2010-11 81.2 4.85% +4.75% +3.64
2007-08 to 2010-11 100.1 5.44% +3.11% +3.06
2011-12 to 2018-19(b) 91.5 3.97% -1.28% -1.21
(a) Adjusted using HM Treasury GDP deflators as at March 2019
(b) Excludes the subsidy element of student loans
Sources: HM Treasury, PESA 2019, and earlier editions
ONS series YBHA
Average £ billion at
2018-19 prices(a)Average percentage
of GDP
Average real annual change
11 Commons Library Briefing, 9 October 2019
• Post-secondary non-tertiary – education beyond secondary level, but not at tertiary level
• Tertiary -higher education, first degree and above
• Education not definable by level -mainly adult and community learning that does not need any prior qualification
• Subsidiary services to education -spending to support education/students regardless of level, such as general administration and inspection costs.
• R&D education
• Education not elsewhere classified -here described as training
Definitions of the terms used here can be found on the UN Statistics Division website.
It is important to note that the Department for Education currently records all spending on academies under secondary education. Secondary schools account for most of the spending on academies, but there are also include large numbers of primary and special academies. They are looking to improve the separation of spending across the education categories in the future. This skews the primary/secondary breakdown somewhat and limits the comparisons of primary and secondary spending between the home countries of the UK
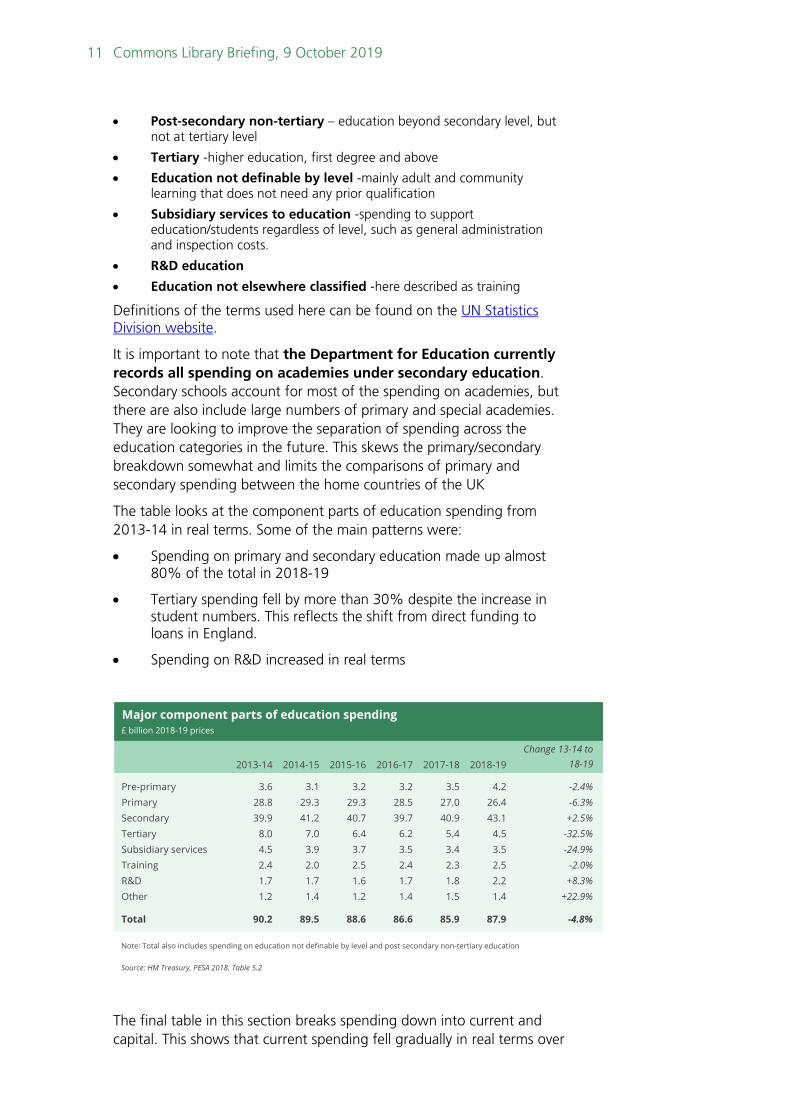
The table looks at the component parts of education spending from 2013-14 in real terms. Some of the main patterns were:
• Spending on primary and secondary education made up almost 80% of the total in 2018-19
• Tertiary spending fell by more than 30% despite the increase in student numbers. This reflects the shift from direct funding to loans in England.
• Spending on R&D increased in real terms
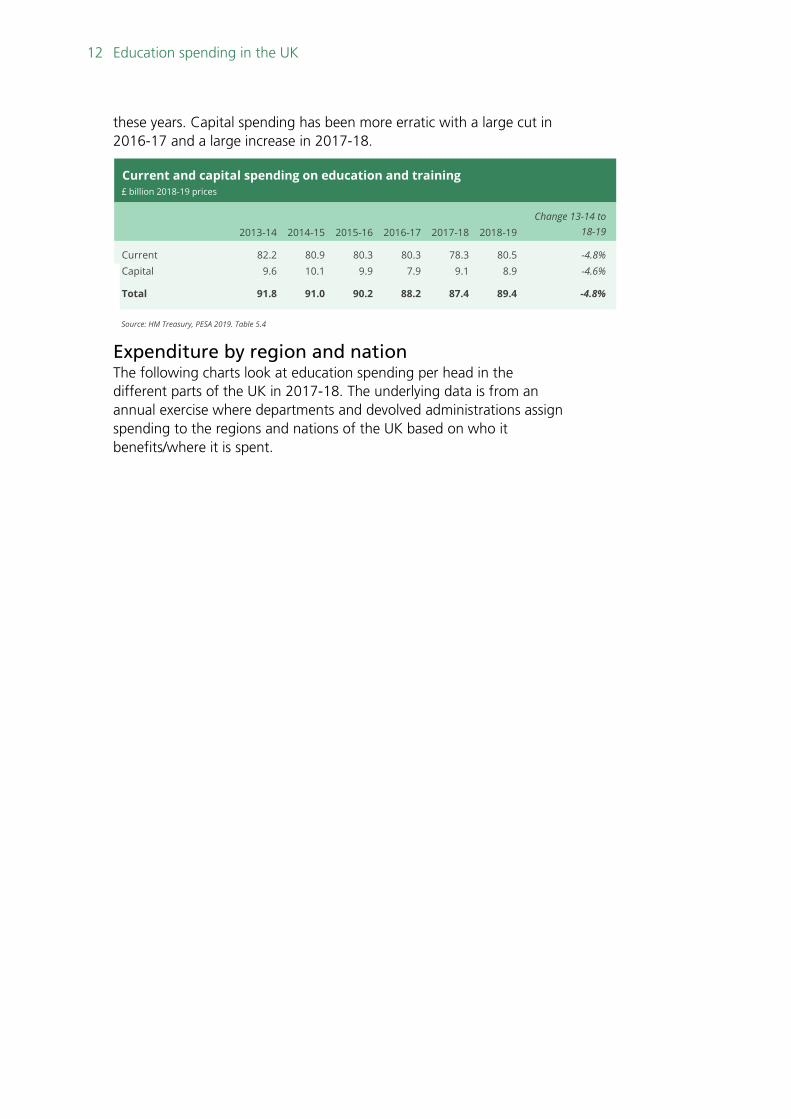
The final table in this section breaks spending down into current and capital. This shows that current spending fell gradually in real terms over
Major component parts of education spending£ billion 2018-19 prices
2013-14 2014-15 2015-16 2016-17 2017-18 2018-19Change 13-14 to
18-19
Pre-primary 3.6 3.1 3.2 3.2 3.5 4.2 -2.4%Primary 28.8 29.3 29.3 28.5 27.0 26.4 -6.3%Secondary 39.9 41.2 40.7 39.7 40.9 43.1 +2.5%Tertiary 8.0 7.0 6.4 6.2 5.4 4.5 -32.5%Subsidiary services 4.5 3.9 3.7 3.5 3.4 3.5 -24.9%Training 2.4 2.0 2.5 2.4 2.3 2.5 -2.0%R&D 1.7 1.7 1.6 1.7 1.8 2.2 +8.3%Other 1.2 1.4 1.2 1.4 1.5 1.4 +22.9%
Total 90.2 89.5 88.6 86.6 85.9 87.9 -4.8%
Note: Total also includes spending on education not definable by level and post secondary non-tertiary education
Source: HM Treasury, PESA 2018. Table 5.2
12 Education spending in the UK
these years. Capital spending has been more erratic with a large cut in 2016-17 and a large increase in 2017-18.
Expenditure by region and nation The following charts look at education spending per head in the different parts of the UK in 2017-18. The underlying data is from an annual exercise where departments and devolved administrations assign spending to the regions and nations of the UK based on who it benefits/where it is spent.
Current and capital spending on education and training£ billion 2018-19 prices
2013-14 2014-15 2015-16 2016-17 2017-18 2018-19Change 13-14 to
18-19
Current 82.2 80.9 80.3 80.3 78.3 80.5 -4.8%Capital 9.6 10.1 9.9 7.9 9.1 8.9 -4.6%
Total 91.8 91.0 90.2 88.2 87.4 89.4 -4.8%
Source: HM Treasury, PESA 2019. Table 5.4

13 Commons Library Briefing, 9 October 2019
Total education and training expenditure was £1,301 per head for the UK as a whole in 2017-18. It was highest in Scotland at £1,548 and well above average in London, Northern Ireland and Wales. The South West had the lowest level at £1,174 per head. Comparisons will be affected by demographics –the relative size of the school/college/university age population in each region as well as the propensity for pupils in a given area to attend independent schools.
Comparisons of spending at primary and secondary level will be affected by including all academy spending under ‘secondary’ in England. Spending per head on primary education was an average of £409 across the UK. Again, it was highest in Scotland at £547, lowest in the South West at £307. There was less variation in spending at secondary level. It was highest in Yorkshire and the Humber, here £708 per head, but levels in several other English regions were not far behind.
Relative gaps were largest in tertiary education; from £272 per head in Scotland to around £70 in some English regions. This comparison is affected by the exclusion of the subsidy element of loans which plays such an important part in support for higher education in England.
Education and training spending within the UK£ per head 2017-18

14 Education spending in the UK
3. Expenditure on student loans Expenditure on the subsidy element of student loans has recently been excluded from public spending figures. This is shown in all the charts in this paper with a break in the series between 2010-11 and 2011-12. The impact of this change will have been both a one off (apparent) drop in spending in 2011-12, plus an ongoing reduction in spending as more funding was shifted from direct spending to loans from 2012 onwards. The change will have exaggerated any cuts after the break in series.
3.1 ONS review In December 2018 the Office for National Statistics (ONS) announced that it would change the way that loans are included in public spending figures. In summary this will mean treating the amount which is expected to be repaid as a loan. The remainder will be reclassified as public spending and count towards the deficit.4 For more detail on the impact of these changes see the blog Student loans: ONS changes accounting rules.
In June 2019 the ONS published Student loans in the public sector finances: a methodological guide which gave a detailed account of the reasons behind the change and how they planned to implement it.
The August 2019 Public sector finances release was the first to include the revised student loan expenditure figures and their impact on borrowing. The revisions were made from 1997-98 to 2018-19. In 1999-00 the new treatment of loans increased spending by 0.1 billion, rising to £7.5 billion in 2016-17. The revisions for 2017-18 and 2018-19 also include the impact of loan sell offs as these were below the asset value recorded in the national accounts. The difference was £1.2 billion in 2017-18 and £1.5 billion in 2018-19. These amounts affect Government borrowing but are not a direct reflection of annual expenditure on student loans. Without these loan sale ‘costs’ spending on loans was £8.7 billion in 2017-18 and £10.9 billion in 2018-19 under the new rules.
3.2 Impact of including spending on loans from 2011-12
The Government is not expected publish detailed time series data on UK education spending (including the new definition of loan spending) until summer 2020. This section simply adds the ONS loan expenditure figures to the existing public spending data from 2011-12 to get a more meaningful time series without the break in series described earlier. It does not include the impact of loan sales in 2017-18 and 2018-19. The ONS estimates of the cost of loan sales look at the impact on public finances rather than annual education spending.
4 New treatment of student loans in the public sector finances and national accounts,
ONS

15 Commons Library Briefing, 9 October 2019
The results for the education and training series are shown below. The series “excluding loans” is the original referred to throughout the rest of this paper for the years 2011-12.
Adding loan spending back in still results in a cut in real spending in 2011-12, but the new series levels off after then and in the years up to 2017-18. It then increases in 2018-19 to a level around 4% below the 2010-11 peak in real terms. The revised percentage of GDP series still falls after 2010-11, but including loans slows this fall and shows a clear increase in 2018-19. The 2018-19 level is 4.7% of GDP; still well below its 5.7% peak in 2009-10 and 2010-11.
2018-19 prices % of GDP
Public expenditure on education and training
including loans excluding
loans
-
£20bn
£40bn
£60bn
£80bn
£100bn
1987-88 1994-95 2001-02 2008-09 2015-16
excluding loans
including loans
0%
1%
2%
3%
4%
5%
6%
1987-88 1994-95 2001-02 2008-09 2015-16
16 Education spending in the UK
4. Long term trends in public expenditure
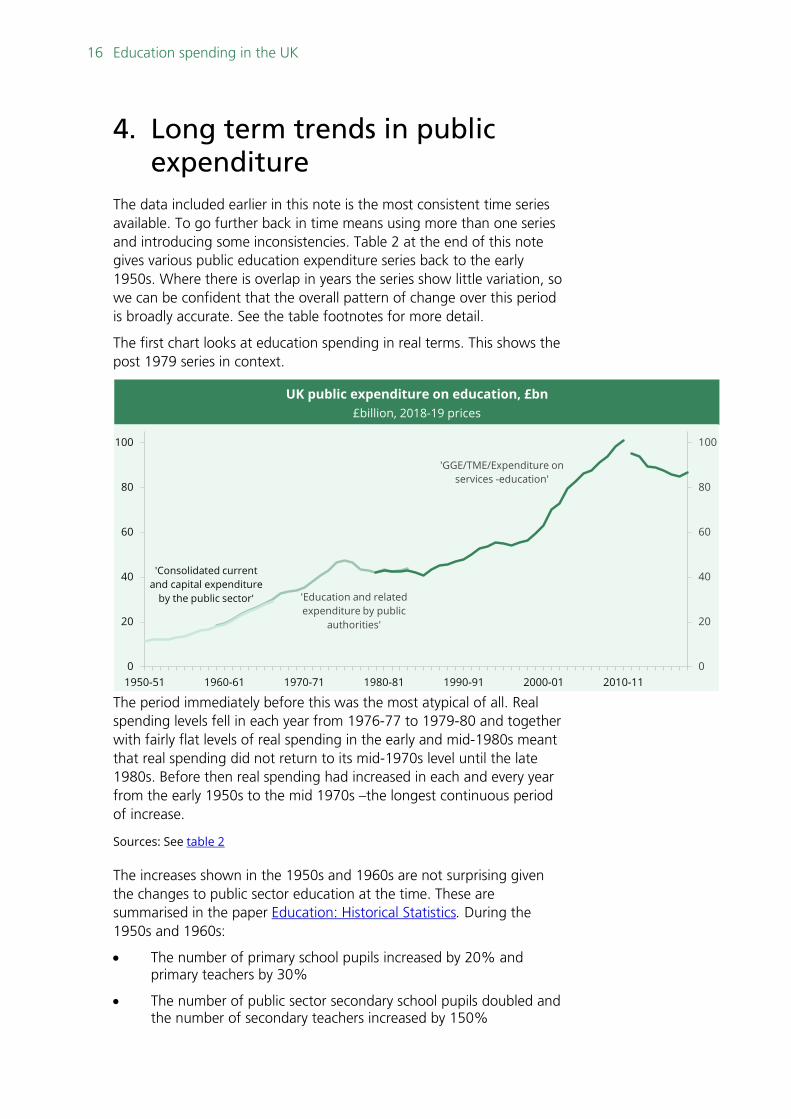
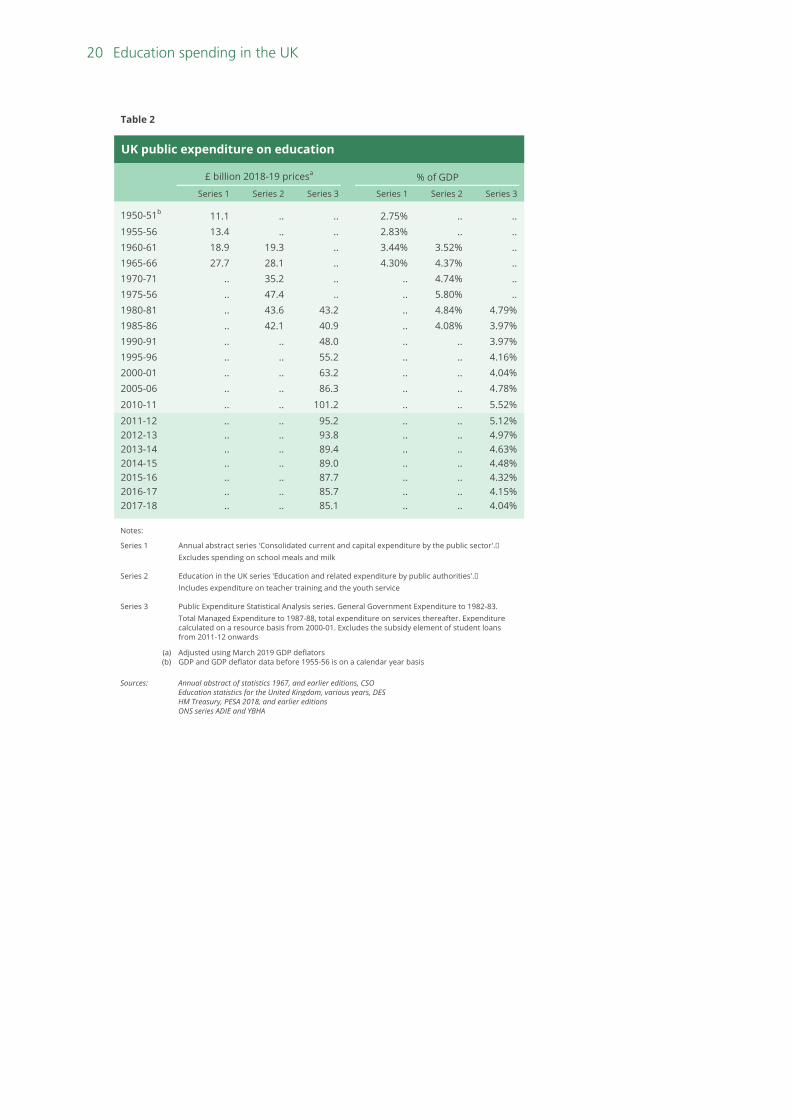
The data included earlier in this note is the most consistent time series available. To go further back in time means using more than one series and introducing some inconsistencies. Table 2 at the end of this note gives various public education expenditure series back to the early 1950s. Where there is overlap in years the series show little variation, so we can be confident that the overall pattern of change over this period is broadly accurate. See the table footnotes for more detail.
The first chart looks at education spending in real terms. This shows the post 1979 series in context.
The period immediately before this was the most atypical of all. Real spending levels fell in each year from 1976-77 to 1979-80 and together with fairly flat levels of real spending in the early and mid-1980s meant that real spending did not return to its mid-1970s level until the late 1980s. Before then real spending had increased in each and every year from the early 1950s to the mid 1970s –the longest continuous period of increase.
Sources: See table 2
The increases shown in the 1950s and 1960s are not surprising given the changes to public sector education at the time. These are summarised in the paper Education: Historical Statistics. During the 1950s and 1960s:
• The number of primary school pupils increased by 20% and primary teachers by 30%
• The number of public sector secondary school pupils doubled and the number of secondary teachers increased by 150%
UK public expenditure on education, £bn£billion, 2018-19 prices
'Education and related expenditure by public
authorities'
'Consolidated current and capital expenditure
by the public sector'
'GGE/TME/Expenditure on services -education'
0
20
40
60
80
100
0
20
40
60
80
100
1950-51 1960-61 1970-71 1980-81 1990-91 2000-01 2010-11
17 Commons Library Briefing, 9 October 2019
• The number of students gaining university qualifications more than tripled
More detail is given in that paper.
The chart shows that the largest annual increases occurred in the 2000s. The fastest rate of increase was in the 1950s and early 60s; spending doubled in real terms in the 11 years between 1952/53 and 1963/64. The real increase in the 11 years to 2009-10 was just over two-thirds.
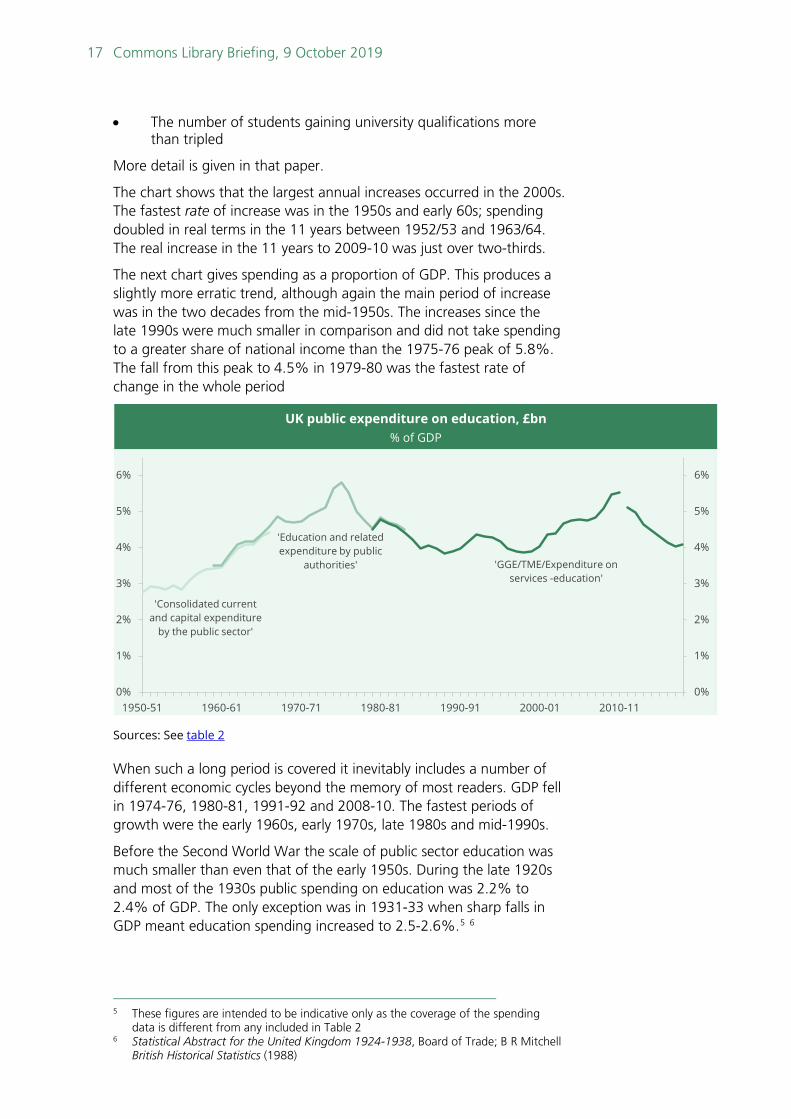
The next chart gives spending as a proportion of GDP. This produces a slightly more erratic trend, although again the main period of increase was in the two decades from the mid-1950s. The increases since the late 1990s were much smaller in comparison and did not take spending to a greater share of national income than the 1975-76 peak of 5.8%. The fall from this peak to 4.5% in 1979-80 was the fastest rate of change in the whole period
Sources: See table 2
When such a long period is covered it inevitably includes a number of different economic cycles beyond the memory of most readers. GDP fell in 1974-76, 1980-81, 1991-92 and 2008-10. The fastest periods of growth were the early 1960s, early 1970s, late 1980s and mid-1990s.
Before the Second World War the scale of public sector education was much smaller than even that of the early 1950s. During the late 1920s and most of the 1930s public spending on education was 2.2% to 2.4% of GDP. The only exception was in 1931-33 when sharp falls in GDP meant education spending increased to 2.5-2.6%.5 6
5 These figures are intended to be indicative only as the coverage of the spending
data is different from any included in Table 2 6 Statistical Abstract for the United Kingdom 1924-1938, Board of Trade; B R Mitchell
British Historical Statistics (1988)
UK public expenditure on education, £bn% of GDP
'Consolidated current and capital expenditure
by the public sector'
'Education and related expenditure by public
authorities' 'GGE/TME/Expenditure on services -education'
0%
1%
2%
3%
4%
5%
6%
0%
1%
2%
3%
4%
5%
6%
1950-51 1960-61 1970-71 1980-81 1990-91 2000-01 2010-11

18 Education spending in the UK
The appendix at the end of this note looks at long term trends in combined public and private spending on education and puts this in the context of changes in the size of the school age population.
5. International comparisons The chart opposite illustrates differences in education expenditure7 as a proportion of GDP across the OECD. 2016 are the latest available data. These figures cover public and private spending and the public total is indicated in the chart.
Overall spending on this measure in the UK was 6.2%; above the OECD average of 5.0%, above the figure other EU countries and only below Norway, Chile and New Zealand. Public spending in the UK at 4.2% was also above the OECD average of 4.0%, but well below levels in New Zealand, Belgium, Iceland and the Scandinavian countries.
Private education expenditure in the UK at 1.9% of GDP was well above average. It was the same as in Australia and the US, only Chile had a higher rate.
The definition of source of funds used here looks at their final source and hence apportions expenditure funded by student loans to the private rather than the public sector.
7 Expenditure on institutions. This excludes some spending which directly benefits
pupils/students such as maintenance support
Expenditure on education institutions as a % of GDPOECD nations 2016
LuxembourgCzech Republic
IrelandLithuania
ItalySlovak Republic
JapanGermany
LatviaSlovenia
SpainHungary
PolandEstoniaAustria
PortugalMexicoFrance
NetherlandsKorea
SwedenTurkey
FinlandIceland
ColombiaBelgium
AustraliaCanada
IsraelUnited States
United KingdomChile
New ZealandNorway
0% 2% 4% 6%
Public
Total
Source: OECD Education at a Glance 2019
19 Commons Library Briefing, 9 October 2019
6. Reference tables
Table 1
Total public expenditure on education in the UK(a)
Education only Education and training
Cash 2018-19 Cash 2018-19prices prices(b) Percent of prices prices(b) Percent of
£ billion £ billion GDP (c) £ billion £ billion GDP (c)
1979-80 10.5 42.2 4.52% .. .. ..
1980-81 12.8 43.2 4.79% .. .. ..1981-82 13.9 42.4 4.67% .. .. ..1982-83 15.0 42.7 4.59% .. .. ..1983-84 15.8 42.9 4.42% .. .. ..1984-85 16.3 41.9 4.23% .. .. ..
1985-86 16.8 40.9 3.97% .. .. ..1986-87 18.5 43.3 4.07% .. .. ..1987-88 20.3 45.0 3.98% 21.2 47.0 4.15%1988-89 21.9 45.6 3.85% 23.1 48.1 4.06%1989-90 24.4 47.1 3.89% 25.9 50.0 4.13%
1990-91 26.9 48.0 3.97% 28.1 50.2 4.15%1991-92 29.7 50.2 4.17% 31.3 52.9 4.39%1992-93 32.0 52.7 4.36% 33.2 54.7 4.52%1993-94 33.5 53.9 4.31% 34.7 55.8 4.46%1994-95 35.0 55.6 4.29% 36.2 57.5 4.44%
1995-96 35.8 55.2 4.16% 37.0 57.0 4.30%1996-97 36.4 54.2 3.97% 37.8 56.3 4.12%1997-98 37.4 55.3 3.90% 38.6 57.1 4.02%1998-99 38.7 56.5 3.86% 40.0 58.4 3.99%1999-00 40.8 59.4 3.90% 42.2 61.4 4.04%
2000-01 44.4 63.2 4.04% 45.9 65.3 4.18%2001-02 49.7 70.0 4.35% 51.2 72.1 4.49%2002-03 52.9 72.7 4.40% 54.7 75.2 4.56%2003-04 59.2 79.8 4.67% 61.0 82.1 4.81%2004-05 63.0 82.7 4.75% 65.1 85.4 4.90%
2005-06 67.6 86.3 4.78% 69.8 89.2 4.94%2006-07 70.6 87.6 4.74% 73.0 90.6 4.91%2007-08 75.4 91.3 4.84% 78.7 95.2 5.05%2008-09 79.6 93.8 5.09% 83.0 97.8 5.31%2009-10 84.6 98.3 5.47% 88.5 102.9 5.72%
2010-11 88.6 101.2 5.52% 91.5 104.4 5.70%2011-12 84.5 95.2 5.12% 86.9 97.9 5.27%2012-13 85.0 93.8 4.97% 87.0 96.0 5.09%2013-14 82.4 89.4 4.63% 84.7 91.8 4.75%2014-15 83.2 89.0 4.48% 85.1 91.0 4.59%
2015-16 82.6 87.7 4.32% 84.9 90.2 4.44%2016-17 82.5 85.7 4.15% 84.9 88.2 4.27%2017-18 83.6 85.1 4.04% 85.9 87.4 4.16%2018-19 86.8 86.8 4.08% 89.4 89.4 4.20%
Notes: Figures from 2011-12 excude the subsidy element of student loans and are therefore not comparable to earlier figures
.. Not available
(b) Adjusted 2018-19 prices using HM Treasury GDP deflators from March 2019
c) Calculated using GDP figures revised after September 2014 changes to National Accounts methodologies
Sources: HM Treasury, PESA 2019, and earlier editions
ONS series YBHA
Expenditure calculated on a resource basis from 2000-01 onwards. These figures may not be directly comparable with earlier years that were calculated on a cash basis.
(a) General Government Expenditure to 1982-83. Total Managed Expenditure to 1987-88, total expenditure on services thereafter.
20 Education spending in the UK
Table 2
UK public expenditure on education
£ billion 2018-19 pricesa % of GDP
Series 1 Series 2 Series 3 Series 1 Series 2 Series 3
1950-51b 11.1 .. .. 2.75% .. ..1955-56 13.4 .. .. 2.83% .. ..1960-61 18.9 19.3 .. 3.44% 3.52% ..1965-66 27.7 28.1 .. 4.30% 4.37% ..1970-71 .. 35.2 .. .. 4.74% ..1975-56 .. 47.4 .. .. 5.80% ..1980-81 .. 43.6 43.2 .. 4.84% 4.79%1985-86 .. 42.1 40.9 .. 4.08% 3.97%1990-91 .. .. 48.0 .. .. 3.97%1995-96 .. .. 55.2 .. .. 4.16%2000-01 .. .. 63.2 .. .. 4.04%2005-06 .. .. 86.3 .. .. 4.78%
2010-11 .. .. 101.2 .. .. 5.52%
2011-12 .. .. 95.2 .. .. 5.12%2012-13 .. .. 93.8 .. .. 4.97%2013-14 .. .. 89.4 .. .. 4.63%2014-15 .. .. 89.0 .. .. 4.48%2015-16 .. .. 87.7 .. .. 4.32%2016-17 .. .. 85.7 .. .. 4.15%2017-18 .. .. 85.1 .. .. 4.04%
Notes:
Series 1 Annual abstract series 'Consolidated current and capital expenditure by the public sector'.Excludes spending on school meals and milk
Series 2 Education in the UK series 'Education and related expenditure by public authorities'.Includes expenditure on teacher training and the youth service
Series 3 Public Expenditure Statistical Analysis series. General Government Expenditure to 1982-83. Total Managed Expenditure to 1987-88, total expenditure on services thereafter. Expenditure calculated on a resource basis from 2000-01. Excludes the subsidy element of student loans from 2011-12 onwards
(a) Adjusted using March 2019 GDP deflators(b) GDP and GDP deflator data before 1955-56 is on a calendar year basis
Sources: Annual abstract of statistics 1967, and earlier editions, CSOEducation statistics for the United Kingdom, various years, DESHM Treasury, PESA 2018, and earlier editionsONS series ADIE and YBHA
21 Commons Library Briefing, 9 October 2019
7. Appendix –Trends in education spending v population change
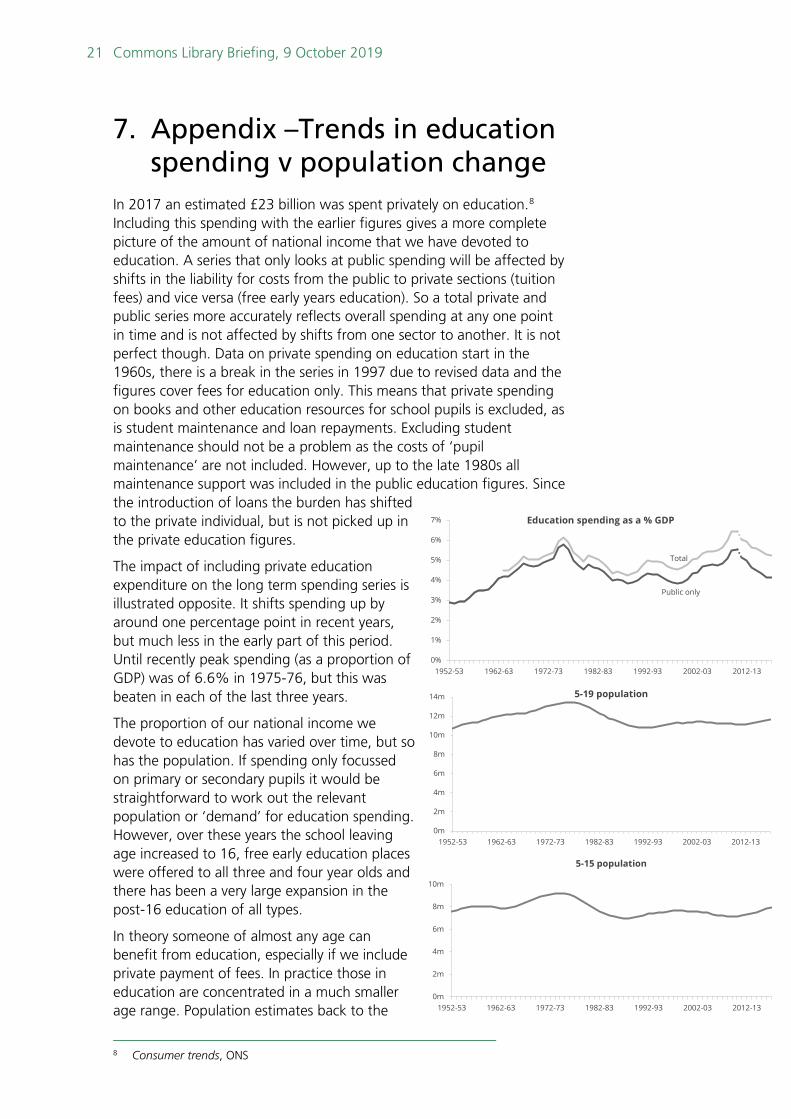
In 2017 an estimated £23 billion was spent privately on education.8 Including this spending with the earlier figures gives a more complete picture of the amount of national income that we have devoted to education. A series that only looks at public spending will be affected by shifts in the liability for costs from the public to private sections (tuition fees) and vice versa (free early years education). So a total private and public series more accurately reflects overall spending at any one point in time and is not affected by shifts from one sector to another. It is not perfect though. Data on private spending on education start in the 1960s, there is a break in the series in 1997 due to revised data and the figures cover fees for education only. This means that private spending on books and other education resources for school pupils is excluded, as is student maintenance and loan repayments. Excluding student maintenance should not be a problem as the costs of ‘pupil maintenance’ are not included. However, up to the late 1980s all maintenance support was included in the public education figures. Since the introduction of loans the burden has shifted to the private individual, but is not picked up in the private education figures.
The impact of including private education expenditure on the long term spending series is illustrated opposite. It shifts spending up by around one percentage point in recent years, but much less in the early part of this period. Until recently peak spending (as a proportion of GDP) was of 6.6% in 1975-76, but this was beaten in each of the last three years.
The proportion of our national income we devote to education has varied over time, but so has the population. If spending only focussed on primary or secondary pupils it would be straightforward to work out the relevant population or ‘demand’ for education spending. However, over these years the school leaving age increased to 16, free early education places were offered to all three and four year olds and there has been a very large expansion in the post-16 education of all types.
In theory someone of almost any age can benefit from education, especially if we include private payment of fees. In practice those in education are concentrated in a much smaller age range. Population estimates back to the
8 Consumer trends, ONS
0m
2m
4m
6m
8m
10m
12m
14m
1952-53 1962-63 1972-73 1982-83 1992-93 2002-03 2012-13
5-19 population
0m
2m
4m
6m
8m
10m
1952-53 1962-63 1972-73 1982-83 1992-93 2002-03 2012-13
5-15 population
Total
Public only
0%
1%
2%
3%
4%
5%
6%
7%
1952-53 1962-63 1972-73 1982-83 1992-93 2002-03 2012-13
Education spending as a % GDP
22 Education spending in the UK
early 1950s are grouped in five year bands. The charts above compare trends in two age ranges which are meant to reflect the core group benefitting from education.
The shape of the trends is broadly similar, although the 5-15 age group is slightly more volatile.9 The 5-19 age group is used below as a measure of the population group most likely to benefit from education.
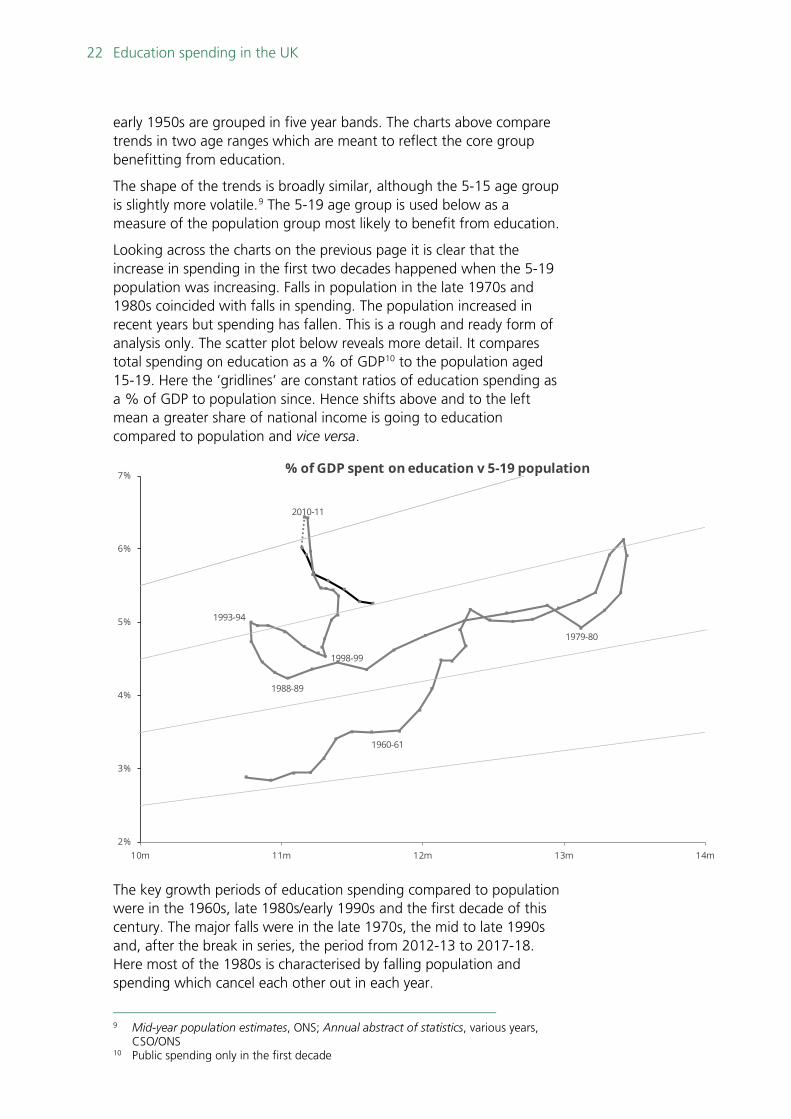
Looking across the charts on the previous page it is clear that the increase in spending in the first two decades happened when the 5-19 population was increasing. Falls in population in the late 1970s and 1980s coincided with falls in spending. The population increased in recent years but spending has fallen. This is a rough and ready form of analysis only. The scatter plot below reveals more detail. It compares total spending on education as a % of GDP10 to the population aged 15-19. Here the ‘gridlines’ are constant ratios of education spending as a % of GDP to population since. Hence shifts above and to the left mean a greater share of national income is going to education compared to population and vice versa.
The key growth periods of education spending compared to population were in the 1960s, late 1980s/early 1990s and the first decade of this century. The major falls were in the late 1970s, the mid to late 1990s and, after the break in series, the period from 2012-13 to 2017-18. Here most of the 1980s is characterised by falling population and spending which cancel each other out in each year.
9 Mid-year population estimates, ONS; Annual abstract of statistics, various years,
CSO/ONS 10 Public spending only in the first decade
1960-61
1979-80
1988-89
1993-94
1998-99
2010-11
2%
3%
4%
5%
6%
7%
10m 11m 12m 13m 14m
% of GDP spent on education v 5-19 population
23 Commons Library Briefing, 9 October 2019
The cuts in education spending relative to GDP and the growing population of the mid/late 1990s was reversed in the early part of this decade, but it took five years of large spending increases just to get back to a virtually identical position as in 1993-94. The recent cuts in spending and increased young population take the ratio back to a similar position.
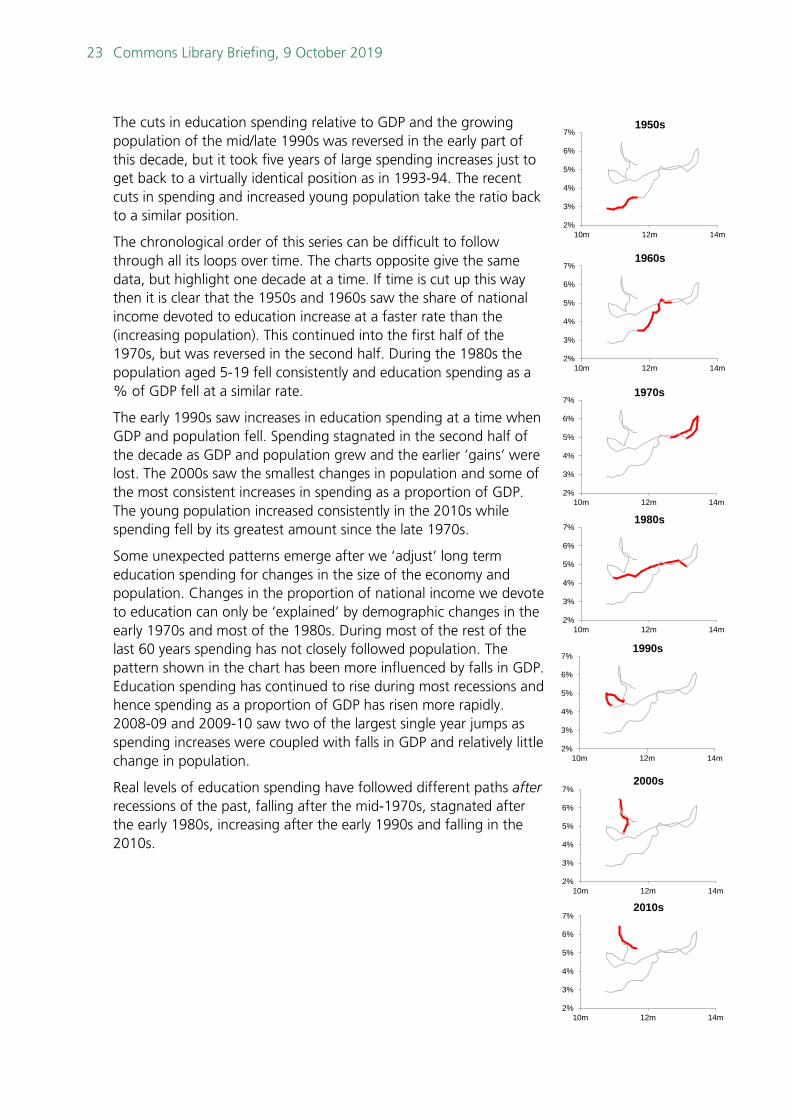
The chronological order of this series can be difficult to follow through all its loops over time. The charts opposite give the same data, but highlight one decade at a time. If time is cut up this way then it is clear that the 1950s and 1960s saw the share of national income devoted to education increase at a faster rate than the (increasing population). This continued into the first half of the 1970s, but was reversed in the second half. During the 1980s the population aged 5-19 fell consistently and education spending as a % of GDP fell at a similar rate.
The early 1990s saw increases in education spending at a time when GDP and population fell. Spending stagnated in the second half of the decade as GDP and population grew and the earlier ‘gains’ were lost. The 2000s saw the smallest changes in population and some of the most consistent increases in spending as a proportion of GDP. The young population increased consistently in the 2010s while spending fell by its greatest amount since the late 1970s.
Some unexpected patterns emerge after we ‘adjust’ long term education spending for changes in the size of the economy and population. Changes in the proportion of national income we devote to education can only be ‘explained’ by demographic changes in the early 1970s and most of the 1980s. During most of the rest of the last 60 years spending has not closely followed population. The pattern shown in the chart has been more influenced by falls in GDP. Education spending has continued to rise during most recessions and hence spending as a proportion of GDP has risen more rapidly. 2008-09 and 2009-10 saw two of the largest single year jumps as spending increases were coupled with falls in GDP and relatively little change in population.
Real levels of education spending have followed different paths after recessions of the past, falling after the mid-1970s, stagnated after the early 1980s, increasing after the early 1990s and falling in the 2010s.
2%
3%
4%
5%
6%
7%
10m 12m 14m
1950s
2%
3%
4%
5%
6%
7%
10m 12m 14m
1960s
2%
3%
4%
5%
6%
7%
10m 12m 14m
1970s
2%
3%
4%
5%
6%
7%
10m 12m 14m
1980s
2%
3%
4%
5%
6%
7%
10m 12m 14m
1990s
2%
3%
4%
5%
6%
7%
10m 12m 14m
2000s
2%
3%
4%
5%
6%
7%
10m 12m 14m
2010s

BRIEFING PAPER Number 1078 9 October 2019
About the Library The House of Commons Library research service provides MPs and their staff with the impartial briefing and evidence base they need to do their work in scrutinising Government, proposing legislation, and supporting constituents.
As well as providing MPs with a confidential service we publish open briefing papers, which are available on the Parliament website.
Every effort is made to ensure that the information contained in these publicly available research briefings is correct at the time of publication. Readers should be aware however that briefings are not necessarily updated or otherwise amended to reflect subsequent changes.
If you have any comments on our briefings please email [email protected]. Authors are available to discuss the content of this briefing only with Members and their staff.
If you have any general questions about the work of the House of Commons you can email [email protected].
Disclaimer This information is provided to Members of Parliament in support of their parliamentary duties. It is a general briefing only and should not be relied on as a substitute for specific advice. The House of Commons or the author(s) shall not be liable for any errors or omissions, or for any loss or damage of any kind arising from its use, and may remove, vary or amend any information at any time without prior notice.
The House of Commons accepts no responsibility for any references or links to, or the content of, information maintained by third parties. This information is provided subject to the conditions of the Open Parliament Licence.


