Education Sector Support Programme in Nigeria...
71
Education Sector Support Programme in Nigeria (ESSPIN) ESSPIN Annual Report 2013-2014 (Incorporates July 2014 Quarterly Report data) November 2014 Report Number 069
Transcript of Education Sector Support Programme in Nigeria...

Education Sector Support Programme in
Nigeria (ESSPIN)
ESSPIN Annual Report 2013-2014
(Incorporates July 2014 Quarterly Report data)
November 2014
Report Number 069

ESSPIN Annual Report 2013 – 2014, December 2014
Report Distribution and Revision Sheet
Project Name: Education Sector Support Programme in Nigeria
Code: 244333TA06
Report No.: ESSPIN
Report Title: ESSPIN Annual Report 2013-2014
Rev No
Date of issue
Originator
Checker Approver
Scope of checking
01 November 2014
JakeRoss
KayodeSanni
KayodeSanni
Accuracy, completeness, formatting
Scope of Checking
This report has been discussed with the originator and checked in the light of the requirements of the terms of reference. In addition the report has been checked to ensure editorial consistencies, accuracy of data, completeness of scope and responsiveness to client’s requirements.
Distribution List
Name Position DFIDBen Mellor Head of Office, DFID NigeriaChristian Rogg Deputy Head of Office, DFID Nigeria Kemi Williams Human Development Team Leader, DFIDKaren McGeough Human Development Deputy Team Leader,
DFIDEmily Oldmeadow Senior Education Adviser, DFIDEsohe Eigbike Education Adviser, DFIDLaura Brannelly Education Adviser, DFIDRosalind Gater Education Adviser, DFIDOlatunji Ogunbanwo Deputy Programme Manager, DFIDRobert Watt Head of DFID Northern Nigeria Office (Kano)Adeshina Fagbenro-Byron Head of DFID Lagos OfficeOlachi Chuks-Ronnie Head of DFID Enugu OfficeZainab Lukat DFID State Representative, Jigawa and YobeBen Nicholson DFID State Representative, Kaduna and
ZamfaraSiaka Alhassan DFID State Representative, Kano and KatsinaRoseline Onyemachi Education Project Officer, DFIDIsah Garba Education Project Officer, DFIDIMEPGregor MacKinnon Project Manager, IMEPEmmanuel Adegbe Deputy Project Manager, IMEP
iiEducation Sector Support Programme in Nigeria
ESSPIN Annual Report 2013 – 2014, December 2014
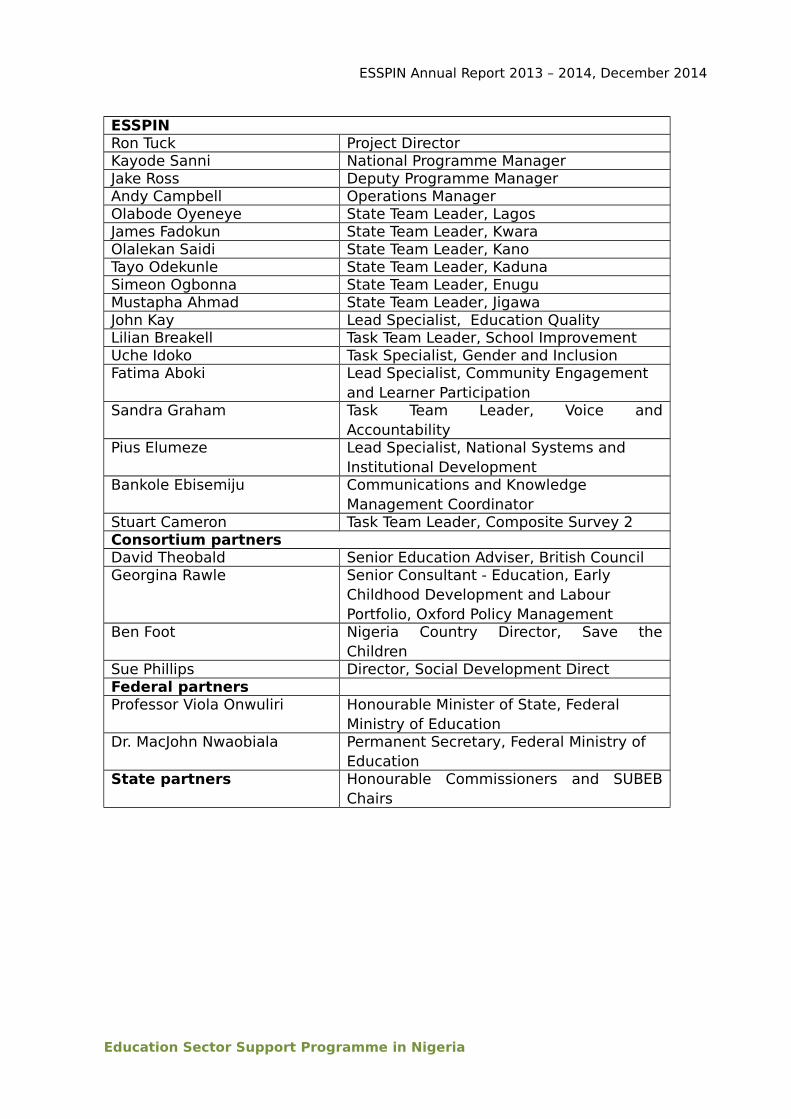
ESSPINRon Tuck Project DirectorKayode Sanni National Programme Manager Jake Ross Deputy Programme ManagerAndy Campbell Operations ManagerOlabode Oyeneye State Team Leader, Lagos James Fadokun State Team Leader, KwaraOlalekan Saidi State Team Leader, KanoTayo Odekunle State Team Leader, KadunaSimeon Ogbonna State Team Leader, EnuguMustapha Ahmad State Team Leader, JigawaJohn Kay Lead Specialist, Education QualityLilian Breakell Task Team Leader, School ImprovementUche Idoko Task Specialist, Gender and InclusionFatima Aboki Lead Specialist, Community Engagement
and Learner ParticipationSandra Graham Task Team Leader, Voice and
AccountabilityPius Elumeze Lead Specialist, National Systems and
Institutional DevelopmentBankole Ebisemiju Communications and Knowledge
Management CoordinatorStuart Cameron Task Team Leader, Composite Survey 2Consortium partnersDavid Theobald Senior Education Adviser, British CouncilGeorgina Rawle Senior Consultant - Education, Early
Childhood Development and Labour Portfolio, Oxford Policy Management
Ben Foot Nigeria Country Director, Save theChildren
Sue Phillips Director, Social Development DirectFederal partnersProfessor Viola Onwuliri Honourable Minister of State, Federal
Ministry of EducationDr. MacJohn Nwaobiala Permanent Secretary, Federal Ministry of
EducationState partners Honourable Commissioners and SUBEB
Chairs
Education Sector Support Programme in Nigeria

ESSPIN Annual Report 2013 – 2014, December 2014
DisclaimerThis document is issued for the party which commissioned it and for specific purposes connected with the captioned project only. It should not be relied upon by any other party or used for any other purpose.
We accept no responsibility for the consequences of this document being relied upon by any other party, or being used for any other purpose, or containing any error or omission which is due to an error or omission in data supplied to us by other parties.
Note on Documentary SeriesA series of documents has been produced by Cambridge Education as leader of the ESSPIN consortium in support of their contract with the Department for International Development for the Education Sector Support Programme in Nigeria. All ESSPIN reports are accessible from the ESSPIN website. http://www.esspin.org/resources/reports
The documentary series is arranged as follows:
ESSPIN 0-- Programme Reports and Documents
ESSPIN 1-- Support for Federal Level Governance (Reports and Documents for Output 1)
ESSPIN 2-- Support for State Level Governance (Reports and Documents for Output 2)
ESSPIN 3-- Support for Schools and Education Quality Improvement (Reports and Documents for Output 3)
ESSPIN 4-- Support for Communities (Reports and Documents for Output 4)
ESSPIN 5-- Information Management Reports and Documents
Reports and Documents produced for individual ESSPIN focal states follow the same number sequence but are prefixed:
JG Jigawa
KD Kaduna
KN Kano
KW Kwara
LG Lagos
EN Enugu
Education Sector Support Programme in Nigeria

ESSPIN Annual Report 2013 – 2014, December 2014
ContentsDisclaimer iv
Note on Documentary Series iv
Acronyms and Abbreviations viii
Introduction 1
Programme Context 1
Programme Strategy 2
Overall Progress on Outputs 6
2014 Programme Performance – Outputs, Outcomes and Impact 7
Output 1 – Strengthened National Systems 7
Output 2 – Strengthened Institutional Capacity at State and LGEA level 9
Output 3 – Improved School Quality 10
Output 4 – Inclusion 13
Outcome – Better Quality Education Services 17
Impact – Better Learning Outcomes for all children 19
Progress in Key Cross-cutting and Thematic Areas 22
Communications and Knowledge Management 22
Education Management Information System (EMIS) 24
Alternative data and knowledge management systems 25
Islamiyya, Qur’anic and Tsangaya Education (IQTE) 26
Inclusive Education 28
Resources and Value for Money 29
Deployment of ESSPIN Resources 29
Value for Money 32
Risk Monitoring and Management 43
Health, Safety and Security Risk Assessment, Management and Mitigation43
Programme Risk Assessment, Management and Mitigation 45
Annex: Quarterly Results Table, April-July 2014 48
Education Sector Support Programme in Nigeria

ESSPIN Annual Report 2013 – 2014, December 2014
List of FiguresFigure 1: Map of Nigeria showing ESSPIN partner States 1
Figure 2: Trajectory of SIP rollout against projection for 2016 programme endline 5
Figure 3: Total Year 6 Expenditure by ESSPIN States 31
List of Tables Table 1: Cumulative coverage of public primary and JSS – actuals against targets 4
Table 2: Financial resources committed to school improvement, July 2012-July 2014 6
Table 3: State progress against Output targets 7
Table 4: Output Indicator 1.1 – Disbursement rate of UBE Intervention Funds (Matching Grants) for basic education (3-year rolling) 7
Table 5: Output Indicator 1.2 – National systems supporting school improvement 8
Table 6: Output Indicators 2.1 – 2.4 Strengthening State and LGEA capacity 9
Table 7: Output Indicators 3.1 – 3.3 Number of schools using a school development plan, head teachers operating effectively, and competent teachers 11
Table 8: Output Indicators 3.4 – 3.5 Number of schools with functioning SBMCs and number of communities where SBMCs reflect concerns of women and children 12
Table 9: Output Indicator 4.1 – Number of marginalised children with improved access to basic education through IQTE, nomadic community education and girleducation initiative 13
Table 10: Output Indicator 4.2 – Inclusive education policies at State level 14
Table 11: Output Indicator 4.3 – Number of Inclusive Schools (public primary schools meeting the needs of all pupils) 15
Table 12: Output Indicator 4.4 – Number of communities supporting inclusive education 16
Table 13: Output Indicator 4.5 – Quality of CSO and community demand for quality and inclusive education 16
Outcome Indicator 1: Number of public primary schools that meet the benchmarks for a good quality school 18
Table 14: Outcome Indicator 2 – Number of additional children in public primary schools in focus LGEAs 18
Education Sector Support Programme in Nigeria

ESSPIN Annual Report 2013 – 2014, December 2014
Table 15: Outcome Indicator 3 – State budget release and utilisation rates, 2013fiscal year (monitoring target – budget release) 19
Impact Indicator 1a: Proportion of Primary 2 and Primary 4 pupils in public primary schools in focus States with ability to read with comprehension and do basic arithmetic calculations 19
Impact Indicator 1b: Number of primary 4 and primary 2 pupils in public primary schools in focus states demonstrating improved learning outcomes 20
Table 16: Impact indicator 2a – Public primary and junior secondary education net enrolment rate (NER) (%) 20
Table 17: Impact indicator 2b – Number of children to benefit from school improvement programme (SIP) in public primary schools21
Table 18: Impact indicator 3a – Public primary education completion rate (%)21
Table 19: Impact indicator 3b – Number of children supported per annum completing primary school (DFID OP indicator) 22
Table 20: Communications and Knowledge Management results, as at July 201423
Table 21: ASC 2013/14 Annual School Census State status report as at July 201424
Table 22: Student and Teacher Data in ESSPIN Supported IQTE Schools 27
Table 23a: High level final position for ESSPIN finances in 2013/14 29
Table 23b High level programme lifetime position for ESSPIN finances 29
Table 24a: Programme Strategy 2011 – 2014 projection of resource allocation across outputs 30
Table 24b: Lifetime actuals (2014) of resource allocation across outputs 30
Table 25: Programme spend by State 2013/14 31
Table 26: Programme spend by Output by State 2013/14 31
Table 27: ESSPIN total road kilometres by year and latest quarter 33
Table 28: Unit cost of activity (programme investment) calculated against projected total results and total lifetime spend for the Programme 34
Table 29: Efficiency indicators and cost per result 2013/14 36
Table 30: Costs of achieving programme impact (Effectiveness)38
Table 31: State budget performance in 2013 fiscal year – cumulative by Quarter4 39
Table 32: ESSPIN Programme Risk Register 45
Education Sector Support Programme in Nigeria

ESSPIN Annual Report 2013 – 2014, December 2014
Acronyms and Abbreviations
ABB Activity Based Budgeting AESPR Annual Education Sector Performance ReportAESR Annual Education Sector ReviewASC Annual School CensusCCT Conditional Cash TransferCGP Civil Society - Government PartnershipCKM Communications and Knowledge ManagementCSO Civil Society OrganizationDE Data EntryDFID Department for International DevelopmentDWP Departmental Work PlanEENET CIC Enabling Education Network – International ConsultantsEMIS Education Management Information SystemESSPIN Education Sector Support Programme in NigeriaFME Federal Ministry of EducationGE Girls EducationHC Honourable CommissionerHR Human ResourcesIQTE Islamiyya Qur’anic and Tsangaya EducationISD (P) Integrated School Development (Planning)LG Local GovernmentLGEA Local Government Education AuthorityM&E Monitoring and EvaluationMDA Ministries, Departments and AgenciesMDG Millennium Development GoalMLA Monitoring Learning AchievementMTR Mid-Term ReviewMTSS Medium Term Sector StrategyNCCE National Commission for Colleges of EducationNEDS Nigeria Education Data Survey NEMIS National Education Management Information SystemNMC National Mathematical CentreNTI National Teachers InstitutePMC Programme Management CommitteePMU Project Management UnitPRS Planning Research and Statistics QA Quality AssuranceQAB Quality Assurance Bureau RMT Result Monitoring TableSBMC School Based Management CommitteeSDPs School Development PlansSLP State Level ProgrammeSESP State Education Sector Project
Education Sector Support Programme in Nigeria

ESSPIN Annual Report 2013 – 2014, December 2014
Education Sector Support Programme in Nigeria
ESSPIN Annual Report 2013 – 2014, December 2014
Introduction
Programme Context
1. ESSPIN is one of DFID’s key public sector reform programmes in Nigeria. It is
providing technical assistance and direct project support in six Nigerian
States (Enugu, Jigawa, Kaduna, Kano, Kwara and Lagos) in order to enable
more Nigerian children to complete a full cycle of basic education of
acceptable quality, leading to meaningful learning outcomes. Its first cycle
ran from July 2008 to July 2014 on a budget of £92m. In July 2014, ESSPIN
was extended for a further 2.5 years on a budget of £33m to consolidate on
the progress made in reforming public schools in partner States. The
extension phase is to run from August 2014 to January 2017.
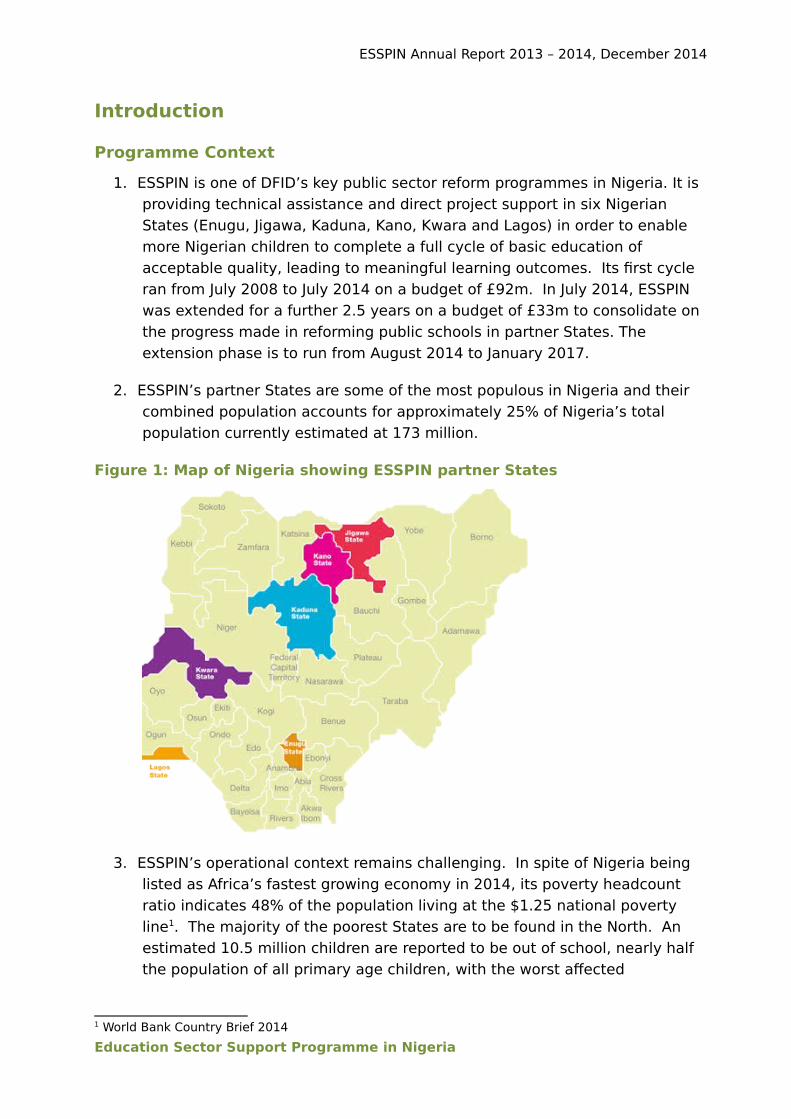
2. ESSPIN’s partner States are some of the most populous in Nigeria and their
combined population accounts for approximately 25% of Nigeria’s total
population currently estimated at 173 million.
Figure 1: Map of Nigeria showing ESSPIN partner States
3. ESSPIN’s operational context remains challenging. In spite of Nigeria being
listed as Africa’s fastest growing economy in 2014, its poverty headcount
ratio indicates 48% of the population living at the $1.25 national poverty
line1. The majority of the poorest States are to be found in the North. An
estimated 10.5 million children are reported to be out of school, nearly half
the population of all primary age children, with the worst affected
1 World Bank Country Brief 2014
Education Sector Support Programme in Nigeria

ESSPIN Annual Report 2013 – 2014, December 2014
demographics being children in the North, from rural and poor households,
and girls2.
4. Learning outcomes are critically low. Basic education funding is unavailable,
poorly targeted or diverted to other uses resulting in poor quality schools.
Teachers and head teachers have limited capacity and little motivation, and
receive weak institutional support in terms of professional development and
welfare. Communities are fragmented and lack the voice to call education
service providers to account. School infrastructure is inadequate, decaying
or both. The flow of direct funds to schools is limited and uneven. The
monitoring of, and support for schools is weak. Government planning
systems are limited, unable to draw on relevant evidence. The priority
accorded to education by the political establishment, notably State
Governors is unpredictable. Consequently, levels of financing and attention
to systemic reform vary by State and over time.
5. These challenges are compounded in some Northern States, including Kano
and Kaduna and Jigawa to a lesser extent, by increasing levels of insecurity.
This has required careful measures to ensure the safety of ESSPIN
programme staff and define ways of working that can sustain programme
delivery. State governments are under pressure to divert resources from
social sectors, including education, to security.
6. The Nigerian General Elections are scheduled for February 2015 with political
campaigns authorised from November 2014. In practical terms, time and
resources in the public sector are likely to be engaged by political concerns
in the period leading up to and following the elections. It was, therefore,
important for ESSPIN to proactively seek as much scale up as possible
during 2013/14 to minimise the impact of the elections on the school
improvement work.
Programme Strategy
7. ESSPIN’s 2011-2014 Programme Strategy developed in response to the Mid
Term Review in 2011 has been fully implemented. Its success in achieving
rapid scale up of the School Improvement Programme, exponentially
increasing the number of children benefitting to 4.7 million by 2014,
accounts for the approval of a 2.5-year extension by DFID. The Extension
Business Case and the 2013 Annual Review were unequivocal in
recommending ‘consolidation’ or ‘deepening’ of the gains of the first cycle
of ESSPIN.
8. ESSPIN’s theory of change3 is fundamentally unchanged since the 2011 Mid
Term Review which recommended increased focus on service delivery. Long
2 Research evidence is limited to verify reported numbers of out of school children in Nigeria3 Detailed ToC narrative in Annex 1
Education Sector Support Programme in Nigeria

ESSPIN Annual Report 2013 – 2014, December 2014
term impact is defined as more children acquiring basic literacy and
numeracy in the first four years of primary school, and more children,
especially girls and other marginalised groups, entering and going on to
complete primary education. For this long term change to occur, medium
term outcomes must include a) better quality schools providing improved
learning environments, b) more children attending these better quality
schools, especially those from disadvantaged backgrounds, and c) State
governments establishing effective school support systems and funding
school improvement sustainably. In the short term, ESSPIN will support
State interventions to:
Improve school quality by training head teachers and teachers,
introducing school development planning and freeing up direct funding
of schools, promoting inclusive practices, encouraging the provision of
teaching/learning materials, and improving classrooms, water supply
and toilets.
Help communities, through School Based Management Committees, to
support and monitor the quality of their schools, to hold government
accountable for quality service, and to address the needs of out-of-
school children.
Strengthen State and local government capacity to support school
improvement through more effective utilisation of federal and State
funds, better planning, budgeting, and monitoring systems based on
credible school data, and well trained school advisory and support
personnel.
Engage with federal institutions to ensure timely and efficient
disbursement of education support funds, and facilitate the
establishment of national systems for supporting school improvement.
9. ESSPIN’s current programme delivery strategy is:
To generate evidence of the effectiveness of the School Improvement
model, ie. demonstrate how coordinated integration of effective school
leadership, competent teaching, active community involvement in
school management, and inclusive practices can improve the overall
quality of a school, thereby creating an environment in which children’s
learning can improve.
To secure State commitment, ownership and funding for scaling up the
School Improvement Programme to as many additional schools as
possible through evidence based advocacy and political engagement at
all levels of the political hierarchy.
Education Sector Support Programme in Nigeria

ESSPIN Annual Report 2013 – 2014, December 2014
To provide technical assistance to build up the capacity of State
personnel so that available resources can be utilised properly and the
School Improvement Programme managed effectively and efficiently.
To prioritise direct impact at school and community levels in the
allocation of programme resources.
To maintain a robust cost and benefit analysis framework aimed at
enabling judgements of value for money.
To implement a clear monitoring & evaluation strategy incorporating
systems for monitoring and assessing sector performance in States as
well as informing regular reporting to DFID.
Taking the School Improvement Programme to scale
10.ESSPIN recorded substantial scale up of the School Improvement Programme
based on targeted use of States’ own resources in 2013/14. Three out of six
States have achieved 100% coverage of primary schools while plans are on
track in the remaining three States to achieve similar coverage by the
2014/15 school year.
Table 1: Cumulative coverage of public primary and JSS – actuals against targets
Education Sector Support Programme in Nigeria

ESSPIN Annual Report 2013 – 2014, December 2014
State
Phase
1
Phase 2
actuals (Mar
2014)
Target July2014
(% targetcompleted
in Phase 2)
Total no.
of publicschools
(Pry+JSS)
Ph 1
as %of all
publicschool
s
Ph 2
as %of all
publicschool
s
Target2014 %
of allpublic
schools
Enugu
91
Mission:186
Public:496
413(120%)
1,515 6% 33% 27%
Jigawa
198 1,
002 1,700
(59%) 2,21
6 9% 59% 77%
Kaduna
165
1,
027
578
(178%)
4,38
0 4% 23% 13%
Kano
312 5,
494
3,30
9(166%)
5,834 5% 94% 57%
Kwara 1
,448 1,48
6 1,796
(83%) 1,79
6 81% 83% 100%
Lagos
100 1,
004 1,004
(100%) 1,31
2 8% 77% 77%
Total 2,314
10,509
8,800
(119%) 17,053 14% 53.3% 51.6%Total
incl Mission “ 10,695 “ “ “ 54.4% “
Source: ESSPIN records and State Annual School Censuses 2011-12
Key:
Target exceeded100% of public primary schools in the state covered: no further primary expansion
possible
11.The positive trajectory of rollout since the 2011 revised strategy and
increased focus on service delivery has been achieved largely through firm
ownership of the SIP and commitment to fund it by State governments.
Education Sector Support Programme in Nigeria

ESSPIN Annual Report 2013 – 2014, December 2014
Figure 2: Trajectory of SIP rollout against projection for 2016 programme endline
Leveraging State resources
12.ESSPIN’s approach to political engagement is based on trusting and long
term relationships with State partners and building access to principal
political actors. SUBEBs and Ministries, and more recently UBEC, now see
ESSPIN and DFID as partners in progress and co-campaigners in efforts to
improve budget releases for timely implementation of school improvement
activities. By July 2014, ESSPIN has leveraged a cumulative total of £14.4m
of State government resources in direct funding of different aspects of the
School Improvement Programme.
Education Sector Support Programme in Nigeria

ESSPIN Annual Report 2013 – 2014, December 2014
Table 2: Financial resources committed to school improvement, July 2012-July 2014
AmountCommitted
(Apr-Jun2014)
AmountCommitted
(cumulative todate, from July
2012)
Source
(Current quarter)
Purpose
(Current quarter)
Enugu
N68.9m(£255,185)
N592.9m(£2,328,515)
SUBEB, Missions, SBMCs
SIP training (HT, teachers, SBMCs), SUBEB functional review, fees for poor children (Mission schools), Mission schools rollout
Jigawa
0(0)
N436.5m(£1,737,410)
- -
Kaduna
N38.5m(£142,593)
N616.5m(£2,431,163)
SUBEB (for SIP), UBEC-IF, MoE, QA board
SIP rollout to 1,027 schools, SSIT salary, QA training, planning and budgeting
Kano 0(0)
N489m(£1,953,000)
- -
Kwara
N14.4m(£53,333)
N177.4m(£691,593)
SUBEB, QA Board
SIP support costs, QA
Lagos
91.1m(£337,407)
724.7m(£2,849,617)
SUBEB, UBEC-IF, MOE, LGEA
SIP support (TPD), SSIT salaries, school running costs,SBMC forum, planning & budgeting
Federal
0(£0)
N593m(£2,372,000)
- -
Total N213m(£0.789m)
N3.63bn(£14.364m)
13.Funding accessed through federal sources, specifically the UBE Intervention
Fund, remains the most predictable and accessible resource for school
improvement rollout. While States like Lagos and Kano are getting better at
releasing funds allocated in the State annual budget, all States still rely on
the non-matching funds for teacher professional development released by
UBEC every year.
Overall Progress on Outputs
Overall progress on Outputs by State
14.2014 logframe targets were largely achieved or on track as shown by the
preponderance of green and amber in the table below, particularly in the
Programme column. Green indicates target achieved or exceeded, amber
means broadly on track, and red off target.
Education Sector Support Programme in Nigeria

ESSPIN Annual Report 2013 – 2014, December 2014
Table 3: State progress against Output targets
OutputIndicators
Programme Enugu Jigawa
Kaduna Kano Kwara Lagos
Insti
tuti
on
al
cap
acit
y 2.1
2.2
2.3
2.4
Sch
ool q
uality 3.1
3.2
3.3
3.4
3.5
Inclu
sio
n 4.1
4.2
4.3
4.4
4.5
2014 Programme Performance – Outputs, Outcomes and Impact
15.This section reviews actual results against 2014 annual targets at the levels
of Output, Outcome and Impact. It also briefly reviews impact in important
cross-cutting areas, namely Inclusion, IQTE, EMIS, M&E, and
communications & knowledge management.
Output 1 – Strengthened National Systems
16.The objective of Output 1 is to strengthen the capacity of federal institutions
to effectively support school improvement in States through making national
funds for education more easily available to States and by establishing
relevant national systems for monitoring school improvement.
Table 4: Output Indicator 1.1 – Disbursement rate of UBE Intervention Funds (Matching Grants) for basic education (3-year rolling)
Milestones
(2010-12)June 2013
Actual
(2011-13)June 2014
ActualEnugu 54% 23%
Education Sector Support Programme in Nigeria

ESSPIN Annual Report 2013 – 2014, December 2014
Jigawa 73% 78%
Kaduna 64% 100%
Kano 100% 100%
Kwara 64% 63%
Lagos 64% 100%
ESSPIN States 70% 77%
Non-ESSPIN States
51% 63%
Source: UBEC publication of IF disbursements from 2005-2013 (ubeconline.com 18 June 2014)
17.The UBE Intervention Fund (UBE-IF) is a major source of funding of basic
education in Nigeria. It is the most predictable source of funding for school
infrastructure, teacher training and learning materials and requires
matching funds from the 36 States and the Federal Capital Territory. Equal
allocations are provided annually but disbursements require satisfactory
utilization of previous disbursements and payment of the statutory matching
State funds.
18.There is significant progress over last year with ESSPIN states averaging 77%
of total allocations in actual disbursements compared with 63% for non-
ESSPIN states. Both averages represent marked improvements in States’
access to the UBE-IF.
Table 5: Output Indicator 1.2 – National systems supporting school improvement
MilestonesMarch2013
Actual
June2014
Actual
August2014
TargetMonitoring Learning Assessment
D C C
Quality Assurance B B B
SBMCs B A B
Source: Federal Self-Assessment Report, June 2014
19.National systems supported by ESSPIN have been rationalised from six to
three: the College of Education accreditation/National Commission for
Colleges of Education (NCCE) and teacher development needs assessment
workstreams have been taken on by the new DFID Teacher Development
Programme, while a national system to support the Annual School Census is
now fully established. Further technical assistance to national Education
Management Information System (NEMIS) is currently led by USAID with
other donor programmes, including ESSPIN, in support roles.
20.The draft report produced by the Ministerial Committee on Monitoring
Learning Achievement (MLA) in which ESSPIN has provided technical support
Education Sector Support Programme in Nigeria

ESSPIN Annual Report 2013 – 2014, December 2014
has led to a Stakeholders’ Forum to critique the report. In consequence, the
document has incorporated stakeholder feedback and now awaits
harmonization of these inputs prior to submission to the National Council on
Education for policy approval. On Quality Assurance (QA), progress has been
made in terms of clarifying the rationale, roles and responsibilities of Federal
agencies – Federal Inspectorate Service and Universal Basic Education
Commission (UBEC) – involved in QA below tertiary level. The Ministerial
Committee on QA has supported the development of a draft policy that was
presented to the Joint Consultative Committee on Education (JCCE), where it
was ‘stepped down’ and has been represented at the reference Committee.
It now awaits reconsideration at the JCCE Plenary and NCE later in the year.
On School Based Management Committees (SBMCs), UBEC has spent nearly
£2.4m to date on national replication of the ESSPIN SBMC model. ESSPIN is
currently supporting UBEC to ensure that quality is not compromised in
delivery.
Output 2 – Strengthened Institutional Capacity at State and LGEA
level
21.The objective of Output 2 is to strengthen the capacity of State and Local
Governments to support their own schools through more effective planning
and budgeting, improved skills and competencies of key personnel,
additional funds directed at school improvement, and collaboration with
non-government stakeholders.
22.There are four indicators for assessing progress in Output 2. They are all
qualitative and are, therefore, measured through an annual State Self
Assessment exercise.
Indicator 2.1
Quality of strategic and operational planning and budgeting, budget execution, performance monitoringand reporting at State and LGEA level
Indicator 2.2
Quality of service delivery systems and processes at State and LGEA level
Indicator 2.3
Quality of school support and quality assurance services at State and LGEA level
Indicator 2.4
Level and quality of State/LGEA engagement with local communities on school improvement
Table 6: Output Indicators 2.1 – 2.4 Strengthening State and LGEA capacity
Milestones2.1 2.2 2.3 2.4
Target
Aug201
Actual
June201
Target
Aug201
Actual
June201
Target
Aug201
Actual
June201
Target
Aug201
Actual
June201
Education Sector Support Programme in Nigeria

ESSPIN Annual Report 2013 – 2014, December 2014
4 4 4 4 4 4 4 4
Enugu B A B A B C B B
Jigawa A A B A B A B A
Kaduna A A B A A A B A
Kano B A B A B A B A
Kwara A A B B A A A A
Lagos A A A A A A A A
Programme
A A B A B A B A
Source: State Self-Assessment Reports, June 2014
23.This report of progress addresses State capacity only, the logical progression
of work in the first phase of ESSPIN. During the extension, there will be
increased focus on LGEA capacity. The Self Assessment performance criteria
will be updated to reflect this focus, and the 2015 Self Assessments will
measure LGEA as well as State capacity.
24.The Self Assessment results across all six States and across the four Output
2 indicators show that performance targets set out for the first phase of
ESSPIN have been substantially achieved. In 11/11 cases (100%), ESSPIN
States have met the maximum A target set. In the remaining 14/17 cases
(82%), they have exceeded the B target and met it in a further two cases.
1/28 targets was missed overall (3.6%) with 27/28 (96.4%) met or
exceeded.
25.Participatory workshops will be held in September 2014, including ESSPIN
and State partners, to agree new performance targets for the extension
period based on further development needs. Three important dimensions
will inform the new performance targets – internal integration, horizontal
integration and vertical integration:
The first concerns the internal efficiency of these systems. When
separate components do not deliver on time, the whole system is thrown
out of kilter. This happens when the Annual School Census (ASC) is late
in execution and completion or when Departmental Work Plans (DWPs)
are not prepared on time. These problems are most marked in the
planning systems but also can be seen in Quality Assurance, financial
management and Human Resource Management.
A second dimension is horizontal integration - the cross-institutional
linkages within and between systems. Insufficient cooperation between
ministries, departments and agencies (MDAs) and bureaucratic protocols
that inhibit communication at technical levels all affect service delivery,
as for example when QA Units fail to integrate their work with the EMIS
Unit and the State School Improvement Team (SSIT).
Education Sector Support Programme in Nigeria

ESSPIN Annual Report 2013 – 2014, December 2014
The third dimension is vertical integration – the linkages between state,
local government and schools/ communities. Much is now happening
across the six states that depend on effective LGEA delivery. Problems
are, in part, the limited capacity of the LGEA staff, requiring professional
development and recruitment; resource problems requiring office space,
computers and transport; political, relating to relations with Local
Government Areas (LGAs), the appointment of Education Secretaries and
links between the Education and Local Government Ministries. A clear
priority arising from the Self-Assessments is the need to promote
integrated bottom-up planning, so that school needs, prioritised in school
development plans, are aggregated and analysed at LGEA level. The
LGEA action plans derived from this analysis then contribute to SUBEB
planning and to the necessary resource provision enabled through the
MTSS and annual budget.
Output 3 – Improved School Quality
26.The objective of Output 3 is to improve the quality of schools in partner
States through a combination of school improvement measures – effective
head teachers, competent teachers, better school development planning,
and functional SBMCs.
27.The SSO reporting system that collects monitoring information for assessing
these indicators is still only operational in public primary schools in all
States and selected Mission schools in Enugu. Results in the following
tables, therefore, are for public primary schools except Enugu where public
primary and Mission schools are aggregated.
Indicator 3.1
Number of schools using a School Development Plan
Indicator 3.2
Number of head teachers in public primary schools operating effectively
Indicator 3.3
Number of teachers in public primary schools who candeliver competent lessons in literacy and numeracy
Table 7: Output Indicators 3.1 – 3.3 Number of schools using a school development plan, head teachers operating effectively, and competent teachers
Milestones
3.1 3.2 3.3Target
Aug2014
Actual June 2014
TargetAug2014
Actual June 2014
Target Aug2014
Actual June 2014
Enugu 289 162 289 446 931 1,785
Jigawa 701 710 701 752 2,243 5,308
Kaduna 508 333 749 521 2,363 3,195
Kano 522 - 2,132 3,376 8,151 12,560
Kwara 1,008 1,300 1,014 1,359 4,054 7,313
Education Sector Support Programme in Nigeria
ESSPIN Annual Report 2013 – 2014, December 2014
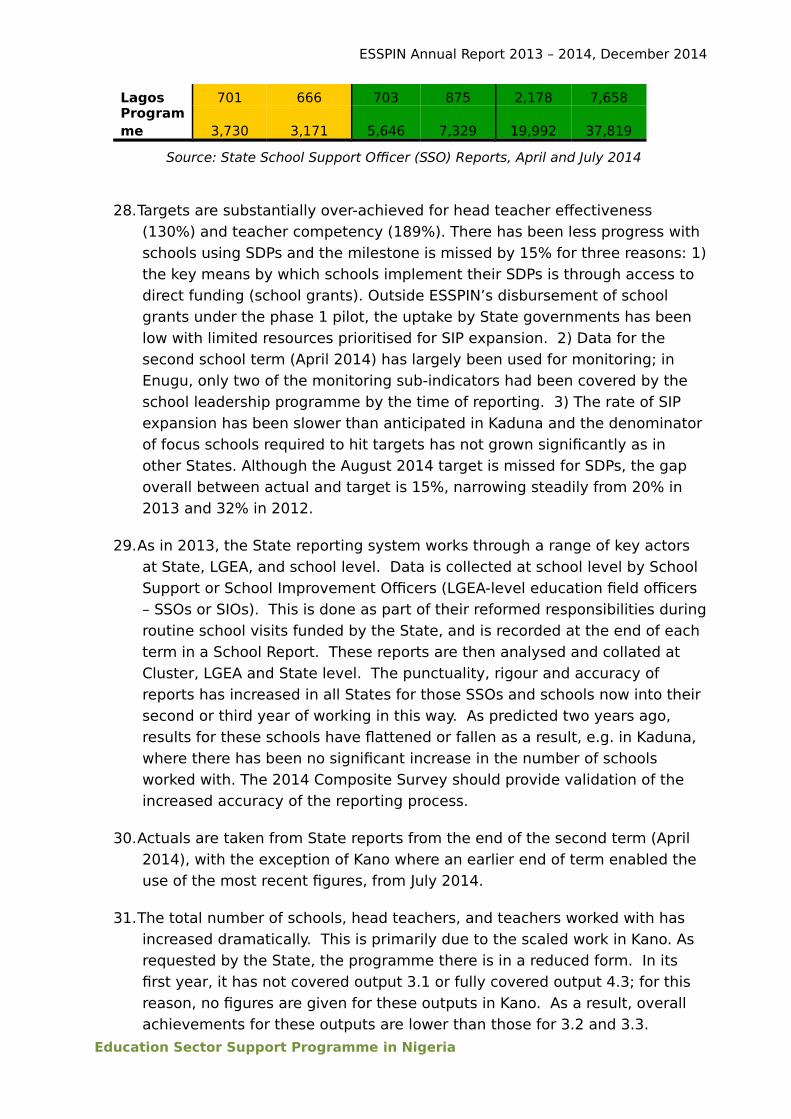
Lagos 701 666 703 875 2,178 7,658Programme 3,730 3,171 5,646 7,329 19,992 37,819
Source: State School Support Officer (SSO) Reports, April and July 2014
28.Targets are substantially over-achieved for head teacher effectiveness
(130%) and teacher competency (189%). There has been less progress with
schools using SDPs and the milestone is missed by 15% for three reasons: 1)
the key means by which schools implement their SDPs is through access to
direct funding (school grants). Outside ESSPIN’s disbursement of school
grants under the phase 1 pilot, the uptake by State governments has been
low with limited resources prioritised for SIP expansion. 2) Data for the
second school term (April 2014) has largely been used for monitoring; in
Enugu, only two of the monitoring sub-indicators had been covered by the
school leadership programme by the time of reporting. 3) The rate of SIP
expansion has been slower than anticipated in Kaduna and the denominator
of focus schools required to hit targets has not grown significantly as in
other States. Although the August 2014 target is missed for SDPs, the gap
overall between actual and target is 15%, narrowing steadily from 20% in
2013 and 32% in 2012.
29.As in 2013, the State reporting system works through a range of key actors
at State, LGEA, and school level. Data is collected at school level by School
Support or School Improvement Officers (LGEA-level education field officers
– SSOs or SIOs). This is done as part of their reformed responsibilities during
routine school visits funded by the State, and is recorded at the end of each
term in a School Report. These reports are then analysed and collated at
Cluster, LGEA and State level. The punctuality, rigour and accuracy of
reports has increased in all States for those SSOs and schools now into their
second or third year of working in this way. As predicted two years ago,
results for these schools have flattened or fallen as a result, e.g. in Kaduna,
where there has been no significant increase in the number of schools
worked with. The 2014 Composite Survey should provide validation of the
increased accuracy of the reporting process.
30.Actuals are taken from State reports from the end of the second term (April
2014), with the exception of Kano where an earlier end of term enabled the
use of the most recent figures, from July 2014.
31.The total number of schools, head teachers, and teachers worked with has
increased dramatically. This is primarily due to the scaled work in Kano. As
requested by the State, the programme there is in a reduced form. In its
first year, it has not covered output 3.1 or fully covered output 4.3; for this
reason, no figures are given for these outputs in Kano. As a result, overall
achievements for these outputs are lower than those for 3.2 and 3.3.
Education Sector Support Programme in Nigeria

ESSPIN Annual Report 2013 – 2014, December 2014
32.During the extension phase, monitoring of these school level indicators will
take a more nuanced approach, distinguishing between basic effectiveness
and advanced effectiveness levels to reflect more realistically the
differentiated rate of progress being made by schools coming into the SIP at
different times. The SSO monitoring tool is yet to be upgraded to
accommodate this improvement. The necessary adjustments to data
collection instruments and associated training of SSOs will take place during
the coming school year.
33.The two SBMC indicators, formerly in Output 4, have been brought into
Output 3 through a revised logframe introduced in the ESSPIN Extension
Business Case and approved by DFID.
Indicator 3.4
Number of public primary schools with functioning SBMCs
Indicator 3.5
Number of communities where SBMCs reflect concernsof women and children
Table 8: Output Indicators 3.4 – 3.5 Number of schools with functioning SBMCs and number of communities where SBMCs reflect concerns of women and children
Milestones
3.4 3.5Target
Aug2014
Actual June 2014
TargetAug2014
Actual June 2014
Enugu 293 680 268 680Basic 208 440 190 525
Advanced 85 240 79 155
Jigawa 711 1,002 651 1,002Basic 572 526 523 568
Advanced 139 476 129 434
Kaduna 760 1,795 696 1,795Basic 644 1,257 588 1,311
Advanced 116 538 107 484
Kano 502 5,081 460 5,081Basic 284 4,525 257 4,627
Advanced 218 556 203 454
Kwara 625 880 572 880Basic 446 51 406 120
Advanced 179 829 166 760
Lagos 713 1,004 653 1,004Basic 643 180 588 181
Advanced 70 824 65 823
Program 3,590 10,442 3,299 10,442
Education Sector Support Programme in Nigeria

ESSPIN Annual Report 2013 – 2014, December 2014
meBasic 2,784 6,879 2,551 7,332
Advanced 806 3,563 748 3,110
Source: Social Mobilisation Officer (SMO) Reports, July 2014
34.The 2013 Annual Review results reflected mainly the Phase 1 ESSPIN pilot
1,151 schools, with a comparison of how these SBMCs had progressed over
time (2011-13). These schools were well into the ‘mentoring’ phase of
SBMC development where CSO and Government Partners (CGPs) mentor
SBMCs on a regular basis and use the SBMC/SMO monitoring tools.
35.At that time, there were already many additional SBMCs which had been
activated and trained in new schools and LGEAs as a result of state roll-out
of the SBMC model (an additional 1,557) but due to the fact that they had
not reached the mentoring stage of the process where monitoring tools are
applied, they were not visible in any of the monitoring data. This under-
reporting resulted in underachievement against 2013 targets.
36.The more nuanced approach to reporting effectiveness (basic/advanced) in
the extension phase has now made it possible for SBMCs to be captured in
the data whether they have reached the monitoring stage or not, through
developing standards for basic SBMC effectiveness and advanced SBMC
effectiveness. Advanced effectiveness includes SBMCs which have scored
‘met’ against criteria in the SMO monitoring tools for SBMC functionality,
women and children’s participation and SBMCs supporting inclusive
education. Basic effectiveness applies to SBMCs which have not yet
achieved ‘met’ against criteria, and SBMCs which are already in the
development process but not yet at the monitoring stage where the tools
are applied and information collected. Notwithstanding their relatively
young status, these ‘basic effective’ SBMCs, upon establishment, have
begun to take positive actions on behalf of their communities and schools.
37.The 2014 Civil Society Organisation (CSO) Self Assessment exercise and two
qualitative studies undertaken in 2014, SBMC Qualitative Study of Impact
and CSO Synthesis Report, both validate the tremendous progress that
SBMCs have made in the last year as captured in the SMO reports.
Output 4 – Inclusion
38.The objective of Output 4 is to promote inclusive policies and practices in
basic education at all levels – State, school and community.
Table 9: Output Indicator 4.1 – Number of marginalised children with improved access to basic education through IQTE, nomadic community education and girl education initiative
Milestones
Actual June 2014 Target Aug 2014Female Male Total Total Female Male
Education Sector Support Programme in Nigeria

ESSPIN Annual Report 2013 – 2014, December 2014
IQTE (Kano, Kaduna, Jigawa)
11,544 15,818 27,362 23,000
Nomadic education (Jigawa)
5,956 6,469 12,425 9,285
Girl Education Initiative (Jigawa)
4,806 0 4,806 6,000
CCT (Kano) 1,831 0 1,831Albino foundation (Kaduna)
174 158 332
Programme 24,311 22,445 46,756 38,285
ESSPIN and SUBEB project reports (annual)39.The IQTE programme has received huge support from the Kano State
government with over N150m released for rollout in the last 18 months. The
2014 release is currently in process. There is less traction in Kaduna and
Jigawa where the State governments have not prioritised investment in
IQTE. Further political engagement with these two governments will be
carried out in 2014/15 to determine whether commitment can be mobilised.
The net result is 119% achievement of the target.
40.ESSPIN has recommended closure of the Kano CCT pilot to DFID based on
lack of State government backing. In an environment where KSG has
invested significantly in SIP rollout, demonstrating interest and commitment,
no matching funds have been provided in nearly two years to enable
continuation of the project. ESSPIN has requested permission from DFID to
reallocate already committed funds to other relevant initiatives for
improving participation of girls in junior secondary education in Kano.
Table 10: Output Indicator 4.2 – Inclusive education policies at State level
Source: State Self-Assessment Reports June 2014
41.The 2014 Self Assessment results are positive and indicate that all States are
on track in ensuring that enabling policies are put in place for the needs of
all children, especially those from marginalised groups, are met. All six
Education Sector Support Programme in Nigeria
June2013
Actual
June2014
Actual
August2014
Target
Enugu D B C
Jigawa B B B
Kaduna A A A
Kano C B B
Kwara B A A
Lagos B B B

ESSPIN Annual Report 2013 – 2014, December 2014
States have either met or exceeded the targets set. Four out of the six
States now have inclusive education policies in place with Kaduna also
managing to secure appropriate legislative backing. UBEC has now accepted
the existence of an IE policy as the pre-condition for States to access its
small IE non-matching grant; Kaduna successfully accessed N14m as a
result in 2013. The two States yet to fully sign off their IE policies, Jigawa
and Kano, are however already addressing inclusion issues on the basis of
the draft policy framework, e.g. Jigawa has just concluded a survey of out-of-
school children.
Table 11: Output Indicator 4.3 – Number of Inclusive Schools (public primary schools meeting the needs of all pupils)
Milestones
June 2014Actual
August2014
Target
Enugu 425 289
Jigawa 821 701
Kaduna 298 749
Kano - 1,599
Kwara 1,349 1,014
Lagos 746 703Programme 3,639 5,167
Source: State School Support Officer (SSO) Reports, April and June 2014
42.Targets are exceeded in all States except Kano and Kaduna, representing real
progress in pupils’ experiences of school. In Kano, no data was collected for
this indicator as there was very limited coverage of inclusive behaviours in
the training content of the 2013/14 Teaching Skills Programme which
prioritised basic literacy and numeracy for teachers. Inclusive behaviour is a
higher order skill that will be introduced gradually in the next phase of
development. The overall programme target would be easily achieved with
Kano schools factored in.
43.The measurement of ‘inclusive schools’ relies in part on the degree to which
schools are addressing access and inclusion within their SDPs. Where SDP
work has not progressed smoothly or performance depressed, this has had a
knock-on effect on the inclusive schools indicator. This was the case in
Kaduna.
Education Sector Support Programme in Nigeria

ESSPIN Annual Report 2013 – 2014, December 2014
Table 12: Output Indicator 4.4 – Number of communities supporting inclusive education
MilestonesJune 2014 Actual
August 2014 Target
Enugu 680 293
Basic 451 208Advance
d 229 85
Jigawa 1,002 711Basic 527 572
Advanced 475 139
Kaduna 1,795 760Basic 1,319 644
Advanced 476 116
Kano 5,077 502Basic 4,572 284
Advanced 505 218
Kwara 880 625Basic 79 446
Advanced 801 179
Lagos 1,004 713Basic 144 643
Advanced 860 70
Programme 10,438 3,590
Basic 7,092 2,784Advance
d 3,346 806
Source: State Social Mobilisation Officer (SMO) Reports, June 2014
44.The results demonstrate great improvements in efforts of local communities
to support access to education for all children, monitor children dropping out
of school – understanding the causes and making the community at large
aware, and encouraging greater interaction between parents and schools
with regards to children’s well being and learning progress. This positive
indicator also suggests that SBMCs and head teachers are taking action to
address and report child protection issues in and around the school.
Table 13: Output Indicator 4.5 – Quality of CSO and community demand for quality and inclusive education
MilestonesJune 2014 Actual
August 2014 Target
Enugu A B
Education Sector Support Programme in Nigeria

ESSPIN Annual Report 2013 – 2014, December 2014
Jigawa A BKaduna A BKano A BKwara A BLagos A BProgramme A B
Source: State Self-Assessment Reports, June 2014
45.ESSPIN has provided capacity development to 43 CSOs across the six States
to work in partnership with government to activate, train, mentor and
monitor SBMCs as the vehicle for improving community engagement in
education and school governance. Initial SBMC research (2009) highlighted
that the relationship between civil society and government in states was
extremely weak and there was generally a very high degree of scepticism
that such a partnership could work. However, in July 2014 the situation has
changed with almost all of the CSOs which supported the pilot SBMC
development work now contracted directly by State governments to roll out
SBMCs in new schools and LGEAs. UBEC has also adopted this approach
and has directed all other states to partner with CSOs to activate, train and
mentor SBMCs.
46.CSOs working on ESSPIN have produced approximately 700 monitoring
reports between 2011 and 2014. These were recently analysed and pulled
together in a 2014 CSO Synthesis Report.
47.Performance criteria defined for CSO capabilities in the first phase of ESSPIN
are now largely achieved as shown in the 2014 Self Assessment score of A
across all States, universally exceeding expectations. New criteria will be
drawn up for tracking performance over the extension phase. These criteria
will challenge CSOs to take their voice and accountability work further and a
competitive Consolidation Fund will be introduced to make CSOs more
efficient in how they organise themselves and support the SIP, tailoring their
work to the particular circumstances of the children and communities in
which they are embedded.
Outcome – Better Quality Education Services
48.ESSPIN’s stated outcome is quality of, and access to, basic education
improved equitably and sustainably.
49.Data availability and credibility in Nigeria continue to be major issues in the
effective monitoring of education related changes at Outcome and Impact
levels. For example, it became impossible to track ESSPIN’s poverty
indicator on school attendance rate of children from poor homes (Outcome)
due to the absence of a household survey since NEDS 2010 which
Education Sector Support Programme in Nigeria

ESSPIN Annual Report 2013 – 2014, December 2014
established the baseline for the indicator. DFID, therefore, approved for the
indicator to be replaced by ‘the number of additional children in school in
ESSPIN focus LGEAs’ (a DFID Operational Plan indicator), thereby enabling
ESSPIN to make a direct contribution to DFID’s own country results.
Similarly, ESSPIN’s monitoring of State expenditure on school improvement
was hampered by a persistent lack of transparent and timely data on State
expenditure, particularly at Local Government level. DFID approved for
quarterly State budget release rates to be used as a proxy measure given
ESSPIN’s success in obtaining real time data through a Quarterly Monitoring
Report presented and signed off by State Education Commissioners as part
of their quarterly meeting facilitated by ESSPIN. Both of these changes are
incorporated within ESSPIN’s new Extension logframe.
50.The following Outcome and Impact indicators are based on the Extension
logframe. With the exception of the two new indicators mentioned above,
additional children in school and budget release rates, all of the indicators in
the previous logframe are covered. Gender parity in basic education is
addressed through disaggregation of net enrolment rates by sex.
Outcome Indicator 1: Number of public primary schools that meet the benchmarks for a good quality school
51.This indicator relies on Composite Survey 2 currently in progress.
Table 14: Outcome Indicator 2 – Number of additional children in public primary schools in focus LGEAs
Baseline 2009
Actual June 2014 Target June 2014
Male Female Total Male Female TotalEnugu 0 2,124 1,706 3,830
Jigawa 0 8,826 17,827 26,654
Kaduna 0 60,926 55,063 115,989
Kano 0 137,055 142,928 279,983
Kwara 0 36,826 38,198 75,024
Lagos 0 -22,015 -22,752 -44,767 Programme
0223,742 232,970 456,713
119,388
129,502
248,890
Source: Annual School Census, 2009/10 – 2013/14
52.The number of additional children takes cumulative year-on-year differences
in gross enrolments between the 2009/10 and 2013/14 academic years in
ESSPIN focus LGEAs. The result as at June 2014 exceeds target in spite of
challenging factors such as the perennial migration of children from public
to private primary schools in Lagos and escalating conflicts affecting
communities and schools in northern Nigeria.
Education Sector Support Programme in Nigeria

ESSPIN Annual Report 2013 – 2014, December 2014
53.Significantly, the largest numbers of additional children in primary school are
recorded in the northern States where enrolment rates are historically low.
Further, in three of the four northern States – Jigawa, Kano and Kwara –
there are more additional girls in school than boys.
54.The positive trend in primary school enrolments is depressed by the Lagos
returns which show fewer children in primary school in 2014 than was the
case in 2010. Movement from public to low cost private schools is widely
conjectured as a factor; however, this cannot be validated until there is a
comprehensive census of children attending private schools. A more recent
factor, also worthy of investigation, is the reported withdrawal of children
from Lagos primary schools back to Ogun schools following cancellation of
prohibitive levies which had forced many parents in Ogun to send their
children to schools on the Lagos side of the Ogun-Lagos border. Lagos and
Ogun are contiguous States with free flow of business and human traffic.
Table 15: Outcome Indicator 3 – State budget release and utilisation rates, 2013 fiscal year (monitoring target – budget release)
Quarter 1 Quarter 2 Quarter 3 Quarter 4
YearAllocation (N)
Budget
release
Budgetutilisati
on
Budget
release
Budgetutilisat
ion
Budget
release
Budgetutilisati
on
Budget
release
Budgetutilisati
onBenchmark 25% 25% 50% 50% 75% 75%
100% 100%
Enugu16.4b
n 14.8 14.8 45.6 45.6 60.5 60.6 66 58.4
Jigawa 8.2bn 1.2 1.2 3.3 3.1 59.1 58 93.5 93.5
Kaduna 18.2b
n 7 5.7 15.5 15.5 30.9 21 35.3 31
Kano44.8b
n 0.7 0.7 15.3 15.1 31 31 62 62
Kwara 9.2bn 8.1 7.8 30.4 16.5 33.9 21.9 43.7 25.6
Lagos 37bn 21.5 21.2 46.2 33.1 44.9 43.1 75 83Programme
147.6bn 8.9 8.8 27.6 23.1 40.9 37.6
62.7 61.3
Source: State Quarterly Monitoring Reports, Q1-Q4 2013
55.The 2013 year-end education budget release rate of 62.7% (average for the
six ESSPIN States) is a marked improvement on the 38% logframe baseline
recorded at the end of September 2013 and exceeds the 50% logframe
target for August 2014. The release and utilisation data is gathered through
the quarterly meeting of education Commissioners and SUBEB Chairs and is
currently the most reliable means of tracking State expenditure related to
school improvement activities.
56.Jigawa, the strongest performing State by the end of the 2013 fiscal year,
exemplifies the pattern of budget releases in Nigerian States: there was
Education Sector Support Programme in Nigeria

ESSPIN Annual Report 2013 – 2014, December 2014
virtually no activity in the first half of the year (only 3.3% of the year’s
allocation released by June), but frantic financial activity in the second half
of the year ensured that relevant school improvement activities as per
agreed workplans had been fully funded by December. In Enugu and Kwara,
SIP rollout to date has been funded exclusively out of the UBEC TPD non-
matching grants; so although appreciable levels of releases are recorded,
State government funds in 2013 did not supplement SIP rollout funding.
Impact – Better Learning Outcomes for all children
ESSPIN’s stated impact is better learning outcomes for children of basic education school age in the programme’s six States.
Impact Indicator 1a: Proportion of Primary 2 and Primary 4 pupils in public primary schools in focus States with ability to read with comprehension and do basic arithmetic calculations
57.This indicator relies on Composite Survey 2 currently in progress.
Education Sector Support Programme in Nigeria

ESSPIN Annual Report 2013 – 2014, December 2014
Impact Indicator 1b: Number of primary 4 and primary 2 pupils in public primary schools in focus states demonstrating improved learning outcomes
58.This indicator relies on Composite Survey 2 currently in progress.
Table 16: Impact indicator 2a – Public primary and junior secondary education net enrolment rate (NER) (%)
Actual June 2014Target August
2014Primary JSS
Primary JSSTotal Girls Total Girls
Enugu 51% 54% 57% - 92%60%
Jigawa 55% 48% 27% -Kano 100% 100% 37% - Baseline 2009Kaduna 85% 81% 39% - Primary JSS
Kwara 55% 54% 51% - 84%54%
Lagos 26% 26% 53% -Programme 62% 60% 41% -
Source: Annual School Census June 2014
59.Calculation of school demographic indicators in Nigeria remains bedevilled
by the unreliability of age population data from the 2006 national population
census. In a number of States, including Kano, the census reported fewer
children in the primary school age population than there were in primary
schools, thereby translating into net enrolment rates of over 100% (this is
nonsensical given what is known about large numbers of out-of-school
children). Based on the 2013/14 ASC, Kano returned NERs of 117% and
122% for all primary age children and for girls respectively. Both results
have been capped at 100% in the table above; however, it is inaccurate to
conclude that all primary age children in Kano are now in school, in spite of
the commendable efforts of the State government.
60.Another factor currently limiting the utility of school demographic data
relates specifically to Lagos. Over the last few years, public schools appear
to be losing children increasingly to private schools – a 19% drop in public
primary enrolment was recorded between 2013/14 and 2012/13. However,
comprehensive census data on children attending private schools is not yet
available. Until this happens, the pattern of low enrolments in public primary
schools cannot be fully explained.
61.Data quality issues aside, it is positive that overall NERs for girls in primary
school broadly keep up with the rates for all children (even in Jigawa which
has always had the lowest rate of female participation). Efforts to get more
Education Sector Support Programme in Nigeria

ESSPIN Annual Report 2013 – 2014, December 2014
girls into school appear to be yielding results. In gross enrolment terms,
current gender parity indices in primary schools stand at: Enugu 0.9, Jigawa
0.75, Kaduna 0.86, Kano 0.97, Kwara 0.94 and Lagos 1.03.
Education Sector Support Programme in Nigeria

ESSPIN Annual Report 2013 – 2014, December 2014
Table 17: Impact indicator 2b – Number of children to benefit from school improvement programme (SIP) in public primary schools
Actual June 2014 Target August 2014
Male Female Total Male Female TotalEnugu 103,717 92,892 196,609
Jigawa 211,714 162,213 373,928
Kaduna 192,191 168,631 360,821
Kano1,485,09
6 1,431,0612,916,15
7
Kwara 208,887 196,208 405,095
Lagos 230,165 237,401 467,566 Programme
2,431,770 2,288,406
4,720,176
1,500,600
1,300,8002,900,40
0
Source: Annual School Census June 2014
62.The rate of SIP expansion over the last 18 months has been substantial.
Primary school coverage is currently 100% in Lagos, Kano and Kwara. In
Jigawa, Kaduna and Enugu – coverage rate of 59%, 23% and 33%
respectively – all LGEAs, if not all schools, are covered. ESSPIN’s institutional
capacity building work, aimed at equipping SUBEBs to effectively support
SIP delivery, adopts a State-wide outlook to ensure that all schools benefit
from management improvements. This indicator, therefore, takes State level
enrolments and applies proportions of SIP coverage in each State to
estimate the number of children reached by the programme. DFID is
currently benefitting an estimated 4.7m children, 48% of them girls, across
the six ESSPIN States. This represents 72% of children currently enrolled in
primary schools in the six States.
Table 18: Impact indicator 3a – Public primary education completion rate (%)
Actual June 2014 Target August 2014
Total Girls Total GirlsEnugu 86% 88% 55%
Jigawa 83% 77%
Kaduna 75% 73% Baseline 2009
Kano 70% 70% Total
Kwara 87% 91% 48%
Lagos 52% 51% Programme
75.5% 75%
Source: Annual School Census June 2014
63.The calculation of primary completion rates is based on the UIS proxy: grade
6 enrolment less repeaters expressed as a proportion of 11-year olds in the
general population. The 2013/14 results are very positive. Significantly,
Education Sector Support Programme in Nigeria
ESSPIN Annual Report 2013 – 2014, December 2014
completion rates for girls are roughly at par with the averages, including in
northern States where it is widely believed that early marriage prevents girls
from completion. An analysis of dropout rates in grade 6 corroborates the
emerging picture that perhaps more girls than widely believed are
completing primary education in northern States. Dropout rates in upper
primary (grades 5 and 6) were: 2% for both girls and boys in Jigawa, 1.3%
for girls and 1.4% for boys in Kaduna, while only Kano still shows disparity in
favour of boys at 9% for girls and 6% for boys.
64.The Lagos result would again suggest that substantial numbers of children
leave public primary schools before grade 6. In addition to possible flight to
private schools, it is also known that many children transit to JSS after grade
5.
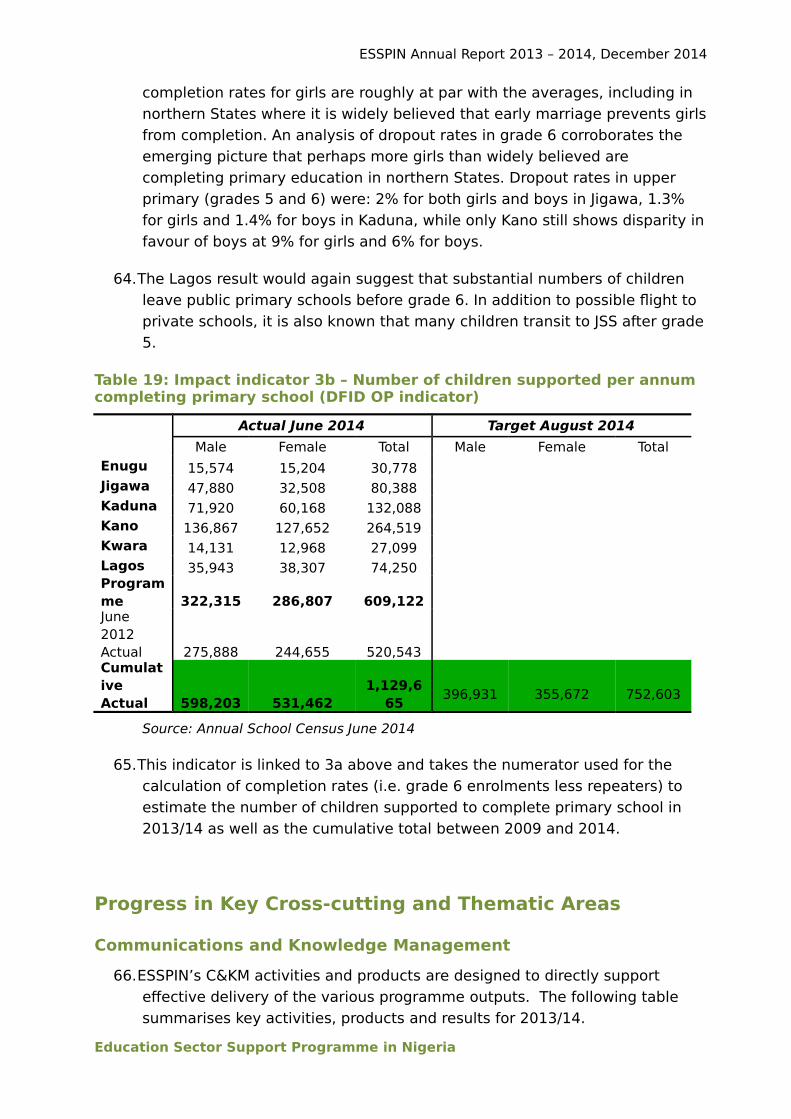
Table 19: Impact indicator 3b – Number of children supported per annum completing primary school (DFID OP indicator)
Actual June 2014 Target August 2014
Male Female Total Male Female TotalEnugu 15,574 15,204 30,778
Jigawa 47,880 32,508 80,388
Kaduna 71,920 60,168 132,088
Kano 136,867 127,652 264,519
Kwara 14,131 12,968 27,099
Lagos 35,943 38,307 74,250 Programme 322,315 286,807 609,122June 2012 Actual 275,888 244,655 520,543Cumulative Actual 598,203 531,462
1,129,665
396,931 355,672 752,603
Source: Annual School Census June 2014
65.This indicator is linked to 3a above and takes the numerator used for the
calculation of completion rates (i.e. grade 6 enrolments less repeaters) to
estimate the number of children supported to complete primary school in
2013/14 as well as the cumulative total between 2009 and 2014.
Progress in Key Cross-cutting and Thematic Areas
Communications and Knowledge Management
66.ESSPIN’s C&KM activities and products are designed to directly support
effective delivery of the various programme outputs. The following table
summarises key activities, products and results for 2013/14.
Education Sector Support Programme in Nigeria

ESSPIN Annual Report 2013 – 2014, December 2014
Table 20: Communications and Knowledge Management results, as at July2014
Activity Product OutcomeFilm 30 min film version of
community theatre script produced in four languages
(Pidgin, Hausa, Yoruba and Ibo)for public viewing in all six
states and broadcast on national and state television
stations.
3 Impact documentaries on
IQTE and results of interventions in Lagos and
Enugu produced for broadcast.
2 Illustrative Classroom
Teaching video for North and South produced.
120,000 member audience directly sensitised and mobilised on a range of education issues, e.g. parents’ responsibilities, inclusive education, community participation, School Improvement Programme and teacher attitudes, plus DVD and web audience informed, sensitised and mobilised on education issues and developments.
12 million stakeholders sensitised onresults of ESSPIN and state partners reform interventions
30,000 teachers informed different aspects of quality good classroom practice.
Radio 39 episodes of Gbagan Gbagan
weekly drama continued
rebroadcast on 10 state and national radio stations carrying
education themes and story lines
26 minute radio discussion
programme in six languages
(English, Hausa, Yoruba, Ibo, Nupe and Batunu) relating to
teachers’ competence standards produced and
broadcast on national and state based stations
24.6 million radio listeners across Nigeria, plus DVD and web audience informed, sensitised and mobilised on education issues and developments
40 million radio listeners across Nigeria informed and sensitised on expected learning outcome achievement by pupils
Information,Education and Communication (IEC) printed materials
12 Evidence of Impact papers24 Case Studies2 ESSPIN Express publications47,600 Inclusive Education posters47,600 SBMC posters
10,000 education sector and programme stakeholders informed/sensitised/ and mobilised on ESSPIN approach to school improvement with lessons shared and evidence of impact provided
300,600 community members sensitised on inclusive education andcommunity participation in basic education
SUBED Social MobilisationDepartments C&KM
6 SUBEB SMDs’ capacity enhanced and producing newsletters, radio programming,drama production and jingle productions with state funds
More strategic and better quality communications for social mobilisation, including for SBMC development and promotion of inclusive education
Education Sector Support Programme in Nigeria

ESSPIN Annual Report 2013 – 2014, December 2014
capacity development
More effective and accessible use of field data for reporting/providing evidence of impact, and improving SUBEB communications
Sources: TV, radio, press coverage based on Annual Media Planning Service (AMPS) 2010 and ENABLE media audience surveys 2009-2010. Website Resources (documents/IEC materials/Audio/Visual) at http://www.esspin.org/index.php/resources
Education Management Information System (EMIS)
67.Originally scheduled as the final year of ESSPIN, the 2013/14 programme
year was intended to be a transitional period with respect to EMIS. The
progressive reduction year-on-year of ESSPIN support to States for
conducting the Annual School Census (ASC) continued. It was observed that
the majority of States slipped several months behind schedule in conduct of
the census enumeration, and several again struggled with full and timely
budget allocation and release to support the exercise. Despite the centrality
of the ASC evidence in sector performance reviews, medium term planning
and budget defence, and the urgency of the exercise for three States which
needed the data for Global Partnership for Education submissions, there
remains an impression that the stakes remain highest for DFID/ESSPIN as
the ASC is the source of key results data for the programme. Therefore,
although the States have caught up admirably this year, and the quality of
the exercise in ESSPIN States is still relatively high compared to other States
in Nigeria, this does raise concerns about sustainability of the process after
the ESSPIN Extension period is completed, which needs to be addressed in
the remaining 2015 and 2016 exercises.
68.The following table summarises progress by State with respect to the
2013/14 ASC cycle up to end of Programme Year 6.
Table 21: ASC 2013/14 Annual School Census State status report as at July 2014
Key
Completed
Ongoing
Outstanding
S/N
Activities Enugu Jigawa Kaduna Kano Kwara Lagos
1 ASC Enumeration
2 Collation of Forms
3 Data Entry
4 Data Cleaning
Education Sector Support Programme in Nigeria

ESSPIN Annual Report 2013 – 2014, December 2014
5 Data Analyses
6 Preparation of Tables
7 Development of Draft ASC Report
8 Vetting and Finalization of ASC Reports
9 Preparation of LGA and School Report Cards
10 Printing and Dissemination of ASCReports
11 Update of ISDP Database
12 Publication and Dissemination of ISDP Database
Alternative data and knowledge management systems
69.The Annual School Census represents only one strand of ESSPIN’s support to
increased capacity for knowledge generation and use in partner States. It is
a rigorous foundation for evidence-based planning and guiding financial
investments. It has been applied to management decision-making through
tools such as the Integrated School Management approach which prioritises
schools for investments required. The ASC is strongest in terms of input
monitoring. It is now complemented by a range of other systems and
approaches.
70.All ESSPIN States have introduced data collection, collation and analysis
systems relating to the work of School Support Officers (SSO) and Social
Mobilisation Officers (SMO) respectively. Conceptually speaking, these data
systems are positioned between the Annual School Census (ASC) on the one
hand, and ESSPIN Composite Surveys (CS) on the other. Like the ASC, they
cover all schools, thereby providing a comprehensive snapshot of schools
services at a given point in time—in this case, termly. Like the CS, they focus
on processes and indicators of the results from inputs such as training,
professional development and community engagement in school
governance. To the extent that they are aligned to the ESSPIN logframe
indicators, they provide a means of on-going monitoring of standards and
progress with reform of school service delivery. Above all, they are
conducted and managed as mainstreamed education data systems: part of
the day job of the cadres of government officers who are proximate to
schools and communities. Their introduction has expanded the group of
State and Local Government personnel who regard evidence-based planning
as part and parcel of their own responsibilities, ie, going beyond
administrative data collection to meaningful engagement with the issues of
quality of education in schools, and access of all children to school. These
systems also allow a time series of trend data to be built up in due course,
although it is important to allow a period for the systems to bed down and
Education Sector Support Programme in Nigeria

ESSPIN Annual Report 2013 – 2014, December 2014
become sufficiently reliable and valid in terms of the capacity of the
thousands of personnel responsible.
71.At a different scale, the ESSPIN Challenge Fund was used in Kaiama LGEA,
Kwara State, to pilot the Community EMIS (C-EMIS) methodology. That has
been adapted to local context with a second pilot in Jigawa, using a focus
group, community representative approach rather than the exhaustive
house by house system originally used in Kaiama. Looking ahead,
Programme Year 7 will see a review of the two experiences leading to
recommendations about the way forwards for State interested in applying a
similar approach to understanding the fine grained detail of children’s
access to, marginalisation from and participation in schooling.
72.Another successful Kwara-based pilot, the LGEA Database, is scheduled for
rolling out to four LGEAs in each of the other five ESSPIN-supported States in
Year 7. This is designed to fully align with the SSO and SMO reporting
systems, thereby enhancing the analytic and practical applications of those
knowledge management systems.
73.In addition, ESSPIN is partnering Charlie Goldsmith Associates to address the
critical question of children’s attendance in school. To the extent that
ESSPIN’s theory of change is founded on the assumption that more
competent teaching, more inclusive schools, enhanced academic leadership
and school management, improved school environments, and better school
governance result in better learning outcomes, it is crucial that a critical
mass of children should actually be present in school regularly. An SMS-
based daily reporting system, feeding into a real-time updated online public
access website, on a pilot scale initially, will start to inform education
stakeholders at school, community, local, state and programme levels about
that dynamic.
Islamiyya, Qur’anic and Tsangaya Education (IQTE)
74.The IQTE programme is running at scale in Kano State, having been
institutionalised under SUBEB. State engagement has been substantial,
resulting in expansion from 3 LGEAs to 16, and a joint plan to cover the
remaining 28 LGEAs during the 2014/15 academic year. 11,900 children are
now benefiting from access to the core primary curriculum in the learning
centres of choice decided by their parents and communities. These are
children who are currently counted within the official ‘out of school’ statistics
because they are not enrolled in conventional public or private primary
schools or integrated Islamiyya. Critically, although they are not counted
as being in school, we can say with confidence that they are being
educated: out of the 679 candidates who sat the Kano State Transition
Exams 2014/15, 658 passed (97%) and have received offers to enter
mainstream junior secondary schools. That will have a major impact on
Education Sector Support Programme in Nigeria

ESSPIN Annual Report 2013 – 2014, December 2014
those children’s life opportunities, potentially setting them on a different
path from that which would have been their lot in life in the absence of this
intervention.
75.Kano State has instituted a new Islamic Education Board—something that
was the focus of ESSPIN’s technical assistance in the inception phase of the
programme—which is likely to assume responsibility for the IQTE
intervention once it reaches full establishment. Concerted efforts are
required from a broad coalition of partners to secure Kano State
Government release of the funding required for the Community Teachers
and Support Teachers to be paid. Currently a N109m backlog in pending
payments threatens the sustainability of the existing programme, even
before Cohort 5 expands the number of children served by another 14,560
with the balance of these funds. ESSPIN is assisting Kano SOME to apply for
matching grant funds from the Qatari Educate A Child Foundation, in order
to increase access to the IQTE programme throughout the State.
76.Uptake of the IQTE model in Kaduna and Jigawa States has been more
limited. ESSPIN has adopted the position of not funding any new cohorts in
those States: technical assistance remains available but additional
enrolments and coverage must be at the States’ own initiative and cost for
sustainability. Participation data by IQTE Cohort, school type and gender
across the three States are shown in the tables below.
Education Sector Support Programme in Nigeria

ESSPIN Annual Report 2013 – 2014, December 2014
Table 22: Student and Teacher Data in ESSPIN Supported IQTE Schools
Education Sector Support Programme in Nigeria

ESSPIN Annual Report 2013 – 2014, December 2014
Inclusive Education
77.ESSPIN’s Approach Paper on Inclusive Education established a common
approach and language shared between the programme’s Outputs. It
articulated a simple model in which better educational quality, access and
equity each play a part in expanding the ‘space’ of safe and effective
learning opportunities for all children in Nigeria. To the extent that the
programme’s main quality, access and equity initiatives—which increasingly
touch all schools in most of the six States—are not of themselves sufficient
to address the needs of all marginalised children, specific interventions such
as the Challenge Funds, IQTE, Girls’ Education in Jigawa, engagement with
the Albino community and stakeholder groups concerned with education of
children affected by disability are provided for.
78.Moving forwards, ESSPIN proposes to develop this thinking with explicit
adoption of a Capabilities Approach to the inclusive education discourse. Put
simply, this places the child at the centre of our work. What does each child
value in his or her life? What does she or he want to do, and to be, both now
and in the future? What constraints does she or he face? Who controls those
barriers in their lives? We have already witnessed the successful application
of this approach in the Nigerian context in the Kwara rural female teachers
study, and can now apply it more broadly to the challenge of making
education inclusive for all.
79.One of the strengths of the capabilities lens is that it takes away the sense of
blame and failure which can permeate the education sector, particularly
with respect to the role and position of teachers. This is certainly not to say
that teachers are unimportant in improving children’s education. It is to
recognise that a teacher on her own is relatively powerless to guarantee a
decent education to the children in her class if she is not adequately
supported by the enabling environment of school, local community, local
government and state authorities. If we identify obstacles to participation
and learning, the root causes of those can be analysed, and appropriate
agents and resources mobilised to overcome them. By extension, the same
goes for head teachers, SBMC members, CSO partners, local government
staff such as SSOs and SMOs, and indeed State School Improvement Team
members and education sector managers. What competences do each of
them need, in order to help children achieve their aspirations and potential?
In this way, the Capabilities Approach is an excellent fit to ESSPIN’s ambition
to help every school to continuously improve and raise the standard of
education it provides for every child. In doing so, and teaching children as
individuals not teaching the curriculum as such, education will become more
inclusive of all.
80.The next step in the process will be to extract the testimony of children,
teachers and community members from the rich voice and advocacy
Education Sector Support Programme in Nigeria

ESSPIN Annual Report 2013 – 2014, December 2014
resources in ESSPIN’s archives, in order to identify the key constraints in
context. Those in turn will be related to the different Inclusive Education
work streams that ESSPIN has in train and planned for Years 7 and 8.
Typically, those work streams cut across Output domains and require
integrated teams for successful engagement with stakeholders and State,
local and school partners.
81.They also map directly onto ESSPIN spheres of influence: schools,
communities, civil society, local government, State government and federal
level. We expect the insights gained to work in synergy with the new
initiatives being launched in Year 7: building on the findings of the education
and conflict analysis; identifying the climate change adaptation and
mitigation measures required for overcoming constraints to participation in
education in Nigeria; and monitoring of pupil attendance which is expected
to reveal patterns of exclusion and prioritising how to remove those.
Resources and Value for Money
Deployment of ESSPIN Resources
82.DFID approved a contract amendment in August 2013 that increased
ESSPIN’s total programme budget from £83.5m to £92m. The amendment
was approved “to secure the service delivery results in the ESSPIN logical
framework”4. Specifically, the increased budget was to help ESSPIN cope
with the rising costs of operations due to the security situation in the North,
fund the Composite Survey in 2014, support Community-EMIS and surveys
of out-of-school children, provide TA to support GPE applications by Jigawa,
Kaduna and Kano States, and provide interim TA to the National Commission
for Colleges of Education (NCCE) in advance of DFID’s Teacher Development
Programme (TDP).
83.This section presents ESSPIN’s high level financial report for 2013/14. It
analyses deployment of ESSPIN Year 6 resources by type of expenditure, by
State and by Output. The balance of spend across Outputs continues to be
guided by the 2011 Programme Delivery Strategy which called for
differentiated allocations to reflect the order of emphasis assigned by the
theory of change, ie. Output 3, Output 4, Output 2 and Output 1.
Table 23a: High level final position for ESSPIN finances in 2013/14
Total Year 6 Budget Forecast £15,615,000
Total Year 6 Actual Spend £15,223,000
4 ESSPIN Contract Amendment, 23 August 2013
Education Sector Support Programme in Nigeria
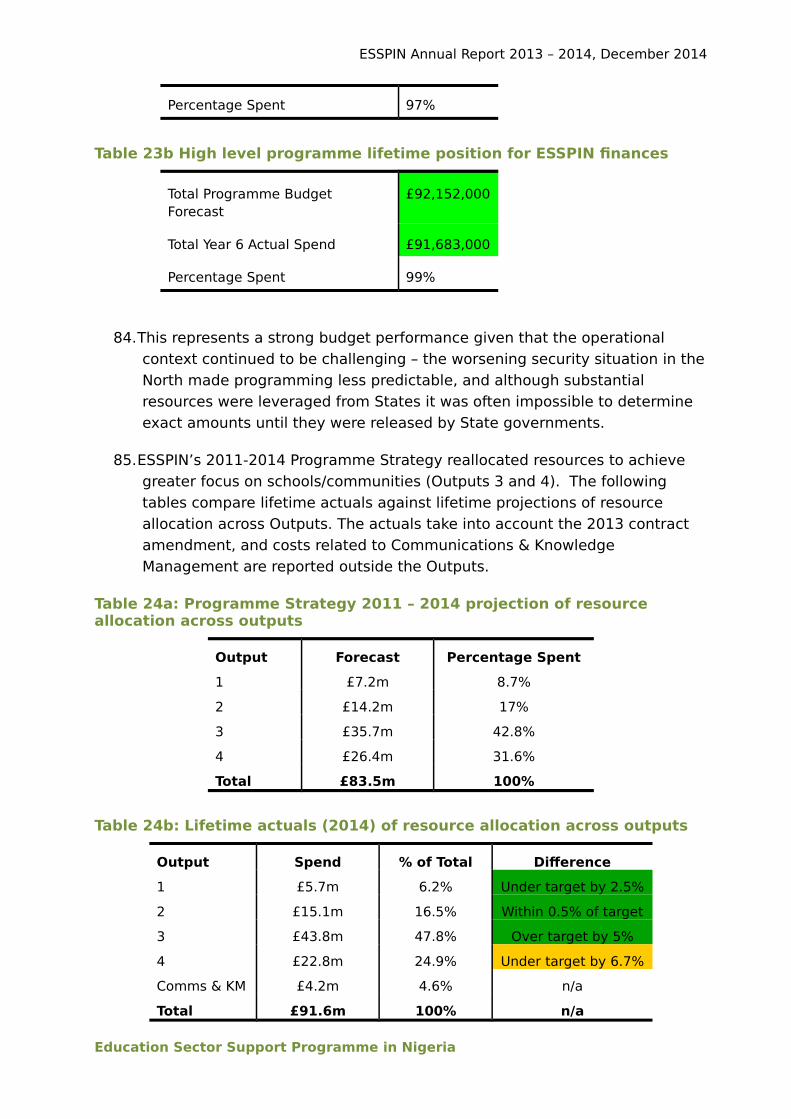
ESSPIN Annual Report 2013 – 2014, December 2014
Percentage Spent 97%
Table 23b High level programme lifetime position for ESSPIN finances
Total Programme Budget Forecast
£92,152,000
Total Year 6 Actual Spend £91,683,000
Percentage Spent 99%
84.This represents a strong budget performance given that the operational
context continued to be challenging – the worsening security situation in the
North made programming less predictable, and although substantial
resources were leveraged from States it was often impossible to determine
exact amounts until they were released by State governments.
85.ESSPIN’s 2011-2014 Programme Strategy reallocated resources to achieve
greater focus on schools/communities (Outputs 3 and 4). The following
tables compare lifetime actuals against lifetime projections of resource
allocation across Outputs. The actuals take into account the 2013 contract
amendment, and costs related to Communications & Knowledge
Management are reported outside the Outputs.
Table 24a: Programme Strategy 2011 – 2014 projection of resource allocation across outputs
Output Forecast Percentage Spent
1 £7.2m 8.7%
2 £14.2m 17%
3 £35.7m 42.8%
4 £26.4m 31.6%
Total £83.5m 100%
Table 24b: Lifetime actuals (2014) of resource allocation across outputs
Output Spend % of Total Difference
1 £5.7m 6.2% Under target by 2.5%
2 £15.1m 16.5% Within 0.5% of target
3 £43.8m 47.8% Over target by 5%
4 £22.8m 24.9% Under target by 6.7%
Comms & KM £4.2m 4.6% n/a
Total £91.6m 100% n/a
Education Sector Support Programme in Nigeria

ESSPIN Annual Report 2013 – 2014, December 2014
86.The reduction in overall spend on Output 1 is due to the fact that two out of
six workstreams on developing national systems wound down early – NCCE
work was completed in Year 5 while national Teacher Development Needs
Assessment (TDNA) work was suppressed with the advent of DFID’s TDP
programme. Output 2 spend is precisely on target. Output 3 is slightly over
target but within the 5% margin due to the deepening of the literacy and
numeracy workstream in response to findings of the Composite Survey, e.g.
the introduction of lesson plans in all States. This additional level of activity
is consistent with recommendations from the last two Annual Reviews and is
in line with the Extension Business Case.
Education Sector Support Programme in Nigeria

ESSPIN Annual Report 2013 – 2014, December 2014
Table 25: Programme spend by State 2013/14
State TotalSpend
% of Total Spend
Enugu £1,763,000 11.6%
Jigawa £2,846,000 18.7%
Kaduna £2,278,000 15%
Kano £,3,017,000 19.8%
Kwara £1,995,000 13.1%
Lagos £1,914,000 12.6%
Output 1 £629,000 4.1%
KM and Comms £782,000 5.1%
Total £15,224,000
100%
Figure 3: Total Year 6 Expenditure by ESSPIN States
87.Kano State is by far the largest State programme, accounting for
approximately 30% of ESSPIN’s school level results. The comparatively
large investment of DFID resources in the State has yielded the largest scale
rollout of the school improvement programme in ESSPIN States, reaching all
5,700 primary schools at State government expense.
Table 26: Programme spend by Output by State 2013/14
State Output 1
Output 2
Output 3
Output 4
KM andComms
Total
Enugu 0k 410k 742k 611k 0k 1,763k
Education Sector Support Programme in Nigeria

ESSPIN Annual Report 2013 – 2014, December 2014
Jigawa 0k 286k 1,392k 1,168k 0k 2,846k
Kaduna 0k 346k 1,188k 744k 0k 2,278k
Kano 0k 330k 1,393k 1,294k 0k 3,017k
Kwara 0k 362k 814k 819k 0k 1,995k
Lagos 0k 415k 951k 548k 0k 1,914k
Output 1 629k 0k 0k 0k 0k 629k
KM and Comms
0k 0k 0k 0k 782k 782k
Total 629k 2,150k 6,478k 5,184k 782k 15,224k
88.The relative emphasis across Outputs prescribed by the Programme Strategy
is reflected in the distribution of Output spend within each State, although
there are variations in the balance of spend between Outputs 3 and 4. In
Kwara, for example, Output 3 and 4 spends are broadly at par because the
Kwara programme piloted the school improvement at scale; therefore,
current costs of consolidation in existing focus schools are not as high.
Community and inclusion work (Output 4), on the other hand, was not
prioritised by the State government for funding and ESSPIN been filling in
gaps.
Value for Money
89.ESSPIN’s VfM monitoring framework continues to be based on tracking
indicators of Economy, Efficiency and Effectiveness. A new introduction to
the VfM discourse is Equity, potentially the fourth point on the VfM chain.
Indicators for measuring this were developed for the first time in 2013/14
and will be further refined in due course.
Economy
90.ESSPIN tracks economy indicators quarterly and monitoring information is
contained in Quarterly Reports. The following economy report is presented
here as the 2014 Annual Report incorporates the July 2014 Quaterly Report
due to the timing of the 2014 Annual Review of ESSPIN.
91.Economy indicators are monitored on two levels: a) operational cost per
input and b) programme development investments. The latter was
introduced in response to the Extension Business Case. Eight indicators
were identified which account for approximately 62% of ESSPIN’s total
spend, so are significant to programme delivery.
Average cost per hotel overnight
92.The Guest House occupancy rate for the period April to July 2014 has been
added to the list below:
Education Sector Support Programme in Nigeria

ESSPIN Annual Report 2013 – 2014, December 2014
February to March 2012 37%
April to June 2012 42%
July to September 2012 44%
October to December 2012 55%
January to March 2013 60%
April to June 2013 53%
July to September 2013 78%
October to December 2013 72%
January to March 2014 61%
April to July 2014 71%
93.The increased utilisation rate in the latest period is based on expanded
calculations that now factor in additional days spent by visitors in other
project accommodation, a total of 245 days at the time of reporting.
Additional savings were achieved through visitors being accommodated with
long term TAs rather than in the guesthouse or hotels. Despite that, the cost
per night of staying at the ESSPIN guesthouse during January to March was
£91. This continues to compare favourably to the current rates for staying
at The Valencia (£96 per night), The Rockview (£104 per night) or The
Sheraton (£125 per night).
Average km per litre for ESSPIN vehicles
94.The latest fuel consumption data is as follows:
Table 27: ESSPIN total road kilometres by year and latest quarter
Office 2011km/litre
2012km/litre
2013km/litre
Q2 2014Km/litre
Q2 2014Km/litre
Jigawa 10.08 10.43 9.93 9.70 9.62
Abuja 9.58 9.29 8.68 8.77 9.15
Kano 8.66 8.23 7.74 8.36 8.93
Kaduna 8.48 8.24 8.05 7.75 7.71
Kwara 7.85 7.36 8.05 7.36 7.85
Enugu 7.12 6.66 6.74 6.73 7.55
Lagos 6.46 6.47 5.89 5.79 8.08
Total 8.52 8.18 7.98 8.00 8.41
95.The period in question shows a significant improvement from the figures for
2012, 2013 as well as Q1 of 2014. Much of this is down to:
Education Sector Support Programme in Nigeria

ESSPIN Annual Report 2013 – 2014, December 2014
A number of new vehicles to replace some of the older and less cost
effective vehicles in the fleet
The benefits of the Defensive Driver Training run annually by Skills and
Techniques Ltd
The appointment of a Transport and Security Manager who has started to
visit all ESSPIN States
96.For the period under review, ESSPIN vehicles drove 318,713km and
purchased 37,891 litres of fuel, returning a utilisation unit of 8.4km per litre.
97.From these figures, a traffic lighting of ESSPIN States over the past Quarter
would be as follows:
Red – None
Amber – Enugu, Kwara and Kaduna
Green – Abuja, Jigawa, Kano and Lagos
Table 28: Unit cost of activity (programme investment) calculated againstprojected total results and total lifetime spend for the Programme
Indicator
Spend to July
2014
Activit
y
Unit
Cost
Target Total
Spend
Target
Result
TargetUnit
Cost
RAG Ratin
g
3.1 Schools trained to use a
SDP
3,867,60
1 13,124
294.7
0
3,893,66
5 5,194 749.65Green
3.2 Headteachers trained to
operate effectively
8,198,93
0 13,124
624.7
3
7,754,94
4 5,547
1,398.0
4Green
3.3 Teachers trained to deliver
competent lessons
10,934,6
26
107,29
2
101.9
1
10,481,3
77 30,291 346.02Green
3.4a Learners with access to
toilets (Direct ESSPIN Funded)
9,898,03
5
156,49
5 63.25 n/a n/a n/a n/a
3.4b Learners with access to
toilets (Total Results All Funding)
9,898,035
378,846 26.13
9,877,917
337,060 29.31 Green
3.4a Learners with access to clean water (Direct ESSPIN
Funded)
10,002,4
75
180,71
5 55.35 n/a n/a n/a n/a
3.4b Learners with access to
clean water (Total Results All Funding)
10,002,475
727,867 13.74
9,936,600
440,438 22.56 Green
Education Sector Support Programme in Nigeria

ESSPIN Annual Report 2013 – 2014, December 2014
3.4a Learners benefiting from
new/renovated classrooms (Direct ESSPIN Funded) 902,548
103,859 8.69 n/a
n/a
n/a
n/a
3.4b Learners benefiting from new/renovated classrooms
(Total Results All Funding) 902,548
262,84
1 3.43 907,191
256,96
4 3.53 Green
4.1 Community members
trained to set up SBMCs
7,760,42
0
228,15
2 34.01
7,150,03
7 77,910 91.77 Green
4.1 Communities where SBMC
reflect women/children concerns
4,382,008 15,603
280.84
4,189,966 4,591 912.65 Green
Key: Green – Target results met at lower than target unit cost
Amber – Target results met but target cost exceeded
Red – Target results not met and target cost exceeded
Education Sector Support Programme in Nigeria

ESSPIN Annual Report 2013 – 2014, December 2014
98.When the first Efficiency table was developed in 2011, it based projections of
lifetime targets for the programme (2014) on the version of the logframe
available at the time. That version of the Efficiency table is what was
incorporated into the VFM Strategy and informed subsequent Economy and
Efficiency tables. As part of ongoing updates of the VFM Strategy, the 2014
targets have been updated to bring them in line with the new Extension
logframe as requested by DFID. This accounts for the changes in targets
compared with the last Quarterly Report (March 2014).
99.The actual results for 3.1 (SDP) and 3.2 (Head-Teachers) have reduced from
the previous QR due to the fact that quality assurance checks at state and
programme level have identified erroneous double-counting of some
cumulative results figures which has now been corrected.
100. The three infrastructure indicators (Toilets, Water and Classrooms)
now contain two lines – one based solely on ESSPIN funding and the results
achieved by that ESSPIN funding; the second, as was always the intention,
the results achieved by both ESSPIN and State Funding.
Efficiency
101. Efficiency indicators measure how well inputs are converted into
outputs with a view to improving input to output ratios, i.e. cost per output
result. ESSPIN’s efficiency indicators and how their unit costs are calculated
have not changed from the last Annual Report.
102. The VfM strategy allocates total programme expenditure across 13
key results derived from Logframe outputs. Programme Support Activities
(e.g. infrastructure, school grants, and direct training costs) are allocated
directly to the results they support. TA time is allocated across the range of
results to which the TA work contributes. The % of combined PSA/TA spend
per result is then calculated. Management, support staff and reimbursable
costs are then allocated, using the same percentages. For example, if 8% of
PSA and TA combined budget was spent on Result 1, then 8% of
management, support and reimbursable costs would also be allocated to
Result 1.
103. The following table presents programme expenditure and results to
date and provides indicative unit costs. Projected unit costs for the lifetime
of the programme are also presented as an internal benchmark.
Education Sector Support Programme in Nigeria

ESSPIN Annual Report 2013 – 2014, December 2014
Table 29: Efficiency indicators and cost per result 2013/14
TotalProgra
meSpend
ActualResult
forProgramme (June
2014)
LogframeTarget
Result forProgramme(June 2014)
UnitCosts
Original2011
TargetUnit Cost
RevisedUnit CostBased on
RevisedExtensio
nLogfram
e
Unit Costs to Extension Logframe
1 No of schools using a school development plan
3,867,601 3,171 5,194 1,219.68 per school 415.5 749.65 Red
2 No. of headteachers operating effectively
8,198,930 7,329 5,547 1,118.70
per headteacher 711.34 1,398.04 Green
3 No. of teachers who can deliver competent lessons in literacy (English) and numeracy
a) Public Schools 7,871,782 37,819 29,124 208.14 per teacher 139.55 259.52 Green
b) Non-state schools 3,062,845 1,167 1,167 2,624.55 per teacher 810.32 2,504.88 Amber
4 Number of learners benefiting from infrastructural improvements:
a) No, of learners with access to toilet 9,898,035 378,846 337,060 26.13 per learner 24.14 29.31 Green
b) No. of learners with access to cleanwater
10,002,475 727,866 440,438 13.74 per learner 22.01 22.56 Green
c) No. of learners benefiting from newor renovated classrooms 902,548 262,840 256,694 3.43 per learner 12.12 3.53 Green
Output 4 5 a) No of schools with functioning
SBMCs
i) Public Schools 7,760,420 10,442 5,194 743.19 per school 761.36 1,376.60 Green
b) No. of communities where SBMCs reflect women and children’s concerns
4,382,008 10,442 4,591 419.65 per community 468.18 912.65 Green
36Education Sector Support Programme in Nigeria
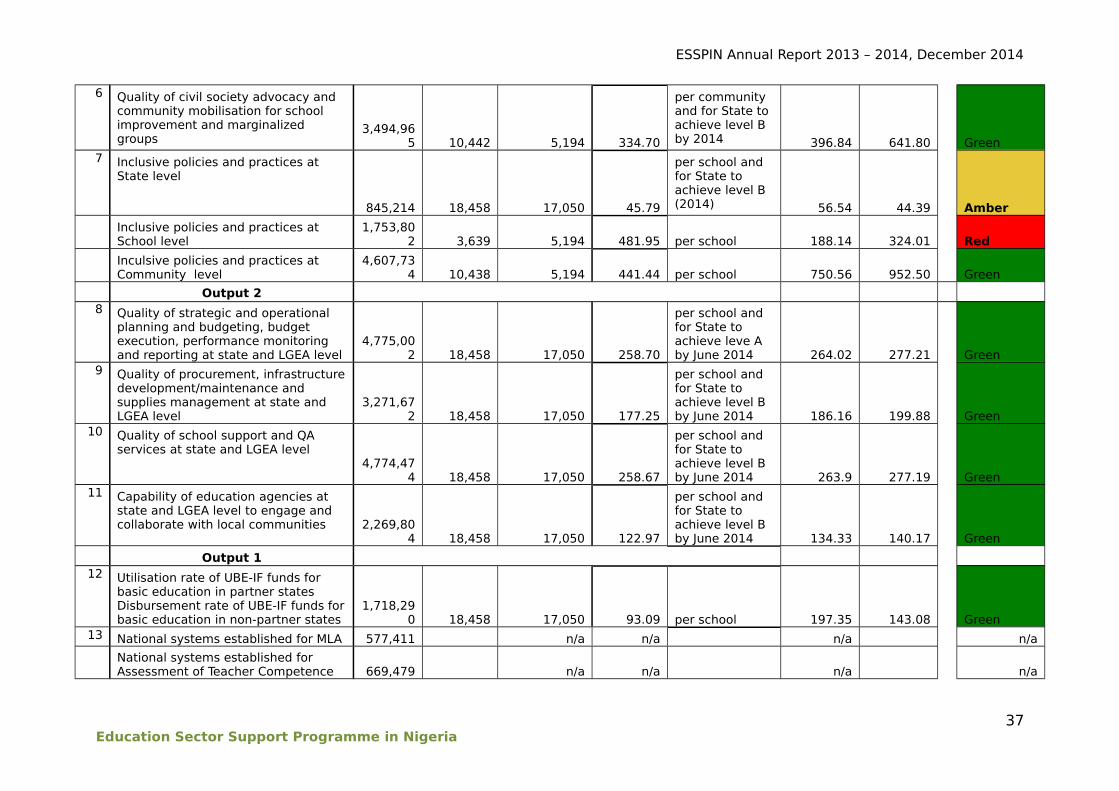
ESSPIN Annual Report 2013 – 2014, December 2014
6 Quality of civil society advocacy and community mobilisation for school improvement and marginalized groups
3,494,965 10,442 5,194 334.70
per community and for State to achieve level B by 2014 396.84 641.80 Green
7 Inclusive policies and practices at State level
845,214 18,458 17,050 45.79
per school and for State to achieve level B (2014) 56.54 44.39 Amber
Inclusive policies and practices at School level
1,753,802 3,639 5,194 481.95 per school 188.14 324.01 Red
Inculsive policies and practices at Community level
4,607,734 10,438 5,194 441.44 per school 750.56 952.50 Green
Output 2 8 Quality of strategic and operational
planning and budgeting, budget execution, performance monitoring and reporting at state and LGEA level
4,775,002 18,458 17,050 258.70
per school and for State to achieve leve A by June 2014 264.02 277.21 Green
9 Quality of procurement, infrastructuredevelopment/maintenance and supplies management at state and LGEA level
3,271,672 18,458 17,050 177.25
per school and for State to achieve level B by June 2014 186.16 199.88 Green
10 Quality of school support and QA services at state and LGEA level
4,774,474 18,458 17,050 258.67
per school and for State to achieve level B by June 2014 263.9 277.19 Green
11 Capability of education agencies at state and LGEA level to engage and collaborate with local communities 2,269,80
4 18,458 17,050 122.97
per school and for State to achieve level B by June 2014 134.33 140.17 Green
Output 1 12 Utilisation rate of UBE-IF funds for
basic education in partner states Disbursement rate of UBE-IF funds forbasic education in non-partner states
1,718,290 18,458 17,050 93.09 per school 197.35 143.08 Green
13 National systems established for MLA 577,411 n/a n/a n/a n/a National systems established for
Assessment of Teacher Competence 669,479 n/a n/a n/a n/a
37Education Sector Support Programme in Nigeria
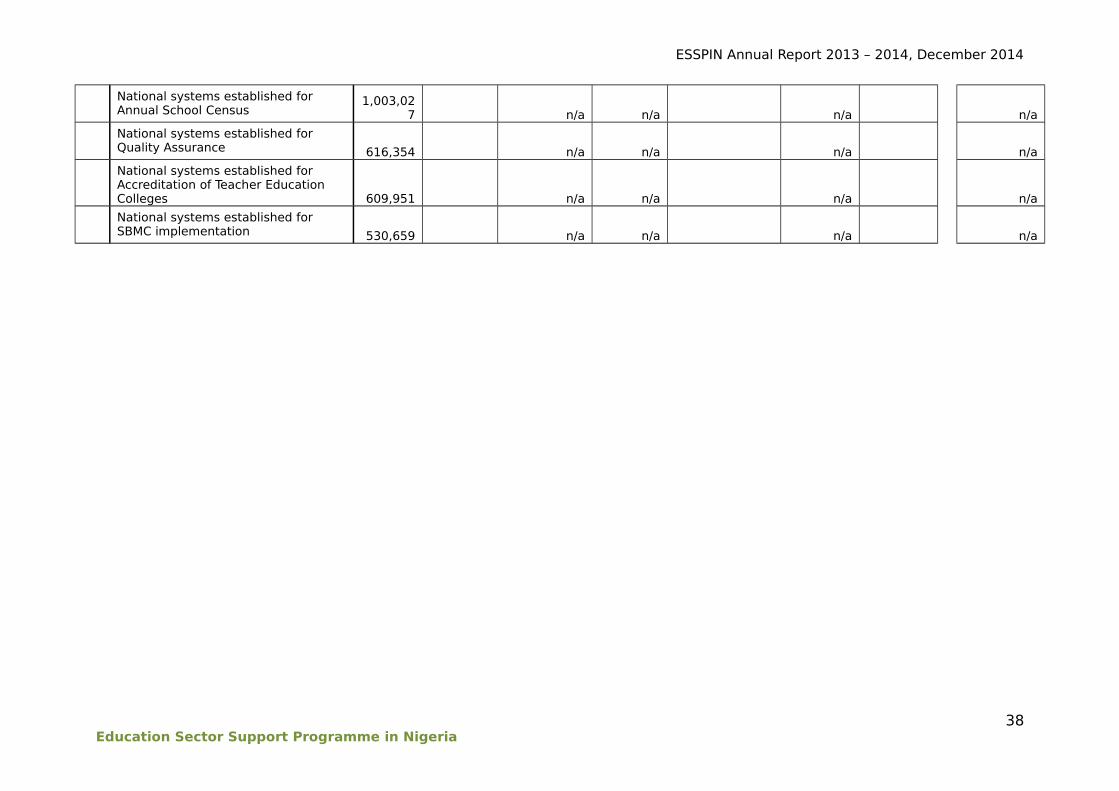
ESSPIN Annual Report 2013 – 2014, December 2014
National systems established for Annual School Census
1,003,027 n/a n/a n/a n/a
National systems established for Quality Assurance 616,354 n/a n/a n/a n/a
National systems established for Accreditation of Teacher Education Colleges 609,951 n/a n/a n/a n/a
National systems established for SBMC implementation 530,659 n/a n/a n/a n/a
38Education Sector Support Programme in Nigeria

ESSPIN Annual Report 2013 – 2014, December 2014
Effectiveness
104. ESSPIN has retained its approach to effectiveness as assessing the
overall costs of achieving programme impact through a set of cost
effectiveness measures. The following table updates the cost effectiveness
indicators for 2013/14 and compares with last year’s results.
Table 30: Costs of achieving programme impact (Effectiveness)
Outcome/ImpactCumulative result
Cumulative DFID
Investment
Effectivenessmeasure
2013/14 unitcost
Effectivenessmeasure
2012/13 unitcost
1. Children benefitting from school improvement
4.72mchildren £66.6m
£14.12 perchild £15 per child
2. Additional children in primary schools 456,713 £66.6m
£145.93 perchild £366 per child
3. Schools improved 10,947 £66.6m£6,088.28 per
school£6,247 per
school
4. State resources leveraged for basic education £13.6m £91.7m
£1 leveragedper £6.74 spent
by DFID
£1 leveragedper £12.70
spent by DFID5. P2 and P4 children with
improved learning outcomes5 tbc £91.7m tbc6
£14.12 perchild
105. Cost per child benefitting from school improvement allocates
cumulative spend on Outputs 3 and 4 (the service delivery outputs) to the
total number of children benefitting in SIP focus schools. The number of
children takes State level primary enrolments and applies proportions of SIP
coverage in each State to estimate the number of children reached by the
programme (Logframe Impact indicator 2b).
106. Cost per additional child in primary school allocates the cumulative
total spend on Outputs 3 and 4 (the service delivery outputs) to the total
number of additional children in ESSPIN focus LGEAs between 2010 and
2014 based on analysis of year-on-year increases in enrolment (Logframe
Outcome indicator 2).
107. The cost of improving a school is derived from allocation of the
cumulative total spend on Outputs 3 and 4 (the service delivery outputs) to
the total number of SIP focus schools by June 2014. Reduction of unit cost
is, therefore, driven by SIP rollout.
108. When Composite Survey data becomes available, a further indicator
can be defined allocating a unit cost to schools meeting the benchmarks of
a good quality school (Logframe Outcome indicator 1). 5 To be updated when CS2 data becomes available6 Relies on Composite Survey 2 still in progress
38Education Sector Support Programme in Nigeria

ESSPIN Annual Report 2013 – 2014, December 2014
109. The leverage indicator compares ESSPIN’s total programme spend to
date with amounts leveraged from governments to date, specifically on
school improvement activities. The State figures used are funds that have
actually been expended on school improvement as opposed to nominal
commitments. Leverage data has only been captured systematically
(through Quarterly Reports) since July 2012, so the current estimate is
conservative (Logframe Outcome indicator 3).
110. This indicator on learning outcomes was made possible by the
availability of learning outcomes data following the publication of the 2012
Composite Survey (CS1) report in March 2013. The number of P2 and P4
pupils with improved learning outcomes was extrapolated from CS1 data.
ESSPIN’s total programme spend to date was then allocated to these. The
indicator will be updated when CS2 data becomes available (Logframe
Impact indicator 1b)
Equity
111. ESSPIN’s equity measurement is work in progress. The aim is to track
selected indicators which enable assessments of whether programme and
State government resources are deployed equitably and whether the
benefits are reaching all potential beneficiaries, particularly disadvantaged
groups. The cost of achieving equitable outcomes, e.g. education of children
in special circumstances, tends to be additional to mainstream programme
investment.
Financial equity
112. This tracks deployment of State government resources to basic
education in relation to total education budget and allocations to other sub-
sectors, to assess whether budget releases and utilisation are sufficient to
support improvements in primary and junior secondary education. Annual
allocations and quarterly releases to SUBEBs are currently used as a proxy
for basic education investment.
Table 31: State budget performance in 2013 fiscal year – cumulative by Quarter 4
Year allocation (Nbn)
% Release
% Utilisation
Benchmark 100% 100%
EnuguAll Education 16.4 66% 58%
SUBEB 0.18 69% 69%
JigawaAll Education 8.5 94% 94%
SUBEB 2.5 111% 111%
39Education Sector Support Programme in Nigeria

ESSPIN Annual Report 2013 – 2014, December 2014
KadunaAll Education 21 35% 31%
SUBEB 4.8 20% 19%
KanoAll Education 30.3 62% 62%
SUBEB 3.8 113% 113%
KwaraAll Education 9.2 44% 26%
SUBEB 4.3 34% 24%
LagosAll Education 34 75% 83%
SUBEB 7.7 54% 63%Programme
All Education 119 63% 61%
SUBEB 23.3 59% 60%
Reaching the most marginalised
113. In addition to the mainstream School Improvement Programme (SIP),
ESSPIN invests in a number of special initiatives to improve school
participation amongst marginalised groups of children.
114. The Kano Conditional Cash Transfers project invested £203 per head
to support transition from primary to junior secondary school for 2,572 girl
with a 71% survival rate. The return would be much higher if the State
government had provided its counterpart funds. [No external benchmarks
currently exist as other CCT pilots are in very early stages]
115. It cost ESSPIN an additional £35 per unit to attach a Safe Space to
every SBMC, thereby ensuring that the concerns of women and girls are
addressed at SBMC meetings. Evidence of improved participation of women
and girls in SBMCs and resulting actions justifies the additional investment.
116. In Jigawa where an estimated 20% of school age children live in
pastoralist nomadic communities and do not attend conventional schools for
a variety of socio-cultural reasons, ESSPIN has invested £30 per nomadic
child receiving basic literacy and numeracy through a rural community
education programme. It currently benefits 12,400 children who would not
have received any education otherwise. The cost of an additional child in a
conventional ESSPIN focus school is £146.
117. Also in Jigawa, a Girl Education Initiative is helping to keep 5,000 girls
in school in 3 LGAs at a cost of £35 per girl.
118. Across ESSPIN’s 3 northern States – Kano, Jigawa and Kaduna, 11,500
girls and 16,000 Almajiri boys are receiving basic literacy and numeracy
lessons in their Islamiyya and Tsangaya centres at a unit cost of £56.15
Using VFM analysis for strategic planning and decision making
40Education Sector Support Programme in Nigeria

ESSPIN Annual Report 2013 – 2014, December 2014
119. This section provides some examples of applications that ESSPIN is
making of VFM data. It is a new addition to the VFM reporting framework.
School Improvement Programme (SIP) unit cost data used for State planning
120. SIP unit cost data (relating to training of headteachers, teachers and
SBMCs) is used for State costed workplans for rollout to additional schools
and assists States in determining:
the scale of rollout that available resources can support;
whether a phased approach to rollout is required, e.g. Jigawa – 501
schools a year; Kano – teacher training, then school leadership, then
SBMCs rather than all at once, etc.;
what funding gap exists and where ESSPIN should reallocate some PSA
funds, e.g. Kwara – financial shortfall for SBMC rollout was filled by
ESSPIN in 2013 to deliver on relevant logframe targets;
costed workplans for other donor support programmes, eg. Applications
for funding ($20m over 3 years per State) from the Global Partnership on
Education (GPE) programme – ESSPIN has supported Jigawa, Kano and
Kaduna at DFID’s request
financial projections for Medium Term Sector Strategies (MTSS)
ESSPIN annual budget driven by individual State needs
121. ESSPIN’s annual budget is no longer driven by a uniform TA package
for all States. A State’s TA allocation is dependent on:
the scale of rollout in a given year – ESSPIN’s commitment to ensure that
quality delivery is not compromised by large scale rollout;
special initiatives, e.g. pilots, requiring results/evidence to secure State
buy-in (girl education and nomadic education initiatives in Jigawa, rural
teacher housing in Kwara, C-EMIS in Kwara and Jigawa, etc.;
co-financing agreements between a State and ESSPIN on specific
activities, e.g. Out-of-School-Children survey in Jigawa, IQTE and the
Teaching Skills Programme in Kano, etc.
Data on resources leveraged used for estimation and reporting of State financialperformance
122. State leverage ratios - e.g. State direct spend on SIP rollout equalling
15% of total DFID spend by December 2013 – used to:
report VFM (programme efficiency) to DFID
support advocacy and lobbying with organisations requiring evidence of
State buy-in and capacity to provide counterpart funding, e.g. GPE and
41Education Sector Support Programme in Nigeria

ESSPIN Annual Report 2013 – 2014, December 2014
the Educate-A-Child (EAC) programme for which Kano State is preparing
a proposal
demonstrate State accountability to UBEC in the utilisation of federal
Teacher Professional Development (TPD) funds
123. Data on State resources leveraged and quarterly leverage patterns
are used to validate State reports on budget release and utilisation, e.g. a
quarter in which substantial State resources are leveraged is expected to
coincide with one for which the State reports significant budget release
performance. Where a State reports budget release progress but the ESSPIN
leverage table records little or no leverage, e.g. Kwara in 2013, discussions
arise around how the State is deploying resources and why SIP
commitments are not fully funded.
Reduction and monitoring of Overheads ratio
124. Post-MTR, VFM data on overhead ratios was used to guide the
reduction of programme overheads from 35% of budget, and subsequently
for monitoring to ensure it stays around a defined 20% threshold.
42Education Sector Support Programme in Nigeria

ESSPIN Annual Report 2013 – 2014, December 2014
Investment in technical capacity development
125. Investments in State implementing capacity (support to SSITs, SSOs
and SMOs – officers already in government employment and, therefore, fully
compensated) offers good VFM as it minimises the volume of TA
commitment in the medium to long term. Similarly, internal investments in
training and development of ESSPIN State Specialists are demonstrably
minimises STTA requirements.
Discontinuation of activities with unsustainably high unit costs
126. High value of programme investment relative to results has led to a review of
teacher training in non-State schools in Enugu (high Efficiency unit cost – five
times the cost of a public school teacher). Discussions are ongoing to
determine future prospects of sustainable funding from the Missions without
which the intervention will have to be discontinued. Similarly, ESSPIN has
recommended closure of the Kano Conditional Cash Transfers (CCTs) pilot due
to a lack of buy-in and counterpart funding from the State government severely
limiting number of beneficiaries and pushing up unit costs to an unsustainable
level.
Monitoring and improvement of programme support services
127. ESSPIN’s quarterly tracking of key Economy indicators (selected on
the basis that they are within ESSPIN’s control and can be improved) have
resulted in some important management actions:
Traffic light rating of States performance on Economy indicators reported
on in Quarterly Reports form the basis of discussions in Technical Team
Meetings and introduction of practical measures to be taken by State
Administrators to drive down costs, e.g. maximising mileage from a litre
of fuel, driver management, etc.
Establishment of a procurement committee within each State
programme to ensure that goods and services are procured at the best
possible price relative to value required.
Co-location of offices with sister programmes
128. VFM analysis data showing significant savings made through the
decision to co-locate ESSPIN with the new Teacher Development Programme
(TDP) in Abuja resulted in a decision to implement a similar arrangement in
Lagos where ESSPIN now co-locates with DEEPEN.
43Education Sector Support Programme in Nigeria

ESSPIN Annual Report 2013 – 2014, December 2014
Risk Monitoring and Management
Health, Safety and Security Risk Assessment, Management and
Mitigation
129. The Nigerian operating environment contains chronic and acute risks
to the health, safety and security of national and international residents and
visitors alike. Terrorism and Ebola Virus Disease have dominated Nigerian
coverage in international media in 2013/14, and have elicited
comprehensive mitigation responses from ESSPIN. Road traffic accidents,
criminality, political violence, malaria and the weak health care system
present the greatest material hazards faced by our personnel.
130. The risk of catching Ebola Virus Disease (EVD) in Nigeria is extremely
low but the consequences of doing so are catastrophic. Of the 5,000+
fatalities from EVD to date in the 2014 West Africa outbreak, just 8 have
occurred in Nigeria with a further dozen cases confirmed but patients now
fully recovered. Successful containment of the disease in Nigeria was
achieved primarily through drastic isolation of infected persons including
health workers, combined with an effective national public health campaign,
including the contentious decision to keep all schools closed for an extended
period. A heightened state of alert remains in force, with screening at
airports and ESSPIN offices, and successful compulsory ‘Stand Down’ health
information and discussion sessions completed at all sites.
131. An unexpected spin-off from the disease is greater usage of school
water and sanitation facilities, and increased awareness of teachers and
children of the importance of hand-washing and use of latrines, which are
expected to result in decreased incidence of dysentery and diarrhoea—far
more common than EVD and which cause higher morbidity and mortality
each year. The most serious direct impact on ESSPIN staff has been
quarantining of a British visitor on return to UK who reported symptoms of
illness to NHS Direct (suspected malaria, since proven to be negative).
ESSPIN personnel are advised not to travel internationally if suffering from
illness, particularly a high temperature, and to carry sufficient medicines for
pre-existing conditions lest a travel ban is imposed whilst in country.
132. The Boko Haram (BH) insurgency in Nigeria persists and has
deepened this year, despite the State of Emergency imposed since May
2013 in three north-eastern States. Drawing inspiration if not direct support
from ISIS, BH has latterly declared a Caliphate covering a significant number
of large towns and local government areas in Borno, Yobe and Adamawa
States. The implications of this for ESSPIN-supported States is being
44Education Sector Support Programme in Nigeria

ESSPIN Annual Report 2013 – 2014, December 2014
constantly monitored. The step-change in insecurity is symbolised by the
continued inability of the Nigerian authorities to locate and release the
200+ schoolgirls kidnapped from Chibok and other communities. A recent
announcement by a government spokesman of a ceasefire and imminent
release of the abducted children proved to be erroneous and has, if
anything, triggered an uptick in violence across the north.
133. ESSPIN closely monitors and liaises with DFID Risk Management
Office and other partners regarding insecurity relating to the education
sector in particular. A number of lethal attacks have been perpetrated
against educational institutions and there is no sign of that ending. All
school- and college-based activities are reviewed by senior management,
and staff visiting such sites are briefed and given every opportunity to
withdraw from activities with which they feel uncomfortable.
134. Three massive lethal explosions occurred in Abuja at shopping and
transport hubs approximately 2km and 12km from the ESSPIN head office
during the summer months. Kano City educational institutions were also
attacked, indicating that BH retains the capability to operate outside its
north-east heartland.
135. At this stage in the electoral cycle, the main political parties are
currently engaged in varying degrees of factional positioning to secure key
nominations in the primaries system, ahead of Feb 2015 elections for
Federal President, State Governors and State Houses of Assembly. ESSPIN
monitors rallies and political meetings using a variety of security information
channels, networks and partners, and is careful to avoid travelling through
such areas as violence can break out without warning.
136. The majority of kidnap victims are Nigerians in southern states who
are abducted for ransom, and normally released largely unharmed after
money changes hands. Foreigners are also targeted for similar reasons. In
northern Nigeria the motive is primarily for political capital, is more directed
against foreign nationals, and frequently end in fatalities. Stringent efforts
are made by ESSPIN to avoid kidnap, with journey protocols, patterns of
movement, information, security briefings, approved activities and risk
mitigation measures enforced during all northern visits.
137. With respect to criminality and communalist violence, ESSPIN
personnel are advised to maintain a low profile, particularly taking care in
Lagos and other main urban centres. The Middle Belt states are witnessing
increased levels of violence between herdsmen and farmer communities.
Although often lethal in impact, this is relatively unlikely to affect ESSPIN
staff or visitors directly.
45Education Sector Support Programme in Nigeria

ESSPIN Annual Report 2013 – 2014, December 2014
138. Regarding health matters, malaria is relatively common in all parts of
Nigeria and at all times of the year, and regularly afflicts some members of
staff. Early diagnosis and appropriate treatment is important. Excessive
working hours, stress, sedentary working and lack of work-life balance in an
increasingly restrictive environment are other risk factors in the
programme’s health, safety, security and risk assessments, with mitigation
measures identified. Road travel is particularly hazardous, and the Senior
Management Team invests a lot of effort in ensuring that journeys are
completed in accordance with defensive driving principles and sound vehicle
management, plus convoy travel inter-state to ensure back up help is to
hand.
139. A weekly bulletin digesting the key issues in the country and drawing
on multiple networks for information is issued by ESSPIN and regarded as
good progress.
140. In risk management terms, the programme aims to be risk aware not
risk averse. Procedures exist to control travel to and within Nigeria, together
with journey management, communication and security protocols, to help to
make the working environment tolerably safe. Greater emphasis is being
placed on accident and near miss reporting, and safety/risk management
training, to ensure that systematic responses to risks are observed
consistently on the part of the company and individuals alike.
Programme Risk Assessment, Management and Mitigation
141. The ESSPIN logframe identifies critical risks to achievement of
programme results that must be monitored, assessed periodically and
managed. The ESSPIN risk table has been updated for 2014 and is as
follows.
Table 32: ESSPIN Programme Risk Register
Risk Assessment Management
UBEC TPD funds not utilised for bona fide school improvement andprofessional development activities.
Over-dependence of SIP on States allocating all/large share of UBEC TPD to SIP Roll Out.
Productive relationship between UBEC and ESSPIN has substantiallyreduced this risk in terms of probability. National replication of ESSPIN’s SBMC model by UBEC has created a trusting partnership. UBEC specifies use of itsTPD funds for SIP rolloutin its guidelines to ESSPIN States.
Diversity SIP funding base through engagement with budgetprocess, ExCo subventions, etc.
Maintain the partnership by providing TA to UBEC in its drive to establish functioning SBMCs in all Nigerian schools
Support UBEC’s efforts in other intervention areas, e.g. Inclusive education, IQTE and QA.
46Education Sector Support Programme in Nigeria

ESSPIN Annual Report 2013 – 2014, December 2014
Risk Assessment Management
FME lacks vision and commitment to national systems
Priorities of the relatively new Minister and State Minister not necessarily aligned withESSPIN and States’ own.Probability: high. Impact: medium (primarily Output 1).
Ongoing technical support to the Office of the Minister offered (in partnership with TDP).
Engagement with wider definitionof education sector leaders.
Lack of state government commitment to ASC
The risk of lack of funding is currently at medium probability and high impact. Medium rating is based on the good progress in leveraging state resources in year 6 in allstates, but the risk of problems in election year 7. Funding opportunities from federal and international sources will be sought.
Substantial mitigation through the quarterly meetings of Commissioners and SUBEB Chairsfrom focus states hosted by ESSPIN.
Targeted political engagement to secure commitment of senior government officials, including Governors and Deputy Governors, in tandem with DFID (State Reps, DFIDN and DFID UK).
Periodic meetings of State Education Steering Committees at state level.
Engagement in with State Housesof Assembly and LG Chairs.
Involvement of civil society (CSOsand the media) in school improvement advocacy issues to improve accountability and transparency in delivery of services.
Proactive investigation of federal funding sources, e.g. MDGs & TETF (former ETF); GPE.
Encouragement of non-government / private sector funding sources, e.g. Oando Foundation, EAC in Kano.
Collaboration with other SLPs andIDPs where possible.
Lack of state government commitment to planning, budgeting andorganisational reform
Insufficient state resources and persistence of financial malpractice
Failure of state governments to sustain commitment to school improvement and release funds for SSIT/SSO and SSO/teacher interactions
Insufficient resources to accommodate additionalchildren in schools
Failure of states to respond to severe school quality problems,including using the SIP approach to raise standards.
Failure of Mission Schools to commit and release funds for MSIT.
States have responded well in Y6 with funding allocations and releases for SIP roll out, in view of evidence of low standards of teaching and learning outcomes. The findings, learnings and response to CS2 willbe significant.
ESSPIN continues to demonstrateeffectiveness of the school improvement model through consolidation work in phase 1 schools and roll out to new schools
Ongoing dissemination of the Composite Survey report endorsed by State Commissioners of Education.
Support States to incorporate Composite Survey findings in their annual Sector Performance Review reports.
47Education Sector Support Programme in Nigeria

ESSPIN Annual Report 2013 – 2014, December 2014
Risk Assessment Management
Infrastructure programmes continue toside-step sound procurement and supervision practices
This remains medium risk given weak procurement management systems inmany states which may undermine the quality of infrastructure works and engender financial leakage.
ESSPIN supporting use of standard prototypes for classroom construction and W&S facilities
Supervision of infrastructure projects now supported by independent consultants contracted by SUBEB in states
SBMC Chairs are signatories to allpayment certificates ensuring that communities get to sign off construction work
Dedicated project bank accounts set up for infrastructural projects to protect funds
ESSPIN supporting review of financial systems and practices within the functional review of SUBEBs (Output 2)
Community participation in monitoring of infrastructure promoted through SBMCs
Failure to recognise the role of women and children in school governance
Improved rating as every SBMC establishedthrough the school improvement programme has willinglysupported the idea of Safe Spaces (women and children committees) where views can be expressed freely and channelled into decision making
This risk is being internalised intothe programme through ongoing mentoring of SBMCs by CSOs
Documentation and dissemination of examples of women contributing effectively toschool improvement is also proving a good advocacy tool
Marginalised groups in states continue to be side-lined due to overriding cultural factors
Progress on enabling policy environment for inclusive education in ESSPIN States as evidenced in State self-assessments.
Every State now has an inclusive education programme with a clear policy basis
Selected States conducting surveys of out-of-school children with ESSPIN technical assistance.
Ongoing CSO advocacy work including regular interaction with traditional / religious leaders.
Policies and practice on posting of rural, local language and female teachers.
Lack of state government recognition of CSOs
States have officially contracted CSOs, using their own funds, to help expand the SBMC support programme. Risk level now significantly lower.
ESSPIN consistently encourages states to engage CSOs directly to help train, mentor and monitor SBMCs.
ESSPIN’s SBMC model now includes the concept of Civil Society/Government Partnerships (CGPs) that brings CSOs and
48Education Sector Support Programme in Nigeria

ESSPIN Annual Report 2013 – 2014, December 2014
Risk Assessment Management
LGEA Desk Officers together as SBMC training and support teams.
Evidence gathering on the impactthat CSOs are helping to achieve with regards to voice and accountability.
New challenges to CSOs and States to forge sustainable service delivery partnerships through a proposal and grant funding mechanism.
Degradation of infrastructure investments
Probability is diminishing as maintenance and supervisions contracts are being used to identify faults early.
Build ownership and capacity of the problem by school communities.
Monitoring tools transferred to state actors from consultants.
Active approach to sustainability integrated into Y7 work plan.
Climate change, adaptation, sustainability and resilience component launched.
New Ebola out-break leads to extended school closures
Probability relatively low, as containment measures have proven successful to date.
Close monitoring of local, national and international data, news and information sources.
Preventive measures in place.
Northern insurgency spreads.
Few grounds for optimism at present, although capacity for territorial expansion andholding large areas remains unproven. Possibility of increased incidence and disruptiveness of attacks on schools. School visits by programme personnel become too risky.
Education and conflict study findings.
Coalitions with partners and stakeholders.
Capacity of the education sector to respond to conflict enhanced (not necessarily by ESSPIN itself).
Use of Safe Schools funds to secure school premises.
Continual reassessment of security protocols.
Election cycle diverts funding and resources and personnel from education reform.
High probability of somechoking off of resources for SIP; movement of knowledgeable change agents.
Front-loading spend and activity in the school year.
Secure support of technocrats who will out-stay political partners.
Teacher (re-)postings dissipate impact of training and critical mass of change agents at school level
Weakened impact of output results on Outcome indicators (learning outcomes).
Re-assess theory of change. Re-assess intervention model.
Climate change drives conflict between herdsmen and crop
Violent conflict disrupts school attendance and leads to possession of
Conflict and education study. Climate change resilience and
sustainability consultations with
49Education Sector Support Programme in Nigeria

ESSPIN Annual Report 2013 – 2014, December 2014
Risk Assessment Management
farmers school buildings/sheltersfor displaced persons.
stakeholders, analysis, recommendations.
50Education Sector Support Programme in Nigeria
Annex: Quarterly Results Table, April-July 2014
The reporting period, August to September 2014, coincided with the end of year
school holidays. Resumption dates were then postponed nationwide as part of
government’s efforts to stem the spread of Ebola. Consequently, there was no
school level activity during the period and the results table remained the same as
for the last quarter.
The tables below summarise progress on achievement of key results in the
current quarter. The results have been collated from the states’ Results
Monitoring Tables (RMT) which track progress against annual targets defined in
the Logframe and explained in the Logframe Handbook. For each result, the
quarterly period actual and cumulative actual total for the programme to date are
reported.
Aggregated data for each of the key results are presented first for the whole
programme (portrait orientation tables with commentary and red/amber/green
(RAG) coding), and then disaggregated state by state (landscape tables, with
programme aggregates also included for ease of reference).
In the tables that follow, key results are set out in three columns:
Column 1 – Target: this is the result that the programme was expected to
achieve by July 2014, the end of Programme Year 6. Results in this column
are drawn from the 2014 milestone column in the Logframe.
Column 2 – Period Actual: this is the result achieved in the quarter, Apr –
July 2014, and repeated for the current quarter.
Column 3 – Cumulative Actual to Date: this is the result achieved in the
programme to date since reporting in this format began (July 2012 – July
2014).
The Comments column provides a brief explanation of progress towards
targets. At the programme level, RAG ratings indicate whether progress is
on target to achieve the year-end milestone, action is required to achieve
the milestone, or there is a high risk that the milestone will not be
achieved.
51Education Sector Support Programme in Nigeria

Results Monitoring Tables
Programme level results to July 2014 by latest quarter and cumulative
against targets
52Education Sector Support Programme in Nigeria

53Education Sector Support Programme in Nigeria

54Education Sector Support Programme in Nigeria