EDUCATION POLICY OUTLOOK BELGIUM - OECD.org · education policy, ... Belgium education system...
32
EDUCATION POLICY OUTLOOK BELGIUM September 2017
Transcript of EDUCATION POLICY OUTLOOK BELGIUM - OECD.org · education policy, ... Belgium education system...
EDUCATION POLICY OUTLOOK
BELGIUM
September 2017
EDUCATION POLICY OUTLOOK: BELGIUM © OECD 2017 2
EDUCATION POLICY PROFILE
This policy profile on education in Belgium is part of the Education Policy Outlook series, which
presents comparative analysis of education policies and reforms across OECD countries. Building on the OECD’s substantial comparative and sectorial policy knowledge base, the series offers a comparative outlook on education policy by providing analysis of individual countries’ educational context, challenges and policies (education policy profiles), analysis of international trends, and insight on policies and reforms on selected topics. In addition to country-specific profiles, the series also includes a recurring publication. The first volume, Education Policy Outlook 2015: Making Reforms Happen, was released in January 2015.
Designed for policy makers, analysts and practitioners who seek information and analysis of
education policy, taking into account the importance of national context, the country policy profiles offer constructive analysis of education policy in a comparative format. Each profile reviews the current context and situation of the country’s education system and examines its challenges and policy responses, according to six policy levers that support improvement:
Students: How to raise outcomes for all in terms of 1) equity and quality and 2) preparing students for the future.
Institutions: How to raise quality through 3) school improvement and 4) evaluation and assessment.
System: How the system is organised to deliver education policy in terms of 5) governance and 6) funding.
Some country policy profiles contain spotlight boxes on selected policy issues. They are meant to draw attention to specific policies that are promising or showing positive results and may be relevant for other countries. This country profile also includes a spotlight on the European Union perspective for Belgium, based on challenges and recommendations identified by the Council of the European Union and the European Commission as part of their activities with EU member countries.
Special thanks to the Flemish Community, the French Community, and the German-speaking
Community of Belgium for their active input during consultations and constructive feedback on this report. We also thank the European Commission for its valuable analytical and financial support for the development of 11 OECD-EU Country Profiles published from 2015 to 2017.
Authors: This country policy profile was prepared by Gillian Golden (main drafter), Diana Toledo
Figueroa, Manon Giovinazzo, Shiana Crosby and Michaela Horvathova from the Education Policy Outlook team, which is part of the Policy Advice and Implementation Division, led by Paulo Santiago. Editorial support was provided by Clare Rogers and Célia Braga-Schich. This profile builds on the knowledge and expertise of many project teams across the OECD Directorate for Education and Skills, to whom we are grateful. Mónika Képe-Holmberg and Patricia de Smet contributed on behalf of the European Commission Directorate-General for Education and Culture.
Sources: The Education Policy Outlook country profiles draw on OECD indicators from the Programme
for International Student Assessment (PISA), and, where available, from the Survey of Adult Skills, of the Programme for International Assessment of Adult Competencies (PIAAC), the Teaching and Learning International Survey (TALIS) and the annual publication Education at a Glance. They also refer to country and thematic studies such as OECD work on early childhood education and care, teachers, school leadership, evaluation and assessment for improving school outcomes, equity and quality in education, efficient use of school resources, governing complex education systems, vocational education and training, and tertiary education. Much of this information and documentation can be accessed through the OECD Education GPS at http://gpseducation.oecd.org. Belgium’s communities and regions may engage in these exercises all together or separately. When relevant, this is specified in the text and in Annex B.
Most of the figures quoted in the different sections refer to Annex B, which presents a table containing indicators for Belgium (as well as for the different Communities’ education systems, where available), for the different sources used throughout the country profile. Hyperlinks to the reference publications are included throughout the text for ease of reading and also in the references and further reading section, which lists both OECD and non-OECD sources.
More information is available from the OECD Directorate for Education and Skills (www.oecd.org/edu) and its web pages on Education Policy Outlook (www.oecd.org/edu/policyoutlook.htm), as well as on the EU Education and Training Monitor (http://ec.europa.eu/education/tools/et-monitor_en.htm) and Eurydice Publications (http://eacea.ec.europa.eu/education/eurydice/all_publications_en.php).
EDUCATION POLICY OUTLOOK: BELGIUM © OECD 2017 3
TABLE OF CONTENTS
Highlights ......................................................................................................................................................................... 4
Belgium education system snapshots .............................................................................................................................. 7
1. Education System of the Flemish Community .......................................................................................................... 7 2. Education System of the French Community ........................................................................................................... 9 3. Education System of the German-speaking Community ........................................................................................ 11
Equity and quality Almost universal participation in pre-primary education ................................................................................................ 13
Preparing students for the future Varied links between education, training and employment ........................................................................................... 15
School improvement Fostering better teaching and leadership ....................................................................................................................... 17
Evaluation and assessment to improve student outcomes High autonomy and trust in schools .............................................................................................................................. 19
Governance A highly fragmented education system .......................................................................................................................... 21
Funding High dependence on public funds .................................................................................................................................. 23
Annex A: Structure of the Flemish Community and French Community education systems .......................................... 25
Annex B: Statistics ......................................................................................................................................................... 27
References and further reading…………………………………………………………………………………………… ........ 30
Figures
Figure 1. Student performance in science and impact of economic, social and cultural status ........................................ 5
Figure 2. Upper secondary and tertiary attainment .......................................................................................................... 5
Figure 3. Science performance and percentage of low and top performers ................................................................... 14
Figure 4. Students in education and not in education, by educational attainment and work status ............................... 16
Figure 5. School principals' and students' views on learning environment ..................................................................... 18
Figure 6. Student assessment by purpose ..................................................................................................................... 20
Figure 7. Expenditure on educational institutions as a percentage of GDP ................................................................... 24
EDUCATION POLICY OUTLOOK: BELGIUM © OECD 2017 4
HIGHLIGHTS
Belgium’s educational context
Belgium is organised into a three-tier government that comprises the Federal State, the Regions (the Flemish, Walloon and Brussels Capital Regions) and the Communities (the Flemish, French and German-speaking Communities). Communities and Regions do not follow the same dividing lines; for instance, the Brussels Capital Region has a mixture of both Flemish and French Community schools, while the Walloon Region has French Community as well as German-speaking Community schools. Communities are primarily responsible for person-related matters, such as the delivery of education services, and each has its own autonomous education system. Around 5% of students in Belgium attend schools in the German-speaking Community, with the remainder of the school-aged student population divided between the Flemish Community (58% of students) and French Community (37% of students).
Students: Belgium performed above the OECD average in PISA 2015 in science, mathematics and reading, with
performance variations among Communities. Overall average performance in mathematics decreased across PISA cycles, while average performance in science and reading remained unchanged. Belgium has some positive equity indicators, such as universal access to pre-primary education and a longer duration of compulsory education; although socio-economic background had an above-average impact on students’ performance in PISA 2015, and performance gaps between migrant and non-migrant students remain high. While the population without an upper secondary qualification has decreased and is now below the EU average, disparities persist between the larger urban areas and the rest of the country. The proportions of population that have attained at least upper secondary education is close to the OECD average, and the proportion of students enrolled in vocational education and training (VET) programmes is above the OECD average, reflecting diverse offerings in VET.
Institutions: Teachers from pre-primary to lower secondary education follow on average three years of teacher
education at bachelor’s level, including a mandatory teaching practicum. In upper secondary education, a master’s degree in addition to the teacher training certificate is the typical qualification requirement for most teachers in secondary general, vocational and art education. Teachers’ working conditions in primary and secondary education include a teacher-student ratio below the OECD average and salaries which are above the OECD average overall, mainly driven by the salaries of the more highly qualified upper secondary teachers. However, disadvantaged schools appear to lack experienced teaching staff in some cases, and have a higher staff turnover.
System: Belgium has three autonomous education systems (for the Flemish Community, the French Community
and the German-speaking Community), and the role of the federal government is limited to determining the duration and age range of compulsory education, establishing the minimum requirements for the delivery of recognised qualifications and setting general retirement regulations, which also affect teachers and educational staff. All schools in Belgium have freedom to develop their own curricula, assessments and self-evaluations. Schools can be classified in three different funding/management categories: publicly funded education managed by the Community authorities, grant-aided education managed by other levels of public government (such as cities, municipalities and provinces), and grant-aided private education. Schools that are not grant-aided (fully private) represent less than 1% of the school offer.
Key issues and goals
Belgium, through its different Communities, faces the challenge of providing equitable learning opportunities in a context of disparities in performance, changing demography and increasing student diversity, especially in larger urban areas. Providing better career guidance to students, increasing flexibility among education pathways, and continuing to promote integration of students with special education needs in mainstream education settings can help to improve educational opportunities and outcomes for all students. In schools, a challenge exists to increase the qualifications of teachers in the profession, particularly in disadvantaged schools. Also, in a context of the education system’s high autonomy, Belgium has a diversity of assessment and evaluation measures which could benefit from increased coherence. Based on available evidence, the Flemish Community and the French Community will also need to deal with increasing complexity in allocating resources and optimising spending efficiency, particularly given recent demographic change and budget constraints.
Selected policy responses
The Flemish Community Government adopted the “M-decree” in 2013, to strengthen support and provision for
special education needs in the mainstream education system, and to protect and activate the rights of children with
special educational needs with regard to school choice.
The French Community Government ran the Pact for Excellence in Teaching (Pacte pour un enseignement
d'excellence), a collaborative multi-stakeholder initiative to strengthen quality in education, from 2015 to mid-2016. The
pact defined key priorities and investment themes for the education system for a 15-year horizon, with investment and
reforms from 2015 organised under its key aims.
EDUCATION POLICY OUTLOOK: BELGIUM © OECD 2017 5
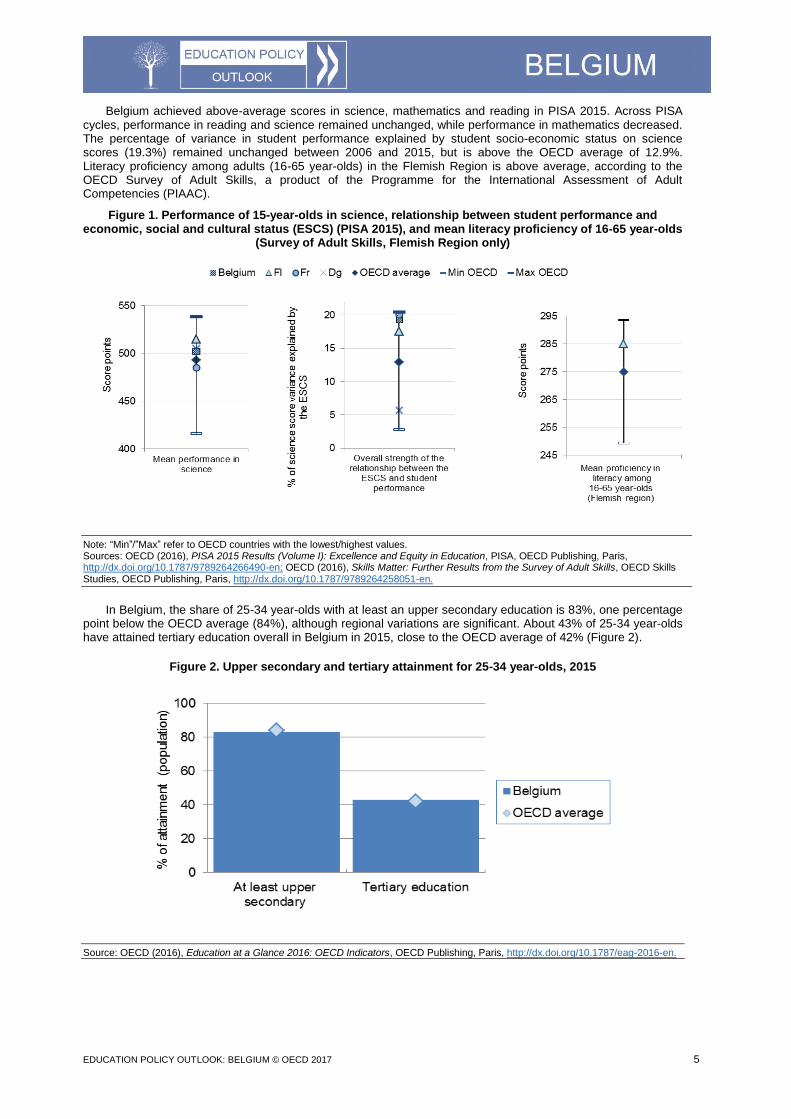
Belgium achieved above-average scores in science, mathematics and reading in PISA 2015. Across PISA cycles, performance in reading and science remained unchanged, while performance in mathematics decreased. The percentage of variance in student performance explained by student socio-economic status on science scores (19.3%) remained unchanged between 2006 and 2015, but is above the OECD average of 12.9%. Literacy proficiency among adults (16-65 year-olds) in the Flemish Region is above average, according to the OECD Survey of Adult Skills, a product of the Programme for the International Assessment of Adult Competencies (PIAAC).
Figure 1. Performance of 15-year-olds in science, relationship between student performance and economic, social and cultural status (ESCS) (PISA 2015), and mean literacy proficiency of 16-65 year-olds
(Survey of Adult Skills, Flemish Region only)
Note: “Min”/”Max” refer to OECD countries with the lowest/highest values. Sources: OECD (2016), PISA 2015 Results (Volume I): Excellence and Equity in Education, PISA, OECD Publishing, Paris, http://dx.doi.org/10.1787/9789264266490-en; OECD (2016), Skills Matter: Further Results from the Survey of Adult Skills, OECD Skills Studies, OECD Publishing, Paris, http://dx.doi.org/10.1787/9789264258051-en.
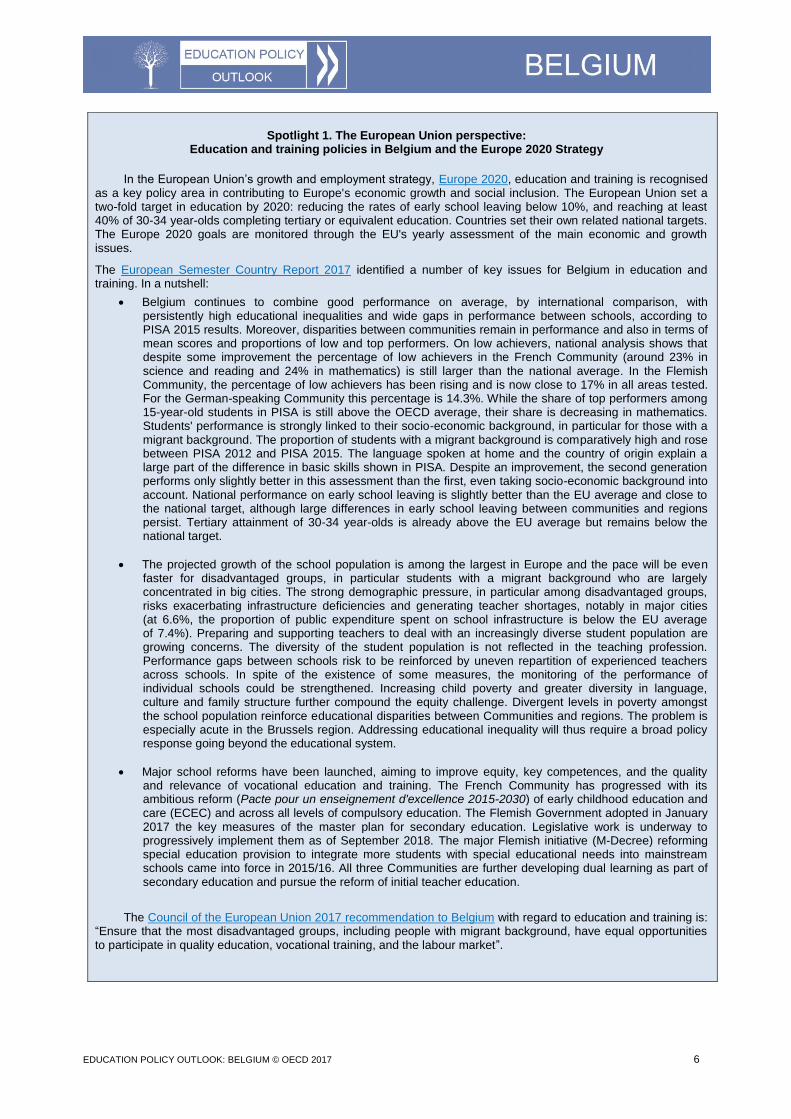
In Belgium, the share of 25-34 year-olds with at least an upper secondary education is 83%, one percentage point below the OECD average (84%), although regional variations are significant. About 43% of 25-34 year-olds have attained tertiary education overall in Belgium in 2015, close to the OECD average of 42% (Figure 2).
Figure 2. Upper secondary and tertiary attainment for 25-34 year-olds, 2015
Source: OECD (2016), Education at a Glance 2016: OECD Indicators, OECD Publishing, Paris, http://dx.doi.org/10.1787/eag-2016-en.
EDUCATION POLICY OUTLOOK: BELGIUM © OECD 2017 6
Spotlight 1. The European Union perspective: Education and training policies in Belgium and the Europe 2020 Strategy
In the European Union’s growth and employment strategy, Europe 2020, education and training is recognised as a key policy area in contributing to Europe's economic growth and social inclusion. The European Union set a two-fold target in education by 2020: reducing the rates of early school leaving below 10%, and reaching at least 40% of 30-34 year-olds completing tertiary or equivalent education. Countries set their own related national targets. The Europe 2020 goals are monitored through the EU's yearly assessment of the main economic and growth issues.
The European Semester Country Report 2017 identified a number of key issues for Belgium in education and training. In a nutshell:
Belgium continues to combine good performance on average, by international comparison, with persistently high educational inequalities and wide gaps in performance between schools, according to PISA 2015 results. Moreover, disparities between communities remain in performance and also in terms of mean scores and proportions of low and top performers. On low achievers, national analysis shows that despite some improvement the percentage of low achievers in the French Community (around 23% in science and reading and 24% in mathematics) is still larger than the national average. In the Flemish Community, the percentage of low achievers has been rising and is now close to 17% in all areas tested. For the German-speaking Community this percentage is 14.3%. While the share of top performers among 15-year-old students in PISA is still above the OECD average, their share is decreasing in mathematics. Students' performance is strongly linked to their socio-economic background, in particular for those with a migrant background. The proportion of students with a migrant background is comparatively high and rose between PISA 2012 and PISA 2015. The language spoken at home and the country of origin explain a large part of the difference in basic skills shown in PISA. Despite an improvement, the second generation performs only slightly better in this assessment than the first, even taking socio-economic background into account. National performance on early school leaving is slightly better than the EU average and close to the national target, although large differences in early school leaving between communities and regions persist. Tertiary attainment of 30-34 year-olds is already above the EU average but remains below the national target.
The projected growth of the school population is among the largest in Europe and the pace will be even faster for disadvantaged groups, in particular students with a migrant background who are largely concentrated in big cities. The strong demographic pressure, in particular among disadvantaged groups, risks exacerbating infrastructure deficiencies and generating teacher shortages, notably in major cities (at 6.6%, the proportion of public expenditure spent on school infrastructure is below the EU average of 7.4%). Preparing and supporting teachers to deal with an increasingly diverse student population are growing concerns. The diversity of the student population is not reflected in the teaching profession. Performance gaps between schools risk to be reinforced by uneven repartition of experienced teachers across schools. In spite of the existence of some measures, the monitoring of the performance of individual schools could be strengthened. Increasing child poverty and greater diversity in language, culture and family structure further compound the equity challenge. Divergent levels in poverty amongst the school population reinforce educational disparities between Communities and regions. The problem is especially acute in the Brussels region. Addressing educational inequality will thus require a broad policy response going beyond the educational system.
Major school reforms have been launched, aiming to improve equity, key competences, and the quality and relevance of vocational education and training. The French Community has progressed with its ambitious reform (Pacte pour un enseignement d'excellence 2015-2030) of early childhood education and care (ECEC) and across all levels of compulsory education. The Flemish Government adopted in January 2017 the key measures of the master plan for secondary education. Legislative work is underway to progressively implement them as of September 2018. The major Flemish initiative (M-Decree) reforming special education provision to integrate more students with special educational needs into mainstream schools came into force in 2015/16. All three Communities are further developing dual learning as part of secondary education and pursue the reform of initial teacher education.
The Council of the European Union 2017 recommendation to Belgium with regard to education and training is: “Ensure that the most disadvantaged groups, including people with migrant background, have equal opportunities to participate in quality education, vocational training, and the labour market”.
EDUCATION POLICY OUTLOOK: BELGIUM © OECD 2017 7
BELGIUM EDUCATION SYSTEMS SNAPSHOTS
1. EDUCATION SYSTEM OF THE FLEMISH COMMUNITY
CONTEXT
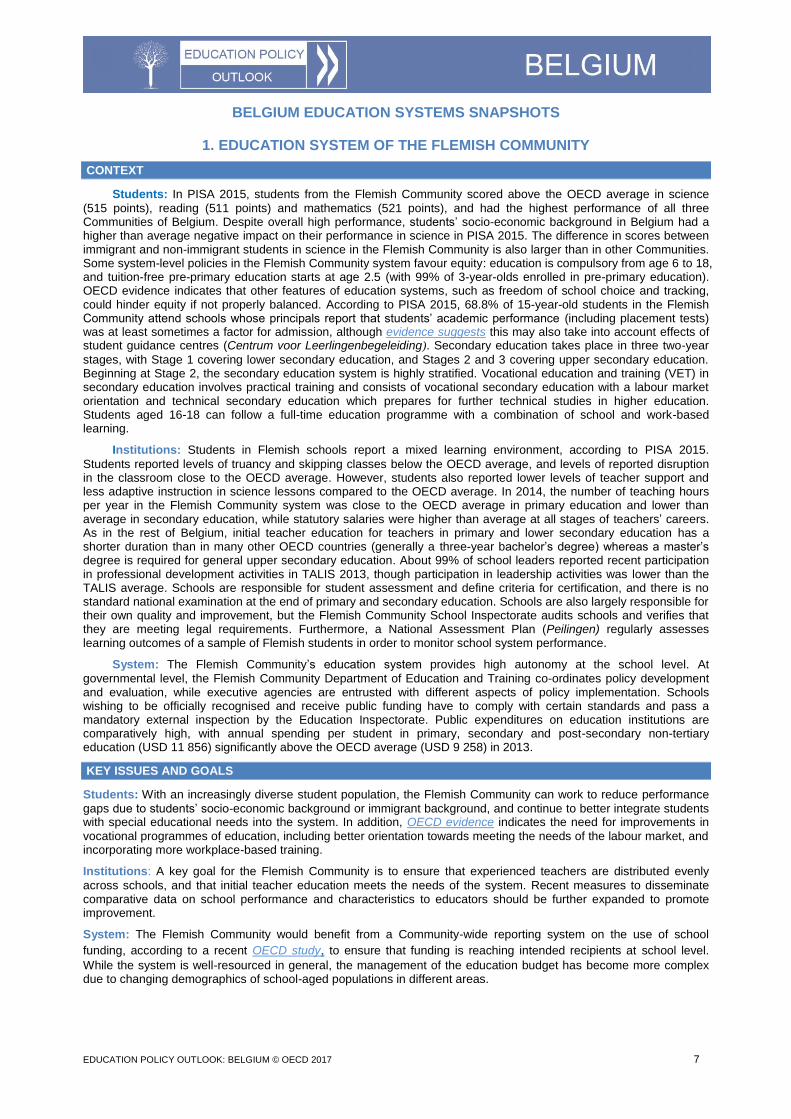
Students: In PISA 2015, students from the Flemish Community scored above the OECD average in science
(515 points), reading (511 points) and mathematics (521 points), and had the highest performance of all three Communities of Belgium. Despite overall high performance, students’ socio-economic background in Belgium had a higher than average negative impact on their performance in science in PISA 2015. The difference in scores between immigrant and non-immigrant students in science in the Flemish Community is also larger than in other Communities. Some system-level policies in the Flemish Community system favour equity: education is compulsory from age 6 to 18, and tuition-free pre-primary education starts at age 2.5 (with 99% of 3-year-olds enrolled in pre-primary education). OECD evidence indicates that other features of education systems, such as freedom of school choice and tracking, could hinder equity if not properly balanced. According to PISA 2015, 68.8% of 15-year-old students in the Flemish Community attend schools whose principals report that students’ academic performance (including placement tests) was at least sometimes a factor for admission, although evidence suggests this may also take into account effects of student guidance centres (Centrum voor Leerlingenbegeleiding). Secondary education takes place in three two-year
stages, with Stage 1 covering lower secondary education, and Stages 2 and 3 covering upper secondary education. Beginning at Stage 2, the secondary education system is highly stratified. Vocational education and training (VET) in secondary education involves practical training and consists of vocational secondary education with a labour market orientation and technical secondary education which prepares for further technical studies in higher education. Students aged 16-18 can follow a full-time education programme with a combination of school and work-based learning.
Institutions: Students in Flemish schools report a mixed learning environment, according to PISA 2015.
Students reported levels of truancy and skipping classes below the OECD average, and levels of reported disruption in the classroom close to the OECD average. However, students also reported lower levels of teacher support and less adaptive instruction in science lessons compared to the OECD average. In 2014, the number of teaching hours per year in the Flemish Community system was close to the OECD average in primary education and lower than average in secondary education, while statutory salaries were higher than average at all stages of teachers’ careers. As in the rest of Belgium, initial teacher education for teachers in primary and lower secondary education has a shorter duration than in many other OECD countries (generally a three-year bachelor’s degree) whereas a master’s degree is required for general upper secondary education. About 99% of school leaders reported recent participation in professional development activities in TALIS 2013, though participation in leadership activities was lower than the TALIS average. Schools are responsible for student assessment and define criteria for certification, and there is no standard national examination at the end of primary and secondary education. Schools are also largely responsible for their own quality and improvement, but the Flemish Community School Inspectorate audits schools and verifies that they are meeting legal requirements. Furthermore, a National Assessment Plan (Peilingen) regularly assesses learning outcomes of a sample of Flemish students in order to monitor school system performance.
System: The Flemish Community’s education system provides high autonomy at the school level. At
governmental level, the Flemish Community Department of Education and Training co-ordinates policy development and evaluation, while executive agencies are entrusted with different aspects of policy implementation. Schools wishing to be officially recognised and receive public funding have to comply with certain standards and pass a mandatory external inspection by the Education Inspectorate. Public expenditures on education institutions are comparatively high, with annual spending per student in primary, secondary and post-secondary non-tertiary education (USD 11 856) significantly above the OECD average (USD 9 258) in 2013.
KEY ISSUES AND GOALS
Students: With an increasingly diverse student population, the Flemish Community can work to reduce performance
gaps due to students’ socio-economic background or immigrant background, and continue to better integrate students with special educational needs into the system. In addition, OECD evidence indicates the need for improvements in
vocational programmes of education, including better orientation towards meeting the needs of the labour market, and incorporating more workplace-based training.
Institutions: A key goal for the Flemish Community is to ensure that experienced teachers are distributed evenly
across schools, and that initial teacher education meets the needs of the system. Recent measures to disseminate comparative data on school performance and characteristics to educators should be further expanded to promote improvement.
System: The Flemish Community would benefit from a Community-wide reporting system on the use of school
funding, according to a recent OECD study, to ensure that funding is reaching intended recipients at school level.
While the system is well-resourced in general, the management of the education budget has become more complex due to changing demographics of school-aged populations in different areas.
EDUCATION POLICY OUTLOOK: BELGIUM © OECD 2017 8
SELECTED POLICY RESPONSES
A range of measures underpinned by the Equal Opportunities Parliamentary Act of 2002 (Gelijke Onderwijskansen, or GOK), the Parliamentary Act on the Operational Budgets of Schools of 2008 and the Parliamentary Act on the Right to Enrolment of 2011 are in place to promote equal opportunities. Measures include the creation of local structures to increase the fairness of school admission procedures, weighting funding in favour of schools with higher levels of socio-economic disadvantage, and safeguarding the right of enrolment and school choice for all children.
In 2015 and 2016, a series of special measures were passed by the Flemish Parliament to enhance integration of refugees in the education system, including new funding initiatives for language support in pre-primary schools, an increase of resources for welcoming classes in school education, and further supporting previously existing measures such as adult linguistic integration and NARIC (National Academic Recognition Centre) for recognising refugees’ qualifications. In addition, special admission procedures and financial support measures are applied for refugee students in universities and university colleges.
The Early School Leaving Monitor system aims to monitor and track the outcomes, socio-economic characteristics and study progression of those who leave education without an upper secondary qualification. The Monitor is one of the measures under the general framework of action, Together against
Early School Leaving, adopted by the government in 2016.
The Flemish Government has adopted a new master plan for secondary education, to be legislated during the 2014-19 administration. The plan integrates existing measures such as initiatives to reduce early school leaving and to improve equity, and is closely linked to other reform processes, such as rationalising school governance, updating educational objectives and a new system of dual learning. The first stage is outlined in three concept notes approved by the government in 2016 and 2017 and includes measures for pre-primary, primary and secondary education to ease students’ transition into secondary education, including more differentiation in the first stage of secondary education. Legislative work is underway to assure gradual implementation starting from 2018.
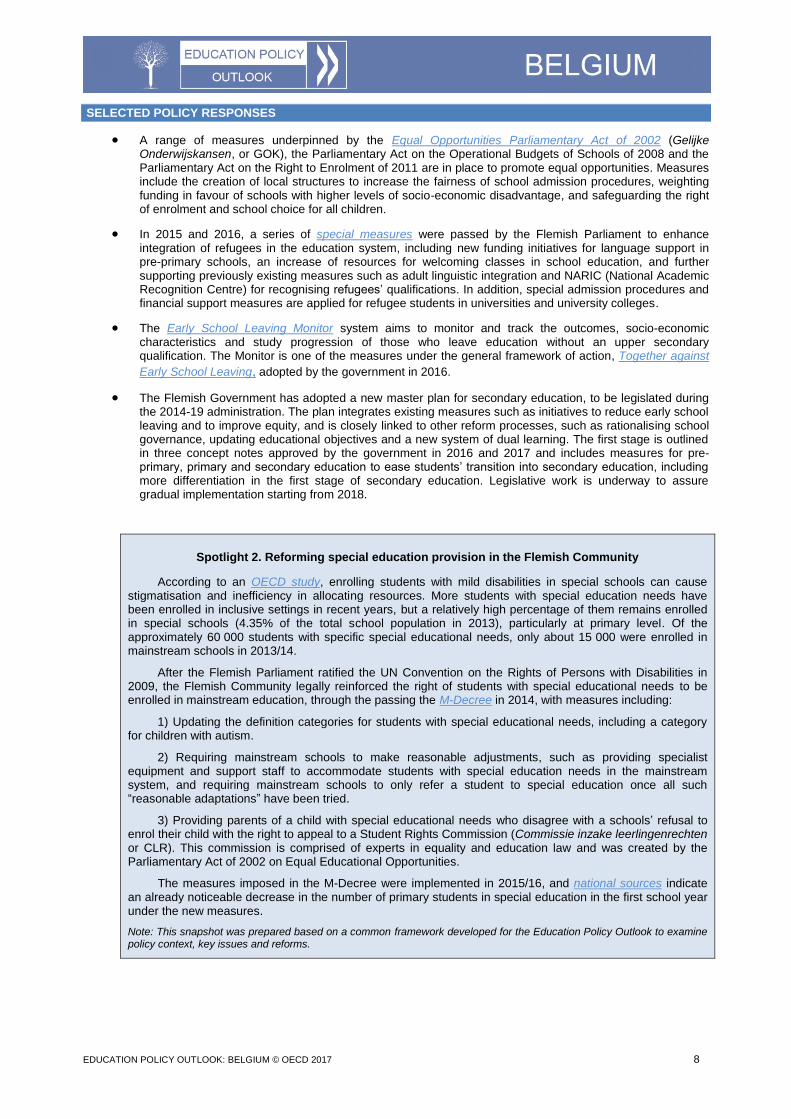
Spotlight 2. Reforming special education provision in the Flemish Community
According to an OECD study, enrolling students with mild disabilities in special schools can cause stigmatisation and inefficiency in allocating resources. More students with special education needs have been enrolled in inclusive settings in recent years, but a relatively high percentage of them remains enrolled in special schools (4.35% of the total school population in 2013), particularly at primary level. Of the approximately 60 000 students with specific special educational needs, only about 15 000 were enrolled in mainstream schools in 2013/14.
After the Flemish Parliament ratified the UN Convention on the Rights of Persons with Disabilities in 2009, the Flemish Community legally reinforced the right of students with special educational needs to be enrolled in mainstream education, through the passing the M-Decree in 2014, with measures including:
1) Updating the definition categories for students with special educational needs, including a category for children with autism.
2) Requiring mainstream schools to make reasonable adjustments, such as providing specialist equipment and support staff to accommodate students with special education needs in the mainstream system, and requiring mainstream schools to only refer a student to special education once all such “reasonable adaptations” have been tried.
3) Providing parents of a child with special educational needs who disagree with a schools’ refusal to enrol their child with the right to appeal to a Student Rights Commission (Commissie inzake leerlingenrechten or CLR). This commission is comprised of experts in equality and education law and was created by the Parliamentary Act of 2002 on Equal Educational Opportunities.
The measures imposed in the M-Decree were implemented in 2015/16, and national sources indicate an already noticeable decrease in the number of primary students in special education in the first school year under the new measures.
Note: This snapshot was prepared based on a common framework developed for the Education Policy Outlook to examine policy context, key issues and reforms.
EDUCATION POLICY OUTLOOK: BELGIUM © OECD 2017 9
2. EDUCATION SYSTEM OF THE FRENCH COMMUNITY
CONTEXT
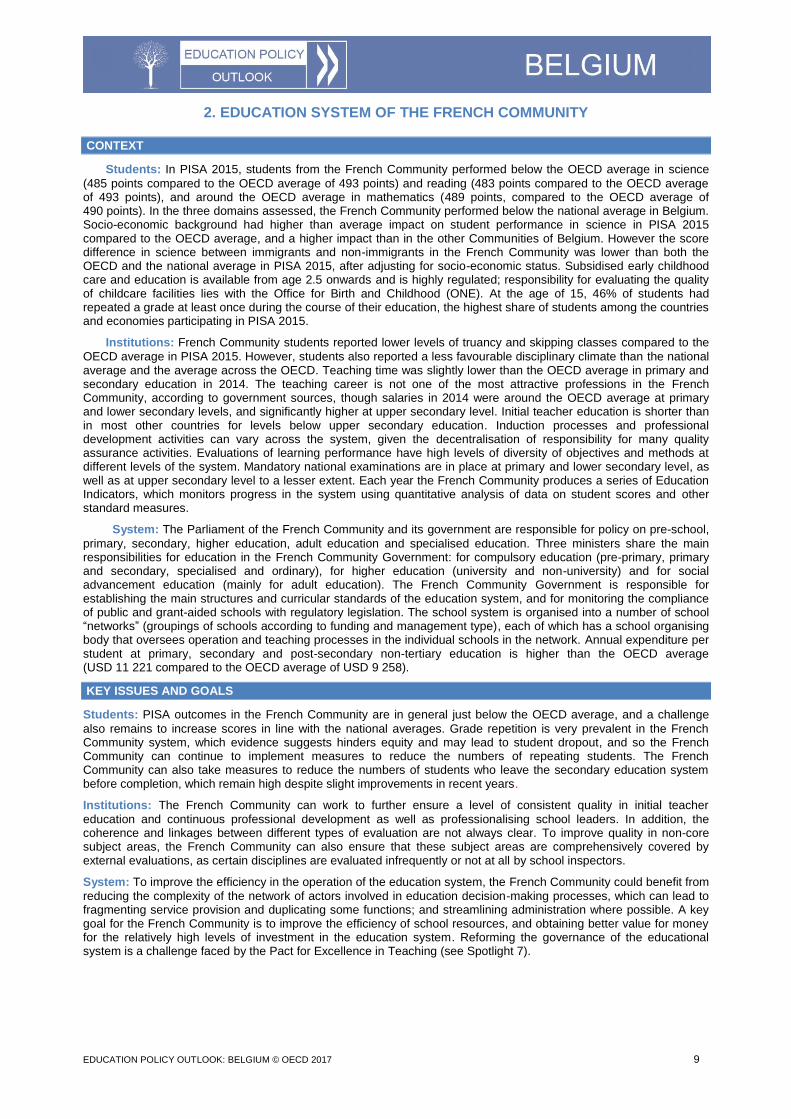
Students: In PISA 2015, students from the French Community performed below the OECD average in science
(485 points compared to the OECD average of 493 points) and reading (483 points compared to the OECD average of 493 points), and around the OECD average in mathematics (489 points, compared to the OECD average of 490 points). In the three domains assessed, the French Community performed below the national average in Belgium. Socio-economic background had higher than average impact on student performance in science in PISA 2015 compared to the OECD average, and a higher impact than in the other Communities of Belgium. However the score difference in science between immigrants and non-immigrants in the French Community was lower than both the OECD and the national average in PISA 2015, after adjusting for socio-economic status. Subsidised early childhood care and education is available from age 2.5 onwards and is highly regulated; responsibility for evaluating the quality of childcare facilities lies with the Office for Birth and Childhood (ONE). At the age of 15, 46% of students had repeated a grade at least once during the course of their education, the highest share of students among the countries and economies participating in PISA 2015.
Institutions: French Community students reported lower levels of truancy and skipping classes compared to the
OECD average in PISA 2015. However, students also reported a less favourable disciplinary climate than the national average and the average across the OECD. Teaching time was slightly lower than the OECD average in primary and secondary education in 2014. The teaching career is not one of the most attractive professions in the French Community, according to government sources, though salaries in 2014 were around the OECD average at primary and lower secondary levels, and significantly higher at upper secondary level. Initial teacher education is shorter than in most other countries for levels below upper secondary education. Induction processes and professional development activities can vary across the system, given the decentralisation of responsibility for many quality assurance activities. Evaluations of learning performance have high levels of diversity of objectives and methods at different levels of the system. Mandatory national examinations are in place at primary and lower secondary level, as well as at upper secondary level to a lesser extent. Each year the French Community produces a series of Education Indicators, which monitors progress in the system using quantitative analysis of data on student scores and other standard measures.
System: The Parliament of the French Community and its government are responsible for policy on pre-school,
primary, secondary, higher education, adult education and specialised education. Three ministers share the main responsibilities for education in the French Community Government: for compulsory education (pre-primary, primary and secondary, specialised and ordinary), for higher education (university and non-university) and for social advancement education (mainly for adult education). The French Community Government is responsible for establishing the main structures and curricular standards of the education system, and for monitoring the compliance of public and grant-aided schools with regulatory legislation. The school system is organised into a number of school “networks” (groupings of schools according to funding and management type), each of which has a school organising body that oversees operation and teaching processes in the individual schools in the network. Annual expenditure per student at primary, secondary and post-secondary non-tertiary education is higher than the OECD average (USD 11 221 compared to the OECD average of USD 9 258).
KEY ISSUES AND GOALS
Students: PISA outcomes in the French Community are in general just below the OECD average, and a challenge
also remains to increase scores in line with the national averages. Grade repetition is very prevalent in the French Community system, which evidence suggests hinders equity and may lead to student dropout, and so the French Community can continue to implement measures to reduce the numbers of repeating students. The French Community can also take measures to reduce the numbers of students who leave the secondary education system before completion, which remain high despite slight improvements in recent years.
Institutions: The French Community can work to further ensure a level of consistent quality in initial teacher
education and continuous professional development as well as professionalising school leaders. In addition, the coherence and linkages between different types of evaluation are not always clear. To improve quality in non-core subject areas, the French Community can also ensure that these subject areas are comprehensively covered by external evaluations, as certain disciplines are evaluated infrequently or not at all by school inspectors.
System: To improve the efficiency in the operation of the education system, the French Community could benefit from
reducing the complexity of the network of actors involved in education decision-making processes, which can lead to fragmenting service provision and duplicating some functions; and streamlining administration where possible. A key goal for the French Community is to improve the efficiency of school resources, and obtaining better value for money for the relatively high levels of investment in the education system. Reforming the governance of the educational system is a challenge faced by the Pact for Excellence in Teaching (see Spotlight 7).
EDUCATION POLICY OUTLOOK: BELGIUM © OECD 2017 10
SELECTED POLICY RESPONSES
The DASPA decree (Dispositif d'accueil et de scolarisation des élèves primo-arrivants, 2012, and further strengthened in 2015) provides for a series of measures to support the integration of newly arrived children and those with a linguistic background other than the language of instruction (French), such as special reception classes and tailored pedagogical support.
A 2016 government decree contained a number of measures to strengthen pre-primary education; the “Décret portant diverses mesures relatives à l'enseignement obligatoire, à la Culture, à l'Académie de recherche et d'enseignement supérieur, au financement de l'enseignement supérieur universitaire et non universitaire et à la garantie de la Communauté française”. The measures included more strongly monitoring language acquisition and learning outcomes, and allowing for repetition of the third year of pre-primary education only in very exceptional circumstances.
A Skills Validation Consortium has been established since 2005, in order to enable those aged over the age of 18 to receive equivalence qualifications or accreditation for skills acquired through work experience or other training. Students who pass a validation test are awarded skills certificates, which attest to their mastery of all or part of a profession.
The French Community has adopted a new system of prevention and fight against radicalism, by implementing the strategy against radicalism adopted in 2015 by the Government of the French Community. An Anti-Radicalism Network (RAR), a key feature of the strategy, now has operational centres and an anti-radicalism strategic committee.
Two recent legislative amendments (amendments to existing decrees) strengthen training for teachers in the French Community, with a new requirement for mandatory continuous professional development, progressively increasing from 6 to 10 half days per year, and provision for additional voluntary training subject to authorisation if it takes place during school teaching time.
A new mandatory welcome and support programme for teachers in the French Community came into operation from 2016/17, including an interview with the head of the school, introductions to other staff members and an explanation of the school’s pedagogical approach and working regulations and conditions.
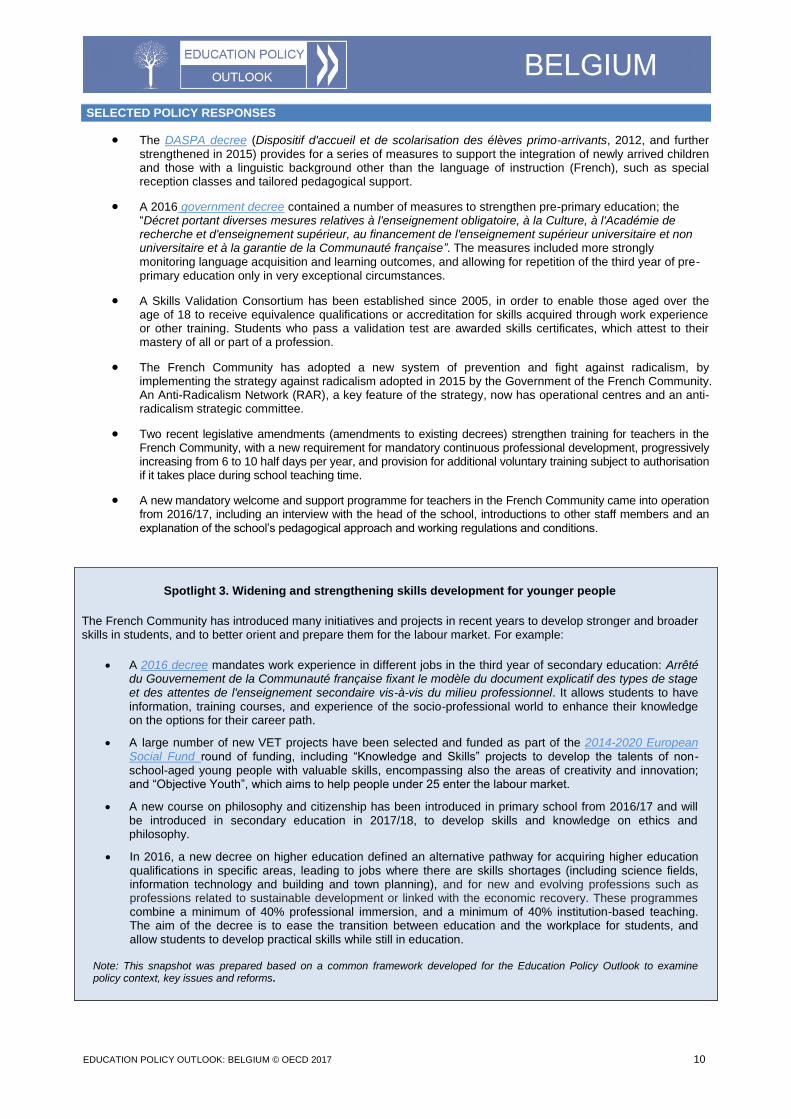
Spotlight 3. Widening and strengthening skills development for younger people
The French Community has introduced many initiatives and projects in recent years to develop stronger and broader skills in students, and to better orient and prepare them for the labour market. For example:
A 2016 decree mandates work experience in different jobs in the third year of secondary education: Arrêté du Gouvernement de la Communauté française fixant le modèle du document explicatif des types de stage et des attentes de l'enseignement secondaire vis-à-vis du milieu professionnel. It allows students to have information, training courses, and experience of the socio-professional world to enhance their knowledge on the options for their career path.
A large number of new VET projects have been selected and funded as part of the 2014-2020 European Social Fund round of funding, including “Knowledge and Skills” projects to develop the talents of non-school-aged young people with valuable skills, encompassing also the areas of creativity and innovation; and “Objective Youth”, which aims to help people under 25 enter the labour market.
A new course on philosophy and citizenship has been introduced in primary school from 2016/17 and will be introduced in secondary education in 2017/18, to develop skills and knowledge on ethics and philosophy.
In 2016, a new decree on higher education defined an alternative pathway for acquiring higher education qualifications in specific areas, leading to jobs where there are skills shortages (including science fields, information technology and building and town planning), and for new and evolving professions such as professions related to sustainable development or linked with the economic recovery. These programmes combine a minimum of 40% professional immersion, and a minimum of 40% institution-based teaching. The aim of the decree is to ease the transition between education and the workplace for students, and allow students to develop practical skills while still in education.
Note: This snapshot was prepared based on a common framework developed for the Education Policy Outlook to examine policy context, key issues and reforms.
EDUCATION POLICY OUTLOOK: BELGIUM © OECD 2017 11
3. EDUCATION SYSTEM OF THE GERMAN-SPEAKING COMMUNITY
CONTEXT
Students: In PISA 2015, students from the German-speaking Community performed above the OECD average
in science (505 points), mathematics (502 points) and reading (501 points). The socio-economic background of students in this Community had much less impact on their science scores in PISA 2015 than for either the other Belgian Communities or the overall OECD average. The Ministry of the German-speaking Community is not directly responsible for ECEC institutions for children under 3 years of age, but it establishes institutions’ conditions of approval, and provides subsidies and quality assurance. Pre-primary education for children is provided as a basic level of education between the ages of 3 and 6 and is tied to the primary schooling system. Pre-schools are administered and funded directly by the German-speaking Community and there are no private pre-schools. Education is compulsory from 6 to 18 years old and provided free of tuition fees. Multiple orientation options are available in upper secondary education, including general education, technical education, a vocational stream, or a professional dual education in the form of an apprenticeship. There is only one higher education institution in the German-speaking Community, offering short-course programmes (Autonome Hochschule). For other higher education studies, students generally attend institutions in the Flemish or French Communities.
Institutions: Students and school principals in the German-speaking Community reported more positive
learning environments in many respects compared to the OECD average in PISA 2015, with a lower percentage of students reporting truancy and skipping classes, and a smaller proportion of students in schools where principals reported that student intimidation and bullying hinders learning in their schools. However, students also reported a less positive disciplinary climate than the OECD average and lower than average levels of teacher feedback on strengths and areas for improvement in science lessons. Belgium’s German-speaking Community only has training for kindergarten (pre-primary) teachers and primary school teachers, with secondary school teachers mainly trained in the French Community. Although job security for permanent and/or contracted teachers is relatively high, teaching hours or positions become imbalanced in some cases due to rapidly decreasing student numbers. However, staff shortage remains a significant issue for the German-speaking Community according to PISA 2015, where 61.7% of principals reported that a lack of teaching staff hindered the school’s capacity to provide instruction at least to some extent. Formative evaluation is the only form of assessment in pre-school; while in primary and general secondary education both formative and summative evaluation exists.
System: The German-speaking Community administers education for approximately 15 000 students across the
system, which represents around 5% of the total population of students in Belgium. The German-speaking Community’s Minister of Education serves as the schools authority for the German-speaking Community schools, linked to the German-speaking Community Education System (CES) educational network. Separate networks also exist covering other government-aided public schools and government-aided private schools. The minister and the ministry are also regulators and thus in charge of monitoring the practice of all legal conditions and regulations, not only in individual Community schools, but also in other authorities’ schools. Education is financed by the Community budget, comprised of: an endowment from the federal state; finances transferred from the Walloon Region, for the use of delegated areas of competence; and a portion of the radio and television dues paid by Community residents. Schools are allocated funding and teaching hours according to enrolment levels. Additionally, the Province of Luxembourg (in the Wallonia region) assists the German-speaking Community with certain expenses, particularly for special education.
KEY ISSUES AND GOALS
Students: To ensure students’ needs are adequately met in the classroom setting, more support could be provided to
the teaching profession, in order to improve levels of training and support, and to provide them with more capacity for classroom observations.
Institutions: The German-speaking Community can take steps to deal with the acute teacher shortage and lack of
advancement options in the teaching career. The number of teaching staff without permanent appointment is relatively large in almost all schools, and such positions are more vulnerable in a climate of decreasing enrolments.
System: Although education is provided free of tuition fees, the German-speaking Community has faced challenges
in ensuring that social background and income levels are not a barrier to accessing education due to high levels of incidental expenses in the system. In addition, there is a recognised need to update many of the legacy policies within the education system to modernise approaches.
EDUCATION POLICY OUTLOOK: BELGIUM © OECD 2017 12
SELECTED POLICY RESPONSES
In 2014, the Parliament of the German-speaking Community adopted a decree on childhood care covering this Community’s early childhood education and care system. The aim of the decree is to provide a framework for all ECEC support measures in the German-speaking Community and to regulate the basic provisions in childhood care.
In 2015, the German-speaking Community created a “special educator” role in mainstream primary school education. This specially trained primary school teacher observes groups of students and individual students with special educational needs in mainstream primary education schools, with the aim of establishing faster and easier access to support .
In 2009, a Further Education Commission was established whose main objectives are, in collaboration with the educational actors in the German-speaking Community: to co-ordinate local further education provision; to plan and deliver sustained expansion of provision; and to ensure lifelong learning in the German-speaking Community.
In 2015, the Parliament of the German-speaking Community of Belgium adopted new skills guides for the subjects of Mathematics and English as second foreign language and Sports for the second and third stages of general and technical transitional education in secondary education.
In 2010, the Parliament of the German-speaking Community adopted a Decree on educational and administrative reforms for the school system, with measures including setting baseline requirements for teacher training; new rules around students moving between schools, including in special education; and
updating the conditions for granting equivalence to foreign diplomas and certificates.
In 2016, the parliament extended a foundational decree of 31 August 1998 to include compensation for disadvantages (for pupils with dyslexia or dyscalculia, for example) which will enter into force in 2017, as well as grade protection, entering into force in 2018 (see Dekret über Maßnahmen im Unterrichtswesen
2016).
A legislative amendment is currently in process to update measures for schooling newly arrived children and to respond to the recent refugee crisis.
Spotlight 4. Reducing the cost of schooling for parents in the German-speaking Community
In 2014, the German-speaking Community increased the amount of per-student funding for educational purposes to EUR 100 per student for primary school children and EUR 25 for kindergarten school children, in order to help alleviate the cost of educational expenses for children’s families. Following the funding increase, schools are no longer allowed to charge parents fees for sporting activities organised by schools (e.g. swimming lessons) or other school events, such as diploma ceremonies. While the cost of extracurricular activities such as outside excursions may still be charged to parents, schools also have the option to cover these costs themselves using per-student funding provided by the government for this purpose.
Note: This snapshot was prepared based on a common framework developed for the Education Policy Outlook to examine policy context, key issues and reforms.
EDUCATION POLICY OUTLOOK: BELGIUM © OECD 2017 13
EQUITY AND QUALITY: ALMOST UNIVERSAL PARTICIPATION IN PRE-PRIMARY EDUCATION
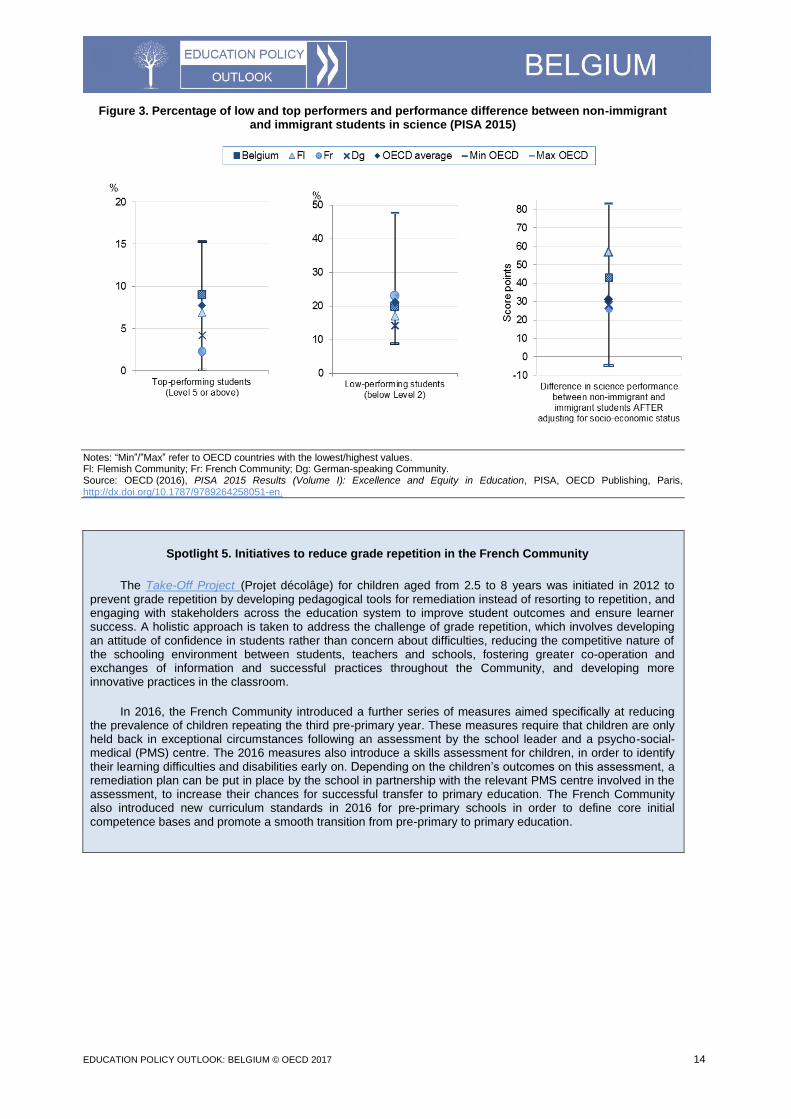
Belgium is an above-average overall performer in science, mathematics and reading in PISA 2015, although there are differences in achievement levels across the Communities. In science, Belgium had a slightly higher than average share of top performers (with 9.0% of students at or above Level 5 compared to the OECD average of 7.7%) and a slightly below-average share of low performers (with 19.8% of students below Level 2 compared to the OECD average of 21.2%) (Figure 3). Across PISA cycles, Belgium’s performance has remained unchanged in science and reading and has decreased in mathematics. At the national level (although to a lesser extent for the German-speaking Community), the relationship between performance and socio-economic status was stronger overall in Belgium than the OECD average in PISA 2015 (19.3% of variance in science performance is explained by economic, social or cultural status, compared to the OECD average of 12.9%), and grade repetition rates are significantly higher than average in all Communities of Belgium.
Some early childhood education and care policies in Belgium can help to foster equity and increase
participation of students from disadvantaged backgrounds. Participation in pre-primary education is high – about 98% of both 3-year-olds and 4-year-olds were enrolled in pre-primary education in 2014 (above the OECD average of 71% for 3-year-olds and 86% for 4-year-olds). In the French and Flemish Communities, day care and early education for children under 3 are offered by public and grant-aided institutions, while in the German-speaking Community, ECEC is catered for completely by the private sector and subsidised by the government. Pre-primary education is available free of tuition charges from the age of 2.5 (3 in the German-speaking Community), while supplementary investments are made in schools catering for substantial family diversity.
Some system-level policies in Belgium help to promote equity, such as a longer duration of compulsory
education, a lack of financial barriers, and universal right of access. Education is compulsory from the age of 6 to the age of 18 in Belgium, and all children have the right to education, regardless of their nationality, residence and legal status. At the same time, other policies such as early tracking, school choice and academic selection can hinder equity if not managed appropriately. Student tracking takes place for the first time to some extent at the age of 12 (in the Flemish Community only), but generally begins at age 14, (the same as the OECD average) and is based on students’ academic records. Grade repetition is quite prevalent in Belgium, which OECD evidence shows is ineffective in
improving outcomes, can contribute to dropout and is costly to the system. In PISA 2015, 34% of 15-year-olds in Belgium reported that they had repeated at least one year in primary or secondary education, significantly higher than the OECD average of 11.3%. Among the Communities, grade repetition was highest in the French Community.
National sources indicate increasing student diversity in Belgium. According to PISA 2015, students with
immigrant backgrounds (first or second generation immigrants) comprise 17.7% of 15-year-old students in Belgium, and have significantly lower performance: a difference of 43 score points with their peers without immigrant backgrounds after adjusting for socio-economic status, compared to the OECD average gap of 31 score points. The Flemish Community in particular has a very significant performance gap of 57 points, while the differences in scores between immigrants and non-immigrants in the other Communities are close to the OECD average. Belgium also faces a challenge to integrate significant numbers of newly arrived migrants and refugees into the education system.
The challenge: Developing system-level responses to inequity in education.
Recent policies and practices
The Flemish Community gives priority access to childcare for children under 3. Beneficiaries are single parents and/or low-income parents who are unable to care for their children during the day due to their work or study, or for whom childcare can facilitate socio-economic integration and increased labour market participation. Schools receive extra funding (EUR 950 per year) at pre-primary education level for each newly arrived child from the age of 2.5 whose native language is not Dutch.
In the German-speaking Community, the parliament adopted a decree on childhood care in 2014 to underpin and regulate all the basic provisions in childhood care.
In the French Community, the DASPA decree (2012, and further strengthened in 2015) provides for a series of support measures for newly arrived students and to support the integration of migrants with a linguistic background other than the language of schooling (French).
The French Community adopted the Decree of 4 February 2016 to make mainstream education more inclusive for students with different education needs, and to reduce the numbers of students streamed to special education settings due to a lack of language proficiency or learning disabilities.
EDUCATION POLICY OUTLOOK: BELGIUM © OECD 2017 14
Figure 3. Percentage of low and top performers and performance difference between non-immigrant and immigrant students in science (PISA 2015)
Notes: “Min”/”Max” refer to OECD countries with the lowest/highest values. Fl: Flemish Community; Fr: French Community; Dg: German-speaking Community. Source: OECD (2016), PISA 2015 Results (Volume I): Excellence and Equity in Education, PISA, OECD Publishing, Paris, http://dx.doi.org/10.1787/9789264258051-en.
Spotlight 5. Initiatives to reduce grade repetition in the French Community
The Take-Off Project (Projet décolâge) for children aged from 2.5 to 8 years was initiated in 2012 to prevent grade repetition by developing pedagogical tools for remediation instead of resorting to repetition, and engaging with stakeholders across the education system to improve student outcomes and ensure learner success. A holistic approach is taken to address the challenge of grade repetition, which involves developing an attitude of confidence in students rather than concern about difficulties, reducing the competitive nature of the schooling environment between students, teachers and schools, fostering greater co-operation and exchanges of information and successful practices throughout the Community, and developing more innovative practices in the classroom.
In 2016, the French Community introduced a further series of measures aimed specifically at reducing the prevalence of children repeating the third pre-primary year. These measures require that children are only held back in exceptional circumstances following an assessment by the school leader and a psycho-social-medical (PMS) centre. The 2016 measures also introduce a skills assessment for children, in order to identify their learning difficulties and disabilities early on. Depending on the children’s outcomes on this assessment, a remediation plan can be put in place by the school in partnership with the relevant PMS centre involved in the assessment, to increase their chances for successful transfer to primary education. The French Community also introduced new curriculum standards in 2016 for pre-primary schools in order to define core initial competence bases and promote a smooth transition from pre-primary to primary education.
EDUCATION POLICY OUTLOOK: BELGIUM © OECD 2017 15
PREPARING STUDENTS FOR THE FUTURE: VARIED LINKS BETWEEN EDUCATION, TRAINING AND EMPLOYMENT
Labour market perspectives can play an important role in a student’s decision to stay in education. In Belgium,
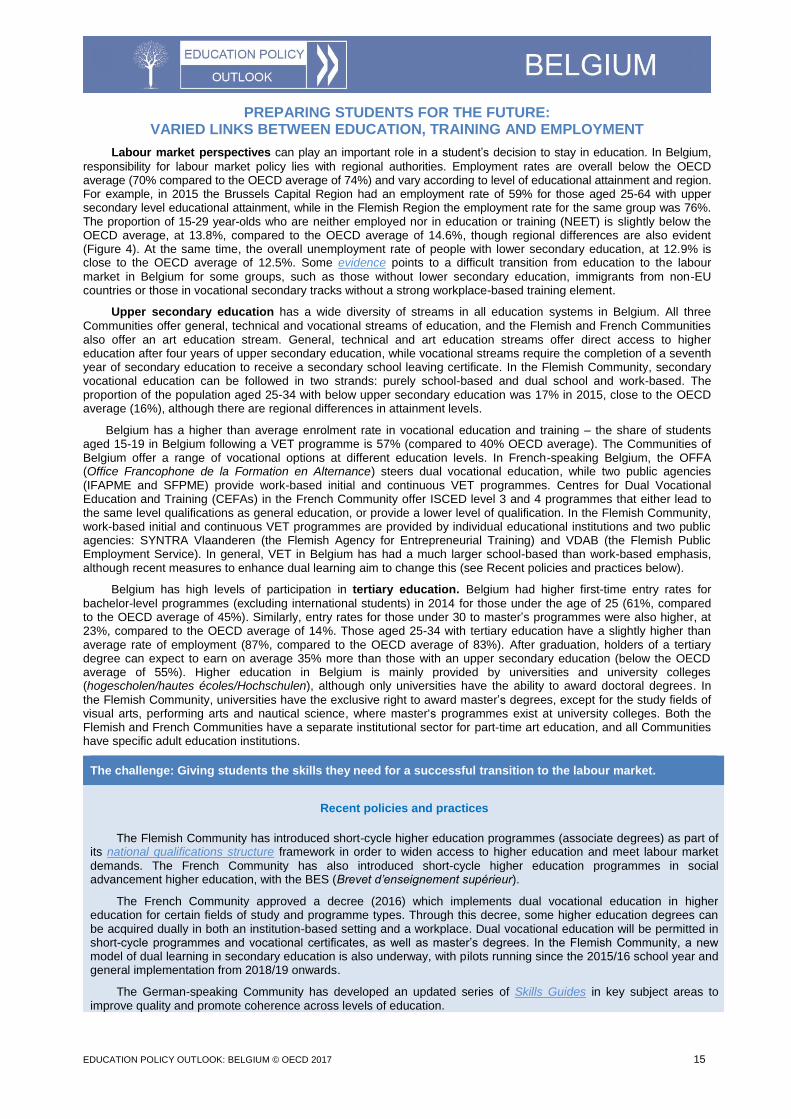
responsibility for labour market policy lies with regional authorities. Employment rates are overall below the OECD average (70% compared to the OECD average of 74%) and vary according to level of educational attainment and region. For example, in 2015 the Brussels Capital Region had an employment rate of 59% for those aged 25-64 with upper secondary level educational attainment, while in the Flemish Region the employment rate for the same group was 76%. The proportion of 15-29 year-olds who are neither employed nor in education or training (NEET) is slightly below the OECD average, at 13.8%, compared to the OECD average of 14.6%, though regional differences are also evident (Figure 4). At the same time, the overall unemployment rate of people with lower secondary education, at 12.9% is close to the OECD average of 12.5%. Some evidence points to a difficult transition from education to the labour
market in Belgium for some groups, such as those without lower secondary education, immigrants from non-EU countries or those in vocational secondary tracks without a strong workplace-based training element.
Upper secondary education has a wide diversity of streams in all education systems in Belgium. All three
Communities offer general, technical and vocational streams of education, and the Flemish and French Communities also offer an art education stream. General, technical and art education streams offer direct access to higher education after four years of upper secondary education, while vocational streams require the completion of a seventh year of secondary education to receive a secondary school leaving certificate. In the Flemish Community, secondary vocational education can be followed in two strands: purely school-based and dual school and work-based. The proportion of the population aged 25-34 with below upper secondary education was 17% in 2015, close to the OECD average (16%), although there are regional differences in attainment levels.
Belgium has a higher than average enrolment rate in vocational education and training – the share of students aged 15-19 in Belgium following a VET programme is 57% (compared to 40% OECD average). The Communities of Belgium offer a range of vocational options at different education levels. In French-speaking Belgium, the OFFA (Office Francophone de la Formation en Alternance) steers dual vocational education, while two public agencies (IFAPME and SFPME) provide work-based initial and continuous VET programmes. Centres for Dual Vocational Education and Training (CEFAs) in the French Community offer ISCED level 3 and 4 programmes that either lead to the same level qualifications as general education, or provide a lower level of qualification. In the Flemish Community, work-based initial and continuous VET programmes are provided by individual educational institutions and two public agencies: SYNTRA Vlaanderen (the Flemish Agency for Entrepreneurial Training) and VDAB (the Flemish Public Employment Service). In general, VET in Belgium has had a much larger school-based than work-based emphasis, although recent measures to enhance dual learning aim to change this (see Recent policies and practices below).
Belgium has high levels of participation in tertiary education. Belgium had higher first-time entry rates for
bachelor-level programmes (excluding international students) in 2014 for those under the age of 25 (61%, compared to the OECD average of 45%). Similarly, entry rates for those under 30 to master’s programmes were also higher, at 23%, compared to the OECD average of 14%. Those aged 25-34 with tertiary education have a slightly higher than average rate of employment (87%, compared to the OECD average of 83%). After graduation, holders of a tertiary degree can expect to earn on average 35% more than those with an upper secondary education (below the OECD average of 55%). Higher education in Belgium is mainly provided by universities and university colleges (hogescholen/hautes écoles/Hochschulen), although only universities have the ability to award doctoral degrees. In
the Flemish Community, universities have the exclusive right to award master’s degrees, except for the study fields of visual arts, performing arts and nautical science, where master‘s programmes exist at university colleges. Both the Flemish and French Communities have a separate institutional sector for part-time art education, and all Communities have specific adult education institutions.
The challenge: Giving students the skills they need for a successful transition to the labour market.
Recent policies and practices
The Flemish Community has introduced short-cycle higher education programmes (associate degrees) as part of its national qualifications structure framework in order to widen access to higher education and meet labour market
demands. The French Community has also introduced short-cycle higher education programmes in social advancement higher education, with the BES (Brevet d’enseignement supérieur).
The French Community approved a decree (2016) which implements dual vocational education in higher education for certain fields of study and programme types. Through this decree, some higher education degrees can be acquired dually in both an institution-based setting and a workplace. Dual vocational education will be permitted in short-cycle programmes and vocational certificates, as well as master’s degrees. In the Flemish Community, a new model of dual learning in secondary education is also underway, with pilots running since the 2015/16 school year and general implementation from 2018/19 onwards.
The German-speaking Community has developed an updated series of Skills Guides in key subject areas to improve quality and promote coherence across levels of education.
EDUCATION POLICY OUTLOOK: BELGIUM © OECD 2017 16
Figure 4. Percentage of the population aged 15-29 in education and not in education by region, 2015
Note: NEET: Not employed, in education or training. Sources: OECD (2016), Education at a Glance 2016: OECD Indicators, OECD Publishing, Paris, http://dx.doi.org/10.1787/eag-2016-en; NCES (2016), Education at a Glance 2016 Subnational Supplement, NCES Publishing, Washington D.C. https://nces.ed.gov/surveys/annualreports/oecd/index.asp
0%
20%
40%
60%
80%
100%
Belgium OECD average Brussels CapitalRegion
Flemish Region Walloon Region
% o
f 1
5-2
9 y
ea
r-o
lds
In education Not in education, employed Not in education, not employed (NEET)
Spotlight 6. Promoting STEM take-up in the Flemish Community
The Flemish Community has developed an Action Plan for STEM 2012-2020 which contains a number of initiatives to promote the study of and careers in science, technology, engineering and mathematics (STEM), particularly among females. Measures include:
Including a greater focus on STEM in teacher training.
Developing a central web portal with information on STEM careers and specific policy initiatives.
Promoting the sharing of STEM teaching materials and practices through Klascement, an open educational resources sharing website.
Developing STEM-didactics for primary and secondary education.
Arranging for STEM coaches from the business world and experienced STEM teachers to visit, work with and inspire school students.
A STEM-monitor evaluates progress of the measures outlined in the plan towards outlined targets.
EDUCATION POLICY OUTLOOK: BELGIUM © OECD 2017 17
SCHOOL IMPROVEMENT: FOSTERING BETTER TEACHING AND LEADERSHIP
Learning environments include higher compulsory annual instruction time in all Communities than the
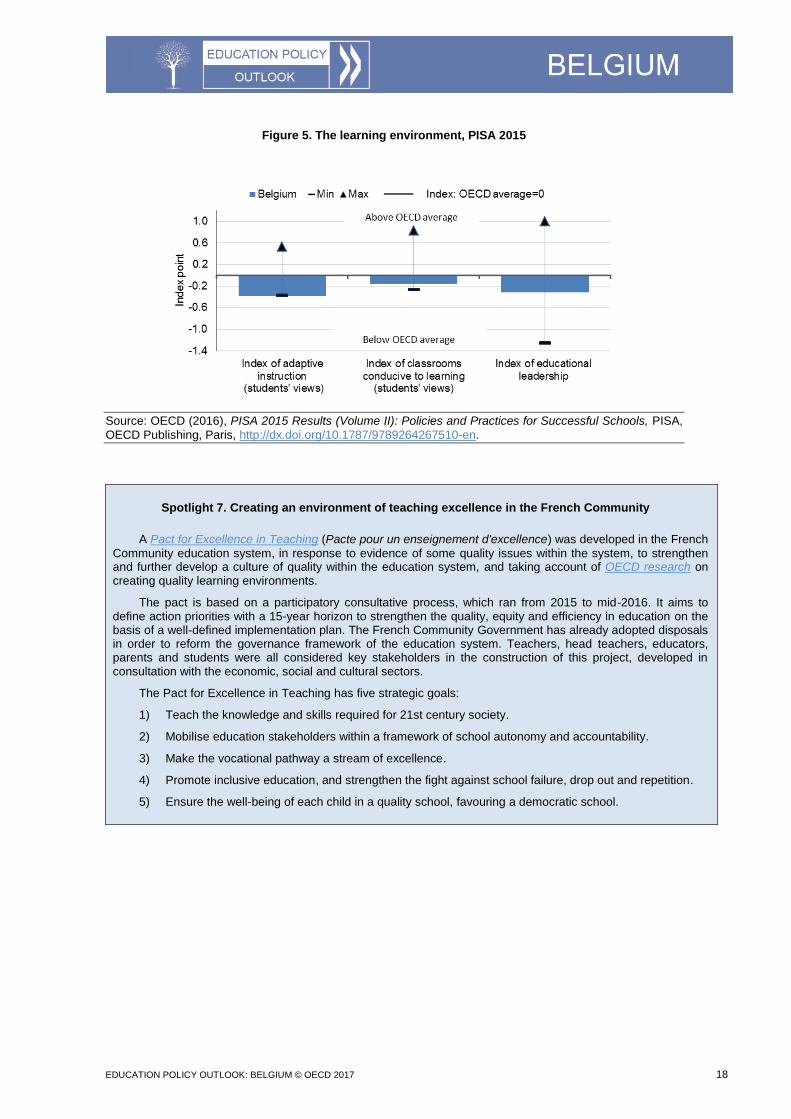
OECD average (799 hours for primary education and 915 hours for lower secondary education in 2016), with variations among communities. For example, in 2016 the Flemish Community students received 952 hours in lower secondary education, while French Community students received slightly more (971 hours). In the German-speaking Community, school students at all levels received 854 hours of instruction time annually. In PISA 2015, students and principals in Belgium had slightly less positive views of their learning environments compared to the OECD average (Figure 5).
School leaders in the Flemish Community and the French Community receive administrative and
instructional training as part of their in-service training. In the French Community, school leaders are required to ensure the supervision of the educational team and the adequacy of learning programmes, and are also often involved in teacher appraisals during the first two years of teaching.
Attracting and retaining new teachers is important to maintain the quality of the education system in coming
years. Teachers in Belgium are in general younger than their peers across the OECD: 23% of primary teachers were older than 50 in 2014 (OECD average: 30%). While this comparatively young teaching body suggests in general a good supply of new teachers to the system, some evidence also shows that there are still shortages in certain areas (for example, urban schools with many disadvantaged students can face difficulty recruiting experienced teachers). All Communities require teachers at levels below upper secondary education to complete a three-year bachelor programme. At upper secondary level, teachers in all three Communities must have an eligible master’s degree as well as a separate teaching diploma. The German-speaking Community trains pre-primary and primary teachers only. Teachers in the French Community must participate in continuous professional development for a minimum of six half days per year. Professional development is not mandatory for teachers in the Flemish Community system, but 88% of primary and lower secondary teachers reported in TALIS 2013 that they had recently participated in professional development activities.
In some domains, teachers’ working conditions in Belgium are better compared to other OECD countries
on average, with higher teachers’ salaries and some of the smallest numbers of students per teacher among OECD countries, particularly at secondary level. Teachers’ salaries in the Flemish and French Community systems are higher than in most other OECD countries, particularly at general upper secondary level, where teachers can expect to earn over 30% more than the OECD average after 15 years’ experience, reflecting the higher (master’s degree) qualifications for teachers required at this level. Furthermore, access to teaching is given only to staff holding the requisite qualifications, and the average ratio of students to staff in Belgium is 13 at primary level (compared to the OECD average of 15) and 10 at secondary level (with the OECD average of 13). However, despite positive conditions, some evidence suggests that the teaching profession in Belgium faces challenges to attract and retain suitable candidates in some cases. In PISA 2015, a higher proportion than average of school principals in Belgium still reported that the school’s instructional capacity is hindered at least to some extent by a shortage of qualified teaching staff (33.9% compared to 29.5%), or by inadequate or poorly qualified teachers (30.3% compared to 20.2%), with higher shares of principals reporting these issues in the French and German-speaking Communities. According to OECD evidence, although there appears to be no overall shortage of teachers in the Flemish Community, it is important for the school system to ensure an adequate rate of teacher renewal in light of the current demographic trends.
The challenge: Targeting cases of teacher shortage to ensure a steady supply of qualified teachers.
Recent policies and practices
A 2016 reform of titles and functions for teaching in the French Community seeks to better match the functions to be performed as part of a teaching job (fonctions), with the required teaching titles or qualifications needed to teach lessons (titres), and employment opportunities in schools. As part of this reform, each teaching function has a list of qualifying titles. Depending on the function, titles can be classified as “required” (titre requis, considered a priority), “sufficient” (titre suffisant), or “in shortage” (titre en penurie). Available teachers
can register through a portal (PRIMOWEB) which schools must consult when a position is available.
In the Flemish Community, an evaluation of initial teacher training in 2013 prompted reform of the system, with measures proposed in a 2016 concept note to enhance teacher education, and improve the profile of new entrants to the profession. Measures implemented to date include a test to evaluate the competencies of prospective teaching students, which was piloted during 2015/16 and further expanded in 2016/17.
In the German-speaking Community system, a decree in 2008 on the reassessment of the teaching profession provided for a graded increase in starting salaries. Overall salaries were increased by 10%; 3% in 2009, 3% in 2010, and 4% in 2011.
EDUCATION POLICY OUTLOOK: BELGIUM © OECD 2017 18
Figure 5. The learning environment, PISA 2015
Source: OECD (2016), PISA 2015 Results (Volume II): Policies and Practices for Successful Schools, PISA,
OECD Publishing, Paris, http://dx.doi.org/10.1787/9789264267510-en.
Spotlight 7. Creating an environment of teaching excellence in the French Community
A Pact for Excellence in Teaching (Pacte pour un enseignement d'excellence) was developed in the French
Community education system, in response to evidence of some quality issues within the system, to strengthen and further develop a culture of quality within the education system, and taking account of OECD research on creating quality learning environments.
The pact is based on a participatory consultative process, which ran from 2015 to mid-2016. It aims to define action priorities with a 15-year horizon to strengthen the quality, equity and efficiency in education on the basis of a well-defined implementation plan. The French Community Government has already adopted disposals in order to reform the governance framework of the education system. Teachers, head teachers, educators, parents and students were all considered key stakeholders in the construction of this project, developed in consultation with the economic, social and cultural sectors.
The Pact for Excellence in Teaching has five strategic goals:
1) Teach the knowledge and skills required for 21st century society.
2) Mobilise education stakeholders within a framework of school autonomy and accountability.
3) Make the vocational pathway a stream of excellence.
4) Promote inclusive education, and strengthen the fight against school failure, drop out and repetition.
5) Ensure the well-being of each child in a quality school, favouring a democratic school.
EDUCATION POLICY OUTLOOK: BELGIUM © OECD 2017 19
EVALUATION AND ASSESSMENT TO IMPROVE STUDENT OUTCOMES: HIGH AUTONOMY AND TRUST IN SCHOOLS
Defining effective evaluation and assessment strategies is important to improve student outcomes and
develop a better and more equitable school system. Under Belgium’s freedom of education principle, all schools are free to develop their own curricula (subject to the curriculum being compatible with achieving legislatively mandated educational objectives), while the regulation of specific evaluation and assessment practices are the responsibility of Community authorities.
System evaluations aim to provide evidence about the state of the education system. In the Flemish
Community, which is highly decentralised, system evaluation is carried out by the Department of Education and Training. It establishes quality procedures, and administrates wide-scale student tests, such as the National Assessment Programme (Peilingen) to assess the quality of the system. The Flemish Education Inspectorate also conducts thematic evaluation at system level, as reflected in the Onderwijsspiegel (Education Mirror) publications. System evaluation and quality improvement in the French Community is the responsibility of an Education System Steering Committee and the General Department of Inspection (Travail des services d'inspection), which prepares
an annual report for government on the state of the education system.
School evaluations take place in all three Belgian Communities, but school self-evaluation is only
mandated in the Flemish Community. In the Flemish Community, the Inspectorate performs external quality control on each school at least once every 10 years, in a 3-weekly structured inspection process (currently under reform). It comprises four elements: context, input, process and output – a CIPO framework. In the French Community, school inspections are carried out more regularly, with schools at primary and secondary level inspected every three years, and although low-performing schools are not specifically targeted, one-third of schools are inspected every year. In both systems, inspection reports are shared with school management and higher-level education authorities. In the Flemish Community, outcomes from school inspections are published and made available on the Internet and school self-evaluations are also made directly available to parents and students. External evaluations in the German-speaking Community system are carried out by a special department for evaluation housed in the higher education institution Autonome Hochschule in der DG.
Teacher appraisal is regulated independently by the different Communities. Participation in appraisal is only
mandatory in the Flemish Community, where periodic teacher appraisal is interview-based, implemented on the basis of agreed competencies and job descriptions, and teachers are generally appraised by the school leaders. The French Community system targets only temporary teachers, using a range of instruments for evaluation, including teacher portfolios, interviews and student outcomes, and performance is benchmarked against a set of state teaching standards. In the French Community, the General Service of Inspection can also be triggered by low teacher performance or a complaint. In both the Flemish and French Communities a positive conclusion has no effect regarding salaries or other advantages, but is considered potentially useful for further professional development. An unsatisfactory conclusion may lead to sanctions in the Flemish Community.
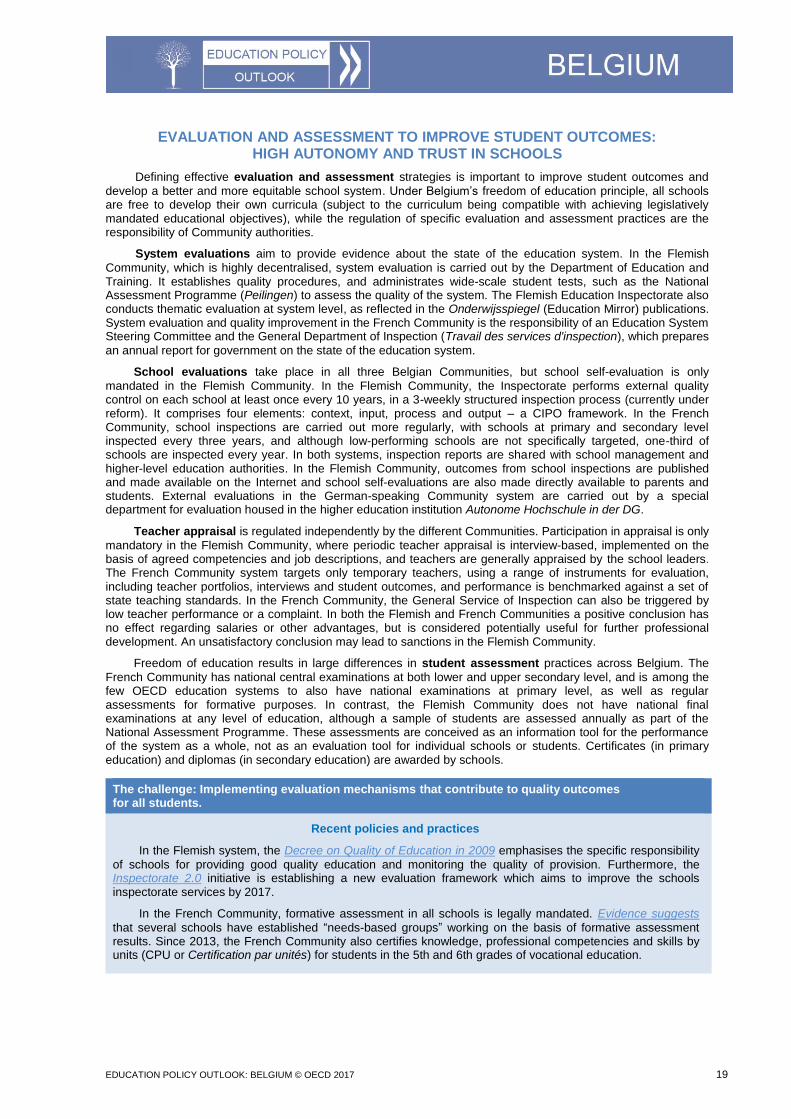
Freedom of education results in large differences in student assessment practices across Belgium. The
French Community has national central examinations at both lower and upper secondary level, and is among the few OECD education systems to also have national examinations at primary level, as well as regular assessments for formative purposes. In contrast, the Flemish Community does not have national final examinations at any level of education, although a sample of students are assessed annually as part of the National Assessment Programme. These assessments are conceived as an information tool for the performance of the system as a whole, not as an evaluation tool for individual schools or students. Certificates (in primary education) and diplomas (in secondary education) are awarded by schools.
The challenge: Implementing evaluation mechanisms that contribute to quality outcomes for all students.
Recent policies and practices
In the Flemish system, the Decree on Quality of Education in 2009 emphasises the specific responsibility
of schools for providing good quality education and monitoring the quality of provision. Furthermore, the Inspectorate 2.0 initiative is establishing a new evaluation framework which aims to improve the schools inspectorate services by 2017.
In the French Community, formative assessment in all schools is legally mandated. Evidence suggests
that several schools have established “needs-based groups” working on the basis of formative assessment results. Since 2013, the French Community also certifies knowledge, professional competencies and skills by units (CPU or Certification par unités) for students in the 5th and 6th grades of vocational education.
EDUCATION POLICY OUTLOOK: BELGIUM © OECD 2017 20
Figure 6. Percentage of students in schools where the principal reported the following use for standardised tests, PISA 2015
Notes: Fl: Flemish Community; Fr: French Community; Dg: German-speaking Community. Source: OECD (2016), PISA 2015 Results (Volume II): Policies and Practices for Successful Schools, PISA, OECD Publishing, Paris, http://dx.doi.org/10.1787/9789264267510-en.
Spotlight 8. Higher education quality assurance: Practices and reforms
In Belgium, each community has devolved responsibility for the evaluation of higher education systems, programmes and institutions, organised as follows:
In 2012, a parliamentary act by the Flemish Community Government first introduced higher education institutional reviews as a complement to the existing programme accreditation framework. In 2015, the Flemish Government introduced a series of measures to simplify and further strengthen higher education quality assurance, including a new framework for institutional reviews and new rules for programme accreditation. As part of the implementation of the Bologna process and following the European Standards and Guidelines for Quality Assurance in Higher Education, a new independent organisation for external quality assurance of institutions across the entire higher education system was established in 2013 – the Flemish Council of Universities and University Colleges Quality Assurance Unit (VLUHR QAU). Programme accreditation is carried out by the independent binational Dutch-Flemish Accreditation Organisation (NVAO), which was established following a treaty signed in 2003 between Flanders and the Netherlands.
In the French Community, quality assurance of higher education is carried out by the Agency for Quality Assurance in Higher Education (AEQES), an independent publicly funded agency established initially in 2002. Though AEQES is governed by representatives from each of the four higher education sectors, as well as student, labour market and trade union organisations, it is operationally independent of the higher education institutions, as well as the Ministry of Education. AEQES has the following functions:
Regularly evaluating courses organised by institutions.
Ensuring co-operation between all higher education areas to encourage the implementation of standard practices to improve quality.
Reporting on the quality of higher education to government and other actors.
Liaising with relevant national and international bodies on behalf of the French Community.
Formulating policy proposals to improve the quality of higher education.
EDUCATION POLICY OUTLOOK: BELGIUM © OECD 2017 21
GOVERNANCE: A HIGHLY FRAGMENTED EDUCATION SYSTEM
The Federal State’s powers with respect to education are limited to determining the age range of compulsory education, establishing minimum requirements for recognition of qualifications and setting retirement regulations for educational staff. The Belgian Constitution also requires all educational reforms and initiatives with financial implications to follow a lengthy legislative track, culminating finally in a Parliamentary Act (Decree).
In the Flemish Community, the Department for Education and Training performs policy co-ordination, and
three executive autonomous agencies are responsible for implementation, as well as the autonomous Education Inspectorate. The three agencies are AgODI, (Agency for Educational Services for elementary, secondary, part-time artistic education, student guidance centers), AHOVOKS (Agency for Higher Education, Adult Education, Qualifications and Study Allowances) and AGIOn, (Agency for Educational Infrastructure), which is responsible for
designing, planning, building and renovating school buildings for grant-aided public and private schools. The Flemish Community also has a system of student guidance centres (CLB) to provide multi-disciplinary, student-oriented advice and support to students, parents and schools.
In the French Community, the General Administration of Education (AGE) performs most functions related to
education. This administrative body consists of six directorates and general services, including sections responsible for compulsory education, education staffing, scientific research, school inspections, general policy steering, and co-ordination, design and social relations. The Walloon region authorities manage school transport, and also jointly manage the school buildings with the French Community authorities.
In the German-speaking Community, the Minister of Education is in charge of education and academic research and another department is responsible for extra-curricular training.
Freedom of education is a constitutional right in Belgium. Every natural or legal person can establish a
school, while students and their parents are guaranteed free choice of institution and programme. Schools, however, must meet certain requirements to be recognised and to be allowed to award recognised qualifications – and in case of a minimum number of students, receive public funding. Schools are free to set their own curricula (subject to the curriculum being compatible with achieving legislatively mandated core learning outcomes). They are also free to recruit the staff of their choice in accordance with the rights of educational staff in grant-aided schools. Schools generally are classified into categories (or “networks”) according to their source of funding and management structure. Three main categories of school exist: publicly funded schools under the direct authority of the Community, grant-aided schools which are publicly managed (for example by cities or municipalities), and grant-aided schools which are privately managed (for example, religious schools or schools with specific teaching methodologies). School boards are responsible for the management of one or more schools, and they may belong to an umbrella organisation, which provides support and represents them in discussions with the government.
At tertiary level, all institutions in all Communities have a high level of autonomy. There is, however,
legislation in place for standards on qualifications structure, procedures for recognising programmes, participative governance, funding and financial accountability, quality assurance and accreditation.
The challenge: Ensuring overall quality and consistency in a highly decentralised system.
Recent policies and practices
In the Flemish Community, a 2014 parliamentary act aims to strengthen stakeholder participation in school governance by improving communication and information provision from schools, and to specifically encourage the participation of socially vulnerable groups in the development of school policy.
The French Community implemented the 2013 Decree for Higher Education (Decret Paysage) to provide a more coherent vision of the higher education system, by defining in law the higher education system and organisation of instruction within the system. The decree also created the Academy for Research and Higher Education (ARES) to serve as a platform for co-ordination and dialogue among institutions in the higher education system.
A new online interactive application called Dataloep was launched in 2016 by the Flemish Community,
allowing access to a range of statistical data on schools and higher education institutions, and enabling schools to make comparisons in certain areas between their own school and other schools across Flanders.
In the French Community, the Pact for Excellence in Teaching (Pacte pour un enseignement d'excellence) provides for strengthening governance at the system level and at the school level (see Spotlight 7).
EDUCATION POLICY OUTLOOK: BELGIUM © OECD 2017 22
Spotlight 9. Improving strategic planning in schools in the French Community
To improve steering of individual schools and redefine school projects, Article 70 of the 2016 Decree
covering various education provisions (Décret portant diverses dispositions en matière d'enseignement) specifies
that all schools should have a six-year strategic management plan in place by 2018 at the latest, with a strategy outlined for each of the following points:
Achieving success of all students, master learning and achieving expected goals.
Improving team work among teachers in schools and measures to welcome and support new teachers.
Providing continuous professional development activities to staff.
Fighting against school failure, school dropout and grade repetition.
Integrating digital tools into learning and governance.
Integrating students and accommodating additional needs.
Strengthening partnerships and collaboration with parents.
Providing greater access to culture, sports and reading for students.
Developing partnerships with businesses.
Preventing discrimination, violence and harassment.
Facilitating youth and school mediation.
The plan should be drawn up by the school head, in collaboration with the educational and teaching staff of the institution, taking into account the specific context of the institution and resources available. The completed plan can be presented to the General Inspectorate of the Community, which will check for conformity of the plan to the points outlined in the decree.
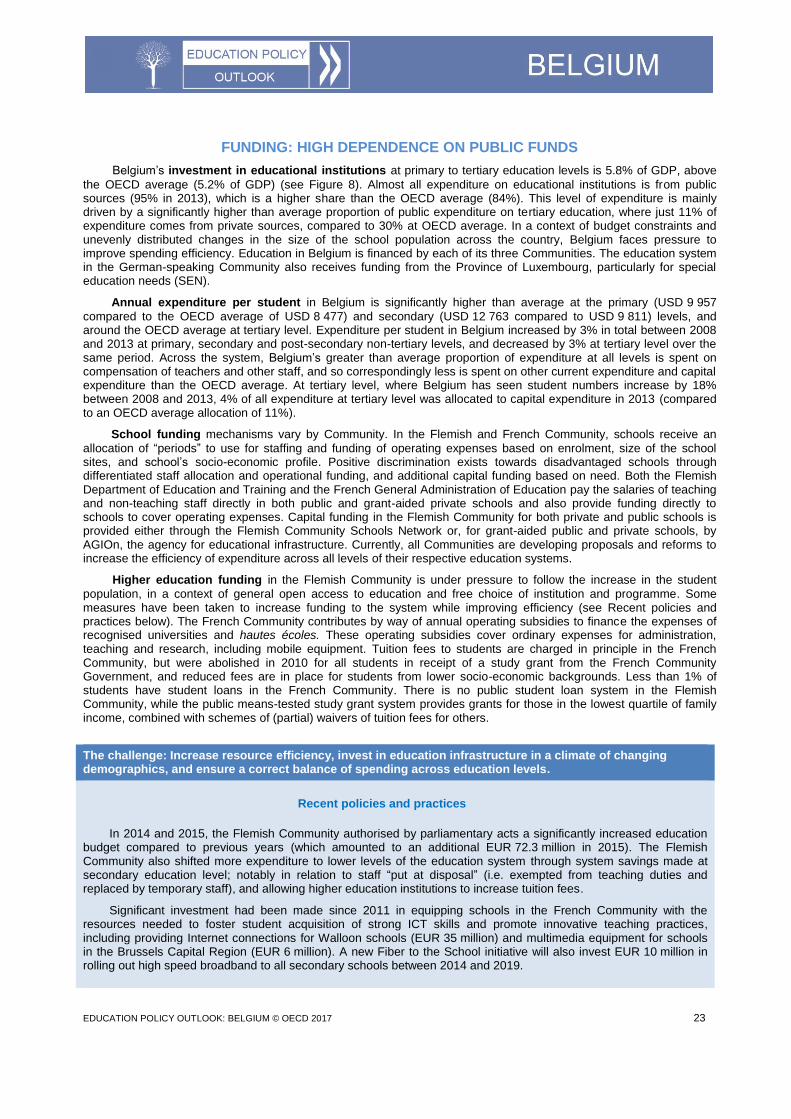
EDUCATION POLICY OUTLOOK: BELGIUM © OECD 2017 23
FUNDING: HIGH DEPENDENCE ON PUBLIC FUNDS
Belgium’s investment in educational institutions at primary to tertiary education levels is 5.8% of GDP, above
the OECD average (5.2% of GDP) (see Figure 8). Almost all expenditure on educational institutions is from public sources (95% in 2013), which is a higher share than the OECD average (84%). This level of expenditure is mainly driven by a significantly higher than average proportion of public expenditure on tertiary education, where just 11% of expenditure comes from private sources, compared to 30% at OECD average. In a context of budget constraints and unevenly distributed changes in the size of the school population across the country, Belgium faces pressure to improve spending efficiency. Education in Belgium is financed by each of its three Communities. The education system in the German-speaking Community also receives funding from the Province of Luxembourg, particularly for special education needs (SEN).
Annual expenditure per student in Belgium is significantly higher than average at the primary (USD 9 957
compared to the OECD average of USD 8 477) and secondary (USD 12 763 compared to USD 9 811) levels, and around the OECD average at tertiary level. Expenditure per student in Belgium increased by 3% in total between 2008 and 2013 at primary, secondary and post-secondary non-tertiary levels, and decreased by 3% at tertiary level over the same period. Across the system, Belgium’s greater than average proportion of expenditure at all levels is spent on compensation of teachers and other staff, and so correspondingly less is spent on other current expenditure and capital expenditure than the OECD average. At tertiary level, where Belgium has seen student numbers increase by 18% between 2008 and 2013, 4% of all expenditure at tertiary level was allocated to capital expenditure in 2013 (compared to an OECD average allocation of 11%).
School funding mechanisms vary by Community. In the Flemish and French Community, schools receive an
allocation of “periods” to use for staffing and funding of operating expenses based on enrolment, size of the school sites, and school’s socio-economic profile. Positive discrimination exists towards disadvantaged schools through differentiated staff allocation and operational funding, and additional capital funding based on need. Both the Flemish Department of Education and Training and the French General Administration of Education pay the salaries of teaching and non-teaching staff directly in both public and grant-aided private schools and also provide funding directly to schools to cover operating expenses. Capital funding in the Flemish Community for both private and public schools is provided either through the Flemish Community Schools Network or, for grant-aided public and private schools, by AGIOn, the agency for educational infrastructure. Currently, all Communities are developing proposals and reforms to increase the efficiency of expenditure across all levels of their respective education systems.
Higher education funding in the Flemish Community is under pressure to follow the increase in the student
population, in a context of general open access to education and free choice of institution and programme. Some measures have been taken to increase funding to the system while improving efficiency (see Recent policies and practices below). The French Community contributes by way of annual operating subsidies to finance the expenses of recognised universities and hautes écoles. These operating subsidies cover ordinary expenses for administration, teaching and research, including mobile equipment. Tuition fees to students are charged in principle in the French Community, but were abolished in 2010 for all students in receipt of a study grant from the French Community Government, and reduced fees are in place for students from lower socio-economic backgrounds. Less than 1% of students have student loans in the French Community. There is no public student loan system in the Flemish Community, while the public means-tested study grant system provides grants for those in the lowest quartile of family income, combined with schemes of (partial) waivers of tuition fees for others.
The challenge: Increase resource efficiency, invest in education infrastructure in a climate of changing demographics, and ensure a correct balance of spending across education levels.
Recent policies and practices
In 2014 and 2015, the Flemish Community authorised by parliamentary acts a significantly increased education budget compared to previous years (which amounted to an additional EUR 72.3 million in 2015). The Flemish Community also shifted more expenditure to lower levels of the education system through system savings made at secondary education level; notably in relation to staff “put at disposal” (i.e. exempted from teaching duties and replaced by temporary staff), and allowing higher education institutions to increase tuition fees.
Significant investment had been made since 2011 in equipping schools in the French Community with the resources needed to foster student acquisition of strong ICT skills and promote innovative teaching practices, including providing Internet connections for Walloon schools (EUR 35 million) and multimedia equipment for schools in the Brussels Capital Region (EUR 6 million). A new Fiber to the School initiative will also invest EUR 10 million in rolling out high speed broadband to all secondary schools between 2014 and 2019.
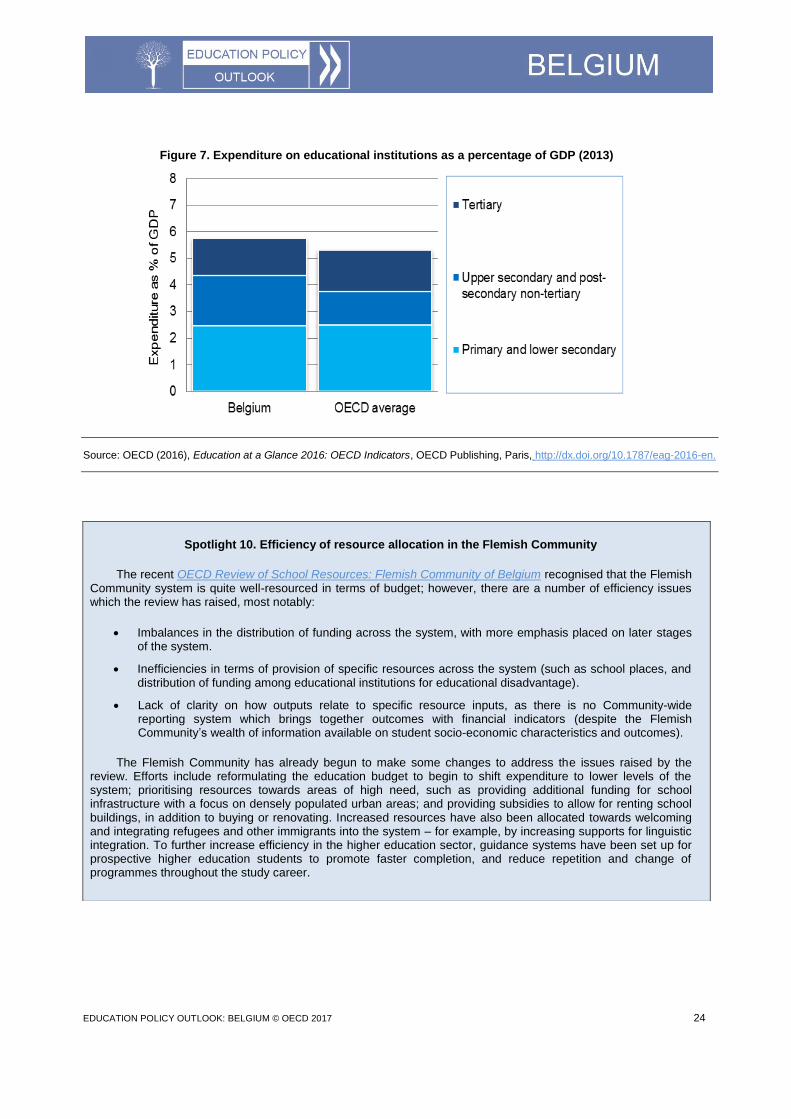
EDUCATION POLICY OUTLOOK: BELGIUM © OECD 2017 24
Figure 7. Expenditure on educational institutions as a percentage of GDP (2013)
Source: OECD (2016), Education at a Glance 2016: OECD Indicators, OECD Publishing, Paris, http://dx.doi.org/10.1787/eag-2016-en.
Spotlight 10. Efficiency of resource allocation in the Flemish Community
The recent OECD Review of School Resources: Flemish Community of Belgium recognised that the Flemish Community system is quite well-resourced in terms of budget; however, there are a number of efficiency issues which the review has raised, most notably:
Imbalances in the distribution of funding across the system, with more emphasis placed on later stages of the system.
Inefficiencies in terms of provision of specific resources across the system (such as school places, and distribution of funding among educational institutions for educational disadvantage).
Lack of clarity on how outputs relate to specific resource inputs, as there is no Community-wide reporting system which brings together outcomes with financial indicators (despite the Flemish Community’s wealth of information available on student socio-economic characteristics and outcomes).
The Flemish Community has already begun to make some changes to address the issues raised by the review. Efforts include reformulating the education budget to begin to shift expenditure to lower levels of the system; prioritising resources towards areas of high need, such as providing additional funding for school infrastructure with a focus on densely populated urban areas; and providing subsidies to allow for renting school buildings, in addition to buying or renovating. Increased resources have also been allocated towards welcoming and integrating refugees and other immigrants into the system – for example, by increasing supports for linguistic integration. To further increase efficiency in the higher education sector, guidance systems have been set up for prospective higher education students to promote faster completion, and reduce repetition and change of programmes throughout the study career.
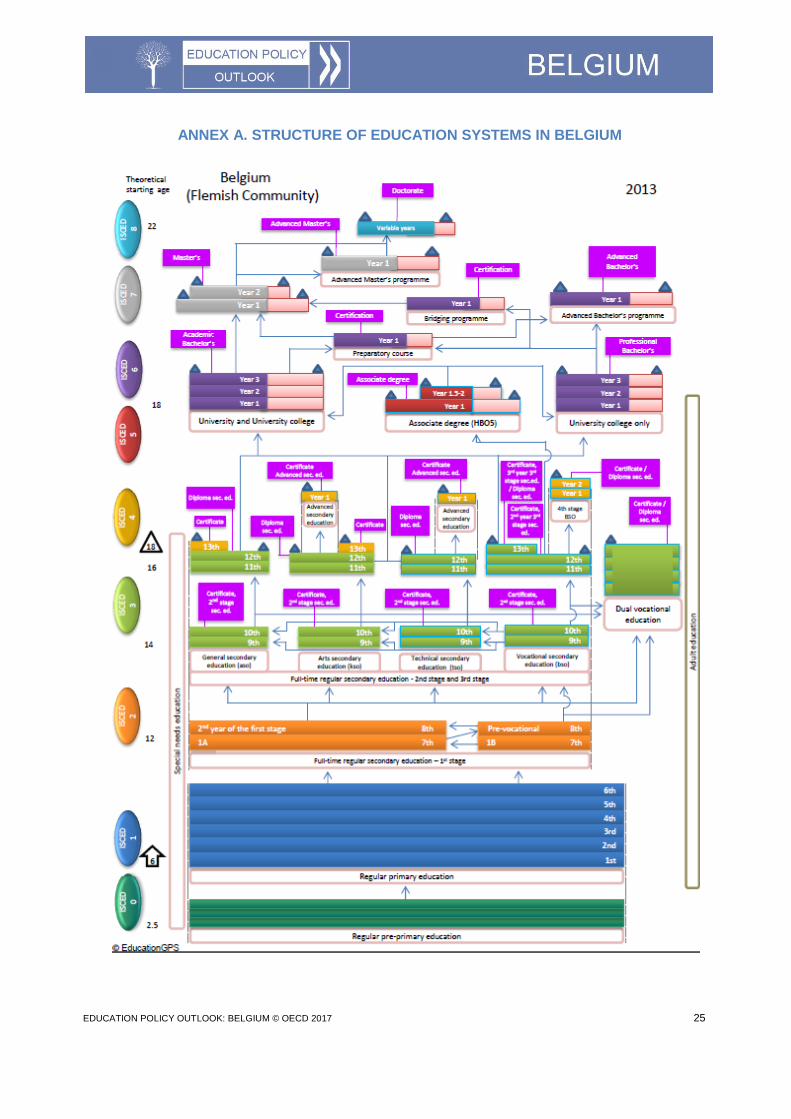
EDUCATION POLICY OUTLOOK: BELGIUM © OECD 2017 25
ANNEX A. STRUCTURE OF EDUCATION SYSTEMS IN BELGIUM
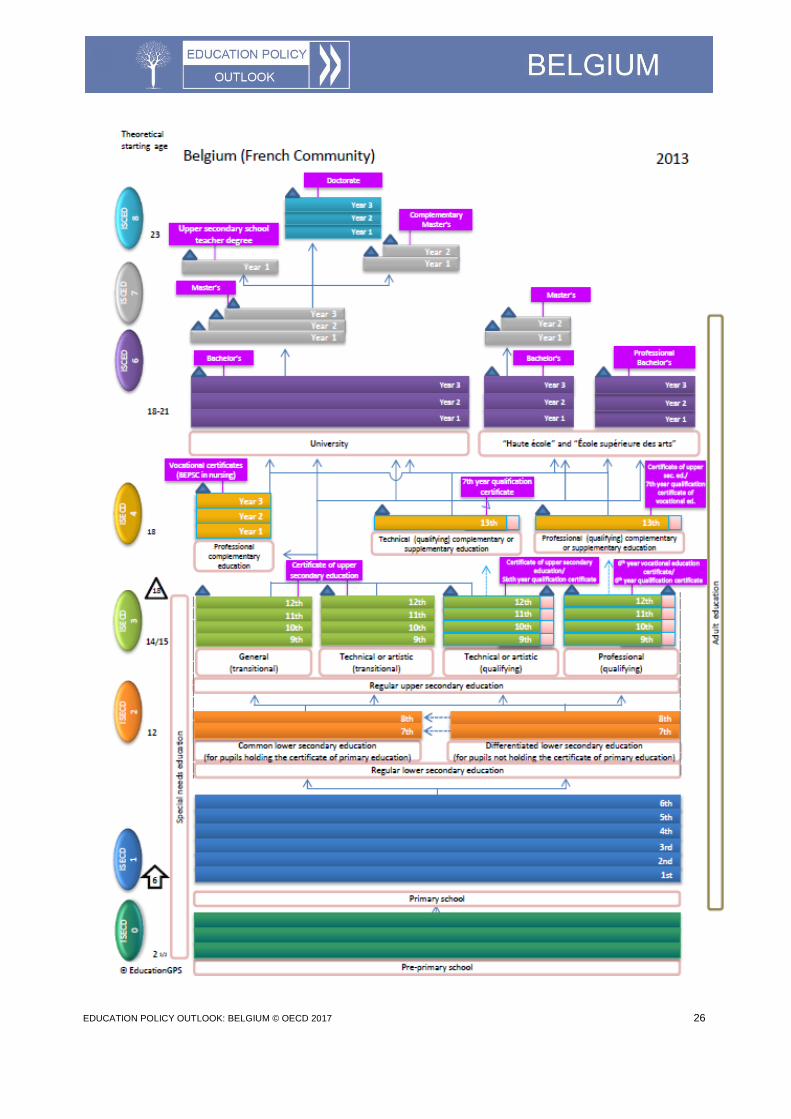
EDUCATION POLICY OUTLOOK: BELGIUM © OECD 2017 26
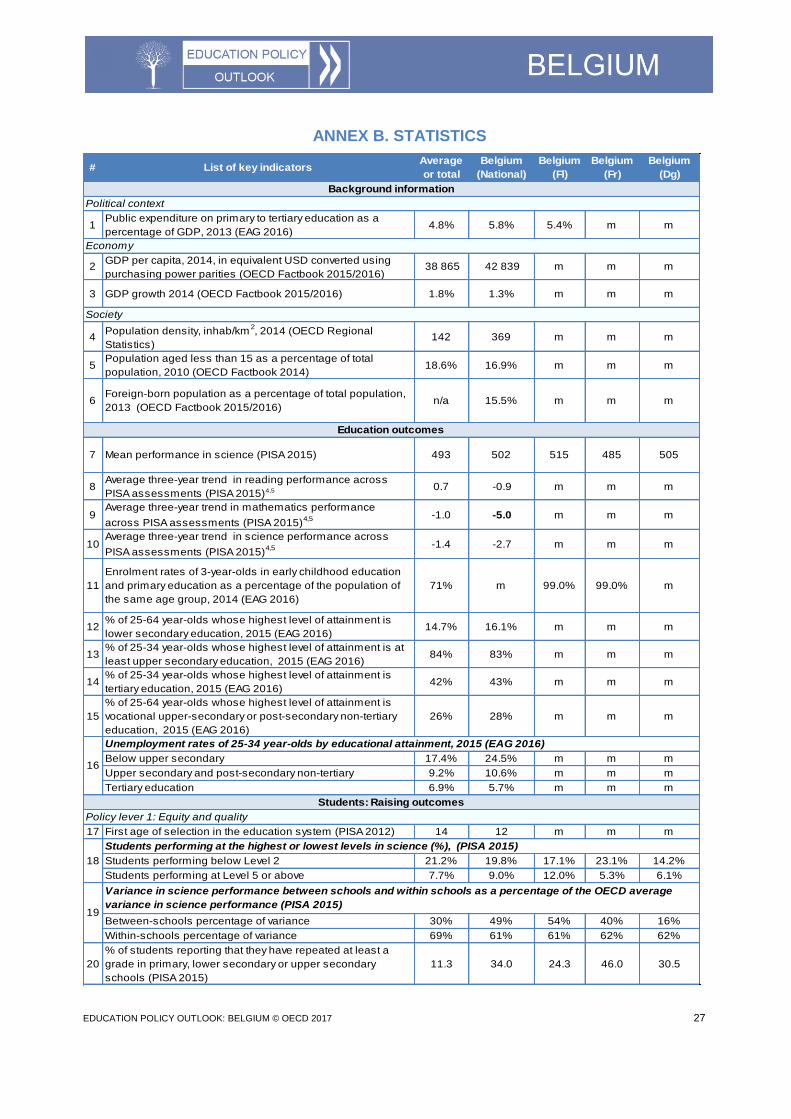
EDUCATION POLICY OUTLOOK: BELGIUM © OECD 2017 27
ANNEX B. STATISTICS
# List of key indicatorsAverage
or total
Belgium
(National)
Belgium
(Fl)
Belgium
(Fr)
Belgium
(Dg)
1Public expenditure on primary to tertiary education as a
percentage of GDP, 2013 (EAG 2016)4.8% 5.8% 5.4% m m
2GDP per capita, 2014, in equivalent USD converted using
purchasing power parities (OECD Factbook 2015/2016) 38 865 42 839 m m m
3 GDP growth 2014 (OECD Factbook 2015/2016) 1.8% 1.3% m m m
4Population density, inhab/km
2, 2014 (OECD Regional
Statistics)142 369 m m m
5Population aged less than 15 as a percentage of total
population, 2010 (OECD Factbook 2014)18.6% 16.9% m m m
6Foreign-born population as a percentage of total population,
2013 (OECD Factbook 2015/2016)n/a 15.5% m m m
7 Mean performance in science (PISA 2015) 493 502 515 485 505
8Average three-year trend in reading performance across
PISA assessments (PISA 2015)4,5 0.7 -0.9 m m m
9Average three-year trend in mathematics performance
across PISA assessments (PISA 2015)4,5 -1.0 -5.0 m m m
10Average three-year trend in science performance across
PISA assessments (PISA 2015)4,5 -1.4 -2.7 m m m
11
Enrolment rates of 3-year-olds in early childhood education
and primary education as a percentage of the population of
the same age group, 2014 (EAG 2016)
71% m 99.0% 99.0% m
12% of 25-64 year-olds whose highest level of attainment is
lower secondary education, 2015 (EAG 2016)14.7% 16.1% m m m
13% of 25-34 year-olds whose highest level of attainment is at
least upper secondary education, 2015 (EAG 2016)84% 83% m m m
14% of 25-34 year-olds whose highest level of attainment is
tertiary education, 2015 (EAG 2016)42% 43% m m m
15
% of 25-64 year-olds whose highest level of attainment is
vocational upper-secondary or post-secondary non-tertiary
education, 2015 (EAG 2016)
26% 28% m m m
Below upper secondary 17.4% 24.5% m m m
Upper secondary and post-secondary non-tertiary 9.2% 10.6% m m m
Tertiary education 6.9% 5.7% m m m
17 First age of selection in the education system (PISA 2012) 14 12 m m m
Students performing below Level 2 21.2% 19.8% 17.1% 23.1% 14.2%
Students performing at Level 5 or above 7.7% 9.0% 12.0% 5.3% 6.1%
Between-schools percentage of variance 30% 49% 54% 40% 16%
Within-schools percentage of variance 69% 61% 61% 62% 62%
20
% of students reporting that they have repeated at least a
grade in primary, lower secondary or upper secondary
schools (PISA 2015)
11.3 34.0 24.3 46.0 30.5
Background information
Political context
Economy
Society
Students performing at the highest or lowest levels in science (%), (PISA 2015)
19
Variance in science performance between schools and within schools as a percentage of the OECD average
variance in science performance (PISA 2015)
18
Education outcomes
16
Unemployment rates of 25-34 year-olds by educational attainment, 2015 (EAG 2016)
Students: Raising outcomes
Policy lever 1: Equity and quality
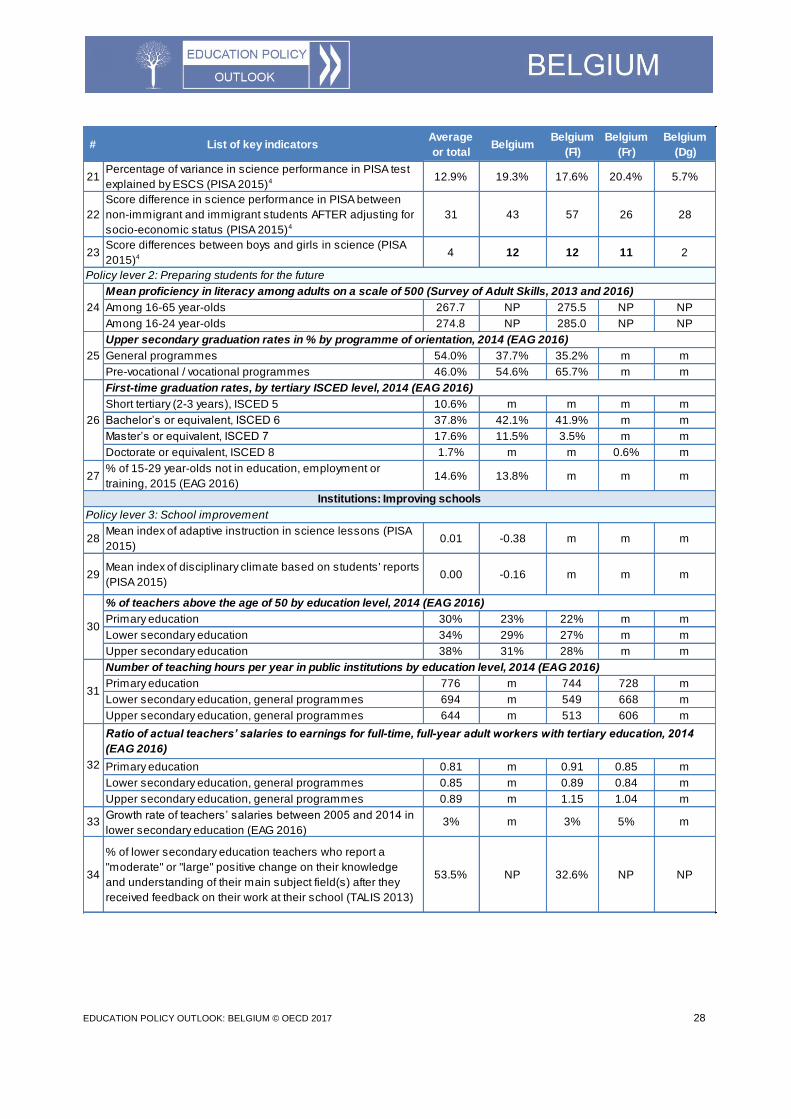
EDUCATION POLICY OUTLOOK: BELGIUM © OECD 2017 28
# List of key indicatorsAverage
or totalBelgium
Belgium
(Fl)
Belgium
(Fr)
Belgium
(Dg)
21Percentage of variance in science performance in PISA test
explained by ESCS (PISA 2015)4 12.9% 19.3% 17.6% 20.4% 5.7%
22
Score difference in science performance in PISA between
non-immigrant and immigrant students AFTER adjusting for
socio-economic status (PISA 2015)4
31 43 57 26 28
23Score differences between boys and girls in science (PISA
2015)4 4 12 12 11 2
Among 16-65 year-olds 267.7 NP 275.5 NP NP
Among 16-24 year-olds 274.8 NP 285.0 NP NP
General programmes 54.0% 37.7% 35.2% m m
Pre-vocational / vocational programmes 46.0% 54.6% 65.7% m m
Short tertiary (2-3 years), ISCED 5 10.6% m m m m
Bachelor’s or equivalent, ISCED 6 37.8% 42.1% 41.9% m m
Master’s or equivalent, ISCED 7 17.6% 11.5% 3.5% m m
Doctorate or equivalent, ISCED 8 1.7% m m 0.6% m
27% of 15-29 year-olds not in education, employment or
training, 2015 (EAG 2016)14.6% 13.8% m m m
28Mean index of adaptive instruction in science lessons (PISA
2015)0.01 -0.38 m m m
29Mean index of disciplinary climate based on students' reports
(PISA 2015)0.00 -0.16 m m m
Primary education 30% 23% 22% m m
Lower secondary education 34% 29% 27% m m
Upper secondary education 38% 31% 28% m m
Primary education 776 m 744 728 m
Lower secondary education, general programmes 694 m 549 668 m
Upper secondary education, general programmes 644 m 513 606 m
Primary education 0.81 m 0.91 0.85 m
Lower secondary education, general programmes 0.85 m 0.89 0.84 m
Upper secondary education, general programmes 0.89 m 1.15 1.04 m
33Growth rate of teachers’ salaries between 2005 and 2014 in
lower secondary education (EAG 2016)3% m 3% 5% m
34
% of lower secondary education teachers who report a
"moderate" or "large" positive change on their knowledge
and understanding of their main subject field(s) after they
received feedback on their work at their school (TALIS 2013)
53.5% NP 32.6% NP NP
% of teachers above the age of 50 by education level, 2014 (EAG 2016)
31
Number of teaching hours per year in public institutions by education level, 2014 (EAG 2016)
32
Ratio of actual teachers’ salaries to earnings for full-time, full-year adult workers with tertiary education, 2014
(EAG 2016)
30
26
First-time graduation rates, by tertiary ISCED level, 2014 (EAG 2016)
Institutions: Improving schools
Policy lever 3: School improvement
Policy lever 2: Preparing students for the future
24
Mean proficiency in literacy among adults on a scale of 500 (Survey of Adult Skills, 2013 and 2016)
25
Upper secondary graduation rates in % by programme of orientation, 2014 (EAG 2016)
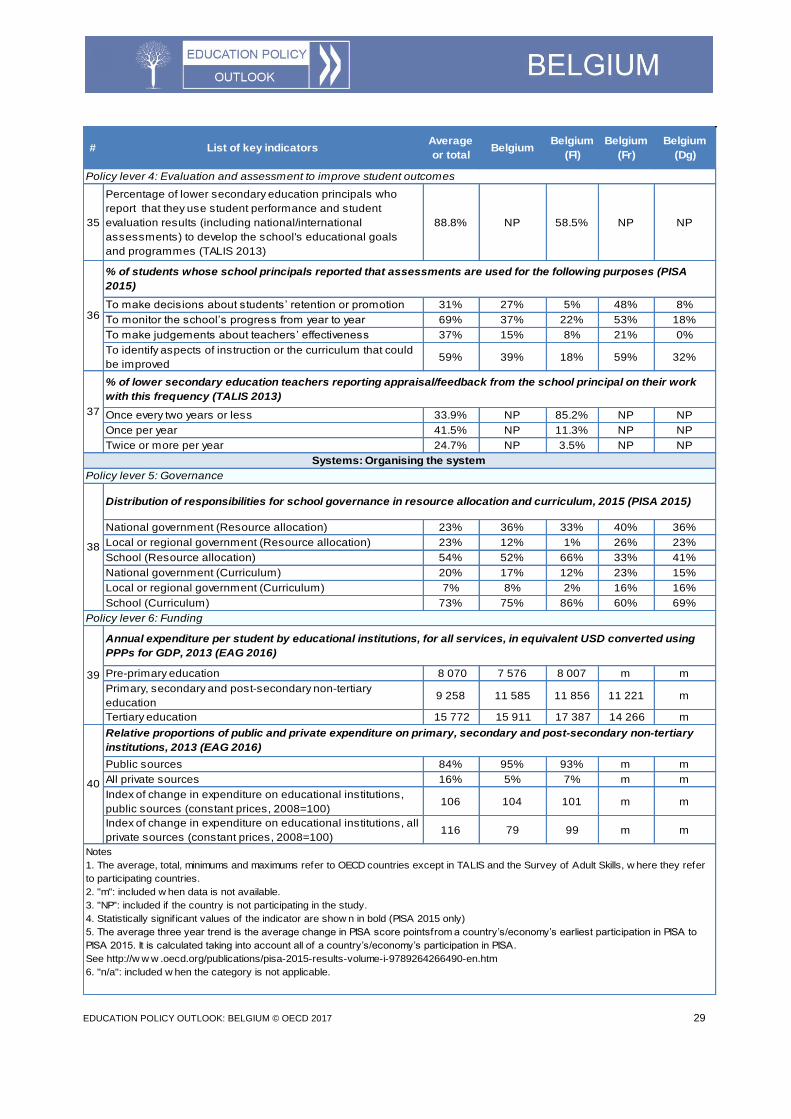
EDUCATION POLICY OUTLOOK: BELGIUM © OECD 2017 29
# List of key indicatorsAverage
or totalBelgium
Belgium
(Fl)
Belgium
(Fr)
Belgium
(Dg)
35
Percentage of lower secondary education principals who
report that they use student performance and student
evaluation results (including national/international
assessments) to develop the school's educational goals
and programmes (TALIS 2013)
88.8% NP 58.5% NP NP
To make decisions about students’ retention or promotion 31% 27% 5% 48% 8%
To monitor the school’s progress from year to year 69% 37% 22% 53% 18%
To make judgements about teachers’ effectiveness 37% 15% 8% 21% 0%
To identify aspects of instruction or the curriculum that could
be improved59% 39% 18% 59% 32%
Once every two years or less 33.9% NP 85.2% NP NP
Once per year 41.5% NP 11.3% NP NP
Twice or more per year 24.7% NP 3.5% NP NP
National government (Resource allocation) 23% 36% 33% 40% 36%
Local or regional government (Resource allocation) 23% 12% 1% 26% 23%
School (Resource allocation) 54% 52% 66% 33% 41%
National government (Curriculum) 20% 17% 12% 23% 15%
Local or regional government (Curriculum) 7% 8% 2% 16% 16%
School (Curriculum) 73% 75% 86% 60% 69%
Pre-primary education 8 070 7 576 8 007 m m
Primary, secondary and post-secondary non-tertiary
education 9 258 11 585 11 856 11 221 m
Tertiary education 15 772 15 911 17 387 14 266 m
Public sources 84% 95% 93% m m
All private sources 16% 5% 7% m m
Index of change in expenditure on educational institutions,
public sources (constant prices, 2008=100) 106 104 101 m m
Index of change in expenditure on educational institutions, all
private sources (constant prices, 2008=100)116 79 99 m m
40
Relative proportions of public and private expenditure on primary, secondary and post-secondary non-tertiary
institutions, 2013 (EAG 2016)
38
Policy lever 4: Evaluation and assessment to improve student outcomes
36
% of students whose school principals reported that assessments are used for the following purposes (PISA
2015)
Notes
1. The average, total, minimums and maximums refer to OECD countries except in TALIS and the Survey of Adult Skills, w here they refer
to participating countries.
2. "m": included w hen data is not available.
3. "NP": included if the country is not participating in the study.
4. Statistically signif icant values of the indicator are show n in bold (PISA 2015 only)
5. The average three year trend is the average change in PISA score pointsfrom a country’s/economy’s earliest participation in PISA to
PISA 2015. It is calculated taking into account all of a country’s/economy’s participation in PISA.
See http://w w w .oecd.org/publications/pisa-2015-results-volume-i-9789264266490-en.htm
6. "n/a": included w hen the category is not applicable.
37
% of lower secondary education teachers reporting appraisal/feedback from the school principal on their work
with this frequency (TALIS 2013)
Systems: Organising the system
Policy lever 5: Governance
Distribution of responsibilities for school governance in resource allocation and curriculum, 2015 (PISA 2015)
Policy lever 6: Funding
Annual expenditure per student by educational institutions, for all services, in equivalent USD converted using
PPPs for GDP, 2013 (EAG 2016)
39
EDUCATION POLICY OUTLOOK: BELGIUM © OECD 2017 30
REFERENCES AND FURTHER READING
Belgian Federal Government (n.d.), www.federal-government.be/en (accessed 13 June 2017).
Belgian Government (2015), “National Reform Programme 2015”, Belgian Government, Brussels, http://ec.europa.eu/europe2020/pdf/csr2015/nrp2015_belgium_en.pdf.
Cedefop (2014), Tackling Early Leaving from Education and Training in Europe: Strategies, Policies and Measures, Eurydice and Cedefop Report, Publications Office of the European Union, Luxembourg, http://eacea.ec.europa.eu/education/eurydice/documents/thematic_reports/175en.pdf.
Communauté française de Belgique (2016), Examen de l’OCDE des politiques pour un usage plus efficace des ressources scolaires: Rapport pays, www.oecd.org/edu/school/School-Resources-Country-BackgroundReview-French-Community-Belgium.pdf.
Council of Europe (2015), 10e rapport sur la mise en œuvre de la Charte sociale européenne soumis par le Gouvernement de La Belgique, Council of Europe, Strasbourg, https://rm.coe.int/CoERMPublicCommon SearchServices/DisplayDCTMContent?documentId=090000168059dde0.
Council of the European Union (2016), “Council Recommendation of 12 July 2016 on the 2016 National Reform Programme of Belgium and delivering a Council opinion on the 2016 Stability Programme of Belgium”, EU, Brussels, http://eur-lex.europa.eu/legal-content/EN/ALL/?uri=uriserv:OJ.C_.2016.299.01.0036.01.ENG.
European Commission (2017), European Semester Country Report 2017-Belgium, Publications Office of the
European Commission, Luxembourg, https://ec.europa.eu/info/publications/2017-european-semester-country-reports_en.
European Commission (n.d.), Europe 2020, https://ec.europa.eu/info/strategy/european-semester/framework/europe-2020-strategy_en (accessed 14 June 2017).
European Commission (n.d.), Eurostat, http://ec.europa.eu/eurostat (accessed 13 June 2017).
European Commission/EACEA/Eurydice (2014), Teachers’ and School Heads’ Salaries and Allowances in Europe 2013/14, Publications Office of the European Union, Luxembourg, http://eacea.ec.europa.eu/education/eurydice/documents/facts_and_figures/salaries.pdf.
European Commission/EACEA/Eurydice (2013), Key Data on Teachers and School Leaders in Europe: 2013 Edition: Eurydice Report, Publications Office of the European Union, Luxembourg, Publications Office of
the European Union, Luxembourg, http://eacea.ec.europa.eu/education/eurydice/documents/key_data_series/151EN.pdf.
European Higher Education Association (2015), National Report of Belgium 2015, EHEA, http://media.ehea.info/file/Belgium/40/8/National_Report_Belgium_Flemish_2015_566408.pdf.
European Policy Network on School Leadership (n.d.), Flemish Ministry of Education and Training, www.schoolleadership.eu/portal/partner/flemish-ministry-education-and-training (accessed 13 June 2017).
Department of Education and Training (2008), Education in Flanders: A Broad View of the Flemish Educational Landscape, Agency for Educational Communication, Brussels, www.eui.eu/Documents/MWP/Academic Careers/Countries/Belgium/BelgiumFlemishHigherEducation.pdf.
Federation Wallonia-Brussels (n.d.), Réforme de titres et fonctions (Primoweb), www.enseignement.be/index. php?page=27705 (accessed 14 June 2017).
Federation Wallonia-Brussels (n.d.), Système éducatif, www.enseignement.be/index.php?page=0&navi=2 (accessed 13 June 2017).
Federation Wallonia-Brussels (2011), Rapport de base pour la Communauté française de Belgique: Cadres d’évaluation en vue d’améliorer les résultats scolaires : Étude thématique de l’OCDE, Federation Wallonia-Brussels, Brussels, www.oecd.org/fr/edu/scolaire/49048280.pdf.
Flemish Ministry of Education and Training (2015), OECD Review of Policies to Improve the Effectiveness of Resource Use in Schools: Country Background Report of Belgium/Flemish Community, Flemish Ministry of Education and Training, Brussels, www.oecd.org/edu/Country%20Background%20Report_Belgium_ Flemish%20Community_FINAL%20with%20stat_for%20OECD%20website_REV%20DN.pdf.
Flemish Ministry of Education and Training (2015), Flemish Education in Figures 2014-2015, Department of Education and Training, Brussels, www.vlaanderen.be/nl/publicaties/detail/flemish-education-in-figures-2014-2015.
Flemish Ministry of Education and Training (2010), OECD Review on Evaluation and Assessment Frameworks for Improving School Outcomes: Country Background Report for the Flemish Community of Belgium, Department of Education and Training, Brussels, www.oecd.org/edu/school/46974684.pdf.
Høj, J. (2007), ”Improving incentives in tertiary education in Belgium”, OECD Economics Department Working Papers, No. 587, OECD Publishing, Paris, http://dx.doi.org/10.1787/034153337280.
EDUCATION POLICY OUTLOOK: BELGIUM © OECD 2017 31
Lessard, C., P. Santiago, J. Hansen and K.M. Kuczera (2004), “Attracting, Developing and Retaining Effective Teachers”, Country Note: The French Community of Belgium, OECD, Paris, www.oecd.org/belgium/32025507.pdf.
M-Decreet (2015), What is the M-Decree? www.m-decreet.be (accessed 14 June 2017).
Musset, P. (2013), “OECD Reviews on Vocational Education and Training: A Skills Beyond School Commentary on Flanders”, OECD, www.oecd.org/edu/skills-beyond-school/ASkillsBeyondSchoolCommentaryOnFlanders.pdf.
NCES (National Center for Education Statistics) (2016), Education at a Glance 2016 Subnational Supplement, NCES, Washington D.C. https://nces.ed.gov/surveys/annualreports/oecd/index.asp
Nusche, D., G. Miron, P. Santiago and R. Teese (2015), OECD Reviews of School Resources: Flemish Community of Belgium 2015, OECD Publishing, http://dx.doi.org/10.1787/9789264247598-en.
Shewbridge, C., M. Hulshof, D. Nusche and L. Stoll (2011), OECD Reviews of Evaluation and Assessment in Education: School Evaluation in the Flemish Community of Belgium 2011, OECD Reviews of Evaluation and Assessment in Education, OECD Publishing, Paris, http://dx.doi.org/10.1787/9789264116726-en.
OECD (n.d.), Education GPS, http://gpseducation.oecd.org/ (accessed 13 June 2017).
OECD (2016), PISA 2015 Results (Volume I): Excellence and Equity in Education, PISA, OECD Publishing, Paris, http://dx.doi.org/10.1787/9789264266490-en.
OECD (2016), Skills Matter: Further Results from the Survey of Adult Skills, OECD Skills Studies, OECD Publishing, Paris, http://dx.doi.org/10.1787/9789264258051-en.
OECD (2016), Education at a Glance 2016: OECD Indicators, OECD Publishing, Paris, http://dx.doi.org/10.1787/eag-2016-en.
OECD (2016), PISA 2015 Results (Volume II): Policies and Practices for Successful Schools, PISA, OECD Publishing, Paris, http://dx.doi.org/10.1787/9789264267510-en.
OECD (2015), Education Policy Outlook 2015: Making Reforms Happen, OECD Publishing, Paris, http://dx.doi.org/10.1787/9789264225442-en.
OECD (2015), OECD Economic Surveys: Belgium 2015, OECD Publishing, Paris, http://dx.doi.org/10.1787/ecosurveys-bel-2015-en.
OECD (2013), OECD Skills Outlook 2013: First Results from the Survey of Adult Skills, OECD Publishing, Paris, http://dx.doi.org/10.1787/9789264204256-en.
OECD (2013), Synergies for Better Learning: An International Perspective on Evaluation and Assessment, OECD
Reviews of Evaluation and Assessment in Education, OECD Publishing, Paris, http://dx.doi.org/10.1787/9789264190658-en.
OECD (2012), Equity and Quality in Education: Supporting Disadvantaged Students and Schools, OECD Publishing, Paris, http://dx.doi.org/10.1787/9789264130852-en.
OECD (2010), “Vocational Education and Training in Belgium (Flanders) Strengths, Challenges and Recommendations”, OECD, Paris, www.oecd.org/education/skills-beyond-school/46266835.pdf.
OECD (2006), Starting Strong II: Early Childhood Education and Care, OECD Publishing, Paris, http://dx.doi.org/10.1787/9789264035461-en.
OECD (2005), Teachers Matter: Attracting, Developing and Retaining Effective Teachers, OECD Publishing, Paris, http://dx.doi.org/10.1787/9789264018044-en.
OECD (2004), Equity in Education: Students with Disabilities, Learning Difficulties and Disadvantages, OECD Publishing, Paris, http://dx.doi.org/10.1787/9789264103702-en.
This paper is published under the responsibility of the Secretary-General of the OECD. The opinions expressed and arguments employed herein do not necessarily reflect the official views of OECD member countries or the European Union. This document, as well as any data and any map included herein are without prejudice to the status of or sovereignty over any territory, to the delimitation of international frontiers and boundaries and to the name of any territory, city or area.
Photo credits: Cover © Shutterstock/Sasha Chebotarev
© OECD 2017
You can copy, download or print OECD content for your own use, and you can include excerpts from OECD publications, databases and multimedia products in your own documents, presentations, blogs, websites and teaching materials, provided that suitable acknowledgment of the source and copyright owner is given. All requests for public or commercial use and translation rights should be submitted to [email protected]. Requests for permission to photocopy portions of this material for public or commercial use shall be addressed directly to the Copyright Clearance Center (CCC) at [email protected] or the Centre français d'exploitation du droit de copie (CFC) at [email protected].
EDUCATION POLICY OUTLOOK: BELGIUM © OECD 2017 32
How to cite this document: OECD (2017), Education Policy Outlook: Belgium, available at:
www.oecd.org/edu/profiles.htm.
www.oecd.org/edu/policyoutlook.htm