education policy analysis - Redalyc · Education Policy Analysis ... An Environmental Scan of...
32
Education Policy Analysis Archives/Archivos Analíticos de Políticas Educativas ISSN: 1068-2341 [email protected] Arizona State University Estados Unidos Alexander, Nicola A.; Choi, Wonseok Looking Beyond School Walls: An Environmental Scan of Minneapolis Public Schools, 2004-2008 Education Policy Analysis Archives/Archivos Analíticos de Políticas Educativas, vol. 23, 2015, pp. 1-31 Arizona State University Arizona, Estados Unidos Available in: http://www.redalyc.org/articulo.oa?id=275041389001 How to cite Complete issue More information about this article Journal's homepage in redalyc.org Scientific Information System Network of Scientific Journals from Latin America, the Caribbean, Spain and Portugal Non-profit academic project, developed under the open access initiative
Transcript of education policy analysis - Redalyc · Education Policy Analysis ... An Environmental Scan of...

Education Policy Analysis
Archives/Archivos Analíticos de Políticas
Educativas
ISSN: 1068-2341
Arizona State University
Estados Unidos
Alexander, Nicola A.; Choi, Wonseok
Looking Beyond School Walls: An Environmental Scan of Minneapolis Public Schools,
2004-2008
Education Policy Analysis Archives/Archivos Analíticos de Políticas Educativas, vol. 23,
2015, pp. 1-31
Arizona State University
Arizona, Estados Unidos
Available in: http://www.redalyc.org/articulo.oa?id=275041389001
How to cite
Complete issue
More information about this article
Journal's homepage in redalyc.org
Scientific Information System
Network of Scientific Journals from Latin America, the Caribbean, Spain and Portugal
Non-profit academic project, developed under the open access initiative

Journal website: http://epaa.asu.edu/ojs/ Manuscript received: 9/25/2013Facebook: /EPAAA Revisions received: 7/28/2014Twitter: @epaa_aape Accepted: 7/30/2014
education policy analysis archivesA peer-reviewed, independent, open access, multilingual journal
Arizona State University
Volume 23 Number 1 January 5th 2015 ISSN 1068-2341
Looking Beyond School Walls: An Environmental Scan of Minneapolis Public Schools, 2004-2008
Nicola A. Alexander &
Wonseok ChoiUniversity of Minnesota
United States
Citation: Alexander, N. A., & Choi, W. (2015). Looking beyond school walls: An environmental scan of Minneapolis public schools, 2004-2008. Education Policy Analysis Archives, 23(1). http://dx.doi.org/10.14507/epaa.v23.1492
Abstract: We provide an expanded environmental scan to assess the strengths, weaknesses, opportunities, and threats (SWOT) faced by education communities. Grounded in the literature, we identified 48 indicators and grouped them into 6 broad categories: (1) budget levels, (2) funding patterns, (3) community needs, (4) external economic conditions, (5) political culture, and (6) children outcomes. We then created sub-categories for each of these six groupings based on whether the data came from school reports, non-school, governmental data, or not-for-profit entities. From these data, we developed a template with strategic guidelines for education leaders in varying environmental contexts. The discussion integrates school finance, fiscal condition analysis, leadership and organizational research to develop a framework that is then applied to the Minneapolis Public Schools for school years 2004 through 2008. The retrospective examination supports the utility of the strategic guidelines offered in the framework. Education leaders found a mixed educational climate in Minneapolis Public Schools for the years examined. There was cause for concern in the declining revenues for children services by other governmental agencies and increasing numbers of schools not making annual yearly progress. However, there were also opportunities apparent in the number of schools that offered International Baccalaureate and other rigorous programs and the support of schools as
epaa aape

Education Policy Analysis Archives Vol. 23 No. 1 2
indicated by passage of local referenda.Keywords: environmental scan; strategic planning; SWOT analysis
Mirando más allá de las paredes de la escuela: Un Análisis del entorno de Escuelas Públicas de Minneapolis, 2004-2008Resumen: Proporcionamos una exploración del entorno ampliado para evaluar las fortalezas, debilidades, oportunidades y amenazas (análisis SWOT por sus iniciales en inglés) que enfrentan las comunidades educativas. Siguiendo la literatura especializada, se identificaron 48 indicadores y agrupados en 6 grandes categorías: (1) niveles presupuestarios, (2) modalidades de financiamiento, (3) necesidades de la comunidad, (4) condiciones económicas externas, (5) cultura política, y (6) resultados de los estudiantes. Se crearon subcategorías para cada uno de estos seis grupos en función de si los datos provienen de informes escolares, datos gubernamentales no escolares, o entidades sin fines de lucro. A partir de estos datos, hemos desarrollado una plantilla con directrices estratégicas para las autoridades educativas de los diferentes contextos. La discusión integra variables de financiamiento educativo, análisis de la situación fiscal, liderazgo e investigación de la organización para desarrollar un marco conceptual que fue aplicado para analizar las escuelas públicas de Minneapolis para los años escolares 2004 hasta 2008. El examen retrospectivo apoya la utilidad de las líneas estratégicas que se ofrecen en este marco. Los líderes educativos encontraron un clima educativo mixto en escuelas públicas de Minneapolis para los años examinados. Había preocupación por la disminución de los ingresos en los servicios infantiles de otras agencias gubernamentales y el creciente número de escuelas que no consiguieron las marcas de progreso anual. Sin embargo, también hubo oportunidades de mejora evidenciadas en el número de escuelas que ofrecen Bachillerato Internacional y otros programas rigurosos y el apoyo de las escuelas, como se indica por el paso de referendos locales. Palabras clave: análisis del entorno; planificación estratégica; Análisis SWOT.
Olhando para além dos muros da escola: Uma análise do ambiente das Escolas Públicas de Minneapolis, 2004-2008Resumo: Nós fornecemos uma varredura expandida para avaliar os pontos fortes, pontos fracos, oportunidades e ameaças (análise SWOT por sua sigla em Inglês) que as comunidades educativas enfrentam. Com base na literatura, foram identificados 48 indicadores que foram agrupados em seis grandes categorias: (1) os níveis de orçamento, (2) as modalidades de financiamento, (3) as necessidades da comunidade, (4) condições econômicas externas, (5) cultura política e (6) resultados dos alunos. Em seguida, forma criadas subcategorias para cada um desses seis grupos, tomando como base a proveniência dos dados: se provêm de relatórios escolares, de instituições não-escolaresdo governo, ou de entidades sem fins lucrativos. A partir destes dados, foi desenvolvido um modelo com orientações estratégicas para autoridades educativas em diferentes contextos. A discussão inclui variáveis de financiamento da educação, a análise da situação, liderança e organização de investigação fiscal para desenvolver um marco conceitual que foi em seguida aplicado para analisar as escolas públicas de Minneapolis nos anos letivos de 2004 até 2008. O exame retrospectivo apoia a utilidade das estratégias oferecidas neste marco conceitual. Líderes educacionais encontraram um clima educacional misto nas escolas públicas de Minneapolis nos anos analisados. Houve uma grande preocupação sobre o declínio das receitas de serviços para crianças por outras agências do governo e do número crescente de escolas que não conseguiram atingir as metas de progresso anual. No entanto, houve também oportunidades de melhoria evidenciadas no número de escolas que

Looking Beyond School Walls 3
oferecem Bacharelado Internacional e outros programas rigorosos e apoio das escolas, conforme indicado pela passagem de referendos locais. Palavras-chave: análise ambiental; planejamento estratégico; Análise SWOT.
Schools, and the students they serve, are a big investment for society (Aud, Hussar, Johnson, Kena, Roth, Manning, Wang, & Zhang, 2012). School finance scholars increasingly focus on the appropriate size of that investment. Collectively labeled adequacy studies, this scholarship estimates how much should be invested in schools in order that all students, or a considerable portion of them, meet or exceed specified standards. These estimates are typically based on the professional judgment of education experts (Verstegen, 2004), spending patterns of successful schools (Augenblick, Palaich, & Associates, 2011), best practices (Odden, Picus, & Goetz, 2010) or cost function calculations (Imazeki & Reschovsky, 2003). Less explored in recent school finance literature is an expanded environmental scan of the context in which these investments are made.
Scholars, policymakers, and practitioners have acknowledged the importance of context in the creation of a strategic plan, and the importance of a strategic plan in achieving successful outcomes (Thompson, Crampton, & Wood, 2012). Schools may have similar demographic contexts, but education leaders in the district located in a community riddled with crime face different options from those whose district has low crime rates. If school leaders look only to their student and staff makeup, they will miss a big aspect of the strengths, weaknesses, opportunities and threats that their building or district community faces. Practitioners and policymakers would welcome a guide grounded in the literature on how to interpret not only what is happening within the boundaries of schools but the outside factors that impact their context. An expanded environmental scan can provide parameters on the appropriate strategies for investing scarce resources given the intersection of schooling and broader environmental trends. Thus, this inquiry is not an adequacy study but a well-needed complement to that growing field of research.
We extrapolate from the philosophy of Bennis and Biederman (1997), who indicated that success is achieved from “not great leaders alone, but great leaders who exist in a fertile relationship with a Great Group” (p. 3). Similarly, we assert that schools do not act in a vacuum but must act in concert with the broader community. Consequently, we provide an outline of the information desirable for conducting an extensive SWOT (strengths, weaknesses, opportunities, threats) analysis for a schooling community.
We have organized the analysis in three parts. First, we drew on research on fiscal condition analysis (e.g., Rivenbark & Roenigk, 2011), leadership (e.g., Wahlstrom, Louis, Leithwood, & Anderson, 2010), organizational studies (e.g., Coburn, Bae, & Turner, 2008), and school finance(e.g., Baker, 2005). Synthesizing the literature from the various disciplines, we provide a conceptual framework for assessing community context. We reviewed the indicators developed in a variety of child welfare reports and modified the method used in the development of financial indicators for local government. Second, we applied the conceptual description to the case of the Minneapolis public school district from 2004 through 2008. Third, we concluded with specific recommendations for education leaders in general and Minneapolis in particular.

Education Policy Analysis Archives Vol. 23 No. 1 4
Table 1Key Indicators and Guide to Their Interpretation
School-based indicators Governmental, non-school, indicators Foundational indicators
Budget levels Per-pupil total operatingPer-pupil total
Budget of community’s department of public services (welfare)Budget of community’s child protective servicesBudget of community’s department of health services Budget of community’s department of mental healthBudget of community’s department of probationPortion of community’s budget allotted to childrenPer-capita amount of children’s budget
Community’s per-capita foundational dollars devoted to youth and children services
Funding patterns Portion of teachers that have at least 5 years of experiencePortion of teachers that are certifiedPupil-teacher ratio for teachers of high-level subjectsPortion of student class time devoted to high-level courses
Portion of children’s budget spent on early childhood educationPortion of community’s children budget spent on non-school, positive support (e.g., health, nutrition; youth recreational services)Portion of children’s budget spent on juvenile justice
Portion of foundational funding allotted to academic youth service programs Portion of foundational funding allotted to recreational youth service
Community needs Parental participationPortion of FRL participationPortion of special education part.School engagement index Number of kindergartens
Portion of population with college degreePortion of population over 65Portion of population participating in Medicaid
Number of community based organizations (CBOs) located in communityNumber of people served by CBOsProportion of community population served by CBOs
External economic conditions
-
Median incomeCrime rateMedian house pricePercent of foreclosed homesState or national unemployment rate
Level of national giving to foundations (charitable contributions)
Political culture Pass rates of referendumVoter participation in school elections
Voter participation in state electionsVoter participation in national electionsNumber of children initiatives passed
-
Children outcomes Pass rates on statewide examsPass rates on district examsMade AYP
Percent of school-aged population homelessPercent of school-aged population served by public health clinicPercent of school-aged population in foster carePercent of school-aged population in juvenile system
-
Note. Comprised by authors based on review of the literature. If the arrows point up ( ), higher scores on this indicator indicate strengths and opportunities on which the community can draw. If the arrows point down ( ), lower scores on those measures are better since they reflect potential threats and challenges to student success. If the arrows point in both directions ( ), the literature is inconsistent on whether higher or lower ratios on the specified indicators are associated with better outcomes.

Looking Beyond School Walls 5
This discussion is meant to inform and broaden the debate on the role that financial resources play both in and out of schools for the wellbeing of children. It is analogous to the fiscal condition indicator analysis associated with assessing the credit worthiness of organizations. This topic is important on three fronts. First, we extend the debate regarding levels of direct dollar investment in schools and explicitly tie non-school indicators to environmental scans of educational systems. Thompson, Crampton, and Wood (2012), for example, spoke to the necessity of school leaders conducting an internal and external scan to assess appropriately the instructional needs of students. Second, we explore how the theoretical underpinnings of fiscal condition analysis can be used to help policy makers and school practitioners develop a usable framework for developing strategic blueprints. Rivenbark and Roenigk (2011) pointed to the importance of conducting ratio analysis to evaluate financial relationships and comparative analysis to build context for informing policy decisions. Third, our discussion highlights the importance of looking outside the school walls to determine appropriate strategies for education leaders within buildings. Honig (2009) and Furco (2013) have drawn attention to the increasingly larger role played by members of organizations traditionally outside public school systems in the implementation of educational improvement initiatives. In essence, the paper’s contribution is its synthesis of research from a variety of fields to offer guidance on data protocols and how they can inform school leadership strategies.
Conceptual Framework for Expanded Environmental Scan
We developed a system of indicators that incorporate lessons from the literature on factors that matter to the achievement of children. Documenting resource allocation patterns within various communities is a giant first step in understanding better the full experience of the intersection of community interventions (public and private) on student performance. The development of protocols to identify and measure key investments in communities has several potential benefits. Policymakers could use this as a tool to: (1) Monitor changes in the context of the system in which it is located; (2) Identify emerging capacity problems in time to take corrective action; (3) Identifyexisting gaps in educational capacity of which the community may not have been aware; (4) Develop remedial action to deal with these gaps; (5) Project future educational needs; (6) Obtain a clear picture of the community’s strengths and weaknesses relative to its peers for presentation to educators, scholars, citizen groups, and policymakers; and, (7) Provide a long-range perspective for strategic deliberations.
Elements of the Expanded Environmental Scan
The data in Table 1 pull together pertinent information from a community’s budgetary and financial reports of its schools, other government agencies, and not-for-profit agencies. We identified 48 indicators and grouped them into 6 broad categories: (1) budget levels, (2) funding patterns, (3) community needs, (4) external economic conditions, (5) political culture, and (6) children outcomes. We then created sub-categories for each of these six groupings based on whether the data came from school reports, non-school, governmental data, or not-for-profit entities. These steps resulted in a six by three matrix with conceptual groupings identified along the rows and level of analysis identified across the columns.
In Table 1, we offer a guide to the relationship between the indicators identified and the educational SWOT of the community. The arrows provide a quick visual of what the scores and the trends indicate vis à vis opportunities and challenges. If the arrows point up ( ), higher scores on this indicator indicate strengths and opportunities on which the community can draw. If the arrows point down ( ), lower scores on those measures are better since they reflect potential threats and challenges to student success. If the arrows point in both directions ( ), the literature is inconsistent

Education Policy Analysis Archives Vol. 23 No. 1 6
on whether higher or lower ratios on the specified indicators are associated with better outcomes. Once a community has collected and quantified the data for a period of years, it can combine them into a single chart that chronicles a historical profile of the community. From these data, a comprehensive picture of the school or district environment emerges. The following sections will discuss the rationale underlying the inclusion of specific indicators and an explanation of why we denoted a particular trend as positive or negative.
Budget levels. Budget factors are important to an education environmental scan because the resources available affects the ability of the community to purchase resources that can influence the educational outcomes of children. Maintaining appropriate funding levels has been at the heart of many recent court challenges to educational finance systems (e.g., Chambers, Levin, & Parrish, 2006). Kozol (2005) provided vivid accounts of the consequences of insufficient levels of funding in urban communities, as seen in the stripping paint, antiquated plumbing, leaking roofs, and cracked blackboards. Comer (2005) and other scholars have suggested that resources provided in the broader context (not just schools) are important for children doing well in school. Consequently, we included indicators for all three columns in the table to reflect the fact that budgets spent on children by all parts of the community—schools, other government agencies, and foundations—influence positively the options available to education leaders.
Funding patterns. It is not surprising that budget priorities influence student outcomes (e.g., Timar & Roza, 2005). The importance of teachers in the achievement of students is well documented. Allgood and Rice (2002) noted, “no matter the method used, qualified teachers emerge as a key component of an adequate educational program” (p. 158). Accepting that teachers are important still leave unanswered the teacher attributes that education leaders should prioritize. The ideal number of years for teacher effectiveness is unclear, but research (e.g., Clotfelter, Ladd, & Vigdor, 2006) has suggested that communities with higher portions of teachers with 5 or more years of experience are better positioned to support student achievement than those with less.
There is extensive debate on the benefit of teacher certification and preparation (Boyd, Grossman, Lankford, Loeb, & Wyckoff, 2009). Federal policymakers implicitly acknowledge the importance of teacher certification by targeting those schools with low portions of certified teachers as communities in need of additional help (U.S. Department of Education, Office of Innovation and Improvement [OII], 2013). It is not an unreasonable assumption that teacher licensing provides a screening effect of potential teacher candidates so that there is a competence floor below which licensed teachers do not fall (Goldhaber & Hansen, 2010).
In its basic framework, the environmental scan included the portion of teachers with at least five years teaching experience and the portion of teachers who are certified. We considered communities with higher ratios of these measures to be better off than those with lower ones. A limitation of that interpretation is that it assumes a uniformly positive association between more licensed teachers and higher student performance. That assumption does not take into consideration the mitigating effect of a race/ethnicity match between teachers and their students, with Black students significantly benefitting from being matched with a Black teacher (Goldhaber & Hansen, 2010). These are details that policymakers and school leaders will want to keep in mind as they tailor the utility of the proposed template to their particular context. As research provides more answers, perhaps future analysis will result in the creation of an indicator that reflects the appropriate balance between having more- and less-experienced teachers (e.g., Grissmer, Flanagan, Kawata, & Williamson, 2000) and the potential tradeoffs in having more certified versus a more diverse teacher workforce.
Another important school resource is a rigorous curriculum. Wilcox and Angelis (2011) found that higher-performance schools have a well-defined and enacted focus on rigor. The

Looking Beyond School Walls 7
environmental scan captures this construct with two school level ratios: portion of student class time spent on rigorous subjects and pupil-teacher ratios for high level subjects (Alexander, 2003; Card & Krueger, 1996). We assumed that schools are better positioned if they have higher portions of student class time devoted to high-level courses and lower pupil-teacher ratios for teachers of high-level subjects (Fulmer & Turner, 2014).
As noted, an underlying assumption of our framing is that school leaders must also consider non-school factors in their strategic decisions. An educator in a community that provides a lot of support for its youth is better positioned than educators who are isolated in their support of positive youth programs. We focused on three governmental and two foundational indicators as evidence of the broader community prioritizing nurturing children programs. Governmental indicators included the portion of the children budget devoted to early childhood education programs (e.g., Heckman, 2000; Reynolds, 2005), portion of the budget devoted to non-schooling supportive programs (e.g., health, nutrition, and recreational services), and the portion of the children budget devoted to juvenile justice. Higher ratios of the first two attributes imply a positive position for education leaders whereas high portions devoted to juvenile justice expenditures signal challenges. For foundations and not-for-profit groups, the framework presumed that greater emphasis on children’s programs in the overall budget will be associated with higher student outcomes for local community children (Bulkley & Burch, 2011). This is reflected in the portion of foundational budgets that are devoted to academic youth services and recreational youth services. This analysis assumes that additional not-for-profit dollars will supplement, not supplant, public educational spending.
Community needs. Indicators of community need illustrate the way in which a community may make demands or provide support for schools. We identified five key school or district-level data that influence educational opportunities and challenges faced by education leaders: parental participation (Lopez, Scribner, & Mahitivanichcha 2001), school engagement (Sanders, 2014), percent of children eligible for free or reduced lunch (Curto & Fryer, 2014), percent of children eligible for special education services (Lewis, 2014), and the number of kindergarten programs in the community (Heckman, 2000). We consider higher rates of parental participation and school engagement as well as more kindergarten programs as signals of greater community support for education leaders. Education leaders will likely have to be more resourceful in terms of their support of children the higher the portions of students participating in special education services or eligible for free or reduced price lunches. We want to be explicit that we are not saying higher portions of poor kids and children with special needs are a bad thing. We are saying that education leaders will typically need to provide more resources to these groups of children to ensure that they are getting the support required (Odden, Picus, & Goetz, 2010).
Indicators of community needs provided in the governmental non-school data include the portion of population with a college degree, portion of population over 65 years, and portion of population participating in Medicaid. Silverman (2011) has found that these factors can influence the demands placed on the system to fund programs targeted to children and youth. Higher percentages of the population with a college degree are considered to be good. By contrast, higher percentages of population over 65 years and higher percentage of the population participating in Medicaid may be an indication that there may be demands placed on the system that compete with devoting resources to the educational attainment of children (Bowers, Metzger, & Militello, 2010).
Indicators of community needs provided in the foundational indicators is the presence of community-based organizations as reflected in the number of community-based organizations located in the community, number of people served by community-based organizations, and the proportion of the community’s population that is served by community-based organizations. The underlying literature (e.g., DiMartino, 2014) was unclear regarding the impact of these factors. On

Education Policy Analysis Archives Vol. 23 No. 1 8
the one hand, higher numbers may be reflective of higher needs within the community and more competition for resources or it could be reflective of greater interest and outreach efforts on the part of these organizations. If the latter is true, then higher numbers are likely to be associated with better education options for education leaders.
External economic conditions.. There are many external economic factors that are important to the wellbeing of local children even though they reflect conditions outside of the immediate control of building and district leaders. There are no school-based indicators of this factor. The governmental indicators include state and national unemployment rates, median income, crime rates, percent of housing stock that is foreclosed, and the median price of the housing stock. Foundational indicators include the level of state or national giving.
Standard fiscal condition and sociological analyses apply to indicators of external economic conditions. Other things being equal, a community is better off if it has lower unemployment rates, higher median income, lower crime rates, lower percentages of foreclosed homes, and a higher median price for its housing stock (Sharkey, 2014). We considered that having higher levels of state or national giving signaled more resources being available to support children (Power & Taylor, 2013). Consequently, an upward trend in national giving is associated with higher levels of educational opportunities.
Political culture. Febey and Louis (2008) pointed out that the policy options that education leaders face are tied to the political culture of the organizations and communities they lead. Key school-based indicators include voter turn-out in school elections and passage rates of school referenda. Governmental indicators include voter participation in state and national elections as well as the number of children’s initiatives passed. There are no foundational indicators developed for this category.
It is likely that communities will have more support for the passage of bond referenda if there is low voter turn-out in school elections and high passage rates of referenda (Bowers, Metzger, & Militello, 2010). However, we assumed that higher voter participation in state and national elections to be reflective of a higher value placed on community participation and that this support would influence the resources provided to help improve student outcomes. We also thought that the relationship between the number of children initiatives passed and the support for schools is mixed. If higher numbers are reflective of greater interest in increasing resources and opportunities available to children, then they would be associated with higher levels of education performance. If higher numbers reflect “spinning wheels” (e.g. Hess, 1998) then more initiatives may simply be reflective of past failure to solve the problem of insufficient opportunities for children and youth. That is, it may be helpful to create an indicator that better distinguishes between communities that spend a lot on “shooting star” initiatives versus long-term investments in promising programs (e.g., Growth &Justice, 2008).
Children’s outcomes. The indicators that track children’s outcomes are the crux of the success of education strategic plans and are contained in row 6 of Table 1. Column 1 of this category includes school data on student performance, for example, pass rates on statewide exams, pass rates on district exams, and the percent of schools that made the prescribed level of annual yearly progress (AYP). We identified governmental indicators of children’s outcomes to include percent of children who are homeless, percent of school-aged population served by health clinics, percent of children in foster care, and percent of children who are in the juvenile system. We did not employ any foundational indicators of children’s outcomes. A downward trend in the rates of homelessness, foster care, and participation in the juvenile justice system are reflective of a community whose children have fewer challenges, other things being equal.

Looking Beyond School Walls 9
Protocol for Application of Data on Trends
For each of the six elements in the expanded environmental scan, policymakers can create two separate ratios: (1) an overview ratio that comprises the number of indicators trending in the desired direction for a particular category in the numerator over the total number of indicators in that category in the denominator; (2) an administrative control ratio that comprises the number of school-based indicators in a particular category trending in the desired direction in the numerator over the total number of school indicators in that category in the denominator. We consider the position for each ratio to be positive if half or more of the indicators in that category are trending in the right direction (i.e., ratio is greater than or equal to .5). If fewer than half of the indicators are trending in the desired direction, we consider the community to have a negative position on this ratio. Thus for each category, four possibilities exist: Both the overview and the school-based ratios are positive; the overview ratio is positive, but the school-based ratio is negative; the overview ratio is negative, but the school-based ratio is positive; and both the overview and the school-based ratios are negative.1 For the big-picture overview fostered by these data, we present the template of possibilities and the recommended plans associated with the positions in Tables 2, 3, 4, and 5.
Admittedly, this is an arbitrary and ad hoc way of assessing the overall educational climate of a community. Our strategy weights the impact of each indicator equally, when clearly some would have a greater impact on student achievement than others. However, given the inconsistency of effect size of specific input factors in an education production function (Hedges, Laines, & Greenwald, 1994; Hanushek, 1997), the rightness of fit would depend on more specific localized information. While that level of detail is essential for contextual applications of leadership, the purpose of our framework is to provide general guidance. We fully acknowledge that education leaders would likely have to do more digging to tailor successfully implementation of specific programs. Notwithstanding, there is utility in a 65,000 feet view of context. Moreover, this framework offers practitioners the utility to omit a ratio that is not relevant to their context, modifying the summative ratios accordingly. For example, given the findings of Goldhaber and Hansen (2010), it may be more important for communities with a diverse student body to focus on fostering diverse faculty than maintaining high portions of certified teachers. In that case, instead of using the portion of certified teachers as an indicator, the community could measure and utilize the diversity of faculty relative to the student population. This strategy may also be helpful in communities that are not very diverse but have large achievement gaps. In Minnesota, for example, the recent move in 2012 to eliminate the teaching exam may be reflecting an attempt to diversify the teaching force and to be more responsive to the needs of communities of color.
Strategies Based on Funding Considerations
Table 2 contains strategies for the alignment of indicators reflecting funding, including budget levels, funding patterns, and the external economic environment. If both overall budgets and that for the school or district are largely trending as desired, this represents an opportunity for education leaders to include more costly programs in their strategic plan and to make substantive changes. If the overall budget environment is trending positively, but funding is declining for schools, this represents an opportunity for school leaders to seek out and apply for more grants to fund existing programs. If, by contrast, the overall budget environment is negative but positive for the district, this suggests that external conditions may ultimately have a negative impact on school
1 The category of external economic environment has only 2 possible outcomes because there are no school-based indicators for this grouping.

Education Policy Analysis Archives Vol. 23 No. 1 10
resources. Education leaders should anticipate cuts in budgets. They should maintain support of existing programs, but they should not start new ones. If both the overall and district budget environments are negative, education leaders should implement strategic cuts in district budgets.
Table 2 Application of Data Protocol and Recommendations Therein for Funding Considerations
Overview ratio
School-based ratio Recommended strategy
Budget levels
+ + Opportunity to include more costly programs in strategic plan and to make substantive changes.
+ - Seek out and apply for more grants to fund existing programs.
- + External conditions may ultimately have a negative impact on school resources. Anticipate cuts in budgets; maintain support of programs but don’t start new ones.
- - Implement strategic cuts in budgets.
Funding patterns
+ + Priorities of district and broader community seem consistent with higher student achievement. Maintain school district priorities.
+ - Priorities of broader community seem to be consistent with supporting children. Consider changing priorities of district to be more consistent with best practices and emphases on more rigorous curriculum for all.
- + Priorities of broader community seem to be inconsistent with supporting children. While school district priorities are consistent with best practices, they may need some adjustments to account for more support needed for kindergarten and early years of education.
- - Priorities in and outside of school district are inconsistent with support of children to raise student performance. Examine opportunities within schools to improve retention of teachers and portion of time devoted to rigorous courses,
External economic conditions
+ Not applicable
Education leaders have no direct impact on these factors but need to bear in mind their potential impact on future funding. Positive climate suggests that leaders can anticipate having the same or higher budgets.
- Not applicable
Education leaders have no direct impact on these factors but need to bear in mind their potential impact on future funding. A negative climate suggests that leaders can anticipate having lower budgets in the near future.

Looking Beyond School Walls 11
Funding patterns refer to the budget priorities of the community and organizations being examined. If both the overall funding patterns and those for the educational organization are consistent with best practice, it seems almost a tautology to advise education leaders to maintain existing patterns because the priorities of district and broader community seem consistent with higher student achievement. However, if the priorities of the broader community seem to be consistent with supporting children but those of the educational organization seem misaligned, education leaders should consider changing organizational priorities to be more consistent with best practices, including a more rigorous curriculum for all students. By contrast, if the priorities of the broader community seem to be inconsistent with supporting children and the priorities of the educational organization are consistent with best practices, education leaders will still need to modify their internal priorities. That is, they will need to account for the likelihood that schools will have to provide more support for kindergarteners and other students in their early years of education. If analysis indicates that priorities in and outside of the school district are inconsistent with raising student performance, education leaders should examine opportunities within schools to improve retention of teachers and portion of time devoted to rigorous courses.
Education leaders have no direct impact on external economic conditions but need to bear in mind the potential impact of the economy on future funding. A positive climate suggests that leaders can anticipate having the same or higher budgets. A negative climate suggests that leaders can anticipate having lower budgets in the near future.
Strategies Based on Demographic Considerations
Table 3 contains a summary of the recommended strategies based on demographic indicators of educational organization and the broader community. If both the demographics of the broader community and that of the educational organization are trending in directions associated with positive student achievement, education leaders should take advantage of broad-based support by advertising school activities to the broader community. If the demographics of the educational organization indicate that additional supports are needed for the student population and there is generic support from the broader community, education leaders should use this opportunity to improve parental participation and to build ties between community and the district. They should develop practical programs that are helpful to student population and their families. This may include family night, where there are opportunities to discuss the curriculum, provide flu shots, and offer practical advice on individualized education.
If the demographics of the external environment signal challenges to gaining broad community support but parental engagement with the educational organization is positive, education leaders should build a community campaign that strengthens links between community and schools. School leaders could host “senior friendly” events and invite members of the broader community to school plays, carnivals, and other school events. If the indicator analysis shows that the demographics of both the broader community and educational organization presents challenges, education leaders should first tackle the internal problems by making parents feel connected with the school. Leaders can then expand on those connections by making schools, and what they do, more accessible to the broader community. They could host events that explicitly link students with the neighborhood, including “clean up” day at the local park.

Education Policy Analysis Archives Vol. 23 No. 1 12
Table 3Application of Data Protocol and Recommendations Therein for Indicators of Community Demographics
Overview ratio
School-based ratio Recommended strategy
Community needs
+ + Demographics and engagement of the school and broader community communities are consistent with improved student achievement. Take advantage of broad-based support by advertising school activities to broader community and inviting them in.
+ - Demographics of external community suggest that there will be generic support of schools. Use this opportunity as a foundation to build ties between community and schools and to improve parental participation. Develop practical programs that are helpful to student population and their families. This may include family night where you discuss curriculum, provide flu shots, and offer practical advice on individualized education.
- + Demographics and engagement within school district are positive. Build a community campaign so that you can strengthen links between community and schools. Host “senior-friendly” and invite broader community to school plays, carnivals, and other school events.
- - Demographics and broader community connections present challenges. Start internally by making parents feel connected with school. Expand on those connections by making schools and what they do more accessible to broader community. Host events that explicitly link students with neighborhood. Possibilities include “clean up” day at the local park
Strategies Based on Considerations of Political Culture
Table 4 contains a summary of the strategies associated with political culture. If both the overall and school based ratios show that the political culture within and outside of the educational organization favor support of children and schools, education leaders should maintain strategies that foster this support. If, on the other hand, the political culture in broader electorate seems to favor support of children but are not favorable for school referendums, education leaders should revisit their communication of the school vision. They should be clear about what the vision of the school is and how the additional monies allow achievement of that vision. Leaders should improve community engagement, emphasizing tradition and continuation of excellence if stakeholders prioritize the status quo and the leadership of key elites. If the community prides itself on grassroots effort and community building, education leaders should have transparent decision making, open meetings, and emphasize the broad-based social benefits to the community. If the community is business oriented and individualistic, education leaders need to emphasize the economic benefits of

Looking Beyond School Walls 13
excellent schools. If indicator analysis suggests that there is a negative climate vis à vis schools in the broader community but referendums are still successful, education leaders should maintain existing programs while concurrently developing new strategies that foster community support for schools. Similarly, if the political culture in the broader electorate seems to be ripe for opposition to school referendums, education leaders need to be clear about what the vision of the school is and how additional monies allow achievement of that vision. They will also have to improve community engagement and participation, tailoring their strategies to match the community culture in the ways described above.
Table 4Application of Data Protocol and Recommendations Therein for Indicators of Political Culture
Overview ratio
School-based ratio Recommended strategy
Political culture + + Political culture in and out of district seems to favor support of children and schools. Maintain strategies that foster this support.
+ - Political culture in broader electorate seems to favor support of children and schools but not favorable for school referendums. Be clear about what the vision of the school is and how the additional monies allow achievement of that vision. Improve community engagement based on culture. Tailor strategies to match community.
- + Negative political climate of broader community has not resulted in lowered support for school referendums. Maintain strategies that foster support for schools.
- - Political culture in broader electorate seems to be ripe for opposition to school referendums. Be clear about what the vision of the school is and how the additional monies allow achievement of that vision. Improve community engagement based on its culture. Tailor strategies to match community culture.
Strategies Based on Considerations of Children Outcomes
Table 5 contains a summary of the recommendations based on indicators of children outcomes. If the ratios for the overall population and the educational organization are trending positively, this suggests that broader population dynamics and school achievement results provide great opportunities to focus on long-term outcomes, including post-secondary opportunities. If the broader population dynamics suggest that school achievement should be higher than it actually is, education leaders should revisit priorities and allocation of resources to ensure alignment of programs with district/school mission and goals. If indicator analysis shows that broader population dynamics are typically associated with more challenging results and the district is achieving “against the odds,” education leaders should continue pursuing their present priorities. By contrast, if both broader population dynamics and school achievement results indicate big challenges, education leaders should revise the district’s mission, programs, and priorities to ensure appropriate alignment.

Education Policy Analysis Archives Vol. 23 No. 1 14
Education leaders should also develop community partnerships to facilitate opportunities for children to get support both inside and outside of schools.
Table 5Application of Data Protocol and Recommendations Therein for Indicators of Children Outcomes
Overview ratio
School-based ratio Recommended strategy
Children outcomes
+ + Broader population dynamics and school achievement results provide great opportunities to focus on long-term outcomes, including post-secondary opportunities.
+ - Broader population dynamics should be associated with positive student outcomes. Revisit priorities and allocation of resources to ensure alignment of programs with district mission and goals.
- + Broader population dynamics typically associated with more challenging results. Continue to support present school district priorities, which are yielding positive results.
- - Broader population dynamics and school achievement results indicate big challenges. Revisit mission, programs, and priorities to ensure appropriate alignment. Develop community partnerships to facilitate opportunities for children to get support both inside and out of schools.
The Case of Minneapolis
Data and Method
To conduct the empirical analysis, we relied on data from a variety of sources. The data for the school-based indicators were largely taken from the Minnesota Department of Education (MDE) website for the Minneapolis Public School District. The data for the governmental, non-school based components were largely taken from data provided by The City of Minneapolis and Hennepin County (HC) as well as from the Minnesota Department of Public Safety. The data on the not-for-profit based components were largely taken from the National Center for Charitable Statistics (NCCS, n.d.), and refers to data provided at the city and/or county level.2 We provide analysis for school years 2004 through 2008. These years allowed us to take a retrospective look at the data and to assess the applicability of the guidelines offered in the strategic blueprint we developed.
School-based components. Minneapolis school-based indicators are taken primarily from the website of the Minnesota Department of Education.3 From the MDE web site, we also obtained
2 A difficulty in combining the analysis of school and non-school data is the difference in the fiscal years used. For example, the fiscal year of the City of Minneapolis and Hennepin County is from Jan. 1 to Dec. 31, while that of school districts is from July 1 to June 30. For this paper, the ending year of a school fiscal year was used to correspond with the budget of the same time period. For example, the school district expenditure of 2008 reflects output data for 2007-2008 and corresponds with the 2008 governmental fiscal year.3 http://w20.education.state.mn.us/MDEAnalytics/Data.jsp

Looking Beyond School Walls 15
district-level data on expenditures, student demographics, teacher demographics, teacher assignments, and results for the Minnesota Comprehensive Assessment (MCA), the standardized exams used in the state. From the Hennepin County website,4 we collected data on referendum pass rates. Using those data, we identified as many school-based indicators from the template as possible. We derived 10 school-based indicators for empirical analysis: (1) per-pupil total operating expenditure, (2) per-pupil total expenditures, (3) portion of teachers that have at least 5 years of teaching experience, (4) pupil-teacher ratio for teachers of high-level subjects, (5) portion of students eligible for free or reduced price lunch, (6) portion of students classified for special education services, (7) number of kindergartens, (9) pass rates on statewide exams, and (10) portion of schools making-AYP. To compare the actual purchasing power of the district across time, we used the Consumer Price Index for All Urban Consumers (CPI-U, Bureau of Labor Statistics, 2009, p. 75) to adjust expenditures into constant 2004 dollars. We present both the nominal and constant values in the chart of trends (see Figure 1 in the Appendix).
Governmental, non-school components. Our proposed template called for 25 governmental, non-school indicators to inform a comprehensive analysis of the environment a school district faced. To assess the Minneapolis context for the years examined, we were able to gather information on 18 out of 25 of those indicators. We obtained much of those data from the budget reports of Hennepin County, the county in which Minneapolis is located (Hennepin County, 2005, 2006, 2008). These reports organized the budget into seven major programs; (1) Public Works, (2) Public Safety, (3) Health, (4) Libraries, (5) Human Services, (6) General Government, and (7) Capital Improvements. Each department also reported its budget based on its individual programs. We categorized the budgets into the identified categories with the levels spent on health services being those accounted for in that program.5 We calculated the portion of the county’s budget allocated to children by summing the four children-related programs of the human services department (child protection, children’s mental health, child support, and children, youth, and families programs) and denoted those aggregated expenditures as a ratio of the total budget of the Department of Human Services.
We also accessed the American Community Survey (ACS) using American FactFinder6 to get key measures of governmental, non-school indicators of community needs. We gathered data on the portion of population with a college degree and the portion of the population over 65. Because we were unable to find trend measures for the portion of the population participating in Medicaid, we used the portion of population below poverty level as a proxy. The Hennepin County website provided us with data on external economic conditions: (1) median income and (2) median house price. We also obtained measures for children outcomes, including the percent of school-aged population below the poverty line.
We collected information from the website of the City of Minneapolis, including the number of youth brought to juvenile supervision center for a truancy violation (Minneapolis Department of Health and Family Support, 2012). Crime rates, the number of index crimes per 100,000 in population, and the number of juveniles arrested by agency were collected from the uniform crime reports (Minnesota Department of Public Safety, 2005, 2006, 2007, 2008, 2009) and used to calculate the percent of school-aged population in the juvenile system.
4 http://www16.co.hennepin.mn.us/elections/results5 The budget for Health excluded the budget of the Hennepin County Medical Center (HCMC) in 2007 and 2008. Consequently, to compare the budget amounts over time, we omitted the amount allotted to the HCMC from the overall budget for Health for 2004, 2005, and 2006.6 http://factfinder.census.gov

Education Policy Analysis Archives Vol. 23 No. 1 16
Table 6Environmental Scan of Minneapolis, 2004 - 2008
School-based indicators Governmental, non-school, indicators Foundational indicators
Budget levels Per-pupil total operating!Per-pupil total!
Budget of community’s department of public services (welfare)
Budget of community’s child protective services
Budget of community’s department of health services
Budget of community’s department of mental health
Budget of community’s department of probation
Per-capita amount of children’s budget
Community’s per-capita foundational dollars devoted to youth and children services
Funding patterns Portion of teachers that have at least 5 years of experience
Portion of teachers that are certified!
Portion of high school teachers devoted to high-level subjects !
Portion of community’s budget allotted to children
Portion of foundational funding allotted to academic youth service programs
Portion of foundational funding allotted to recreational youth service
Community needs Portion of FRL participation!
Portion of special education part.
Number of kindergarteners!
Ratio of KG pgms to 5 year olds!
Portion of 5yr olds in KG
Portion of population with college degree!
Portion of population over 65
Portion of population below poverty level
Truancy rate
External economic conditions
-
Median income!
Crime rate!
Median house price
Percent of foreclosed homes
State or national unemployment rate
Level of national giving to foundations (charitable contributions)!
Political culture Pass rates of referendum
Voter participation in school elections
Voter participation in state elections
Voter participation in national elections -
Children outcomes Pass rates on statewide exams
Made AYP
Percent of school-aged population below poverty line
Percent of school-aged population in juvenile system!
-
Note. Compiled by authors based on analysis. Regular arrows indicate desired trend based on conceptual framework; boxed arrows indicate the trend for Minneapolis. If boxed arrow points in both directions, trends in Minneapolis were mixed. Bolded indicator means that trend for Minneapolis on specified indictor is in direction sought.

Looking Beyond School Walls 17
We accessed information on the rates of political participation and economic stress from a variety of state government and non-governmental organizations. HousingLink provided data on foreclosure rates and the number of foreclosed mortgages as a percent of total households (HousingLink, 2009). We found information on voter participation in state and national elections from the Office of the Minnesota Secretary of State (http://www.sos.state.mn.us), and the Minnesota Department of Employment and Economic Development website provided Minnesota and national unemployment rates (https://apps.deed.state.mn.us/lmi/laus/).
Foundational components. The template recommended getting information on seven indicators of foundational support. We were able to gather data on four of the seven recommended measures. The data on the revenues of non-profit organizations located in Hennepin County were from the website of the National Center for Charitable Statistics (NCCS). The NCCS provides data on revenues of nonprofit organizations by each county and by the major purpose or activity with 26 major categories and 655 detailed categories.7 We denoted eight categories of spending as not-for-profit foundational dollars devoted to youth and children services: categories B (Education), I21 (Youth Violence Prevention), I72 (Child Abuse Prevention), O (Youth Development), P30 (Children & Youth Services), P31 (Adoption), P32 (Foster Care), and P33 (Child Day Care). We divided the sum of these categories by the youth population in Hennepin County to get the per-capita foundation dollars spent on children and youth. As above, the youth population data of Hennepin County was from the website of the American Community Survey.
Results
Budget Levels
The results of the trend analysis and environmental scan for Minneapolis are shown in Figure 1 (see Appendix) and Table 6. Minneapolis had mixed results on indicators of budget levels. Its school-based levels of spending trended in the right direction, but the wider environment of the City, county, and local non-profits showed troubling trends in declining amounts being devoted to children’s budgets. The guide offered by the strategic template indicates that Minneapolis education leaders should have anticipated cuts in their budgets. In response, they should have maintained their support of existing programs but should not have started new ones. We now know that 2008 precipitated the start of the Great Recession and a slowing of or declines in the growth of educational expenditures across the nation (Alexander, 2012). Indeed, overall revenues for Minneapolis Public Schools dropped slightly from $612.5 million in 2008 to $605.6 million in 2009 (Minnesota Department of Education, n.d.). By 2013, the budget rebounded to $634.7 million in revenues; this rise was largely driven by the rallying of the state and national economies as well as an increase in the district’s student population.
Funding Patterns
Minneapolis had positive trends in its school-based funding patterns with a general increase in the portion of teachers that were certified and assigned to a rigorous curriculum. The analysis suggested that Minneapolis children were facing a challenging external environment though there
7 For more detailed information of the categories, see the webpage of NCCS-search NTEE Definitions (http://nccsdataweb.urban.org/PubApps/nteeSearch.php?gQry=all&codeType=NTEE).

Education Policy Analysis Archives Vol. 23 No. 1 18
were key opportunities for educational leaders to support students. Hennepin County allocated almost 10 percent of its budget to children in 2008, an increase from the portions allocated in 2004, but a decline from 2007. Similarly, the non-profits allocated more of its expenditures to children than five years prior, but had cut back in the last year of the analysis. The declines in external support for children signaled the need for district leaders to provide additional support services to their students as a complement to the provision of advanced academic programs. This is consistent with the strategies outlined by Minneapolis education leaders in their strategic plan for 2007-2012. In it, they recommended the development of high-performing teacher corps and the provision of professional development and support to get excellent results for all students (Minneapolis Public Schools, 2014). The strategic guidelines that we proposed is also consistent with the budget adopted by the district where the nominal amounts devoted to student support services increased from $20.2 million in 2008 to $21.3 million in 2009. This resulted in the portion allotted to pupil support increasing from 2.98 percent of the budget to 3.14 percent. It is important to note, however, that this increase came at the expense of large declines in instructional support, which fell from $42.6 million in 2008 to $32.5 million in 2009.
Community Needs
A key question for overall educational planning is whether the community profile lends itself to providing more support to the achievement of high educational outcomes than it makes in demands (e.g., Groves, et al. 1981). In the years examined, Minneapolis Public Schools had increasing demands placed on it with a rise in the portion of special education students. However, there was also an opportunity to see its student population increase with a rising number of students below age five living in the district. The data indicated that the portion of students participating in free and reduced lunch programs decreased over the years examined. However, given the rising poverty levels in the City and county, this declining trend was misleading and may have simply reflected fewer students completing the required paperwork.
Minneapolis had mixed results on government-based community indicators. While the percentage of the population with a college degree increased, so did the portion of the population over 65. Moreover, the portion of the population living below poverty was increasing over the years examined and the truancy rate had just begun to decrease after years of going up. Summative assessment of the indicators shows both overall and school-based ratios were trending somewhat positive. Thus, education leaders should have taken advantage of relatively broad-based support of their schools by advertising school activities to the broader community and inviting outsiders to attend school functions. This is consistent with the strategic plan offered by the leaders of Minneapolis where they recommended transforming relationships and improving partnerships with families. In addition they advocated building widespread internal and external support and partnerships to get results.
External Economic Conditions
Standard fiscal condition analyses apply to indicators of external economic conditions. On the plus side, the City of Minneapolis had increasingly higher median incomes and decreasing crime rates over the five years examined from 2004 to 2008. However, residents of the City also felt the impact of the recession, as median housing prices fell, the percent of foreclosed homes rose, and state and national unemployment rates climbed over the years examined. Some of the negative aspects of these trends on the educational climate of the Minneapolis community were mitigated by increased levels of national giving to charitable foundations. Having higher levels of state or national giving are associated with more resources being available to support children and offer higher levels of educational opportunities. Positive economic climates coupled with the pattern of non-school,

Looking Beyond School Walls 19
government budget levels implied that school budgets were relatively stable with no major increases or cuts immediately forthcoming. These expectations were borne out by the data.
Political Culture
Minneapolis had two referenda over the years examined, in 2000 and 2008, both of which passed. However, the passage came with declining margins of support. There tended to be relatively strong voter turnout in the state as a whole, but less so in the City of Minneapolis. This may reflect an increased ambivalence in the political process and less trust in what governmental entities can do. If those trends continued, they would be expected to foreshadow less willingness to support schools with additional funds. Notwithstanding, the fact that P-12 education did not receive as deep a cut in state aid as other local government organizations in the years examined suggest that schools were still considered to be a priority by state policymakers. Given the 2004 to 2008 trend, the conceptual guide suggests that Minneapolis school leaders needed to refine their communication with the broader community (Kowalski & Brunner, 2005). They needed to ensure that the electorate was clear about the vision of the school district and how additional monies would allow achievement of that vision. The development of the 5-year strategic plan around the years examined was a good step in that direction.
Children Outcomes
An influencing factor on the educational performance of a community is the participation of its children in the juvenile system. A community would have greater support for higher educational outcomes, the lower the ratios of children in the juvenile system and the fewer the portion of children living in poverty. On both these indicators, Minneapolis had a positive trend in the five years examined.
However, there was a troubling trend in the pass rates of Minneapolis students on statewide exams. For the grades included in this analysis, there continued to be a widening achievement gap between poor and wealthy students. This gap also persisted between the achievement of white and non-white students. Overall, however, the proficiency rates have generally increased over the last year of the analysis though they remained relatively low for math for all grades. Given the ratios for broader population dynamics, we would have expected more positive student outcomes than what actually existed. Perhaps education leaders should have revisited allocation priorities to ensure the proper alignment of resources to the mission and goals of the district. This is consistent with the rhetoric of the Minneapolis strategic plan for 2007-2012, where district leaders asserted that they would set clear expectations for all staff at every level.
Discussion and Policy Implications
This analysis provides the template for an expanded environmental scan, the data which educational leaders may use to inform education strategic plans. We first discussed the conceptual underpinnings of the template and then applied that framework to Minneapolis for school years 2004 through 2008. While there is still disagreement in the literature regarding how we would really study public and private investment in each child, this analysis modified the approach used by fiscal analysts to inform SWOT analysis for education communities.
We analyzed Minneapolis as a first step in being able to document the factors that affect the disparate education context that district leaders faced. Key to the framework is the promise of having a better understanding of the community. Based on the data collected for the indicators identified, policymakers can establish a baseline for children. We hope to provide policymakers and educational leaders with a useful strategic planning tool.

Education Policy Analysis Archives Vol. 23 No. 1 20
Looking at the Minneapolis community, we used a compilation of ratios to document how well that community supported its children and the implications for policy and procedures for education leaders in that district. There was cause for concern in the declining revenues and increasing numbers of schools not making AYP. However, there were also opportunities apparent in local referenda passed as an indicator of local support for the schools and the number of schools that offered International Baccalaureate and other rigorous programs.
Thompson, Crampton, and Wood (2012) have asserted that conditions that influence the opportunities and challenges to a building go beyond schooling. This is true for the Minneapolis community as well, and its schools continued to struggle with attaining adequate educational outcomes for all its children. Despite efforts of the Minneapolis Public Schools to restructure and reconfigure its finances (e.g., Alexander, 2008), in the years examined, the district continued to lose students and fewer of its schools were making annual yearly progress as defined by national and state standards. This exodus occurred amidst the establishment of more rigorous academic programs and increasing the percentage of certified and highly experienced teachers who were assigned to more rigorous subjects. This suggests that the broader community also has a role to play in supporting its children outside of school. Notwithstanding, governmental, non-school indicators showed a declining tendency for local governments to invest in children’s budgets. This may have been due to the large cuts in local government aid that all Minnesota localities experienced in 2007 and 2008, the last years of the data included in the analysis. Moreover, the county’s budget showed a decline in the level of monies expended on children.
Education leaders can use this expanded SWOT analysis and supplemental strategic guide as a basis for determining categories in which they are doing well and others that present challenges. Examining annual and long-term changes in internal and external contexts allows education leaders to identify emerging capacity problems before they become intractable. Further, by documenting key trends, education leaders can gain clarity on blind spots and gaps in their educational capacity of which they might not have been aware. Knowing what problems exist and their underlying causes are essential to the development of appropriate strategic action. By monitoring their environment carefully, education leaders are better positioned to determine where their district stands relative to other communities and to anticipate future educational needs. This examination gives educational leaders a framework by which they can obtain a comprehensive picture of the strengths and challenges of their community. This picture goes a long way in anchoring strategic deliberations.
Given the broadness of the constructs adopted in the framework, the results offer complementary data for those scholars that calculate how much money policymakers should invest in schools. We offer this process of examining the educational context of a community as an important step in extending notions of educational adequacy. We explicitly call for analysis that looks beyond school walls in determining educational opportunities. Future research can build on this analysis to create standardized indices that yield insight on how well a community is doing overall vis à vis the resources available for educating its children.
References
Alexander, N. A. (2003). Considering equity and adequacy: An examination of the distribution of student class time as an educational resource in New York State, 1975-1995. Journal of Education Finance, 28, 357-381.
Alexander, N. A. (2008). A healthy balance: Fiscal condition and district competitiveness in the Twin Cities metropolitan districts of Minnesota. The Journal of School Business Management, 20(2), 34-43.

Looking Beyond School Walls 21
Alexander, N. A. (2012). The growth of education revenues from 1998-2006: An update on what accounts for differences among states and the District of Columbia in the context of adequacy. Educational Considerations, 39(2), 3-19.
Allgood, W., & Rice, J. K. (2002). The adequacy of urban education: Focusing on teacher quality. In C. Roellke and J. K. Rice (Ed.), Fiscal policy in urban education (pp. 155-180). Greenwich, CT: Information Age Publishing.
Aud, S., Hussar, W., Johnson, F., Kena, G., Roth, E., Manning, E., Wang, X., & Zhang, J. (2012). The condition of education 2012 (NCES 2012-045). U.S. Department of Education, National Center for Education Statistics. Washington, DC. Retrieved June 6, year from http://nces.ed.gov/pubsearch.
Augenblick, Palaich & Associates. (2011). Costing out the resources needed to meet Colorado educations standards and requirements. Retrieved from http://co.chalkbeat.org/wp-content/uploads/sites/2/2011/08/APACostStudy80811.pdf
Baker, B. D. (2005). The emerging shape of educational adequacy: From theoretical assumptions to empirical evidence. Journal of Education Finance, 30, 259–287.
Bennis, W., & Biederman, P. W. (1997). Organizing genius: The secret of creative collaboration. New York, NY: Basic Books.
Bowers, A. J., Metzger, S. A., & Militello, M. (2010). Knowing what matters: An expanded study of school bond elections in Michigan, 1998-2006. Journal of Education Finance, 35, 374-396.http://dx.doi.org/10.1353/jef.0.0024
Boyd, D. J., Grossman, P. L., Lankford, H., Loeb, S., & Wyckoff, J. (2009). Teacher preparation and student achievement. Educational Evaluation and Policy Analysis, 31, 416–440. http://dx.doi.org/10.3102/0162373709353129
Bulkley, K. E., & Burch, P. (2011). The changing nature of private engagement in public education: For-profit and nonprofit organizations and educational reform. Peabody Journal of Education, 86, 236-251.http://dx.doi.org/10.1080/0161956X.2011.578963
Card, D. & Krueger, A. B. (1996). School resources and student outcomes: An overview of the literature and new evidence from North and South Carolina. Journal of Economic Perspectives, 10(4), 31–50.http://dx.doi.org/10.1257/jep.10.4.31
Chambers, J. G., Levin, J. D., & Parrish, T. B. (2006). Examining the relationship between educational outcomes and gaps in funding: An extension of the New York adequacy study. Peabody Journal of Education, 81(2), 1-32.http://dx.doi.org/10.1207/S15327930pje8102_1
Clotfelter, C. T., Ladd, H. F., & Vigdor, J. L. (2006). Teacher-student matching and the assessment of teacher effectiveness. Journal of Human Resources, 41, 778–820.
Coburn, C. E., Bae, S., & Turner, E. O. (2008). Authority, status, and the dynamics of insider–outsider partnerships at the district level. Peabody Journal of Education, 83, 364–399. http://dx.doi.org/10.1080/01619560802222350
Comer, J. P. (2005). Child and adolescent development: The critical missing focus in school reform. Phi Delta Kappan, 86, 757–763. http://dx.doi.org/10.1177/003172170508601008
Curto, V. E. & Fryer, R.G., Jr. (2014). The potential of urban boarding schools for the poor: Evidence from SEED. Journal of Labor Economics, 32, 65-93.http://dx.doi.org/10.1086/671798
DiMartino, C. (2014). Navigating public-private partnerships: Introducing the continuum of control. American Journal of Education, 120, 257-282. http://dx.doi.org/10.1086/674375

Education Policy Analysis Archives Vol. 23 No. 1 22
Febey, K. S. & Louis, K. S. (2008). Political cultures in education at the state and local levels: Views from three states. In B. S. Cooper, J. G. Cibulka, & L. D. Fusarelli (Eds.), Handbook of education politics and policy (pp. 52–72). New York, NY: Routledge.
Fulmer, S. M. & Turner, J.C. (2014). The perception and implementation of challenging instruction by middle school teachers: Overcoming pressures from students. The Elementary School Journal, 114, 303-326. http://dx.doi.org/10.1086/674053
Furco, A. (2013). Legitimizing community engagement with K-12 schools. Peabody Journal of Education, 88, 622-636. http://dx.doi.org/10.1080/0161956X.2013.835180
Goldhaber, D. & Hansen, M. (2010). Race, gender, and teacher testing: How informative a tool is teacher licensure testing? American Educational Research Journal, 47, 218–251. http://dx.doi.org/10.3102/0002831209348970
Grissmer, D. W., Flanagan, A., Kawata, J. H., & Williamson, S. (2000). Improving student achievement: What state NAEP test scores tell us. Retrieved from RAND Corporation website: http://www.rand.org/pubs/monograph_reports/MR924.html
Groves, S. M., Godsey, W. M., & Shulman, M. A. (1981). Financial indicators for local government. Public Budgeting & Finance, 1(2), 5–19. http://dx.doi.org/10.1111/1540-5850.00511
Growth and Justice. (2008). Smart investments in Minnesota’s students. Saint Paul, MN: Author. Retrieved from http://www.growthandjustice.org/images/uploads/Final_SIMS_Report.pdf
Hanushek, E. A. (1997). Assessing the effects of school resources on student performance: an update. Educational Evaluation and Policy Analysis, 19, 141–164.http://dx.doi.org/10.3102/01623737019002141
Heckman, J. J. (2000). Policies to foster human capital. Research in Economics, 54, 3–56.http://dx.doi.org/10.1006/reec.1999.0225
Hedges, L. V., Laine, R. D., & Greenwald, R. (1994). An exchange: Part I: Does money matter? A meta-analysis of studies of the effects of differential school inputs on student outcomes. Educational Researcher, 23(3), 5–14. http://dx.doi.org/10.3102/0013189X023003005
Hennepin County. (2005). 2006 Budget. Minneapolis, MN: Author.Hennepin County. (2006). 2007 Budget. Minneapolis, MN: Author.Hennepin County. (2008). 2009 Budget. Minneapolis, MN: Author.Hess, F. M. (1998). Spinning wheels: The politics of urban school reform. Washington, DC: Brookings
Institution Press.Honig, M. I. (2009). “External” organizations and the politics of urban educational leadership: The
case of new small autonomous schools initiatives. Peabody Journal of Education, 84, 394–413. http://dx.doi.org/10.1080/01619560902973613
HousingLink. (2009). Foreclosures in Minnesota: A report based on county sheriff’s sale data. Greater Minnesota Housing Fund, Minnesota Housing Finance Agency, Family Housing Fund, Minnesota Home Ownership Center. Retrieved from http://www.housinglink.org/research/foreclosureresearch.aspx
Imazeki, J. & Reschovsky, A. (2003). Financing adequate education in rural settings. Journal of Education Finance, 29, 137–156.
Kowalski, T. J. & Brunner, C. C. (2005). The school superintendent: Roles, challenges, and issues. In F. W. English (Ed.), The SAGE handbook of educational leadership: Advances in theory, research, and practice (pp. 142–167). Location: Sage Publications.
Kozol, J. (2005). The shame of the nation : The restoration of apartheid schooling in America. New York, NY: Crown Publishers.

Looking Beyond School Walls 23
Lewis, K. E. (2014). Difference not deficit: Reconceptualizing mathematical learning disabilities. Journal for Research in Mathematics Education, 45, 351-396.http://dx.doi.org/10.5951/jresematheduc.45.3.0351
Lopez, G. R., Scribner, J. D., & Mahitivanichcha, K. (2001). Redefining parental involvement: Lessons from high-performing migrant-impacted schools. American Educational Research Journal, 38, 253–288. http://dx.doi.org/10.3102/00028312038002253
Minnesota Department of Education. (n.d.). Financial profile reports: Total revenues FY 2008, 2009, 2013[Data file]. Retrieved from http://w20.education.state.mn.us/MDEAnalytics/Data.jsp
Minneapolis Department of Health and Family Support. (2012). Results Minneapolis: Youth violence. Minneapolis, MN: Author. Retrieved from http://www.minneapolismn.gov /www/groups/public/@citycoordinator/documents/webcontent/wcms1p-093196.pdf
Minneapolis Public Schools. (2014). Minneapolis public schools: 2007-2012 strategic plan. Retrieved from http://www.mpls.k12.mn.us/uploads/stratplan_rev03-12-2010.pdf
Minnesota Department of Public Safety. (2005). 2004 Uniform crime report. Retrieved from https://dps.mn.gov/divisions/bca/bca-divisions/mnjis/pages/uniform-crime-reports.aspx
Minnesota Department of Public Safety. (2006). 2005 Uniform crime report. Retrieved from https://dps.mn.gov/divisions/bca/bca-divisions/mnjis/pages/uniform-crime-reports.aspx
Minnesota Department of Public Safety. (2007). 2006 Uniform crime report. Retrieved from https://dps.mn.gov/divisions/bca/bca-divisions/mnjis/pages/uniform-crime-reports.aspx
Minnesota Department of Public Safety. (2008). 2007 Uniform crime report. Retrieved from https://dps.mn.gov/divisions/bca/bca-divisions/mnjis/pages/uniform-crime-reports.aspx
Minnesota Department of Public Safety. (2009). 2008 Uniform crime report. Retrieved from https://dps.mn.gov/divisions/bca/bca-divisions/mnjis/pages/uniform-crime-reports.aspx
National Center for Charitable Statistics. (n.d.). 2004, 2005, 2006, 2007, 2008 Registered nonprofit organizations by county, Minnesota. Retrieved January 21, 2010, from http://www.nccsdataweb.urban.org/tablewiz/tw_bmf.php
Odden, A. R., Picus, L. O., & Goetz, M. E. (2010). A 50-state strategy to achieve school finance adequacy. Educational Policy, 24, 628–654. http://dx.doi.org/10.1177/0895904809335107
Power, S. & Taylor, C. (2013). Social justice and education in the public and private spheres. Oxford Review of Education, 39, 464-479. http://dx.doi.org/10.1080/03054985.2013.821854
Reynolds, A. J. (2005). Confirmatory program evaluation: Applications to early childhood interventions. Teachers College Record, 107, 2401–2425. http://dx.doi.org/10.1111/j.1467-9620.2005.00597.x
Reschovsky, A. & Imazeki, J. (2001). Achieving educational adequacy through school finance reform. Journal of Education Finance, 26, 373-396.
Rivenbark, W. C. & Roenigk, D. J. (2011). Implementation of financial condition analysis in local government. Public Administration Quarterly, 35, 241–267.
Sanders, M. G. (2014). Principal leadership for school, family, and community partnerships: The role of a systems approach to reform implementation. American Journal of Education, 120, 233–255. http://dx.doi.org/10.1086/674374
Sharkey, P. (2014). Spatial segmentation and the black middle class. American Journal of Sociology, 119, 903-954. http://dx.doi.org/10.1086/674561
Silverman, R. M. (2011). How unwavering is support for the local property tax?: Voting on school district budgets in New York, 2003-2010. Journal of Education Finance, 36, 294–311.http://dx.doi.org/10.1353/jef.2011.0003
Strayer, G. & Haig, R. (1923). Financing of education in the State of New York. New York: MacMillan.

Education Policy Analysis Archives Vol. 23 No. 1 24
Thompson, D. C., Wood, R. C., & Crampton, F. E. (2012). Money and schools (5th ed.). New York, NY: Eye On Education, Inc.
Timar, T. B. & Roza, M. (2010). “A false dilemma”: Should decisions about education resource use be made at the state or local level? American Journal of Education, 116, 397–422. http://dx.doi.org/10.1086/651414
U. S. Bureau of Labor Statistics. (2009). CPI detailed report: Data for November 2009. Retrieved from http://www.bls.gov/cpi/cpid0911.pdf
U.S. Department of Education, Office of Innovation and Improvement. (2010). School leadership program (SLP) pre application meeting. Retrieved from www2.ed.gov/programs/leadership/2010-preapplication-ta.ppt.
Verstegen, D. (2004). Calculation of the cost of an adequate education in Kentucky: A professional judgment approach. Education Policy Analysis Archives, 12(8). Retrieved from http://epaa.asu.edu/ojs/article/view/163
Wagmiller, Jr. R. L. & Lee, K. S. (2014). Are contemporary patterns of black male joblessness unique? Cohort replacement, intracohort change, and the diverging structures of black and white men’s employment. Social Problems, 61, 305-327.http://dx.doi.org/10.1525/sp.2014.12133
Wahlstrom, K., Seashore, K., Leithwood, K., & Anderson, S. (2010). Investigating the links to improved student learning: Executive summary of research findings. Retrieved from The Wallace Foundationwebsite:http://conservancy.umn.edu/handle/11299/140884
Ward, J. G. (1991). Why educational adequacy remains an elusive goal. School Administrator, 48(8), 13-15.
Wilcox, K. C. & Angelis, J. I. (2011). High school best practices: Results from cross-case comparisons. The High School Journal, 94, 138–153. http://dx.doi.org/10.1353/hsj.2011.0009

Looking Beyond School Walls 25
Appendix
Per-pupil operating expenditure: MPSD
Per-pupil total expenditure: MPSD
Budget of Human Service: HC
Budget of Child Protection: HC
Budget of Child Mental Health: HC
Budget of Health: HC Budget of Community Corrections: HC
% of Community Budget allotted to Children: HC
Per-capita foundational dollars devoted to youth and children: HC
% of teachers with at least 5 years experience: MPSD
% of teachers devoted to high-level courses: MPSD
% of foundational funding allotted to academic programs for youth:HC
% of foundational funding allotted to recreational: HC
% of FRL participation: MPSD
% of special education participation: MPSD
Number Of Kindergarteners: MPSD
Figure 1. Trends in key indicators for Minneapolis public schools and its broader community, 2004-2008. Compiled by authors based on analysis of trends.

Education Policy Analysis Archives Vol. 23 No. 1 26
Portion Of Population With College Degree: MPC
Portion Of Population Aged 65 And Older: MPC
Portion Of Population Below Poverty Level: MPC
Truancy Rate: MPC
Median Income: MPC Crime Rate: MPC Medina House Value: MPC Foreclosure Rate: MPC
Unemployment Rate:
Minnesota & U.S.A.
National Giving To Nonprofit Organizations: U.S.A.
Pass Rate of Referendum: MPSD
Voter Participation In State Election: MPC
Voter Participation In National Election: MPC
Pass Rate On Statewide Exams (Math): MPSD
Pass Rate On Statewide Exams (Reading): MPSD
Math Pass Rate Gap Between Ethnic Groups (White – Not white): MPSD
Figure 1 (cont.’d). Trends in key indicators for Minneapolis public schools and its broader community, 2004-2008. Compiled by authors based on analysis of trends.

Looking Beyond School Walls 27
Reading Pass Rate Gap Between Ethnic Groups (White – Not white): MPSD
Math Pass Rate Gap Between Economic Groups (Not FRL – FRL): MPSD
Reading Pass Rate Gap Between Economic Groups (Not FRL–FRL): MPSD
% of Schools Making AYP: MPSD
Percentage of school-aged population below poverty level: MPSD
Percentage of school-aged population in juvenile arrested (MPC)
Per-pupil operating expenditure: MPSD
Per-pupil total expenditure: MPSD
Budget of Human Service: HC
Budget of Child Protection: HC
Budget of Child Mental Health: HC
Budget of Health: HC Budget of Community Corrections: HC
% of Community Budget allotted to Children: HC
Figure 1 (cont.’d). Trends in key indicators for Minneapolis public schools and its broader community, 2004-2008. Compiled by authors based on analysis of trends.
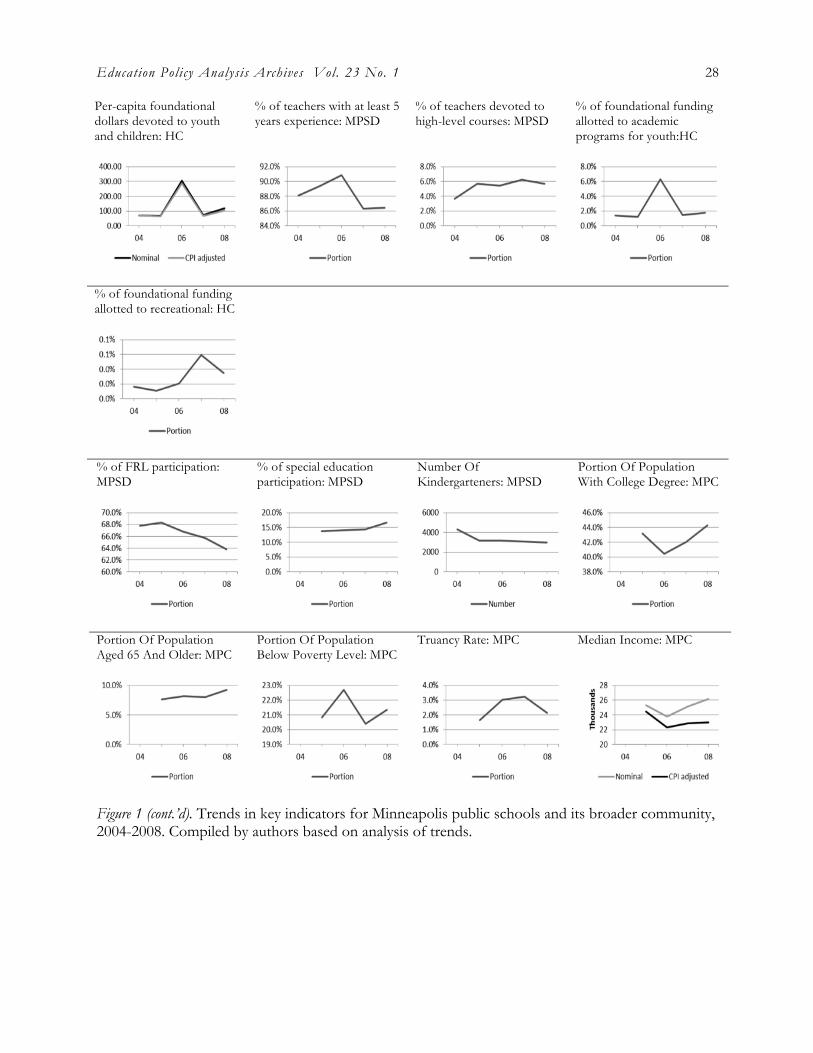
Education Policy Analysis Archives Vol. 23 No. 1 28
Per-capita foundational dollars devoted to youth and children: HC
% of teachers with at least 5 years experience: MPSD
% of teachers devoted to high-level courses: MPSD
% of foundational funding allotted to academic programs for youth:HC
% of foundational funding allotted to recreational: HC
% of FRL participation: MPSD
% of special education participation: MPSD
Number Of Kindergarteners: MPSD
Portion Of Population With College Degree: MPC
Portion Of Population Aged 65 And Older: MPC
Portion Of Population Below Poverty Level: MPC
Truancy Rate: MPC Median Income: MPC
Figure 1 (cont.’d). Trends in key indicators for Minneapolis public schools and its broader community, 2004-2008. Compiled by authors based on analysis of trends.

Looking Beyond School Walls 29
Crime Rate: MPC Medina House Value: MPC Foreclosure Rate: MPC Unemployment Rate:Minnesota & U.S.A.
National Giving To Nonprofit Organizations: U.S.A.
Pass Rate of Referendum: MPSD
Voter Participation In State Election: MPC
Voter Participation In National Election: MPC
Pass Rate On Statewide Exams (Math): MPSD
Pass Rate On StatewideExams (Reading): MPSD
Math Pass Rate Gap Between Ethnic Groups (White – Not white): MPSD
Reading Pass Rate Gap Between Ethnic Groups (White – Not white): MPSD
Math Pass Rate Gap Between Economic Groups (Not FRL – FRL): MPSD
Reading Pass Rate GapBetween Economic Groups (Not FRL–FRL): MPSD
% of Schools Making AYP: MPSD
Percentage of school-aged population below poverty level: MPSD
Figure 1 (cont.’d). Trends in key indicators for Minneapolis public schools and its broader community, 2004-2008. Compiled by authors based on analysis of trends.

Education Policy Analysis Archives Vol. 23 No. 1 30
Percentage of school-aged population in juvenile arrested (MPC)
Figure 1 (cont.’d). Trends in key indicators for Minneapolis public schools and its broader community, 2004-2008. Compiled by authors based on analysis of trends.

Looking Beyond School Walls 31
About the Authors
Nicola A. AlexanderUniversity of [email protected] A. Alexander is Associate Professor in the Education Policy and Leadership program at the University of Minnesota. She is particularly interested in notions of fairness, including issues of adequacy, equity, and productivity. Dr. Alexander is author of Policy Analysis for Educational Leaders: A Step by Step Approach (Pearson, 2012).
Wonseok ChoiUniversity of [email protected] Choi is a PhD candidate in the Education Policy and Leadership program at the University of Minnesota. He was selected to participate in the prestigious David L. Clark National Graduate Student Research Seminar sponsored by the University Council for Educational Administrators. His interests include teacher retention and alternative compensation programs.
education policy analysis archivesVolume 23 Number 1 January 5th 2015 ISSN 1068-2341
Readers are free to copy, display, and distribute this article, as long as the work is attributed to the author(s) and Education Policy Analysis Archives, it is distributed for non-commercial purposes only, and no alteration or transformation is made in the work. More details of this Creative Commons license are available at http://creativecommons.org/licenses/by-nc-sa/3.0/. All other uses must be approved by the author(s) or EPAA. EPAA is published by the Mary Lou Fulton Institute and Graduate School of Education at Arizona State University Articles are indexed in CIRC (Clasificación Integrada de Revistas Científicas, Spain), DIALNET (Spain), Directory of Open Access Journals, EBSCO Education Research Complete, ERIC, Education Full Text (H.W. Wilson), QUALIS A2 (Brazil), SCImago Journal Rank; SCOPUS, SOCOLAR (China).
Please contribute commentaries at http://epaa.info/wordpress/ and send errata notes to Gustavo E. Fischman [email protected]
Join EPAA’s Facebook community at https://www.facebook.com/EPAAAAPE and Twitter feed @epaa_aape.