Education Industry - 2015 Trend Report
4
1ST HALF 2015 KEY HIGHLIGHTS • The largest transaction year-to-date was LinkedIn Corporation’s acquisition of Lynda.com, an online learning company that provides video tutorials and courses covering business, software, creative, and other areas, for $1.5 billion. • The most active acquirers in 1st Half 2015, either purchased directly or through an affiliated business, were The Riverside Company and Providence Equity Partners with three industry deals each. Riverside acquired Health and Safety Institute; C-Learning through Learning Seat Pty Ltd; and Digital Ignite through YourMembership.com. Providence acquired Remote- Learner UK and Schoolwires, Inc. through Blackboard Inc; and Endeavour College of Natural Health through Study Group International. 1ST HALF 2015 KEY TRENDS • Total transaction volume in 1st Half 2015 increased by nine percent over 2nd Half 2014, from 162 to 177. • Total transaction value in 1st Half 2015 rose by 29 percent over 2nd Half 2014, from $4.75 billion to $6.11 billion. • The number of private equity backed deals in 1st Half 2015 improved by 38 percent over 2nd Half 2014, from 37 to 51 transactions. • The median revenue multiple declined from 3.5x in 2nd Half 2014 to 2.0x in 1st Half 2015. This marked a near return to its median throughout the last 30 months. • The segment with the largest increase in volume in 1st Half 2015 over 2nd Half 2014 was Higher-Ed Media and Tech with an 81 percent rise, from 21 to 38 transactions. M&A MARKET OVERVIEW Berkery Noyes tracked 806 Education transactions between 2013 and 1st Half 2015, of which 171 disclosed financial terms, and calculated the aggregate transaction value to be $20.78 billion. Based on known transaction values, we project the values of 635 undisclosed transactions to be $5.94 billion, totaling $26.72 billion worth of transactions tracked over the past two and a half years. Disclosed median enterprise value multiples for all segments combined in this report during the last 30 months were 2.1x revenue and 10.9x EBITDA. EDUCATION INDUSTRY 1ST HALF 2015 :: Mergers and Acquisitions Trend Report Presented by Berkery Noyes 1 Figure 1. 2013-2015 value and volume comparison. Figure 2. 2013-2015 median: value and revenue comparison.
-
Upload
lingo-media-corp -
Category
Investor Relations
-
view
222 -
download
1
Transcript of Education Industry - 2015 Trend Report

1ST HALF 2015 KEY HIGHLIGHTS• The largest transaction year-to-date was LinkedIn Corporation’s
acquisition of Lynda.com, an online learning company that
provides video tutorials and courses covering business, software,
creative, and other areas, for $1.5 billion.
• The most active acquirers in 1st Half 2015, either purchased
directly or through an affi liated business, were The Riverside
Company and Providence Equity Partners with three industry
deals each. Riverside acquired Health and Safety Institute;
C-Learning through Learning Seat Pty Ltd; and Digital Ignite
through YourMembership.com. Providence acquired Remote-
Learner UK and Schoolwires, Inc. through Blackboard Inc;
and Endeavour College of Natural Health through Study Group
International.
1ST HALF 2015 KEY TRENDS• Total transaction volume in 1st Half 2015 increased by nine
percent over 2nd Half 2014, from 162 to 177.
• Total transaction value in 1st Half 2015 rose by 29 percent
over 2nd Half 2014, from $4.75 billion to $6.11 billion.
• The number of private equity backed deals in 1st Half 2015
improved by 38 percent over 2nd Half 2014, from 37 to 51
transactions.
• The median revenue multiple declined from 3.5x in 2nd Half
2014 to 2.0x in 1st Half 2015. This marked a near return
to its median throughout the last 30 months.
• The segment with the largest increase in volume in 1st Half
2015 over 2nd Half 2014 was Higher-Ed Media and Tech with
an 81 percent rise, from 21 to 38 transactions.
M&A MARKET OVERVIEWBerkery Noyes tracked 806 Education transactions between 2013
and 1st Half 2015, of which 171 disclosed fi nancial terms, and
calculated the aggregate transaction value to be $20.78 billion.
Based on known transaction values, we project the values of 635
undisclosed transactions to be $5.94 billion, totaling $26.72 billion
worth of transactions tracked over the past two and a half years.
Disclosed median enterprise value multiples for all segments
combined in this report during the last 30 months were 2.1x revenue
and 10.9x EBITDA.
EDUCATION INDUSTRY1ST HALF 2015 :: Mergers and Acquisitions Trend Report
Presented by Berkery Noyes 1
Figure 1. 2013-2015 value and volume comparison.
Figure 2. 2013-2015 median: value and revenue comparison.
2
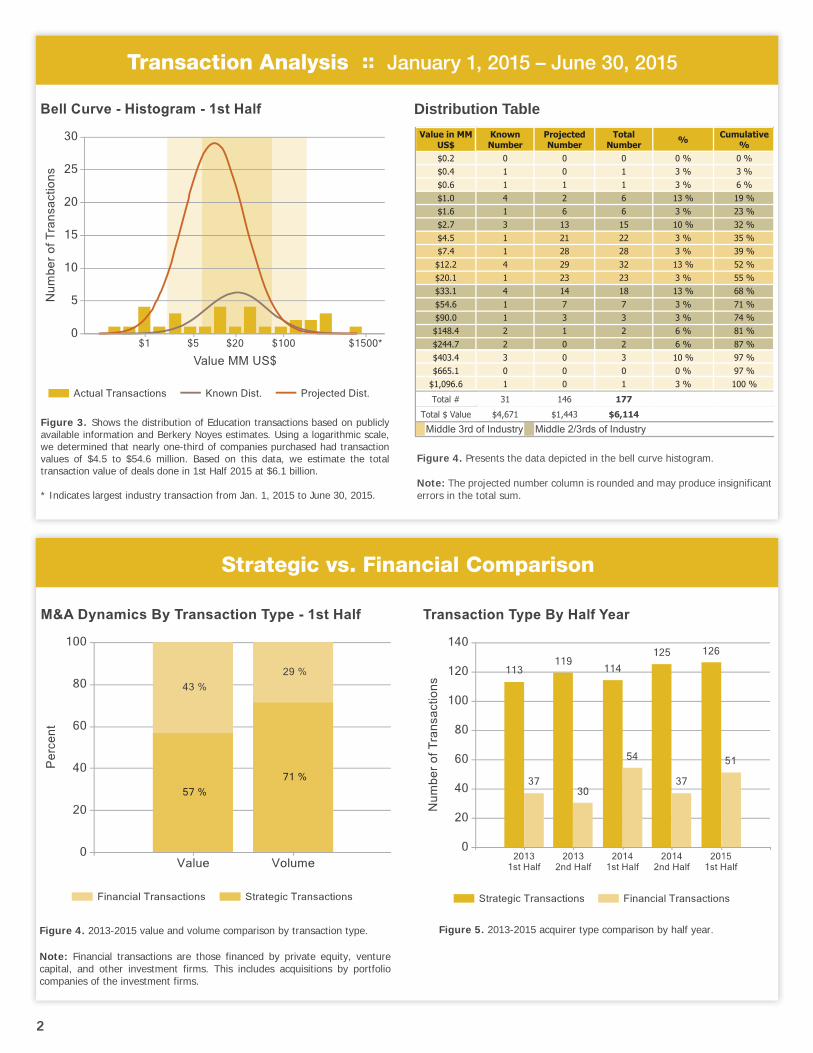
Strategic vs. Financial Comparison
Transaction Analysis :: January 1, 2015 – June 30, 2015
Figure 5. 2013-2015 acquirer type comparison by half year.Figure 4. 2013-2015 value and volume comparison by transaction type.
Note: Financial transactions are those financed by private equity, venture capital, and other investment firms. This includes acquisitions by portfolio companies of the investment firms.
Figure 3. Shows the distribution of Education transactions based on publicly available information and Berkery Noyes estimates. Using a logarithmic scale, we determined that nearly one-third of companies purchased had transaction values of $4.5 to $54.6 million. Based on this data, we estimate the total transaction value of deals done in 1st Half 2015 at $6.1 billion.
* Indicates largest industry transaction from Jan. 1, 2015 to June 30, 2015.
Distribution Table
Figure 4. Presents the data depicted in the bell curve histogram.
Note: The projected number column is rounded and may produce insignificant errors in the total sum.

Transaction Volume by Segment :: January 1, 2013 – June 30, 2015
3©2015 Berkery Noyes
Top Ten Notable Transactions - 1st Half 2015 Median EV/Revenue Multiples By Size
Figure 8. Presents the median enterprise value/revenue multiples paid forcompanies in the Education Industry from January 1, 2013 to June 30, 2015based on publicly available data.
Figure 7. Lists the top ten transactions for 1st Half 2015 and calculates their aggregate transaction value as a percentage of the total aggregate transaction value as shown in Figures 1 & 4.
Note: Transaction data based on announced date.
Deal Date Target Name Buyer Value MM US$
04/09/15 Lynda.com LinkedIn Corporation $1,500
04/24/15 Scholastic Educational Technology and Services Houghton Mifflin Harcourt $575
06/25/15 Six Schools from Meritas LLC Nord Anglia Education, Inc. $55903/19/15 OverDrive Inc. Rakuten Inc. $41006/17/15 PowerSchool Inc. Vista Equity Partners $35001/27/15 Studer Group Huron Consulting Group Inc. $325
06/18/15 Saraiva Educação from Saraiva S.A. Livreiros Editores Abril Educação SA $238
05/28/15 CTC Aviation Group Ltd L-3 Communications Holdings $22006/17/15 Promethean World PLC NetDragon WebSoft Inc. $12402/04/15 Hoing Education Group Vtron Technologies $83
2015 Aggregate Transaction Value $6,114
Top 10 Aggregate Transaction Value $4,384
Top 10 Aggregate Value as a Percentage of All Transactions 72 %
Figure 9. Presents transaction volume by market segment within the Education Industry from January 1, 2013 through June 30, 2015.
Purchaser Analysis

2 First Quarter 20112 First Q2 st Quarter 2011rst Qu ereree
One Liberty Plaza | New York, New York 10006
berkerynoyes.com | 212.668.3022
RECENT EDUCATION TRANSACTIONS
4 ©2015 Berkery Noyes
HAS FORMED AN ALLIANCEWITH
HAS BEEN ACQUIRED BY
CORPORATE TRAINING TECHNOLOGIES, LLC
HAS BEEN ACQUIRED BY
A PORTFOLIO COMPANY OF
RECAPITALIZATION WITH
HAS BEEN ACQUIRED BY
A SUBSIDIARY OF
Family Education Networkincluding
and other select assets from
HAS ACQUIRED
HAS BEEN ACQUIRED BY
HAS ACQUIRED
A BUSINESS OF
Founded in 1980, Berkery Noyes is a leading independent investment bank serving the information, software, marketing, and technology industries. Th e fi rm has initiated, managed, and
closed more than 475 merger and acquisition transactions for privately held and publicly traded companies in the healthcare,
fi nancial services, education, and entertainment markets.
Berkery Noyes is unique among investment banking fi rms in that we combine independent strategic research and actionable
intelligence with senior banking expertise.
Berkery Noyes Securities LLC assists middle market companies with raising growth capital in the debt and equity markets.
CONTACT US TODAY FOR A CONFIDENTIAL DISCUSSION OF YOUR STRATEGIC OPTIONS
212-668-3022
All charts in this report are based on data gathered by Berkery Noyes’ research department. All time period statistics are based
on the transaction announcement date. Th e information contained herein is of a general nature and is not intended to address the circumstances of any particular company, individual, or entity.
For current intelligence on Mergers and Acquisitions activity in the Information Industry please visit our online service at
www.mandasoft.com
The DNA of M&A
MANAGING DIRECTORS
PETER YOONEducation Group
MARY JO ZANDYMedia, Education, Software & Online
VINEET ASTHANAMedia & Marketing Services Group
JOHN GUZZO FinTech Group
JONATHAN KRIEGERHealthcare Group
THOMAS O’CONNORHealthcare Group
DICK O’DONNELLFinance Group
PETER OGNIBENEFinTech Group
JEFFREY SMITHHealthcare Group
PARTNERS
JOSEPH BERKERYChief Executive Offi cer
JAMES BERKERYChief Information Offi cer