Education in Sri Lanka...2018/02/05 · Sri Lanka.Colombo: IPS. Measures to Improve Education...
13
Education in Sri Lanka Ashani Abayasekara Institute of Policy Studies 27 February 2018
Transcript of Education in Sri Lanka...2018/02/05 · Sri Lanka.Colombo: IPS. Measures to Improve Education...

Education in Sri Lanka
Ashani AbayasekaraInstitute of Policy Studies
27 February 2018

Economic Policy Outlook on Education
“Education and skills development are currently inadequate to sustain growth through knowledge‐based, competitive economic activities” (Vision 2025, p. 29)
13 years of education:• STEM education• Teacher development
World class university education• S&T education
Market oriented vocational training:• Soft skills and
technical knowledge
‘Three‐pronged approach’

45% failed math
Source: Abayasekara, A. & Arunatilake, N. 2017. Better Schools for Better O‐Level Results in Sri Lanka. Colombo: IPS.

Difference between Existing and Recommended Teachers, 2016
Source: Arunatilake, N. and Abayasekara, A. 2017. Are there Good Quality Teachers for All Classrooms in Sri Lanka? Colombo: IPS.
Lack of Qualified and Experienced Teachers
‐5000
‐4000
‐3000
‐2000
‐1000
0
1000
2000
Total Qualified Experienced
Science Math

Low Tertiary Enrolments
3%
8%
5%
0% 1% 2% 3% 4% 5% 6% 7% 8% 9%
Vocational Training
Other education institutes
University
Education Enrolments of 20–24 year olds, 2014
Source: IPS, State of the Economy 2017.

Skewed Tertiary Enrolments
Source: UGC, Sri Lanka University Statistics 2015.

Low Numbers of S&T Graduates
Source: Arunatilake, N. 2016. Labour Market Analysis using Census Data. Colombo: UNFPA

Poor Soft Skills
Source: IPS, State of the Economy 2017.

Inequities in education outcomes and opportunities need more attention …
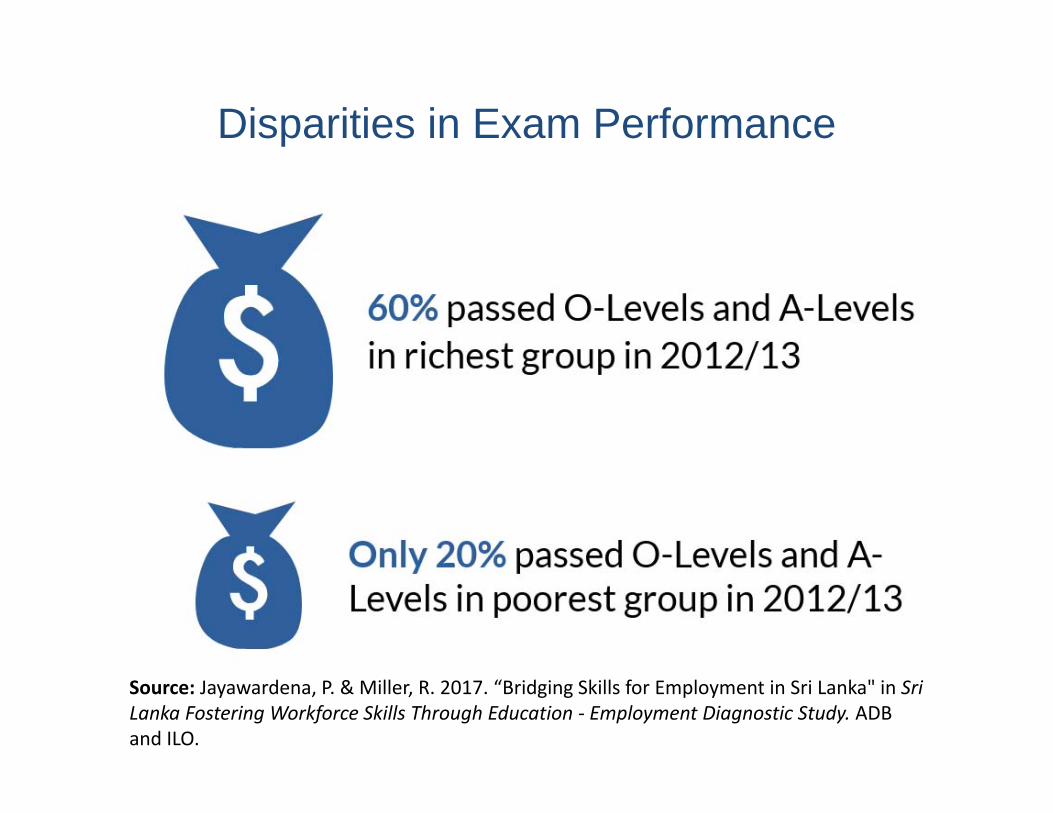
Disparities in Exam Performance
Source: Jayawardena, P. & Miller, R. 2017. “Bridging Skills for Employment in Sri Lanka" in Sri Lanka Fostering Workforce Skills Through Education ‐ Employment Diagnostic Study. ADB and ILO.

Unequal Distribution of Teachers
0.710.62 0.55
0.47 0.44
0.410.43
0.430.48
0.43
0
0.2
0.4
0.6
0.8
1
1.2
Highly privileged Privileged Not privileged Underprivileged Highlyunderprivileged
Math‐qualified Not qualified
Available Math Teachers as a Share of Recommended, 2016
Source: Abayasekara, A. & Arunatilake, N. 2017. Better Schools for Better O‐Level Results in Sri Lanka. Colombo: IPS.
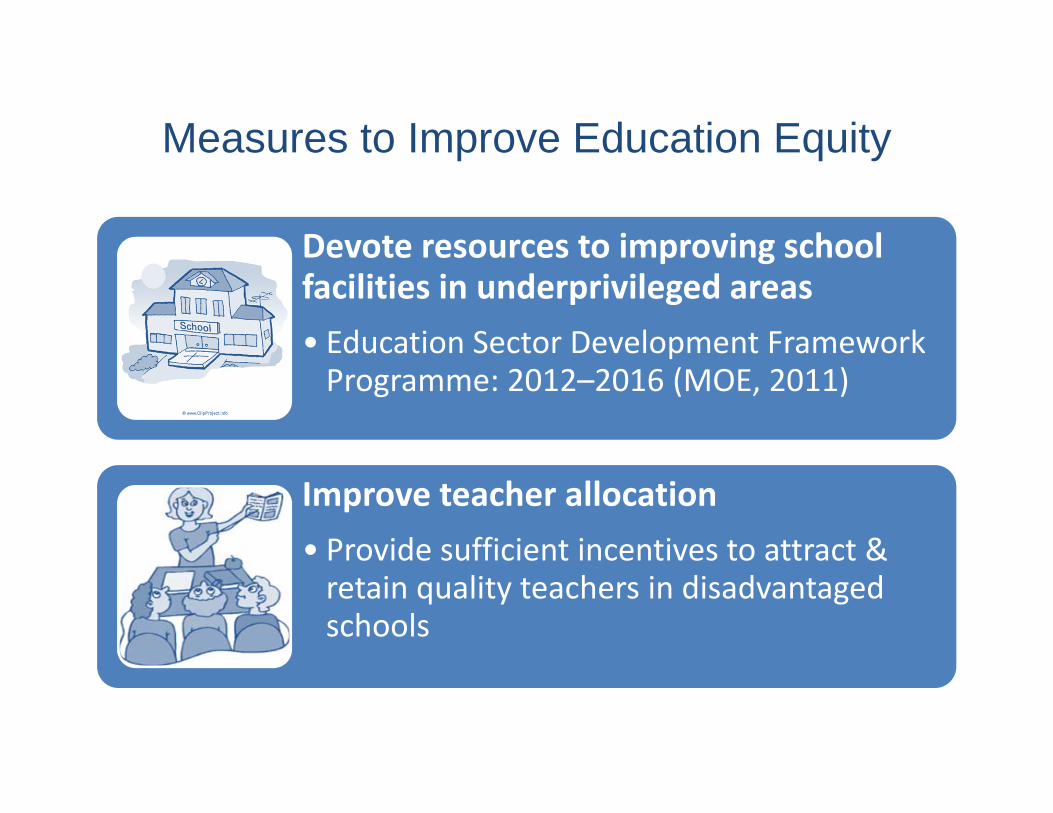
Measures to Improve Education Equity
Devote resources to improving school facilities in underprivileged areas• Education Sector Development Framework Programme: 2012–2016 (MOE, 2011)
Improve teacher allocation • Provide sufficient incentives to attract & retain quality teachers in disadvantaged schools