Education for the Future Bradley J. Geise [email protected] Using Data for Continuous School...
129
Education for the Future http://eff.csuchico.edu Bradley J. Geise [email protected] Using Data for Continuous School Improvement McKinney Independent School District
-
Upload
roderick-hodge -
Category
Documents
-
view
226 -
download
4
Transcript of Education for the Future Bradley J. Geise [email protected] Using Data for Continuous School...

Education for the Futurehttp://eff.csuchico.edu
Bradley J. [email protected]
Using Data for Conti nuousSchool Improvement
McKinney Independent School Distr ict

BACKGROUND
• Education for the Future – Non-Profit Initiative
• Victoria L. Bernhardt, Exec Director
• California State University, Chico
• Our Mission
• Funded by contracts.
• 17 Books, Conferences, Institutes, Workshop.
• Manage long-term implementation contracts.
• Monthly online meeting series.


WHY data analysis/continuous school improvement?
WHAT process/data do we need to engage for school improvement?
HOW do we involve all staff in the process of school improvement?
…focused on problem solving.
AGENDA


WHY Data Analysis/Continuous
School Improvement?
How do you define highly effective leadership? What are the
characteristics?

Instructional Coherence.
A Shared Vision forSchool Improvement.
Data-InformedDecision Making.
PRECONDITIONS FORSCHOOL IMPROVEMENT

Focus on compliance and accountability.• Top down decision making.• Personality driven.
LEADERSHIP
Focus on a real commitment to continuous
improvement.• Facilitative leadership focused on
implementation of a shared vision.• Efforts are designed to become
systemic/systematic.

VISION defines the desired or
intended future state of an
organization or enterprise in terms
of its fundamental objectives
relative to key, core areas (curr,
inst, assess, environ).

VISION
• Curriculum—What we teach.
• Instruction—How we teach the curriculum.
• Assessment—How we assess learning.
• Environment—How each person treats everyother person.

MISSION succinctly defines the
fundamental purpose of an
organization or an enterprise,
describing why they exist.

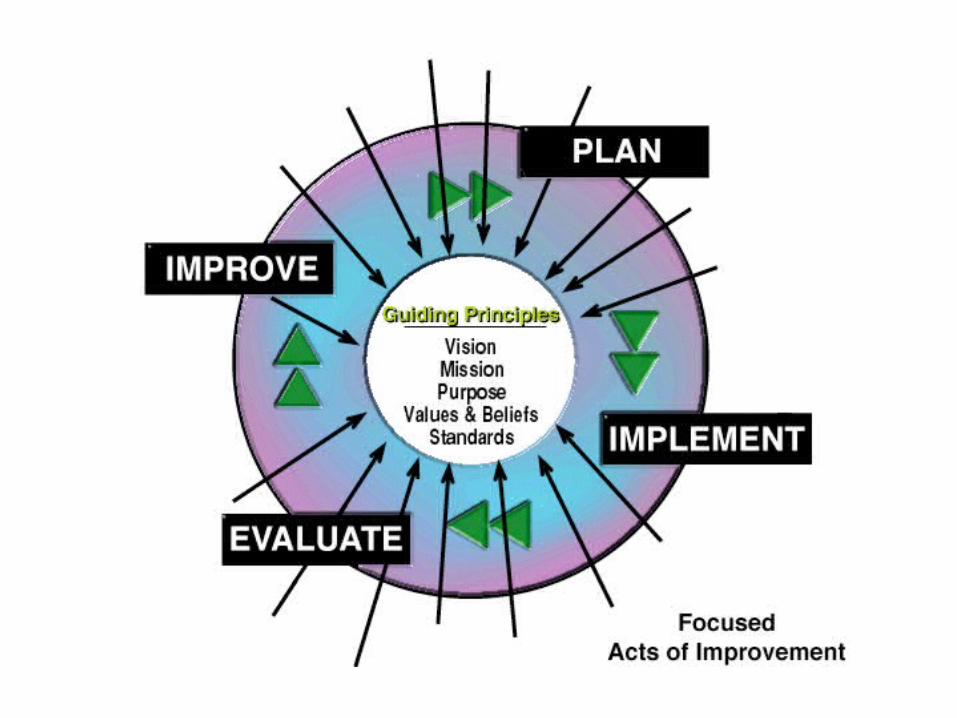
Continuous Improvement Cycle
MissionVision

Data Analysis for Continuous
School Improvement Is About
What You Are Evaluating Yourself
Against


IMPORTANT NOTES
• It describes the work that
schools do, linking the essential
elements
• It is a process of evidence,
engagement, and artifacts

VISIO
N
LEADING THE CHANGE/IMPROVEMENTPROCESS
1. Identify the change agents.
2. Empower with data to identify need(s).
3. Collaboratively prescribe change.
4. Support through prof learning,
leadership, partnerships.
5. Evaluate to make sure it is making the
intended difference.


The Data


Describe the context of the schooland school district.
Help us understand all other numbers.
Are used for disaggregatingother types of data.
Describe our system and leadership.
DEMOGRAPHICS AREIMPORTANT DATA

Enrollment
Gender
Ethnicity / Race
Attendance (Absences)
Expulsions
Suspensions
DEMOGRAPHICS

Language Proficiency
Indicators of Poverty
Special Needs/Exceptionality
IEP (Yes/No)
Drop-Out/Graduation Rates
Program Enrollment
DEMOGRAPHICS (Continued)

School and Teaching Assignment
Qualifications
Years of Teaching/At this school
Gender, ethnicity
Additional Professional
Development
STAFF DEMOGRAPHICS

WHAT STUDENT DEMOGRAPHIC DATA ELEMENTS CHANGE WHEN LEADERSHIP CHANGES?
Enrollment
Gender
Ethnicity/Race
Attendance(Absences)
Expulsions
Suspensions
Language Proficiency
Indicators of Poverty
Special Needs/ Exceptionality
IEP (Yes/No)
Drop-Out / Graduation Rates
Program Enrollment


Help us understand whatstudents, staff, and parents are perceiving about the learning environment.
We cannot act different from what we value, believe, perceive.
PERCEPTIONS AREIMPORTANT DATA

Student, Staff, Parent,Alumni Questionnaires
Observations
Focus Groups
PERCEPTIONS INCLUDE

PERCEPTIONS
What do you suppose
students say is the #1 “thing”
that has to be in place in
order for them to learn?

“I’ve got it,
too, Omar….
a strange
feeling like
we’ve just
been going
in circles.”

PERCEPTIONS
Given what we have
discussed so far, what key
measure must be a part of
any staff questionnaire?


Know what students are learning.
Understand what we are teaching.
Determine which studentsneed extra help.
STUDENT LEARNING AREIMPORTANT DATA
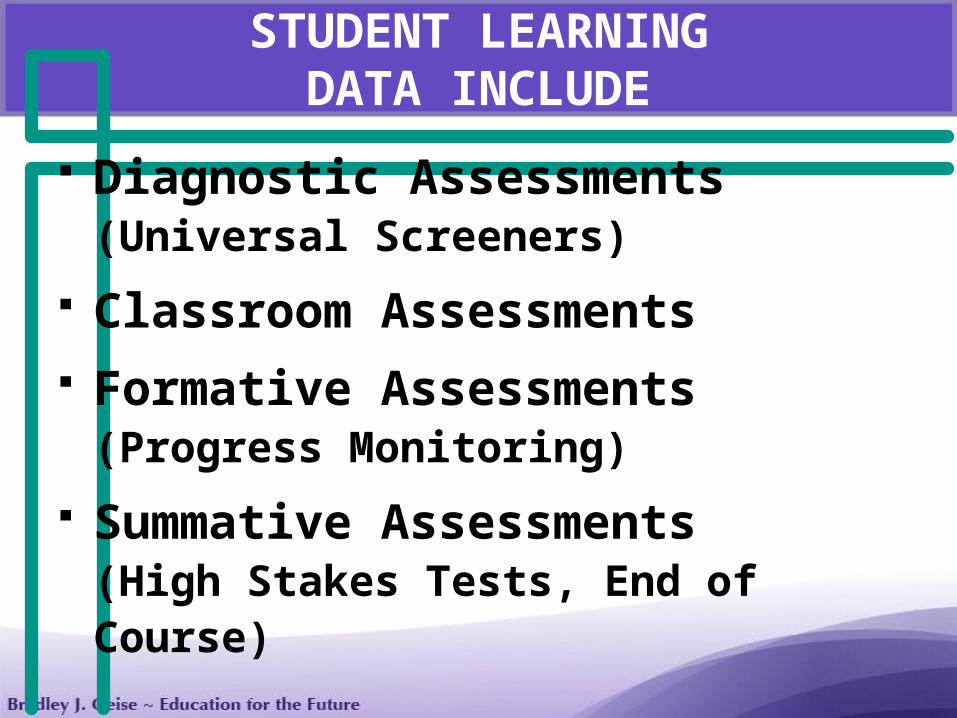
STUDENT LEARNINGDATA INCLUDE
Diagnostic Assessments(Universal Screeners)
Classroom Assessments
Formative Assessments(Progress Monitoring)
Summative Assessments(High Stakes Tests, End of Course)


What happens when learning
organizations react solely to the
measures used for compliance
and accountability?
STUDENT LEARNING AREIMPORTANT DATA


Schools are perfectly designed to
get the results they are getting now.
If schools want different results,
they must measure and then change
their processes to create the
results they really want.
SCHOOL PROCESSES

SCHOOL PROCESSES
Processes include…
Actions, changes, functions that bring about a desired result
Curriculum, instructional strategies, assessment, programs, interventions …
The way we work.

Tell us about the waywe work.
Tell us how we get theresults we are getting.
Help us know if we have instructional coherence.
SCHOOL PROCESSES AREIMPORTANT DATA

SCHOOL PROCESSES
The missing link in
improving K-12 education
The missing link in meeting
NCLB requirements


"We cannot solve our
problems with the same
thinking we used when
we created them."
Albert Einstein

CONTRIBUTING CAUSES:
Underlying cause or causes
of positive or negative results.


Not enough students
are proficient in
Mathematics.
IDENTIFY THE PROBLEM

THE PROBLEM-SOLVING CYCLEExample Hunches/Hypotheses

THE PROBLEM-SOLVING CYCLEExample Hunches/Hypotheses

What questions do you
need to answer to know
more about the problem,
and what data do
you need to gather?
THE PROBLEM-SOLVING CYCLE

THE PROBLEM-SOLVING CYCLEExample Questions/Data Needed


1. Identify a problem/
undesirable result.
2. List 20 reasons
this problem exists
(from the perspective
of your staff).
THE PROBLEM-SOLVING CYCLE

3. Determine what
questions you need
to answer with data.
4. What data do you
need to gather to
answer the questions?
THE PROBLEM-SOLVING CYCLE

THE PROBLEM-SOLVING CYCLE
Please poston chart paper.

PROBLEM SOLVING CYCLE
Evidence:
• Automatically end up at the 4 circles.
• Focus on the process(es) at the root.Engagement:
• Makes big problems manageable.
• Time savings.
• Key in making the move from
personality driven to systemic and
systematic.


Digging Deeper Into
Process
Measurement

SCHOOL PROCESSES
Schools are perfectly designed to get
the results they are getting now. If
schools want different results, they
must measure and then change their
processes to create the results they
really want.


“How can anyone be sure that a
particular set of new inputs will
produce better outputs if we
don’t at least study what
happens inside?”
Paul Black and Dylan Wiliam

If you are not monitoring
and measuring program
implementation, the
program probably
does not exist.
MONITORING SCHOOLPROGRAMS AND PROCESSES

MONITORING AND EVALUATINGPROGRAM IMPLEMENTATION
If you can describe what a
program will look like when
implemented, you can
monitor its implementation,
and evaluate its impact.


Everything
we do is a
PROCESS.

FLOWCHARTING SCHOOL PROCESSES
Assess what is really beingimplemented.
Understand how we get our results.
Determine the cause ofa problem or challenge.

Build common understandings of a whole process.
Communicate process relatedinformation visually.
Provide a way to monitor and update
processes.
FLOWCHARTING SCHOOL PROCESSES
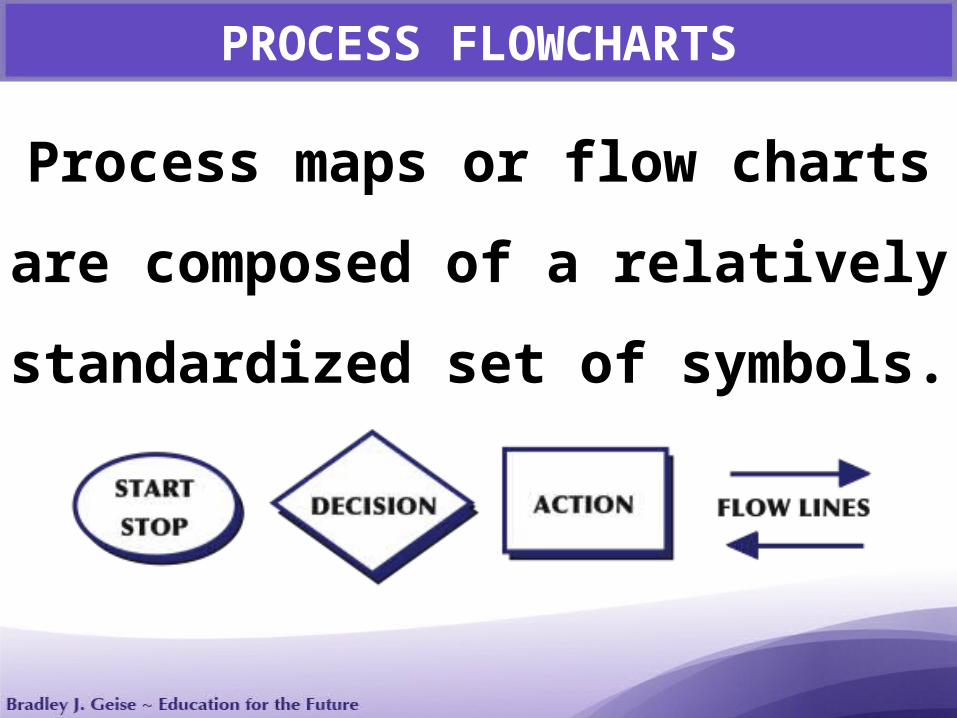
PROCESS FLOWCHARTS
Process maps or flow charts
are composed of a relatively
standardized set of symbols.

Individualstudent meets
benchmark expectations.
Yes
No
DIAMONDS ARE FOR DECISIONS

Student does need additional
assistance—staff identifies skill
deficit and matches intervention.
RECTANGLES ARE FOR ACTION


Page 63
MARYLIN AVENUE’S SHARED VISION FLOWCHART


Within your teams, please use
the mapping symbols to create
a flowchart on chart paper…
PROCESS FLOWCHARTS

FLOWCHARTING SCHOOL PROCESSES
• Empowering change.• Creating a focus on fidelity.• Considering best practice and professional learning.• Practically applying previous learning.• Considering the role of assessment and student learning data.• Provides foundation for effective monitoring and measuring.• Process allowing reflection on vision (values and beliefs).


“Shared visions emerge from
personal visions. This is how
they derive their energy and how
they foster commitment… If people
don’t have their own vision, all they
can do is ‘sign up’ for someone else’s.
The result is compliance, never
commitment.”
Peter Senge, The Fifth Discipline

BUILDING A MISSION AND VISION
• Identify values and beliefs.
• Curr, Instr, Assessment, Environment.
• Determine purpose.
• Develop mission.
• Develop shared vision to accomplish
mission.
• Create action plan.

Comprehensive Data Analysis Best Practices Learning
CREATINGA VISION AND MISSION

Using Data to Inform Mission and VisionA Process of Continuous
Improvement


BUILDING A MISSION AND VISION
• Identify values and beliefs.
• Curr, Instr, Assessment, Environment.
• Determine purpose.
• Develop mission.
• Develop shared vision to accomplish
mission.
• Create action plan.

VISION
Curriculum—What we teach.
Instruction—How we teach the curriculum.
Assessment—How we assess learning.
Environment—How each person treats everyother person.

Vision is Putting Action to Our
Values and Beliefs

…INTO A SHARED VISION
• We must collaborate to provide quality instruction.
Value/Belief:
• We will collaborate through effective implementation of ProfessionalLearning Communities.
Vision:


Continuous Improvement Cycle
MissionVision

VISION = DESTINATION
• Values and beliefs into action• Reflective of your theory of change• Must be informed by data and
research – the evidence of best
practices
• The collaboration around data to
inform vision IS getting the
agreements in place for change


The Improvement Plan as the
Evidence of Engagement

HOW ARE WE GOING TO GET THERE?
Items essential to the success of your plan:
• Bringing together implications for
planning from demographic, perception,
process, student learning data as well
as problem solving.

HOW ARE WE GOING TO GET THERE?
Items essential to the success of your plan:
• Professional development to support the plan.
• An effective leadership structure that defines
roles and responsibilities, meeting times, etc., to
carry out the plan.
• Partnerships to that are aligned to realizing the
vision.


CONTINUOUS IMPROVEMENTAND EVALUATION
“Continuous improvement
causes us to think about
upstream process improvement;
not downstream damage
control.”Teams & Tools

Align elements to vision.
Systems thinking.
Next steps.
Evaluate all parts ofthe system.
CONTINUOUS IMPROVEMENTAND EVALUATION


Information and Analysis Student Achievement Quality Planning Leadership Professional Learning Partnership Development Continuous Improvement
and Evaluation
CONTINUOUS IMPROVEMENT CONTINUUM CATEGORIES

INFORMATION AND ANALYSIS
Fall Spring
School Continuums ~ Pages 198-204

“However beautiful the strategy,
you should occasionally
look at the results.”
Winston Churchill
Former British Prime Minister
As quoted at INSEAD Knowledge

If you are not monitoring
and measuring program
implementation, the
program probably
does not exist.
MONITORING SCHOOLPROGRAMS AND PROCESSES

You cannot evaluate
a program that you
cannot describe.
EVALUATING SCHOOLPROGRAMS AND PROCESSES

MONITORING PROGRAM IMPLEMENTATION
If you can describe what a
program will look like when
implemented, you can monitor its
implementation, and evaluate its
results.


VISIO
N
LEADING THE CHANGE/IMPROVEMENTPROCESS
1. Identify the change agents.
2. Empower with data to identify need(s).
3. Collaboratively prescribe change.
4. Support through prof learning,
leadership, partnerships.
5. Evaluate to make sure it is making the
intended difference.

WHAT: Calibrating Your School ImprovementEfforts, moderated by Bradley Geise.
CALIBRATING YOUR SCHOOL IMPROVEMENT EFFORTS ONLINE MEETINGS
WHO: Open to all, at no cost.
WHEN: Once per month, approximately60 minutes.
HOW: Via Join.me

Bradley [email protected]