Education demand in the Democratic Republic of the...
22
2004/ED/EFA/MRT/PI/42 Original: French Background paper prepared for the Education for All Global Monitoring Report 2003/4 Gender and Education for All: The Leap to Equality Education demand in the Democratic Republic of the Congo Bernard Lututala Mumpasi Séraphin Ngondo a Pitshandenge 2003 This paper was commissioned by the Education for All Global Monitoring Report as background information to assist in drafting the 2003/4 report. It has not been edited by the team. The views and opinions expressed in this paper are those of the author(s) and should not be attributed to the EFA Global Monitoring Report or to UNESCO. The papers can be cited with the following reference: “Paper commissioned for the EFA Global Monitoring Report 2003/4, The Leap to Equality”. For further information, please contact [email protected]
Transcript of Education demand in the Democratic Republic of the...

Background paper prepared fo
Education for All Global Monitoring R
Gender and Education for All: The L
Education demand in the Republic of the Co
Bernard Lututala MumpasSéraphin Ngondo a Pitshande
2003
This paper was commissioned by the Education for All Global information to assist in drafting the 2003/4 report. It has not beenopinions expressed in this paper are those of the author(s) and sGlobal Monitoring Report or to UNESCO. The papers can be c“Paper commissioned for the EFA Global Monitoring Report 2further information, please contact [email protected]
2004/ED/EFA/MRT/PI/42 Original: French
r the
eport 2003/4
eap to Equality
Democratic ngo
i nge
Monitoring Report as background edited by the team. The views and hould not be attributed to the EFA ited with the following reference:
003/4, The Leap to Equality”. For

2
Education demand in Democratic Republic of the Congo
by
B. Lututala Mumpasi and S. Ngondo a Pitshandenge
Department of Demography, Kinshasa University
Introduction
Education is a fundamental right for everybody, enshrined in the Universal Declaration of Human Rights. The
Democratic Republic of the Congo (DRC) recognizes that right. According to article 9 of education outline law
no. 86/005 of 22 September 1986, for instance, “the State is duty-bound to ensure the enrolment of children in
primary education and to see to it that every adult [in DRC] knows how to read, write and calculate”.
The demand for education therefore concerns adult illiterates, the school age population and even school-
educated people requiring the occasional refresher course. While the school age population needs conventional
formal education delivered in schools, literacy programmes are rather more in demand among illiterate adults.
This paper sets out to assess the demand for schooling on the part of the above three population groups. It mainly
involves examining the needs that DRC has to meet in order to ensure that each and every citizen benefits from
his or her fundamental right to education. Those needs will be looked at in relation to the schooling supplied

3
with a view to determining the gap between supply and demand and what must be done to fill it. That gap, as we
shall see, does not stem solely from shortcomings on the supply side; demand also happens to be declining due
to factors inherent in the individuals themselves and in society as a whole.
The assessment will draw on statistical data from a number of sources: the 2001 UNICEF MICS2 survey, based
on a representative sample of 10,305 households in 365 villages and town/city neighbourhoods throughout DRC,
including in rebel-held1 parts of the country; the ministry of education’s Direction de la Planification et des
Statistiques scolaires (educational statistics and planning department 2 ); the 2000 UNESCO/DRC-funded
ENECO national education survey, based on a representative sample of 4,130 households in the provinces of
Kinshasa, Bas Congo, Bandundu and Western Kasai;3 the “Dynamique des structures familiales et l’accès des
femmes à l’éducation” survey carried out in 1998 by Lututala, Ngondo and Munkeni within the framework of the
Priority for Research on Girls and Women Education in Africa programme of the Nairobi-based African
Academy of Science Programme (AAS) – GAF4; and the 1995 MICS survey, which will serve to bring out
slightly longer term trends.
1. High levels of illiteracy
1 French : « la partie occupée » 2 OK ? 3 This survey was carried out by the Centre d’Etudes et de Recherches sur les Relations entre l’Education et la Population (CERSEP) of Kinshasa University’s Department of Demography. 4 No trace of this or the odd-looking reference number : French : « Afrique de l’Académie Africaine des Sciences (AAS) – GAF (9468 de Nairobi. »

4
In 2001, DRC had an estimated population of 51 million, including nearly nine million children of primary
school age (6-115 years). So the DRC had a massive number of individuals to enrol and keep in – or to prepare
for enrolment in – primary education
According to data from the MICS2 survey (Table 1), however, a third of the DRC population aged 15 and over
(32%) cannot read, write or, presumably6, calculate. The scale of illiteracy shows the limited scope of efforts on
the part of the State and the international community to progress towards the ideal of education for all.
Illiteracy rates are much higher among women (44%) than men (19%), and in rural areas (55% of women versus
21% of men) than in urban areas (20.6% of women versus just 7.3% of men).
Going by data supplied by UNDP in 1990 and by the first MICS survey in 1995, there was a slight rise in male
and female illiteracy in the years up to 2001. Illiteracy is seen to be increasing more in urban than in rural areas.
The 2001 figures show regional and provincial disparities to be just as pronounced as in 1995 (Table 2).
Illiterates of all ages
5 French : « dont près de 9 millions d’enfants de 1-11 ans scolarisables au niveau primaire » Have opted to present facts as they appear in line 5 of the conclusion : « Elle [la RDC] doit en effet scolariser plus ou moins 9 millions d’enfants de 6 à 11 ans ; » 6 French : « ni sans doute calculer ». No reference to any source to back this up (table 1 only covers reading and writing)

5
Table 3 shows every age group to be afflicted by illiteracy. The rate is highest among the older generations; the
conventional education system being the fairly recent fruit of colonization, they have not benefited from it as
much as younger generations. Illiteracy is more widespread among women than men, irrespective of age; the fact
is that women have never, not least during the colonial period, enjoyed the same learning opportunities as men.
The male illiteracy rate is higher among the 15-24s than the 25-54s, meaning that it has risen in DRC over the
past few years.
2. An undereducated population
Data from the MICS2 survey show that 24 per cent of people aged 15 years and over have never been to school
(Table 4); 39.1 per cent dropped out at primary level; 37 per cent reached secondary level.
So there are clearly serious deficiencies in the DRC population’s overall level of education. This is further
confirmed when gender-specific data are taken into account: nearly twice as many women as men have never
been to school (34.4 versus 12.7 percent); relatively more stop school at primary level (39 per cent versus 38.2
per cent of men); fewer are reaching secondary level (26.6 per cent versus 48.1 per cent of men); and the gender
gap tends to continue widening thereafter.
6
Table 5 shows a slight drop in the number of unschooled people between 1995 and 2001, both
in urban areas (down from 10.4 to 9.6 per cent) and in rural areas (from 37.1 to 30.8 per cent).
Primary dropout rates are rising in urban and rural areas alike. While secondary enrolment has fallen by 5.4 per
cent (from 68.1 to 62.7 per cent) in cities, rural areas have caught up somewhat in terms of access to secondary
education, a trend reflecting every other area7.
3. Gap between education supply and demand
The State, which used to have sole responsibility for delivering education in DRC, currently shares that
responsibility with other such partners as religious organizations, companies and, for some time now,8 private
individuals. Educational structures have been growing in number, with the emergent education systems allowing
plenty of room for the will and initiatives of civil society, including the various denominations. So there has been
an increase in the potential for delivering education.
Yet the education ministry’s Direction de la Planification et des Statistiques scolaires (DPSS) shows delivery of
education to be falling well short of the demand (Table 6).
7 French : « ce qui se répercute également sur le plan d’ensemble. » ?? 8 French ; « et depuis un certain temps ». Recently ? For quite some time ?
7
Indeed, just 50.3 per cent of the country’s 8,890,518 primary school age population was actually enrolled in
2000-2001. So the demand was not being met for nearly half of the children in question. This was due both to a
lack of adequate infrastructure and teaching staff, and to the fact that parents could not afford to pay for their
children’s studies. Regional disparities broadly divide the country into two unequal parts: first, the provinces
where more than 50 per cent of the demand is being met – Kinshasa, Bas Congo (66.6%), Bandundu (79.4%),
Equateur (58.6%), Orientale (55.9%) and Western Kasai (56.2%); second, those where less than 50 per cent is
being met: Maniema (47.3%), Katanga (29.4%), Eastern Kasai (29.7%), North and South Kivu (39.5% and
45.8% respectively).
These statistics confirm that the serious deficiencies in the DRC population’s overall level of education could tie
in with the education system’s continuing inability to cater to the demand or with the factors squeezing demand
among parents.
Inability to cater to the demand
Current trends in education supply and demand cannot be put down to the impoverishment of the state alone.
The fact that supply is actually increasing – and increasingly diversified – and yet non-enrolment and dropout
rates are still high and even rising goes to show that the relationship between supply and demand is multi-faceted
and complex.

8
On the one hand, classrooms are increasingly overcrowded9 and ill-equipped, with pupils forced to sit on the
floor, and teachers are underpaid and financially dependent on the parents. While the education system may be
expanding, and some school age children are not going to school, demographic pressure is such that the
education system is still incapable of catering to the demand.
Alongside the potential demand, on the other hand, effective demand is being undermined by poverty – parents
too poor to send their children to school – gradually rising non-completion rates, cultural constraints and so on.
These are the factors driving down enrolment ratios and, hence, the general level of education10.
Poverty of parents undermining demand
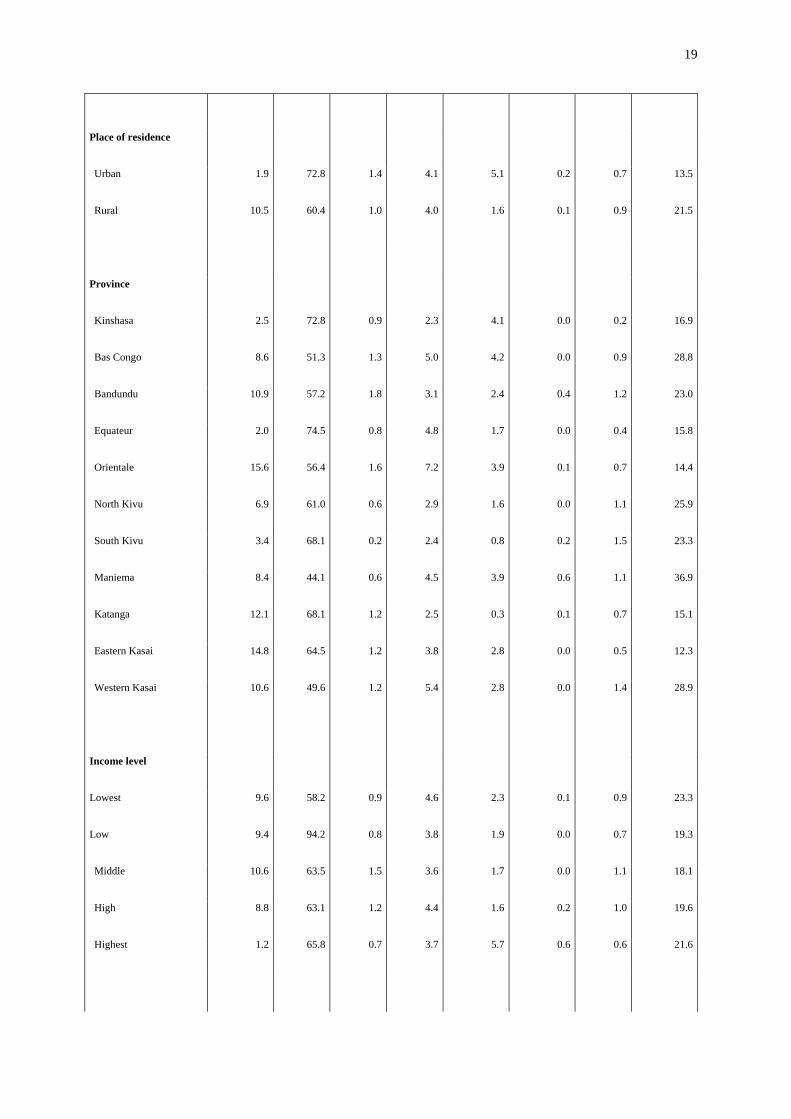
Although by no means the leading cause of the overall proportion of out-of-school children (Table 7), the fact
that parents cannot afford to pay school fees is an issue.
It mostly affects children living in urban areas, probably because that is where it is more common to find
enrolment fees being charged. The critical problem in rural areas, on the other hand, tends to be that there are too
few schools, located too far from the children’s homes.
9 By 39% in primary and 24% in secondary schools in 2001 according to the ENECO national survey of education supply and demand in DRC. 10 French : « ramènent en conséquence le niveau général à de faibles proportions »

9
School is compulsory for all DRC children aged 6-12, but because there are still fees to be paid, poverty-stricken
parents remain unable to meet such an obligation. Due to cuts in public expenditure on education, enrolment
ratios increasingly hinge on the parents’ ability to pay.
Poverty of parents and late enrolment
Because parents cannot afford to pay school fees, children tend to enrol at a later age (Table 7). The MICS2
survey shows that 31 per cent of school age children (6-14 years) have never been to school; and 14 per cent of
primary pupils – 12 per cent of girls and 16 per cent of boys – are over-age. This is not only due to the fact that
they enrol late and frequently repeat grades, of course, but also to a failure to comply with the school calendar11.
Instead of studying in the classroom, many six year-old children are out working for money or being used by
their mothers as babysitters and so on. Late primary enrolment leads to late secondary and then university
enrolment.
The poverty of parents and the current economic crisis are undermining perceptions of education. Once regarded
as the only way to achieve a certain social standing, school has not only become costly but also a road to
unemployment for increasing numbers of diploma holders. The short-term use of children for paid labour
provides a faster and less expensive means of achieving a social and economic standing previously gained
through going to school, a place now seen as an annoying waste of time. This is especially true in the artisanal
diamond and gold mining districts of Katanga, Eastern and Western Kasai and Orientale provinces, in the fishing
11 French ; « du non respect du calendrier scolaire »

10
districts Equateur, and in Bas Congo where farming work brings in substantially higher earnings than some posts
requiring educational qualifications.
Low female enrolment
The MICS2 survey statistics indicate a continuing enrolment gender gap. While the overall net enrolment ratio
stands at 51.7 per cent, it comes to 54.8 per cent among boys and 48.6 per cent among girls. Education demand
is lower among girls than boys.12
The gender gap widens from the age of nine years, when more girls appear to drop out of school in favour of
domestic chores, paid labour and, later on, marriage.13
Infrastructure14 as a factor of low demand in some provinces
The MICS2 survey repeatedly draws attention to significant gaps in enrolment ratios and levels of education
from one province to the next.15 Illiteracy rates, for instance, range from 10.5 per cent in Kinshasa to 48 per cent
12 Almost twice as many women as men, remember, have never been to school (34.3% versus 12.1%) and a relatively larger proportion stop school early (primary and secondary). 13 The fact that parents tend to choose which children to send to school according to gender, with the preferred choice for girls being marriage rather than education, was noted as early as in 1996 (Lututala, Ngondo and Munkeni, 1996). 14 French : « implantation scolaire »

11
in the eastern province of North Kivu; from 14.5 per cent of women in Kinshasa to 60.7 per cent of women in
North Kivu and Equateur. Net primary enrolment ratios peak at 60.6 per cent in Kinshasa and drop to 34 per cent
in North Kivu.
Infrastructure and schooling differ in different provinces. In the past, the population’s access to education
depended on avenues of communication and how long the colonial and missionary systems had been in force16.
Some encounter greater difficulties in regard to schooling than others: remote and isolated provinces where non-
payment of teachers is rife, where infrastructure has been destroyed or where the population is involved in
artisanal mining activities (gold, diamonds, cassiterite, coltan, etc.). In 1996, the EGE (Etats Généraux de
l’Enseignement) education authority remarked that the education system’s shortcomings included “inadequate
and run-down infrastructure, very unevenly distributed throughout the land”.
Low internal efficiency of the education system
Among the noteworthy factors leading to the poor results in regard to the level of education in DRC is the
education system’s low internal efficiency, which tends to drive down the general enrolment ratio. Indeed, just
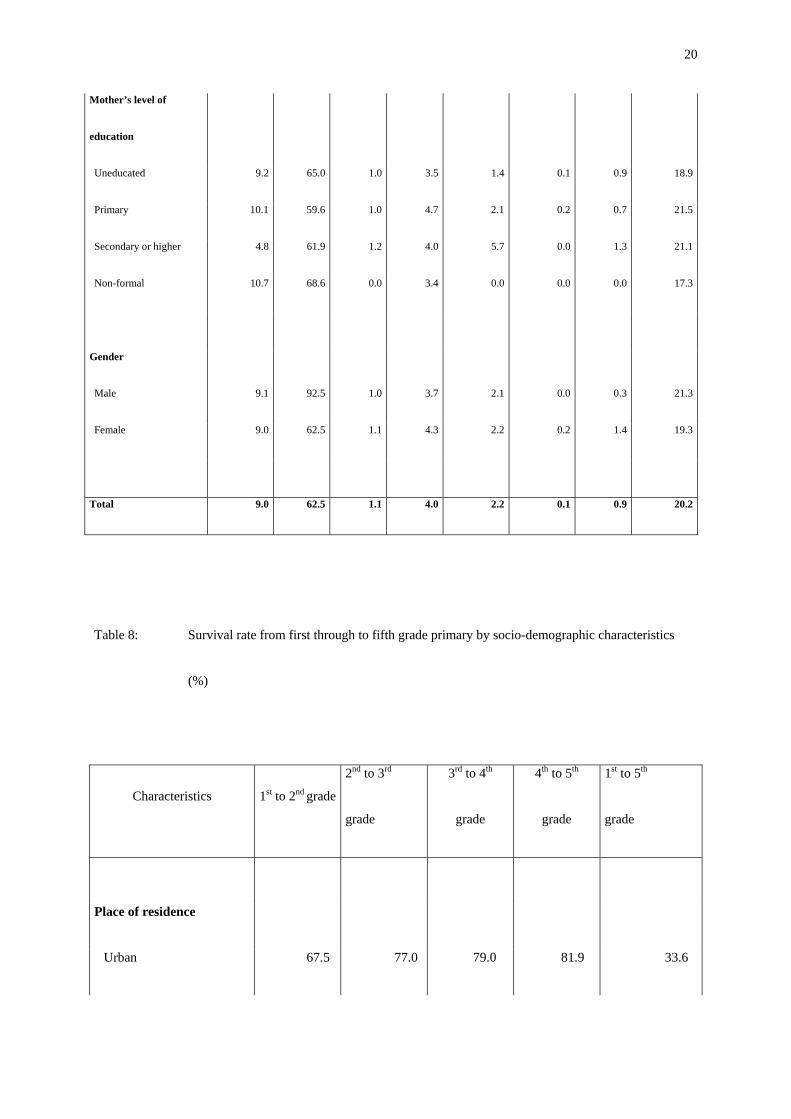
25 per cent of pupils entering first grade primary survive through to fifth grade (Table 8). Non-completion rates
15 French : « L’enquête MICS2 fait observer à plusieurs reprises des écarts importants des niveaux de scolarisation ou d’éducation d’une province à l’autre. Qu’il s’agisse de l’analphabétisme, du niveau d’instruction, ou de la scolarisation des enfants. » Couldn’t work out the point of 2nd sentence. Cut. 16 French : « Parmi les facteurs explicatifs, on peut mentionner l’implantation scolaire et la scolarisation sont différentielles selon la province : voie de communication, ancienneté de pénétration coloniale et missionnaire déterminent les possibilités d’accès de la population à l’éducation dans le passé. »

12
also affect secondary and higher levels of education through to university, and to an even greater degree.17 The
higher the level, then, the greater the degree to which a selection process is at work in the DRC education
system.
Conclusion
DRC, on account of the size of its population, faces enormous demand for schooling. Apart from the thousands
of people unable to read and write, it must cater to the schooling needs of nine million or so school-age children
(6-11 years): an entire republic18. Only 52 per cent of the demand is being met as far as the latter are concerned
because there are too few schools, classrooms, teachers and so on; and because school is unfortunately seen in a
somewhat disparaging light or as an unattainable goal due to poverty – with parents unable to afford to pay the
fees – the persistence of traditional gender roles – with girls being directed more towards marriage than
education – and the significant backwardness in some provinces of an education system whose internal
efficiency is low – with an out-of-school population running into the thousands. It may be true to say that the
demand can only be met, thus giving every member of the population the chance to benefit from their
fundamental right to education, by building or rehabilitating schools and paying teachers a decent salary. But
that demand also needs to be stimulated and sustained by empowering parents with the income to be able to pay
for their children’s studies, and to ensure that they pursue those studies in the best possible conditions.
17 Indeed, it is not rare to find pass rates of less than 20 per cent in the first and second years of the graduat non-university diploma courses in technical or administration studies at some Kinshasa University faculties, for example (cf. Rapport des Jurys, 2000 – 2001). 18 French : « Elle doit en effet scolariser plus ou moins 9 millions d’enfants de 6 à 11 ans ; c’est toute une république ! »

13
In the long run, we suggest that further surveys look into what becomes of the thousands of children dropping
out of, being excluded from or failing to make the grade in the education system. There are several possible
scenarios. They may become illiterate, in which case it would be interesting to find out how long it takes them to
do so. Such information would help identify another category of needs to be met by literacy learning or, better
still, retraining19 programmes. It would also be interesting to see how the dropouts, failures and others excluded
from the system enter the employment market; what sort of jobs they go into after leaving school; how useful the
knowledge learnt in the classroom is to them in their everyday performance in the workplace. Such information
would be helpful in efforts to eventually adjust school curricula to society’s needs.
Bibliography
B. Lututala, S. Ngondo and B. Munkeni, 1996. “Dynamique des Structures familiales et Accès des femmes à
l’éducation au Zaïre. Cas de la ville de Kinshasa (DYFAFE)”, survey carried out within the framework of the
Pority for Research on Girls and Women Education in Africa programme of the African Academy of Science
Programme (AAS) – GAF 646820, Kinshasa (115 p.).
Democratic Republic of the Congo/UNICEF, 2001. National MICS survey on the situation of children and
women in the DRC. Analysis report, Kinshasa (233 p.).
19 French : « programmes d’alphabétisation, ou mieux de recyclage. » 20 No trace of this ref.

14
Democratic Republic of the Congo/UNICEF/UNDP/WHO, 1996. National survey on the situation of children
and women in Zaire in 1995. Final report. Kinshasa, 1996 (166 p.).
Tables
Table 1. Percentage of illiterates aged 15 and over by gender and by place of residence (1990, 1995, 2001).
Year Rural areas Urban areas Total
Male Female Total Male Female Total Male Female Total
1990 16.4 39.3 28.2
1995 3.3 12.9 8.5 23.4 59.9 42.8 17.5 45.9 32.7
2001 7.3 20.6 14.1 24.4 55.0 44.1 14.1 40.3 32.0
Table 2. Percentage of illiterates aged 15 by province (1995, 2001).
1995 2001
Province Male Female Total Male Female Total

15
Kinshasa 3.2 10.8 7.4 6.0 14.5 10.5
Bas Congo 9.5 31.0 20.9 16.7 41.8 30.0
Bandundu 14.6 43.9 30.4 16.4 41.1 29.5
Equateur 24.6 63.5 44.8 24.4 60.7 43.4
Orientale 29.1 57.9 44.9 20.6 46.7 34.2
34.8 60.0 47.8
22.1 53.7 38.3
Ex-21Kivu
26.7
65.3
47.1
18.0 52.8 35.3
Katanga 12.4 44.6 29.5 22.5 48.9 36.0
Eastern Kasai 13.4 36.5 25.2
Western Kasai
15.5
44.8
31.1 15.9 43.2 29.8
Total 17.5 45.9 32.7 18.8 44.1 31.9
Table 3. Percentage of illiterates aged 15 and over by gender and by age.
Age Male Female Total
15 – 24 yrs 21.7 35.7 28.9
25 – 34 yrs 13.8 36.5 26.2
21 ?

16
35 – 44 yrs 13.9 46.0 30.0
45 – 54 yrs 17.7 57.2 37.6
55 – 64 yrs 24.4 72.8 50.0
65 + yrs 37.4 82.7 59.9
Total 18.8 44.1 31.9
Table 4. Level of education among people aged 15 and over by place of residence and gender in 2001 (%).
Urban areas Rural areas Total Level of
education Male Female Total Male Female Total Male Female Total
Uneducated
Primary
Secondary
and higher
5.1
23.5
71.4
13.9
31.7
54.4
9.6
27.7
62.7
16.2
46.8
37.0
44.1
42.4
13.5
30.8
44.5
24.7
12.7
38.2
48.1
34.4
39.0
26.6
23.9
39.1
37.0

17
Total 100.0 100.0 100.0 100.0 100.0 100.0 100.0 100.0 100.0
Table 5: Level of education among people aged 15 and over by place of residence in 1995 and 2001 (%)
Urban areas Rural areas Total Level of education
1995 2001 1995 2001 1995 2001
Uneducated 10.4 9.6 37.1 30.8 23.6 23.9
Primary 21.5 27.7 41.1 44.5 39.1 39.1
Secondary and higher 68.1 62.7 21.8 24.7 35.8 37.0
Total 100 100 100 100 100 100
Table 6: Gap between supply and demand in 2000 – 2001 by province.
% of population
Province
Number of school
age children School age Enrolled Non-enrolled
Kinshasa 1,147,618 12.9 6.7 6.2

18
Bas Congo 527,977 5.9 3.9 2.0
Bandundu 995,885 11.2 8.9 2.3
Equateur 917,605 10.3 6.0 4.3
Orientale 944,656 10.6 5.9 4.7
North Kivu 751,602 8.5 3.3 5.2
South Kivu 645,067 7.3 3.3 4.0
Maniema 211,724 2.4 1.1 1.3
Katanga 1,247,820 14.1 4.2 9.9
E. Kasai 804,590 9.0 2.7 6.3
W. Kasai 695,974 7.8 4.4 3.4
DRC 8,890,518 100 50.3 49.7
Source: Ministry of Education, Direction de la Planification et des Statistiques scolaires, Kinshasa, August
2001.
Table 7: Out of school children aged 6-14 by reasons given and socio-demographic characteristics
Reasons for non-attendance
Characteristics No local
schools
Can’t
afford fees
Failing
exams
Prolonged
illness
Moving
home
Pregnancy Working Others
19
Place of residence
Urban 1.9 72.8 1.4 4.1 5.1 0.2 0.7 13.5
Rural 10.5 60.4 1.0 4.0 1.6 0.1 0.9 21.5
Province
Kinshasa 2.5 72.8 0.9 2.3 4.1 0.0 0.2 16.9
Bas Congo 8.6 51.3 1.3 5.0 4.2 0.0 0.9 28.8
Bandundu 10.9 57.2 1.8 3.1 2.4 0.4 1.2 23.0
Equateur 2.0 74.5 0.8 4.8 1.7 0.0 0.4 15.8
Orientale 15.6 56.4 1.6 7.2 3.9 0.1 0.7 14.4
North Kivu 6.9 61.0 0.6 2.9 1.6 0.0 1.1 25.9
South Kivu 3.4 68.1 0.2 2.4 0.8 0.2 1.5 23.3
Maniema 8.4 44.1 0.6 4.5 3.9 0.6 1.1 36.9
Katanga 12.1 68.1 1.2 2.5 0.3 0.1 0.7 15.1
Eastern Kasai 14.8 64.5 1.2 3.8 2.8 0.0 0.5 12.3
Western Kasai 10.6 49.6 1.2 5.4 2.8 0.0 1.4 28.9
Income level
Lowest 9.6 58.2 0.9 4.6 2.3 0.1 0.9 23.3
Low 9.4 94.2 0.8 3.8 1.9 0.0 0.7 19.3
Middle 10.6 63.5 1.5 3.6 1.7 0.0 1.1 18.1
High 8.8 63.1 1.2 4.4 1.6 0.2 1.0 19.6
Highest 1.2 65.8 0.7 3.7 5.7 0.6 0.6 21.6
20
Mother’s level of
education
Uneducated 9.2 65.0 1.0 3.5 1.4 0.1 0.9 18.9
Primary 10.1 59.6 1.0 4.7 2.1 0.2 0.7 21.5
Secondary or higher 4.8 61.9 1.2 4.0 5.7 0.0 1.3 21.1
Non-formal 10.7 68.6 0.0 3.4 0.0 0.0 0.0 17.3
Gender
Male 9.1 92.5 1.0 3.7 2.1 0.0 0.3 21.3
Female 9.0 62.5 1.1 4.3 2.2 0.2 1.4 19.3
Total 9.0 62.5 1.1 4.0 2.2 0.1 0.9 20.2
Table 8: Survival rate from first through to fifth grade primary by socio-demographic characteristics
(%)
Characteristics 1st to 2nd grade
2nd to 3rd
grade
3rd to 4th
grade
4th to 5th
grade
1st to 5th
grade
Place of residence
Urban 67.5 77.0 79.0 81.9 33.6

21
Rural 52.4 70.7 74.0 75.9 20.8
Province
Kinshasa 73.3 83.8 81.7 82.0 41.1
Bas Congo 59.2 74.6 70.4 81.1 25.2
Bandundu 63.2 86.6 84.8 87.9 40.7
Equateur 48.4 66.5 62.7 76.3 15.4
Orientale 51.9 68.9 77.5 69.3 19.2
North Kivu 396 42.3 55.3 57.7 5.3
South Kivu 62.2 61.5 66.9 71.4 18.3
Maniema 55.1 740 78.6 84.0 26.9
Katanga 49.7 66.3 72.7 76.1 18.2
Eastern Kasai 59.1 78.6 82.0 83.7 31.9
Western Kasai 644 82.1 85.7 84.3 38.2
Income level
Lowest 47.2 67.7 72.3 77.5 17.9
Low 51.9 63.6 74.4 78.9 19.4
Middle 55.6 69.4 75.7 72.7 21.2
Higher 58.0 74.6 74.6 79.5 25.7

22
Highest 72.4 85.7 80.3 81.6 40.7
Gender
Male 57.8 72.9 76.2 79.2 25.5
Female 55.9 72.8 75.8 77.8 24.0
Total 56.9 72.9 76.0 78.6 24.8