Education at a Glance 2012: Highlights - OECD
91
Education at a Glance 2012 HIGHLIGHTS
Transcript of Education at a Glance 2012: Highlights - OECD

Education at a Glance 2012
HIGHLIGHTS

This work is published on the responsibility of the Secretary-General of the OECD. The
opinions expressed and arguments employed herein do not necessarily reflect the official
views of the Organisation or of the governments of its member countries.
This document and any map included herein are without prejudice to the status of or
sovereignty over any territory, to the delimitation of international frontiers and boundaries
and to the name of any territory, city or area.
ISBN 978-92-64-17956-1 (print)ISBN 978-92-64-17957-8 (HTML)
Series: Education at a GlanceISSN 2076-2631 (print)ISSN 2076-264X (online)
The statistical data for Israel are supplied by and under the responsibility of the relevant Israeli authorities. The useof such data by the OECD is without prejudice to the status of the Golan Heights, East Jerusalem and Israelisettlements in the West Bank under the terms of international law.
Photo credits: Cover © Carlos Restrepo/Fotolia.Images: Chapter 1 © Jeffrey Coolidge/The Image Bank/Getty Images.
Chapter 2 © Tom Grill/Photographer’s Choice RF/Getty Images.Chapter 3 © Julia Smith/Riser/Getty Images.Chapter 4 © Image Source/Image Source/Getty Images.Chapter 5 © Digital Vision/Inmagine ltd.
Corrigenda to OECD publications may be found on line at: www.oecd.org/publishing/corrigenda.
© OECD 2012
You can copy, download or print OECD content for your own use, and you can include excerpts from OECD publications, databases and
multimedia products in your own documents, presentations, blogs, websites and teaching materials, provided that suitable
acknowledgement of OECD as source and copyright owner is given. All requests for public or commercial use and translation rights should
be submitted to [email protected]. Requests for permission to photocopy portions of this material for public or commercial use shall be
addressed directly to the Copyright Clearance Center (CCC) at [email protected] or the Centre français d’exploitation du droit de copie (CFC)
Please cite this publication as:OECD (2012), Education at a Glance 2012: Highlights, OECD Publishing.http://dx.doi.org/10.1787/eag_highlights-2012-en

FOREWORD
Foreword
Education at a Glance 2012: Highlights offers a reader-friendly introduction to the OECD’s collection
of internationally comparable data on education.
As the name suggests, it is derived from Education at a Glance 2012, the OECD’s flagship
compendium of education statistics. However, it differs from that publication in a number of ways,
most significantly in its structure, which is made up of five sections that explore the following topics:
● Education levels and student numbers: This section looks at education levels in the general
population, how and where young people are studying and how well they make the transition into
the world of work.
● The economic and social benefits of education: This section looks at the extent to which
education brings economic gains to individuals, in the form of higher incomes and lower
unemployment rates, and at how these benefits serve as an incentive for people and societies to
invest in education. It also examines the societal benefits related to having a highly educated
population.
● Paying for education: This section looks at how much countries spend on education, the role of
private spending, what education money is spent on and whether countries are getting value for
money.
● The school environment: This section looks at how much time teachers spend at work, and how
much of that time is spent teaching, class sizes, teachers’ salaries and the age and gender
distribution of teachers.
● Equity: This special section looks at issues relating to equity in education, particularly the
accessibility of education at all levels, intergenerational mobility, gender gaps in education and the
impact of socio-economic background on student performance, especially for the children of
immigrants.
In general, this publication uses the terminology employed in Education at a Glance 2012.
However, in one or two places terminology has been simplified. Readers who want to find out more
should consult the “Reader’s Guide”.
Tables and figures in this volume are accompanied by a dynamic hyperlink, or StatLink, that
will direct readers to an Internet site where the corresponding data are available in ExcelTM format.
In addition, reference is sometimes made in the text to figures and tables that appear in Education
at a Glance 2012. This material can generally be accessed via the StatLinks accompanying the
tables and figures in the relevant indicator, or at www.oecd.org/edu/eag2012.
Readers wishing to find out more about the OECD’s work on education should go to
www.oecd.org/edu.
EDUCATION AT A GLANCE 2012: HIGHLIGHTS © OECD 2012 3


TABLE OF CONTENTS
Table of Contents
Reader’s guide . . . . . . . . . . . . . . . . . . . . . . . . . . . . . . . . . . . . . . . . . . . . . . . . . . . . . . . . . . . . . 7
1. Education levels and student numbers . . . . . . . . . . . . . . . . . . . . . . . . . . . . . . . . . . . . 11
To what level have adults studied? . . . . . . . . . . . . . . . . . . . . . . . . . . . . . . . . . . . . . . . . 12
Who participates in education? . . . . . . . . . . . . . . . . . . . . . . . . . . . . . . . . . . . . . . . . . . . 14
How many young people finish secondary education?. . . . . . . . . . . . . . . . . . . . . . . . 16
How many young people enter tertiary education? . . . . . . . . . . . . . . . . . . . . . . . . . . 18
How many young people graduate from tertiary education?. . . . . . . . . . . . . . . . . . . 20
How successful are students in moving from education to work? . . . . . . . . . . . . . . 22
How many students study abroad and where do they go?. . . . . . . . . . . . . . . . . . . . . 24
2. The economic and social benefits of education . . . . . . . . . . . . . . . . . . . . . . . . . . . . . 27
How much more do tertiary graduates earn?. . . . . . . . . . . . . . . . . . . . . . . . . . . . . . . . 28
How does education affect employment rates? . . . . . . . . . . . . . . . . . . . . . . . . . . . . . . 30
What are the incentives for people to invest in education?. . . . . . . . . . . . . . . . . . . . 32
What are the incentives for societies to invest in education? . . . . . . . . . . . . . . . . . . 34
What are the social benefits of education?. . . . . . . . . . . . . . . . . . . . . . . . . . . . . . . . . . 36
How does education affect the economy? . . . . . . . . . . . . . . . . . . . . . . . . . . . . . . . . . . 38
3. Paying for education . . . . . . . . . . . . . . . . . . . . . . . . . . . . . . . . . . . . . . . . . . . . . . . . . . . . 41
How much is spent per student? . . . . . . . . . . . . . . . . . . . . . . . . . . . . . . . . . . . . . . . . . . 42
Has spending per student increased? . . . . . . . . . . . . . . . . . . . . . . . . . . . . . . . . . . . . . . 44
What share of national wealth is spent on education? . . . . . . . . . . . . . . . . . . . . . . . 46
What share of public spending goes to education? . . . . . . . . . . . . . . . . . . . . . . . . . . . 48
What is the role of private spending? . . . . . . . . . . . . . . . . . . . . . . . . . . . . . . . . . . . . . . 50
How much do tertiary students pay?. . . . . . . . . . . . . . . . . . . . . . . . . . . . . . . . . . . . . . . 52
What are education funds spent on?. . . . . . . . . . . . . . . . . . . . . . . . . . . . . . . . . . . . . . . 54
How much do teachers cost? . . . . . . . . . . . . . . . . . . . . . . . . . . . . . . . . . . . . . . . . . . . . . 56
4. The school environment. . . . . . . . . . . . . . . . . . . . . . . . . . . . . . . . . . . . . . . . . . . . . . . . . 59
How long do students spend in the classroom?. . . . . . . . . . . . . . . . . . . . . . . . . . . . . . 60
How many students are in each classroom? . . . . . . . . . . . . . . . . . . . . . . . . . . . . . . . . 62
How much are teachers paid?. . . . . . . . . . . . . . . . . . . . . . . . . . . . . . . . . . . . . . . . . . . . . 64
How much time do teachers spend teaching? . . . . . . . . . . . . . . . . . . . . . . . . . . . . . . . 66
Who are the teachers? . . . . . . . . . . . . . . . . . . . . . . . . . . . . . . . . . . . . . . . . . . . . . . . . . . . 68
EDUCATION AT A GLANCE 2012: HIGHLIGHTS © OECD 2012 5

TABLE OF CONTENTS
5. Special section: Equity . . . . . . . . . . . . . . . . . . . . . . . . . . . . . . . . . . . . . . . . . . . . . . . . . . 71
What is equity in education? . . . . . . . . . . . . . . . . . . . . . . . . . . . . . . . . . . . . . . . . . . . . . 72
Access to early childhood education . . . . . . . . . . . . . . . . . . . . . . . . . . . . . . . . . . . . . . . 74
Access to secondary and tertiary education. . . . . . . . . . . . . . . . . . . . . . . . . . . . . . . . . 76
Access to the labour market . . . . . . . . . . . . . . . . . . . . . . . . . . . . . . . . . . . . . . . . . . . . . . 78
Access to lifelong learning . . . . . . . . . . . . . . . . . . . . . . . . . . . . . . . . . . . . . . . . . . . . . . . 80
Does parental education affect students’ chances? . . . . . . . . . . . . . . . . . . . . . . . . . . 82
Integrating immigrants’ children . . . . . . . . . . . . . . . . . . . . . . . . . . . . . . . . . . . . . . . . . . 84
Reducing the gender gap . . . . . . . . . . . . . . . . . . . . . . . . . . . . . . . . . . . . . . . . . . . . . . . . . 86
Statistical note . . . . . . . . . . . . . . . . . . . . . . . . . . . . . . . . . . . . . . . . . . . . . . . . . . . . . . . . . . . . . 89
EDUCATION AT A GLANCE 2012: HIGHLIGHTS © OECD 20126

READER’S GUIDE
Reader’s guide
This section introduces some of the terminology used in this publication, and explains
how readers can use the links provided to get further information.
Levels of educationEducation systems vary considerably from country to country, including the ages at
which students typically begin and end each phase of schooling, the duration of courses and
what students are taught and expected to learn. These variations greatly complicate the
compilation of internationally comparable statistics on education. In response, the United
Nations created an International Standard Classification of Education (ISCED), which
provides a basis for comparing different education systems and a standard terminology.
The table below introduces this system of classification and explains what is meant by
each level of education. Readers should note that this publication uses slightly simplified
terminology, which differs from that used in both the ISCED classification and in Education
at a Glance 2012. The table shows the equivalent terms in the two publications, the ISCED
classifications and definitions of what it all means.
Term used to describe levels of educationin Education at a Glance 2012ISCED classification (and subcategories)
Term generally used in this publication
Pre-primary educationISCED 0.
Pre-primary educationThe first stage of organised instruction designed to introduce very young children to the school atmosphere. Minimum entry age of 3.
Primary educationISCED 1.
Primary educationDesigned to provide a sound basic education in reading, writing and mathematics and a basic understanding of some other subjects. Entry age: between 5 and 7. Duration: 6 years.
Lower secondary educationISCED 2 (subcategories: 2A prepares students for continuing academic education, leading to 3A; 2B has stronger vocational focus, leading to 3B; 2C offers preparation for entering workforce).
Lower secondary educationCompletes provision of basic education, usually in a more subject-oriented way with more specialist teachers. Entry follows 6 years of primary education; duration is 3 years. In some countries, the end of this level marks the end of compulsory education.
Upper secondary educationISCED 3 (subcategories: 3A prepares students for university-level education at level 5A ; 3B for entry to vocationally oriented tertiary education at level 5B; 3C prepares students for workforce or for post-secondary non tertiary education, ISCED 4).
Upper secondary educationEven stronger subject specialisation than at lower-secondary level, with teachers usually more qualified. Students typically expected to have completed 9 years of education or lower secondary schooling before entry and are generally around the age of 15 or 16.
Post-secondary non-tertiary educationISCED 4 (subcategories: 4A may prepare students for entry to tertiary education, both university level and vocationally oriented education; 4B typically prepares students to enter the workforce).
Post-secondary non-tertiary educationProgrammes at this level may be regarded nationally as part of upper secondary or post-secondary education, but in terms of international comparison their status is less clear-cut. Programme content may not be much more advanced than in upper secondary, and is certainly lower than at tertiary level. Entry typically requires completion of an upper secondary programme. Duration usually equivalent to between 6 months and 2 years of full-time study.
EDUCATION AT A GLANCE 2012: HIGHLIGHTS © OECD 2012 7

READER’S GUIDE
For fuller definitions and explanations of the ISCED standard, please consult Classifying
Education Programmes: Manual for ISCED-97 Implementation in OECD Countries (1999).
Country coverageOECD and partner countries: This publication features data on education from the
34 OECD member countries, two non-OECD countries that participate in the OECD Indicators
of Education Systems Programme (INES), namely Brazil and the Russian Federation, and
other G20 countries that do not participate in INES (Argentina, China, India, Indonesia,
Saudi Arabia and South Africa).
Belgium: Data on Belgium may be applicable only to either the Flemish Community or
the French Community. Where this is the case, the text and figures refer to Belgium (Fl.) for
the Flemish Community and Belgium (Fr.) for the French community.
EU21: These are the 21 OECD countries for which data are available or can be
estimated that are members of the European Union: Austria, Belgium, the Czech Republic,
Denmark, Estonia, Finland, France, Germany, Greece, Hungary, Ireland, Italy, Luxembourg,
the Netherlands, Poland, Portugal, Slovenia, the Slovak Republic, Spain, Sweden and the
United Kingdom.
G20: These are Argentina, Australia, Brazil, Canada, China, France, Germany, India,
Indonesia, Italy, Japan, Korea, Mexico, the Russian Federation, Saudi Arabia, South Africa,
Turkey, the United Kingdom, the United States and the European Union (which is not
included in the G20 average).
Tertiary educationISCED 5 (subcategories 5A and 5B, see below).
Tertiary educationISCED 5 is the first stage of tertiary education (the second– ISCED 6 – involves advanced research). At level 5, it is often more useful to distinguish between two subcategories: 5A, which represents longer and more theoretical programmes; and 5B, where programmes are shorter and more practically oriented. Note, though, that as tertiary education differs greatly between countries, the demarcation between these two subcategories is not always clear-cut.
Tertiary-type AISCED 5A.
University-level education“Long-stream” programmes that are theory based and aimed at preparing students for further research or to give access to highly skilled professions, such as medicine or architecture. Entry preceded by 13 years of education, students typically required to have completed upper secondary or post-secondary non-tertiary education. Duration equivalent to at least 3 years of full-time study, but 4 is more usual.
Tertiary-type BISCED 5B.
Vocationally oriented tertiary education“Short-stream” programmes that are more practically oriented or focus on the skills needed for students to directly enter specific occupations. Entry preceded by 13 years of education; students may require mastery of specific subjects studied at levels 3B or 4A. Duration equivalent to at least 2 years of full-time study, but 3 is more usual.
Advanced research programmesISCED 6.
Advanced research programmesThe second stage of tertiary education. Programmes are devoted to advanced study and original research.
Term used to describe levels of educationin Education at a Glance 2012ISCED classification (and subcategories)
Term generally used in this publication
EDUCATION AT A GLANCE 2012: HIGHLIGHTS © OECD 20128

READER’S GUIDE
Israel: The statistical data for Israel are supplied by and under the responsibility of the
relevant Israeli authorities. The use of such data by the OECD is without prejudice to the
status of the Golan Heights, East Jerusalem and Israeli settlements in the West Bank under
the terms of international law.
Notes to tables and figuresFor further details on the data behind any figure, see the relevant indicator in the full
publication Education at a Glance 2012, or click the hyperlink in the figure’s source to
download the data and notes.
EDUCATION AT A GLANCE 2012: HIGHLIGHTS © OECD 2012 9


EDUCATION AT A GLANCE 2012: HIGHLIG
1. EDUCATION LEVELS AND STUDENT NUMBERS
To what level have adults studied?
Who participates in education?
How many young people finish secondary education?
How many young people enter tertiary education?
How many young people graduate from tertiary education?
How successful are students in moving from education to work?
How many students study abroad and where do they go?
HTS © OECD 2012 11

1. EDUCATION LEVELS AND STUDENT NUMBERS
To what level have adults studied?
– On average across OECD countries, 26% of all adults havebelow upper secondary education, 44% upper secondary educa-tion and 30% tertiary education.
– Upper secondary education is the norm among younger adultsin OECD countries, to a far greater extent than for older adults.In 2010, 25 OECD countries had upper secondary attainmentrates of 80% or more among 25-34 year-olds.
– The rate of tertiary attainment is also higher among youngeradults, reaching 38% of 25-34 year-olds.
Significance
Education is important for both the present, giving indi-viduals the knowledge and skills to participate fully andeffectively in society, and for the future, as it helps expandscientific and cultural knowledge. The level to which adultshave studied is often used as a proxy for the level of humancapital – the skills available in the population and labourforce. The global economic crisis has provided an addi-tional incentive for people to build their skills, in difficulteconomic circumstances.
Findings
Across almost all OECD countries, upper secondary attain-ment is the norm. On average, 74% of 25-64 year-olds haveachieved this level, compared with 82% for 25-34 year-olds.However, levels vary between countries. For instance inBrazil, China, Mexico, Portugal and Turkey roughly half ofthis age group have not completed secondary school.
Some countries have seen dramatic increases in uppersecondary attainment rates from generation to generation.In Chile, Greece, Ireland, Italy, Korea, Portugal and Spainupper secondary attainment rates for 25-34 year-olds are atleast 30 percentage points higher than for older adults(55-64 year-olds).
Differences between age groups are less pronounced in coun-tries with traditionally high levels of upper secondary attain-ment. For instance, in Estonia, Germany and Norway, theupper secondary attainment rate is less than 5 percentagepoints higher for 55-64 year-olds than for 25-34 year-olds. Inthe United States, it has decreased slightly. Among non-OECDG20 countries, Brazil, China and the Russian Federation allhave made notable progress in increasing upper secondaryattainment rates between generations.
Tertiary attainment levels have increased considerably overthe past 30 years and nearly 210 million people in OECDcountries have completed tertiary education. Canada,Japan, Korea and the Russian Federation have the highestproportion of young adults with tertiary education, with
55% or more of adults aged 25-34 having reached this levelof education.
In almost all countries younger adults have higher rates oftertiary education than the generation about to leave thelabour market. On average across OECD countries, 38% of25-34 year-olds have completed tertiary education,compared with 23% of 55-64 year-olds.
Trends
Efforts to raise people’s level of education have led to signif-icant changes in attainment rates, particularly at the topand bottom ends of the education spectrum. On averageamong OECD countries, between 1997 and 2010, the pro-portion of adults who had not attained an upper secondaryeducation fell from 36% to 26%, while the proportioncompleting tertiary education rose about 10 percentagepoints from 21%. The proportion completing upper second-ary or post-secondary non-tertiary education was almostunchanged, rising from 43% to 44%.
Definitions
Data on population and education attainment are takenfrom OECD and Eurostat Databases, which are compiledfrom National Labour Force Surveys.
Information on data for Israel:http://dx.doi.org/10.1787/888932315602.
Further reading from OECD
Reviews of National Policies for Education (series).
Going further
For additional material, notes and a full explanationof sourcing and methodologies, see Education at aGlance 2012 (Indicator A1).
Areas covered include:
– Educational attainment of adults, by gender.
– Potential growth in population with tertiaryattainment.
Additional data on gender gaps in vocational andtertiary education is available online in Indicator A1at www.oecd.org/edu/eag2012.
EDUCATION AT A GLANCE 2012: HIGHLIGHTS © OECD 201212

1. EDUCATION LEVELS AND STUDENT NUMBERS
To what level have adults studied?
Figure 1.1. Population that has attained at least upper secondary education, 2010
This figure shows the percentage of 25-34 year-olds and 55-64 year-olds who have been through at least upper secondaryeducation. The rapid expansion of education in recent decades means younger people tend to have higher levels of education.
Source: OECD (2012), Education at a Glance 2012, Table A1.2a, available at: http://dx.doi.org/10.1787/888932664176.
Figure 1.2. Population that has attained tertiary education, 2010
This figure shows the percentage of 25-34 year-olds and 55-64 year-olds who have been through tertiary education.
Source: OECD (2012), Education at a Glance 2012, Table A1.3a, available at: http://dx.doi.org/10.1787/888932664233.
100
90
80
70
60
50
40
30
20
10
0
% 25-34 year-olds 55-64 year-olds
Korea
Czech
Rep
ublic
Slovak
Rep
ublic
Poland
Sloven
ia
Canad
a
Sweden
Russia
n Fed
eratio
n
Finlan
d
Switzerl
and
United
States
Israe
l
Austri
a
Irelan
dChil
e
German
y
Eston
ia
Hunga
ry
Austra
lia
Luxe
mbourg
Franc
e
EU21 a
vera
ge
Norway
United
Kingdo
m
Other G
20
Netherl
ands
Belgium
OECD av
erag
e
Denmark
New Ze
aland
Greece
Icelan
d
G20 ave
rage Ita
lySpa
inBraz
il
Portug
al
Mexico
Turke
yChin
a
70
60
50
40
30
20
10
0
% 25-34 year-olds 55-64 year-olds
KoreaJa
pan
Canad
a
Russia
n Fed
eratio
n
Irelan
d
Norway
New Ze
aland
United
Kingdo
m
Austra
lia
Luxe
mbourg
Israe
l
Belgium
Franc
e
United
States
Other G
20
Sweden
Netherl
ands
Switzerl
and
Finlan
dSpa
inChil
e
Eston
ia
OECD av
erag
e
Denmark
Poland
G20 ave
rage
Icelan
d
EU21 a
vera
ge
Sloven
ia
Greece
German
y
Hunga
ry
Portug
al
Slovak
Rep
ublic
Czech
Rep
ublic
Mexico
Austri
aIta
ly
Turke
yBraz
ilChin
a
EDUCATION AT A GLANCE 2012: HIGHLIGHTS © OECD 2012 13

1. EDUCATION LEVELS AND STUDENT NUMBERS
Who participates in education?
– Virtually everyone in OECD countries has access to at least13 years of formal education, and the average 5-year old canexpect to complete more than 17 years of education by the timethey are 40.
– More than three-quarters of 4-year-olds (79%) are enrolled inearly childhood education in OECD countries.
– In 25 OECD countries, 80% or more of 15-19 year-olds are ineducation, with girls on average slightly ahead of boys.
– The proportion of 20-29 year-olds in education increasedsubstantially in 20 OECD countries between 2009 and 2010,compared with 2005-10 and numbers are expected to continuegrowing.
Significance
A well-educated population is essential for economic andsocial development; societies therefore have a real interestin ensuring that children and adults have access to a widerange of educational opportunities. This section examinesthe evolution in access to education from 1995 to 2010,focusing on the number of young people who continuestudying once compulsory education has ended.
Findings
Virtually all people in OECD countries have access to atleast 13 years of formal education and at least 90% ofstudents are enrolled in education for 15 years or more inBelgium, Norway and Sweden. By contrast, in Chile,Indonesia, Saudi Arabia and Turkey, 90% of children haveaccess to education for 8-10 years. In almost half of OECDcountries, full enrolment begins between the ages of 5 and7. However, participation in early education is expanding.In almost two-thirds of OECD countries, over 75% of3-4 year-olds are enrolled in either pre-primary or primaryprogrammes. Participation rates are higher in Europeancountries (78%) than in other OECD countries (72%).
Access to education is universal between the ages of 5 and14 in all OECD and other G20 countries with available data,and a 5-year-old child in an OECD country can expect tohave more than 17 years of education (full or part-time)by the age of 40. In 25 OECD countries, 80% or more of15-19 year-olds are in education. The OECD average is 84%for girls and 82% for boys. More than 90% of this age groupare in education in Belgium, the Czech Republic, Hungary,Ireland, the Netherlands, Poland and Slovenia. However,more than 20% of 15-19 year-olds are not enrolled in educa-tion in Argentina, Austria, Brazil, Chile, China, Indonesia,Israel, Luxembourg, Mexico, New Zealand, Turkey and theUnited Kingdom.
On average in OECD countries, 27% of 20-29 year-olds wereenrolled in education – mostly tertiary education – in 2010.Enrolment rates were 30% or more in Australia, Belgium,Denmark, Finland, Germany, Greece, Iceland, Korea, theNetherlands, New Zealand, Slovenia and Sweden. Morewomen than men are in education in this age group onaverage, with a gap of more than 10 percentage points inSlovenia and Sweden.
Trends
Enrolment rates for 15-19 year-olds increased on average by10.4 percentage points between 1995 and 2010. France isthe only exception, with an enrolment rate decreasing from89% to 84% during this period. There has been growth, too,in enrolment for 20-29 year-olds, with a 10.1 percentagepoint increase between 1995 and 2010. Growth was at least12 percentage points in the Czech Republic, Finland,Greece, Hungary, Iceland, Korea, New Zealand, Poland,Sweden and Turkey. These increases may reveal thegeneral awareness of the benefits of participating ineducation in a restricted labour market.
Definitions
Data for the 2009-10 school year are based on the UOE datacollection on education statistics, administered annuallyby the OECD. Except where otherwise noted, figures arebased on head counts and do not distinguish betweenfull-time and part-time study.
Information on data for Israel:http://dx.doi.org/10.1787/888932315602.
Going further
For additional material, notes and a full explanationof sourcing and methodologies, see Education at aGlance 2012 (Indicators C1 and C2).
Areas covered include:
– Students in primary, secondary and tertiary educa-tion, by type of institution or mode of enrolment.
– Transition characteristics from age 15 to 20, by levelof education.
– Education expectancy.
EDUCATION AT A GLANCE 2012: HIGHLIGHTS © OECD 201214

1. EDUCATION LEVELS AND STUDENT NUMBERS
Who participates in education?
Figure 1.3. Enrolment rates of 15-19 year-olds (1995, 2010)
This figure shows the increase or decrease in the percentage of 15-19 year-olds enrolled in full-time and part-time education.
Source: OECD (2012), Education at a Glance 2012, Table C1.2, available at: http://dx.doi.org/10.1787/888932666836.
Figure 1.4. Enrolment rates of 20-29 year-olds (1995, 2010)
This figure shows the increase or decrease in the percentage of 20-29 year-olds enrolled in full-time and part-time education.
Source: OECD (2012), Education at a Glance 2012, Table C1.2, available at: http://dx.doi.org/10.1787/888932666836.
100
90
70
30
80
50
60
20
40
10
0
2010 1995%
Irelan
d
Belgium
Poland
Sloven
ia
Hunga
ry
Netherl
ands
Czech
Rep
ublic
German
y
Icelan
d
Saudi
Arabia
Finlan
d
Eston
ia
Portug
al
Sweden
Norway
Korea
Slovak
Rep
ublic
Switzerl
and
Denmark
Spain
Franc
e
Greece Ita
ly
OECD av
erag
e
United
States
Austra
lia
Canad
a
New Ze
aland
Austri
a
United
Kingdo
m
Luxe
mbourg
Brazil
ChileIsr
ael
Turke
y
Mexico
45
35
25
15
5
40
30
20
10
0
2010 1995%
Finlan
d
Greece
Denmark
Icelan
d
Sweden
Sloven
ia
Austra
lia
German
y
BelgiumKor
ea
New Ze
aland
Netherl
ands
Poland
Norway
Eston
ia
OECD av
erag
e
United
States
Hunga
ryChil
e
Austri
a
Canad
aSpa
in
Switzerl
and
Czech
Rep
ublic
Portug
alIsr
ael
Italy
Irelan
d
Slovak
Rep
ublic
Brazil
Franc
e
Turke
y
Saudi
Arabia
United
Kingdo
m
Luxe
mbourg
Mexico
EDUCATION AT A GLANCE 2012: HIGHLIGHTS © OECD 2012 15

1. EDUCATION LEVELS AND STUDENT NUMBERS
How many young people finish secondary education?
– Based on current patterns of graduation, it is estimated that anaverage of 84% of today’s young people in OECD countries willcomplete upper secondary education over their lifetimes. ForG20 countries, the level is 78%.
– Girls are more likely than boys to complete upper secondaryeducation in OECD countries, a reversal of historical trends.
– Most boys in vocational programmes at the upper secondarylevel choose to study engineering, manufacturing and construc-tion, while girls opt for a range of fields, notably business, law,social sciences, health and welfare, and services.
Significance
This section shows how many students are expected tofinish secondary education. Completing upper secondaryeducation does not in itself guarantee that students areadequately equipped with the basic skills and knowledgenecessary to enter the labour market or tertiary studies.However, these rates do give an indication of the extent towhich education systems succeed in preparing students tomeet the labour market’s minimum requirements. Youngpeople in OECD countries who do not finish secondaryeducation face severe difficulties when it comes to findingwork. Policy makers are examining ways to reduce thenumber of early school-leavers, defined as those studentswho do not complete their upper secondary education.Internationally comparable measures of how manystudents successfully complete upper secondary pro-grammes – which also show how many students are notcompleting these programmes – can assist efforts tothat end.
Findings
The percentage of young people graduating from uppersecondary education exceeds 75% in 23 of the 27 countrieswith available data. In Finland, Greece, Ireland, Israel,Japan, Korea, Portugal, Slovenia and the United Kingdom itis 90% or more. Graduation rates for girls exceed those forboys in almost all OECD countries, except Germany. Thegap is greatest in Iceland and Portugal, where graduationrates among young women exceed those of young men by20 percentage points or more. Only in China, Germany,Ireland, Japan, Korea and Turkey is there little or no gendergap in upper secondary graduation.
In most countries, upper secondary education is designedto prepare students to enter university-level education. InGermany, Slovenia, and Switzerland, however, students aremore likely to enrol in and graduate from upper secondaryprogrammes that lead to pre-vocational or vocationaleducation (tertiary-type B), where courses are typicallyshorter and focus on developing practical, technical oroccupational skills. Some 47% of boys and 44% of girls
graduated from vocational programmes in 2010 in OECDcountries, but while most boys choose engineering, manu-facturing or construction, girls tend to prefer socialsciences, business, law, health, education and services.Only in Argentina do girls prefer engineering, manufac-turing and construction.
It is estimated that 70% of boys and girls who begin anupper secondary programme complete it within theplanned duration of the programme. However, in somecountries, it is relatively common for students and appren-tices to take a break from their studies and leave the educa-tion system temporarily. Around 10% of upper secondarygraduates in Denmark, Finland and Norway are 25 or older,while 20% in Iceland and more than 40% in Portugal are.
Trends
Since 1995, the upper secondary graduation rate hasincreased by an average of eight percentage points amongOECD countries with comparable data, with an annualgrowth rate of 0.6%. The greatest increase occurred inPortugal, which showed an annual growth rate of 4.7%between 1995 and 2010.
Definitions
Data for the 2009-10 school year are based on the UOE datacollection on education statistics, administered by the OECDin 2011. Upper secondary graduation rates are calculated forthe years 2005-10 as net graduation rates, which representthe estimated percentage of an age cohort that will completeeducation at those levels. Gross graduation rates arepresented for the years 1995, 2000-04, or for 2005-10 forcountries that are unable to provide such detailed data.
Data on successful completion of upper secondary pro-grammes by gender and programmes come from a specialsurvey carried out in December 2011.
Information on data for Israel:http://dx.doi.org/10.1787/888932315602.
Going further
For additional material, notes and a full explanationof sourcing and methodologies, see Education at aGlance 2012 (Indicator A2).
Areas covered include:
– Current upper secondary graduation rates and trends.
– Successful completion of upper secondary pro-grammes, by programme orientation and gender.
EDUCATION AT A GLANCE 2012: HIGHLIGHTS © OECD 201216

1. EDUCATION LEVELS AND STUDENT NUMBERS
How many young people finish secondary education?
Figure 1.5. Successful graduation from upper-secondary programmes
This figure shows the percentage of students who enter an upper secondary programme for the first time and who graduatefrom it. It represents the relationship between the graduates and the new entrants in the same level of education.The calculation is made in the amount of time normally allocated for completing the programme.
Source: OECD (2012), Education at a Glance 2012, Table A2.1, available at: http://dx.doi.org/10.1787/888932664347.
Figure 1.6. Successful completion of upper-secondary programmes by gender
This figure shows the percentage of students who enter and successfully complete an upper secondary programme, by gender.
Source: OECD (2012), Education at a Glance 2012, Table A2.5, available at: http://dx.doi.org/10.1787/888932664480.
100
90
80
70
60
50
40
30
20
10
0
%
Portug
al
Japa
n
Greece
Korea
Sloven
ia
Irelan
d
Finlan
dIsr
ael
United
Kingdo
m
Icelan
d
Norway
German
y
Denmark
Slovak
Rep
ublic
Hunga
ry
OECD av
erag
e
Poland
Chile
Italy
Canad
aSpa
in
Czech
Rep
ublic
United
States
Sweden
Luxe
mbourg
China
Turke
y
Mexico
100
80
60
40
20
0
% Girls Boys
Korea
Israe
l
Japa
n
Irelan
d
Slovak
Rep
ublic
United
States
Poland
Sloven
ia
Eston
ia
Belgium
(Fl.)
Austri
a
Canad
a
Sweden
Countri
es’ av
erag
e
Finlan
d
Hunga
ry
United
Kingdo
m
Netherl
ands
Norway
New Ze
aland
Denmark
Franc
eSpa
in
Mexico
Icelan
d
Luxe
mbourg
EDUCATION AT A GLANCE 2012: HIGHLIGHTS © OECD 2012 17

1. EDUCATION LEVELS AND STUDENT NUMBERS
How many young people enter tertiary education?
– An average of 62% of today’s young adults in OECD countriesare expected to enter university-level programmes and 17% toenter vocationally oriented programmes over their lifetimes.
– In 2010, the expected rate of entry into university-levelprogrammes was 25% higher for women than for men.
– Entry rates for university-level programmes increased by anaverage of nearly 25 percentage points across OECD countriesbetween 1995 and 2010, while entry rates for vocationallyoriented programmes remained stable.
Significance
This section shows how many students will enter a specifictype of tertiary education programme during their life-times. It also sheds light on the accessibility and perceivedvalue of tertiary programmes, and provides some indica-tion of the degree to which a population is acquiring thehigh-level skills and knowledge valued by today’s labourmarket. High entry and participation rates in tertiaryeducation imply that a highly educated labour force isbeing developed and maintained.
Findings
It is estimated that 62% of young adults in OECD countrieswill enter university-level programmes during theirlifetimes if current patterns of entry continue. In severalcountries, at least 70% of young adults are expected to enterthese programmes, while in Belgium, China, Indonesia,Luxembourg and Mexico, not more than 35% are expected todo so.
The proportion of students entering vocationally-orientedprogrammes is generally smaller, mainly because theseprogrammes are less developed in most OECD countries.In the countries for which data are available, an averageof 17% of young adults is expected to enter these pro-grammes, 19% of women and 16% of men. Proportionsrange from 3% or less in Italy, Mexico, the Netherlands,Norway, Poland, Portugal and the Slovak Republic; to 30% ormore in Argentina, Belgium, Korea, and New Zealand.
On average, in all OECD countries with comparable data,the proportion of young adults expected to enter univer-sity-level programmes increased by 15 percentage pointsbetween 2000 and 2010. In Australia, Austria, the CzechRepublic, Iceland, Ireland, Korea, Saudi Arabia and theSlovak Republic, entry rates into these programmesincreased by more than 20 percentage points between 2000and 2010.
Only Finland, Hungary and New Zealand have experienced adecline in entry rates into these programmes. In Hungary, the
decrease is counterbalanced by a significant increase in entryrates into vocationally oriented programmes during the sameperiod. In New Zealand, the rise and fall of entry ratesbetween 2000 and 2010 closely mirrors the rise and fall of thenumber of international students over the same period.
Traditionally, students enter academic programmes imme-diately after having completed upper secondary education,and this remains true in many countries. For example, inBelgium, Indonesia, Italy and Mexico more than 90% of allnew entrants into tertiary education are under 25 years ofage. In other countries, the transition from upper second-ary to tertiary education may occur at a later age because oftime spent in the labour force or the military.
Trends
The proportion of students entering university-level educa-tion increased by nearly 25 percentage points on average inOECD countries between 1995 and 2010. This rise is due tothe increased accessibility of tertiary education in manycountries, but also because of structural changes in theeducation systems of some countries.
Definitions
Data on trends in entry rates for the years 1995, 2000, 2001,2002, 2003 and 2004 are based on a special survey carriedout in OECD countries in January 2007. The net entry ratefor a specific age is obtained by dividing the number ofentrants of that age to each type of tertiary education bythe total population in the corresponding age group.
Information on data for Israel:http://dx.doi.org/10.1787/888932315602.
Going further
For additional material, notes and a full explanationof sourcing and methodologies, see Education at aGlance 2012 (Indicator C3).
Areas covered include:
– Entry rates by level of education.
– Age of new entrants in tertiary education.
– Distribution by age and gender of new entrants.
EDUCATION AT A GLANCE 2012: HIGHLIGHTS © OECD 201218

1. EDUCATION LEVELS AND STUDENT NUMBERS
How many young people enter tertiary education?
Figure 1.7. Entry rates into university-level education (2000, 2010)
This figure shows the growth – or otherwise – in the percentage of young people entering university-level education.Entry rates have risen in most OECD countries.
Source: OECD (2012), Education at a Glance 2012, Table C3.3, available at: http://dx.doi.org/10.1787/888932667140.
Figure 1.8. Entry rates into vocationally oriented tertiary education (2000, 2010)
This figure shows the relative stability, in most OECD countries, in the percentage of young people entering vocationallyoriented tertiary education.
Source: OECD (2012), Education at a Glance 2012, Table C3.3, available at: http://dx.doi.org/10.1787/888932667140.
100
80
60
40
20
0
% 2000 2010
Austra
lia
Icelan
d
Portug
al
Poland
New Ze
aland
Sloven
ia
Norway
Sweden
United
States
Korea
Finlan
d
Russia
n Fed
eratio
n
Netherl
ands
Denmark
Slovak
Rep
ublic
United
Kingdo
mAus
tria
OECD av
erag
e
Czech
Rep
ublic
Israe
l
Irelan
d
Argen
tina
Hunga
rySpa
inJa
pan
Italy
Saudi
Arabia
Switzerl
and
Eston
ia
German
y
Turke
y
Belgium
Mexico
Luxe
mbourg
Indon
esia
China
50
40
30
20
10
60
0
% 2000 2010
New Ze
aland
Argen
tina
Belgium Kor
ea
Russia
n Fed
eratio
n
Eston
iaIsr
ael
Irelan
d
Turke
yJa
pan
United
Kingdo
mSpa
in
Denmark
Switzerl
and
German
y
Sloven
iaChin
a
Austri
a
OECD av
erag
e
Hunga
ry
Sweden
Saudi
Arabia
Luxe
mbourg
Czech
Rep
ublic
Indon
esia
Icelan
d
Mexico
Poland
Slovak
Rep
ublic
EDUCATION AT A GLANCE 2012: HIGHLIGHTS © OECD 2012 19

1. EDUCATION LEVELS AND STUDENT NUMBERS
How many young people graduate from tertiary education?
– On average 39% of young people are expected to completeuniversity level education in 27 OECD countries with compara-ble data.
– Graduation rates range from 25% and below in Mexico,Saudi Arabia and Turkey, to 50% and above in Australia,Denmark, Iceland, Poland and the United Kingdom.
– Graduation rates for young women are expected to be notablyhigher than those for young men in OECD countries – 47%versus 32% on average.
Significance
Tertiary education indicates a country’s capacity toproduce workers with advanced, specialised knowledgeand skills. Countries with high graduation rates at tertiarylevel are also those most likely to be developing or main-taining a highly skilled labour force. Tertiary educationvaries widely in structure and scope between countries,and graduation rates are influenced both by the degree ofaccess to these programmes and the demand for higherskills in the labour market. There are strong incentives toobtain a tertiary education in OECD countries, includinghigher salaries and better employment prospects.
Findings
Graduation rates vary significantly between countries: InMexico, Saudi Arabia and Turkey, only 25% or less of youngpeople graduate from university-level education; bycontrast, the proportion is 50% or more in Australia,Denmark, Iceland, Poland and the United Kingdom. Gradu-ation rates for some countries, in particular Australia,New Zealand and the United Kingdom, are artificiallyinflated by the presence of international students.
Disparities in graduation rates are even greater between menand women. On average in OECD countries, significantlymore women (47%) are expected to obtain university-levelqualifications than men (32%) based on current graduationrates. The gender gap in favour of women is at least25 percentage points in Iceland, Poland, the Slovak Republicand Slovenia. In Germany, Mexico and Switzerland, gradua-tion rates between sexes are quite balanced. In Japan andTurkey, by contrast, more men graduate from university-leveleducation.
In spite of rapidly expanding demand for universityprogrammes in recent decades, there is also still a placefor shorter, vocationally-oriented programmes. On aver-age, 11% of young adults in OECD countries completevocationally-oriented programmes; as with university levelprogrammes, completion rates are higher for women (12%)than for men (9%). Graduation rates from vocationalprogrammes are significant – in excess of 20% of youngpeople – in only a few OECD countries, most notablyCanada, Ireland, Japan, New Zealand and Slovenia. At thehighest levels of tertiary education, about 1.6% of people
complete advanced research programmes in OECDcountries. The proportion exceeds 2.5% in Germany, theSlovak Republic, Sweden and Switzerland (see Table A3.3 inEducation at a Glance 2012).
In China, an estimated 14% of young people will graduatefrom university-level programmes and 18% will graduatefrom vocationally-oriented programmes during theirlifetimes.
Trends
On average across OECD countries with comparable data,graduation rates from university-level education haveincreased between 1995 and 2010. The increase was parti-cularly steep between 1995 and 2000, and then levelled off.Over the past three years, graduation rates have remainedrelatively stable at around 39%. The most significantincreases since 1995 were reported in Austria, the CzechRepublic, the Slovak Republic, Switzerland and Turkey,where the annual growth rate is over 8%.
Definitions
Data are for the 2009-10 academic year and are based onthe UOE data collection on education statistics adminis-tered by the OECD in 2011. Tertiary graduates are thosewho obtain a university degree, vocational qualifications,or advanced research degrees of doctorate standard. Netgraduation rates represent the estimated percentage of anage group that will complete tertiary education. Datapresented here refer only to first-time graduates.
Information on data for Israel:http://dx.doi.org/10.1787/888932315602.
Further reading from OECD
Higher Education Management and Policy (journal).
OECD Reviews of Tertiary Education (series of nationalreviews).
Going further
For additional material, notes and a full explanationof sourcing and methodologies, see Education at aGlance 2012 (Indicator A3).
Areas covered include:
– Graduation rates by qualification level and by gender.
– The share of older students as graduates.
– The share of international students as graduates.
EDUCATION AT A GLANCE 2012: HIGHLIGHTS © OECD 201220

1. EDUCATION LEVELS AND STUDENT NUMBERS
How many young people graduate from tertiary education?
Figure 1.9. First time graduation rates from university-level education (1995, 2010)
This figure shows the growth or decline in the percentage of first-time graduates from university-level education.
Source: OECD (2012), Education at a Glance 2012, Table A3.2, available at: http://dx.doi.org/10.1787/888932664575.
Figure 1.10. First time graduation rates from vocationally oriented education (1995, 2010)
This figure shows the growth or decline in the percentage of first-time graduates from vocationally oriented tertiary education.
Source: OECD (2012), Education at a Glance 2012, Table A3.2, available at: http://dx.doi.org/10.1787/888932664575.
60
50
20
40
30
10
0
1995 2010%
Icelan
d
Poland
United
Kingdo
m
Denmark
Austra
lia
Slovak
Rep
ublic
Finlan
d
New Ze
aland
Irelan
d
Netherl
ands
Norway
Japa
n
Portug
al
OECD av
erag
e
United
States
Czech
Rep
ublic
Israe
l
Sweden
Canad
aIta
ly
Switzerl
and
Hunga
ry
German
y
Austri
aSpa
in
Sloven
ia
Turke
y
Mexico
Saudi
Arabia
25
10
30
20
15
5
35
0
1995 2010%
New Ze
aland
Sloven
iaJa
pan
Irelan
d
Turke
ySpa
in
Switzerl
and
Austra
lia
German
y
United
Kingdo
mAus
tria
United
States
OECD av
erag
e
Denmark
Saudi
Arabia
Sweden
Hunga
ry
Czech
Rep
ublic
Icelan
d
Mexico
Slovak
Rep
ublic
Poland Ita
ly
Netherl
ands
Norway
Finlan
d
Portug
al
EDUCATION AT A GLANCE 2012: HIGHLIGHTS © OECD 2012 21

1. EDUCATION LEVELS AND STUDENT NUMBERS
How successful are students in moving from education to work?
– On average across OECD countries, 16% of 15-29 year-olds areneither employed, nor in education or training (NEET); thisproportion increased substantially in 2009 and 2010 comparedwith pre-crisis levels.
– Overall, the proportion of NEETs is 4 percentage points higheramong 15-29 year-old women than among men, but situationsvary widely from one country to another. In all countries exceptIsrael, the proportion of 15-29 year-olds not in education andinactive is higher for young women than for young men.
– The lack of an upper secondary qualification is a serious imped-iment to finding work, while having a university-level degreeincreases the likelihood of having a job, particularly duringdifficult economic times.
Significance
This section illustrates the difficulty of moving from educa-tion to work for the younger generation following thefinancial crisis and recession that began in 2008. Highunemployment rates mean that those with more workexperience are favoured over new entrants into the labourmarket. This section looks at the number of years youngpeople can be expected to spend in education, employmentand non-employment. To improve the transition of youngpeople from school to work, education systems shouldwork to ensure that people have skills that match therequirements of the labour market, and to minimise theproportion of young adults who are neither in school norin work.
Findings
The average 15-year-old in an OECD country in 2010 couldexpect to spend the next 15 years of his or her life asfollows: 7.0 additional years in education, 5.5 years in a job,unemployed for a total of 1 year, and out of the labour forceentirely (neither in education nor seeking work) for1.3 years. A girl would spend longer in education (7.2 years)than a boy (6.9), less time working (5.0 years for a girl,5.9 for a boy) and much longer out of the labour forceentirely, at 1.8 years compared with 0.9 for a man.
Those who fail to complete upper secondary education aremuch more likely to have difficulty finding a job. Onaverage, completion of upper secondary education reducesunemployment among 20-24 year-olds by 8 percentagepoints. In Estonia, France, Ireland, the Slovak Republic andSpain, at least 25% of 20-24 year-olds who have notcompleted secondary education are not in school andunemployed.
Completing tertiary education reduces unemploymentamong 25-29 year-olds by 2.3 percentage points comparedto those who completed upper secondary education. Onaverage in OECD countries, 47% of 15-29 year-olds are ineducation. In Denmark, Finland, Germany, Iceland,
Luxembourg, the Netherlands, Slovenia and Sweden, thelevel is more than 50%. Conversely, less than 35% of this agegroup were in education in Mexico and Turkey.
Some 48% of 15-29 year-olds have jobs on average in OECDcountries. In Australia, Canada, Denmark, Iceland, theNetherlands and Norway, the rate is more than 60%, againstless than 40% in Hungary, Israel, Italy, the Slovak Republicand Turkey.
Trends
Efforts by governments to raise people’s level of educationhave led to significant changes in educational participa-tion. In 1998, 41.1% of 15-29 year-olds were in education.This had risen to 47.1% by 2010. The NEET populationamong 15-29 year-olds decreased from 16.0% in 1998 to15.8% in 2010. This included a decrease of 1.3 percentagepoints between 1998 and 2001, and 1.6 percentage pointsbetween 2002 and 2008. But at the height of the globaleconomic crisis in 2008-10, the NEET population increasedby 2.1%.
Definitions
Data are collected as part of the annual OECD Labour ForceSurvey, and usually refer to the first quarter, or the averageof the first three months of the calendar year, therebyexcluding summer employment. For certain Europeancountries, the data come from the annual European LabourForce Survey.
Information on data for Israel:http://dx.doi.org/10.1787/888932315602.
Further reading from OECD
Better Skills, Better Jobs, Better Lives (2012).
Going further
For additional material, notes and a full explanationof sourcing and methodologies, see Education at aGlance 2012 (Indicator C5).
Areas covered include:
– Expected years in education and not in educationfor 15-29 year-olds, as well as trends and genderdifferences.
– Transition from school to work for different agegroups.
EDUCATION AT A GLANCE 2012: HIGHLIGHTS © OECD 201222

1. EDUCATION LEVELS AND STUDENT NUMBERS
How successful are students in moving from education to work?
Figure 1.11. Young people not in education, training or employment (2005, 2010)
This figure shows the growth or decline in the percentage of youth population not in education, training or employment (NEETs).
Source: OECD (2012), Education at a Glance 2012, Table C5.4a, available at: http://dx.doi.org/10.1787/888932667520.
Figure 1.12. Education and employment among young people, 2010
These figures show the distribution of education and work status among young adults, by age group. Young adults leavingschool and entering a difficult labour market are more likely to become unemployed or fall outside the labour force entirely.
Source: OECD (2012), Education at a Glance 2012, Table C5.2a, available at: http://dx.doi.org/10.1787/888932667425.
454035302520151050
2005 2010%
Turke
yIsr
ael
Mexico Ita
ly
Slovak
Rep
ublic
Greece
Poland
Hunga
rySpa
in
Czech
Rep
ublic
OECD av
erag
e
Eston
ia
German
y
Franc
e
Belgium
United
Kingdo
m
United
States
Portug
al
New Ze
aland
Canad
a
Austra
lia
Austri
a
Finlan
d
Irelan
d
Switzerl
and
Sloven
ia
Sweden
Japa
n
Denmark
Netherl
ands
Norway
Luxe
mbourg
Icelan
dKor
ea
1009080706050403020100
1009080706050403020100
%
%
In education
Not in education, inactive
Not in education, unemployed
Not in education, employed
25-29 year-olds
15-19 year-olds
Luxe
mbourg
Belgium
Norway
Portug
al
Canad
a
Switzerl
and
Netherl
ands
Franc
e
Austri
a
Czech
Rep
ublic
Greece
Brazil
Poland
Austra
lia
Slovak
Rep
ublic
Korea
Irelan
d
United
Kingdo
m
United
States
OECD av
erag
e
German
y
Sweden
Mexico
New Ze
aland
Eston
ia
Hunga
rySpa
in
Denmark
Sloven
ia
Finlan
dIta
ly
Icelan
dIsr
ael
Turke
y
EDUCATION AT A GLANCE 2012: HIGHLIGHTS © OECD 2012 23

1. EDUCATION LEVELS AND STUDENT NUMBERS
How many students study abroad and where do they go?
– More than 4.1 million tertiary-level students were enrolledoutside their country of citizenship in 2010.
– Australia, Austria, Luxembourg, New Zealand, Switzerlandand the United Kingdom have the highest percentages ofinternational students among their tertiary students.
– Asians account for 52% of all students studying abroad world-wide. In absolute terms, the largest numbers of internationalstudents are from China, India and Korea.
– Some 77% of students worldwide who study abroad do so inOECD countries. This proportion has remained stable duringthe past decade.
Significance
This section looks at the extent to which students arestudying abroad and their preferred destinations. Pursuinghigher-level education in a foreign country allows studentsto expand their knowledge of other cultures and languages,and to better equip themselves in an increasingly globa-lised labour market. Beyond its social and educationaleffects, studying abroad has a considerable economicimpact. The internationalisation of education is likely tohave a growing impact on some countries’ economy as aresult of revenue from tuition fees and domestic consump-tion by international students.
Findings
OECD countries attract the bulk of students who studyabroad worldwide – almost four out of five. Many of thesecome from other OECD countries, mainly Canada, France,Germany, Japan, Korea, Turkey and the United States. Interms of where students choose to study, the UnitedKingdom and the United States each receive more than 10%of all foreign students worldwide. Europe is the preferreddestination for students studying outside their country,with 41% of all international students. North America has21% of all international students. Nevertheless, the fastestgrowing regions of destination are Latin America and theCaribbean, Oceania, and Asia mirroring the internationali-sation of universities in an increasing set of countries (seeChart C4.1 and Table C4.6 in Education at a Glance 2012).
In a number of countries, especially in Australia andNew Zealand, the large presence of international studentshas a significant impact on tertiary graduation rates (seeChart A3.1 in Education at a Glance 2012). If data from inter-national students are excluded, Australia’s graduation rate
from university-level first degree programmes drops by16 percentage points and New Zealand’s by 7 percentagepoints.
Trends
Over the past three decades, the number of internationalstudents has increased fivefold from 0.8 million worldwidein 1975 to 4.1 million in 2010. This growth has acceleratedduring the period, mirroring the processes of economic andsocial globalisation. The global increase in the number ofinternational students also reflects the overall increase intertiary enrolment.
Since 2000, the number of foreign tertiary students enrolledworldwide has increased by 99%, for an average annualgrowth rate of 7.1%. The number of foreign tertiarystudents enrolled in OECD countries doubled since 2000,for an average annual growth rate of 7.2%.
Definitions
Data on international and foreign students are based onthe UOE data collection on education statistics, adminis-tered annually by the OECD. Data from the UNESCO Insti-tute for Statistics are also included. Students are classifiedas “international” if they left their country of origin andmoved to another country to study. Students are classifiedas “foreign” if they are not citizens of the country in whichthey are studying. This latter category includes some stu-dents who are permanent residents, albeit not citizens, ofthe countries in which they are studying (for example,young people from immigrant families).
Information on data for Israel:http://dx.doi.org/10.1787/888932315602.
Going further
For additional material, notes and a full explanationof sourcing and methodologies, see Education at aGlance 2012 (Indicator C4).
Areas covered include:
– Distribution of students by country of origin anddestination.
– Trends in the number of students studying abroad.
EDUCATION AT A GLANCE 2012: HIGHLIGHTS © OECD 201224

1. EDUCATION LEVELS AND STUDENT NUMBERS
How many students study abroad and where do they go?
Figure 1.13. Trends in international education market shares (2000, 2010)
This figure shows the distribution of foreign and international students in tertiary education, by destination.
Source: OECD (2012), Education at a Glance 2012, Table C4.7, available at: http://dx.doi.org/10.1787/888932667349.
Figure 1.14. Student mobility in tertiary education, 2010
This figure shows the percentage of international students at the tertiary level in each country.
Source: OECD (2012), Education at a Glance 2012, Table C4.1, available at: http://dx.doi.org/10.1787/888932667235.
25
20
15
10
5
0
OECD countries 2000 2010 Other G20 and non-OECD countries 2000 2010
Market share (%)
United
States
United
Kingdo
m
Austra
lia
German
y
Franc
e
Canad
a
Russia
n Fed
eratio
nJa
pan
Spain
China
New Ze
aland Ita
ly
Austri
a
South
Africa
Korea
Belgium
Switzerl
and
Netherl
ands
Sweden
Other O
ECD
Other G
20 an
d non
-OEC
D
25
20
15
10
5
0
% 41.4
Luxe
mbourg
Austra
lia
United
Kingdo
mAus
tria
Switzerl
and
New Ze
aland
Belgium
Denmark
Irelan
d
Sweden
Canad
a
Icelan
d
Netherl
ands
Finlan
d
Hunga
ry
Slovak
Rep
ublic
Japa
n
United
States
Spain
Portug
al
Eston
ia
Sloven
ia
Norway
Poland
Chile
Franc
e
Czech
Rep
ublic
South
Africa
Greece Ita
ly
Saudi
Arabia
Korea
Russia
n Fed
eratio
n
Turke
yChin
aBraz
il
Foreign studentsInternational students
OECD average
EDUCATION AT A GLANCE 2012: HIGHLIGHTS © OECD 2012 25


EDUCATION AT A GLANCE 2012: HIGHLIG
2. THE ECONOMIC AND SOCIAL BENEFITS OF EDUCATION
How much more do tertiary graduates earn?
How does education affect employment rates?
What are the incentives for people to invest in education?
What are the incentives for societies to invest in education?
What are the social benefits of education?
How does education affect the economy?
HTS © OECD 2012 27

2. THE ECONOMIC AND SOCIAL BENEFITS OF EDUCATION
How much more do tertiary graduates earn?
– Earnings tend to rise in line with people’s level of education.
– People with higher (tertiary) education can expect to earn 55%more on average in OECD countries than a person withouttertiary education. Those who have not completed secondaryeducation earn 23% less than those who have.
– Across all countries and all levels of education, women earn lessthan men, and that gap is not reduced with more education.
Significance
This section examines the relative earnings of workerswith different levels of education. Differences in pre-taxearnings between educational groups provide a good indi-cation of supply and demand for education. Combinedwith data on earnings over time, these differences providea strong signal of whether education systems are meetingthe demands of the labour market.
Findings
Variations among countries in relative earnings reflect anumber of factors, including the demand for skills in thelabour market, minimum wage legislation, the strength ofunions, the coverage of collective bargaining agreements,the supply of workers at various levels of educationalattainment and levels of part-time and seasonal work. Still,earnings differentials are among the more straightforwardindications as to whether the supply of educated indivi-duals meets demand, particularly in the light of changesover time.
As the data show, educational attainment is strongly linkedto average earnings. On average across OECD countries,graduates of tertiary education earn 55% more than uppersecondary and post-secondary non-tertiary graduates. Theearnings premium for tertiary education is substantial inmost countries, and exceeds 50% in 17 out of 32 countries.At the other end of the education scale, people who havenot completed upper secondary education earn 23% lessthan those with an upper secondary or post-secondarynon-tertiary education.
More education does little to narrow the gender gap inearnings. Women earn substantially less than men, onaverage, whatever their education level. The gap is smallestamong those with upper secondary and post-secondarynon-tertiary education, and largest among those withtertiary education. Women with tertiary education earn75% or more of men’s earnings in only five countries:Finland, New Zealand, Slovenia, Spain and the UnitedKingdom. In Brazil, Estonia, Italy and Korea, women whohave obtained a tertiary degree earn 65% or less of whattertiary-educated men earn.
The earnings advantage from education increases with age.Tertiary earnings are relatively higher at an older age: theearnings premium for a person with tertiary educationranges from 37% at 25-34 years old to 69% or more at55-64 years old. For those with below upper secondaryeducation the earnings disadvantage increases with age inall countries except Australia, Denmark, Finland, Ireland,Norway, the Slovak Republic, Sweden, the United Kingdomand the United States.
Trends
Demand for young professionals with tertiary educationhas kept up with the increasing supply from higher educa-tional institutions in most OECD countries. Despite anincrease in the proportion of 25-64 year-olds with tertiaryattainment from 21% in 2000 to 30% in 2010, the earningspremium for those with a tertiary education has increasedby 10 percentage points over the same period.
Definitions
Earnings data differ across countries in a number of ways,including whether they are reported annually, monthly orweekly. Thus results shown here should be interpreted withcaution. Similarly, the prevalence of part-time and part-yearearnings in most countries suggest that caution is needed ininterpreting earnings differentials in countries, particularlybetween men and women.
Information on data for Israel:http://dx.doi.org/10.1787/888932315602.
Further reading from OECD
Better Skills, Better Jobs, Better Lives (2012).
Going further
For additional material, notes and a full explanationof sourcing and methodologies, see Education at aGlance 2012 (Indicator A8).
Areas covered include:
– Trends in relative earnings of the population.
– Differences in earnings by gender and by age.
– Differences in earnings distribution according toeducational attainment.
EDUCATION AT A GLANCE 2012: HIGHLIGHTS © OECD 201228

2. THE ECONOMIC AND SOCIAL BENEFITS OF EDUCATION
How much more do tertiary graduates earn?
Figure 2.1. Relative earnings by level of education for men (2010 or latest available year)
This figure compares earnings between the different levels of educational attainment among 25-64 year-old men, using uppersecondary and post secondary non-tertiary education as a baseline (the line labelled 100 in the left-hand scale on the graph).
Source: OECD (2012), Education at a Glance 2012, Table A8.1, available at: http://dx.doi.org/10.1787/888932665335.
Figure 2.2. Relative earnings by level of education for women (2010 or latest available year)
This figure compares earnings between the different levels of educational attainment among 25-64 year-old women, using uppersecondary and post secondary non-tertiary education as a baseline (the line labelled 100 in the left-hand scale on the graph).
Source: OECD (2012), Education at a Glance 2012, Table A8.1, available at: http://dx.doi.org/10.1787/888932665335.
300
250
200
150
100
50
0
Below upper secondary education
University-level and advanced research programmes Vocationally oriented tertiary education
Upper secondary and post-secondary non-tertiary education = 100
Brazil
Hunga
ry
Irelan
d
Greece
Sloven
ia
Czech
Rep
ublic
United
States
Slovak
Rep
ublic
German
y
Poland
Israe
l
Franc
e
Portug
al
Finlan
d
Austri
a
United
Kingdo
m
OECD av
erag
e
Luxe
mbourg Ita
ly
Canad
a
Turke
y
Netherl
ands
Korea
Switzerl
and
Austra
liaSpa
in
Eston
ia
Denmark
New Ze
aland
Belgium
Sweden
Japa
n
Norway
250
200
150
100
50
300
0
Below upper secondary education
University-level and advanced research programmes Vocationally oriented tertiary education
Upper secondary and post-secondary non-tertiary education = 100
Brazil
Hunga
ry
Irelan
d
Greece
Sloven
ia
Czech
Rep
ublic
United
States
Slovak
Rep
ublic
German
y
Poland
Israe
l
Franc
e
Portug
al
Finlan
d
Austri
a
United
Kingdo
m
OECD av
erag
e
Luxe
mbourg Ita
ly
Canad
a
Turke
y
Netherl
ands
Korea
Switzerl
and
Austra
liaSpa
in
Eston
ia
Denmark
New Ze
aland
Belgium
Sweden
Japa
n
Norway
EDUCATION AT A GLANCE 2012: HIGHLIGHTS © OECD 2012 29

2. THE ECONOMIC AND SOCIAL BENEFITS OF EDUCATION
How does education affect employment rates?
– In general, people with higher levels of education have betterjob prospects; the difference is particularly marked betweenthose who have attained upper secondary education and thosewho have not.
– In all OECD countries, tertiary graduates are more likely to bein work than non-graduates.
– Men generally have higher employment rates than women; forthose with tertiary education the difference reaches more than25 percentage points in favour of men in some countries.
Significance
This section examines the relationship between educationand working life. OECD countries depend upon a stablesupply of well-educated workers to promote economicdevelopment. Data on employment and unemploymentrates – and how they evolve over time – thus carry impor-tant information for policy makers about the supply, andpotential supply, of skills available to the labour marketand about employers’ demand for these skills. It is parti-cularly important for policy makers to distinguish betweenthe impact of the economic crisis and the longer-runstructural changes occurring in OECD economies.
Findings
Education has a substantial impact on employmentprospects. On average across OECD countries, 83% of thepopulation with tertiary education is employed. In Iceland,Norway, Sweden and Switzerland, the average employmentrate of tertiary-educated individuals is over 88%. The OECDaverage falls to about 74% for people with upper secondaryand post-secondary non-tertiary education and to justbelow 56% for those without an upper secondary education.
Although the gap narrows among people with higher levelsof education, the employment rate of women is far belowthat of men at all levels of education. Among those withonly a lower secondary education, the employment rate is69% for men and 49% for women; among those with univer-sity level education and advanced research programmes,this rises to 88% for men and 79% for women. The genderdifference in employment rates for tertiary-educatedindividuals, which exists in all OECD countries withoutexception, is particularly large in Chile, the Czech Republic,Japan, Korea, Mexico and Turkey, where the differencereaches 29 percentage points.
Gender gaps in employment rates can be partly explainedby over- and under-representation of women in certainfields of education. In 2010, in every OECD country exceptJapan and Turkey, more than 70% of university levelstudents and people undertaking advanced research quali-fications in the field of education were women. Similarly,74% of degrees awarded in the field of health and welfare
also went to women on average across OECD countries. Bycontrast, in most countries, fewer than 30% of all graduatesin the fields of engineering, manufacturing and construc-tion were women. Perhaps not surprisingly, women areunder-represented in high-technology industries.
Trends
Education is generally good insurance against unemploy-ment, even in difficult economic times. Over the past14 years, employment rates for men and women withtertiary education have consistently been higher than forthose without. On average across OECD countries, unem-ployment rates for people with tertiary education haveremained below 5% and below 8% for those with only anupper secondary education. However, they have exceeded10% several times between 1998 and 2010 for those withoutan upper secondary education. During the recent economiccrisis, the increase in the average unemployment rate forindividuals without an upper secondary education was1.1 percentage points higher than for those with at least anupper secondary degree.
Definitions
The employment rate refers to the number of persons inemployment as a percentage of the population of workingage. The unemployment rate refers to unemployed personsas a percentage of the civil labour force. The unemployedare defined as people actively seeking employment andcurrently available to start work. The employed are definedas those who work for pay or profit for at least one hour aweek, or who have a job but are temporarily not at workdue to illness, leave or industrial action.
Information on data for Israel:http://dx.doi.org/10.1787/888932315602.
Going further
For additional material, notes and a full explanationof sourcing and methodologies, see Education at aGlance 2012 (Indicator A7).
Areas covered include:
– Trends in employment and unemployment rates,by gender and educational attainment.
– Trends in unemployment rates, by age.
– Employment rates of individuals with vocationaland general education.
EDUCATION AT A GLANCE 2012: HIGHLIGHTS © OECD 201230

2. THE ECONOMIC AND SOCIAL BENEFITS OF EDUCATION
How does education affect employment rates?
Figure 2.3. Employment rate of 25-64 year-olds with tertiary education, by gender, 2010
This figure shows the differences in employment rates of men and women with higher levels of educational attainment.
Source: OECD (2012), Education at a Glance 2012, Tables A7.3b and A7.3c, available at:http://dx.doi.org/10.1787/888932665145 and http://dx.doi.org/10.1787/888932665164.
Figure 2.4. Men and women with tertiary education, 2010
This figure shows the percentage of 25-64 year-olds with tertiary education, by gender.
Source: OECD (2012), Education at a Glance 2012, Tables A1.3b and A1.3c, available at:http://dx.doi.org/10.1787/888932664252 and http://dx.doi.org/10.1787/888932664271.
100
90
80
70
60
50
% Men Women
Korea
Turke
yJa
pan
Chile
Mexico Ita
ly
Czech
Rep
ublic
Greece
Hunga
ry
United
States
Spain
Slovak
Rep
ublic
Luxe
mbourg
Irelan
d
Canad
a
OECD av
erag
e
New Ze
aland
Eston
ia
Austra
liaIsr
ael
Franc
e
Austri
aBraz
il
Belgium
United
Kingdo
mPola
nd
Finlan
d
German
y
Switzerl
and
Denmark
Netherl
ands
Portug
al
Sloven
ia
Sweden
Icelan
d
Norway
60
50
40
30
20
10
0
% Men Women
Korea
Turke
yJa
pan
Chile
Mexico Ita
ly
Czech
Rep
ublic
Greece
Hunga
ry
United
States
Spain
Slovak
Rep
ublic
Luxe
mbourg
Irelan
d
Canad
a
OECD av
erag
e
New Ze
aland
Eston
ia
Austra
liaIsr
ael
Franc
e
Austri
aBraz
il
Belgium
United
Kingdo
mPola
nd
Finlan
d
German
y
Switzerl
and
Denmark
Netherl
ands
Portug
al
Sloven
ia
Sweden
Icelan
d
Norway
EDUCATION AT A GLANCE 2012: HIGHLIGHTS © OECD 2012 31

2. THE ECONOMIC AND SOCIAL BENEFITS OF EDUCATION
What are the incentives for people to invest in education?
– Rewards are typically higher for individuals who attain tertiaryeducation than those with upper secondary education or post-secondary non-tertiary education.
– Tertiary education brings substantial rewards across OECDcountries, generating net returns of USD 162 000 for men andUSD 110 000 for women.
– Individuals invest an average USD 55 000 to acquire a tertiaryeducation qualification, taking into account direct costs such astuition fees and indirect costs such as loss of earnings whilestudying.
Significance
The efforts people make to continue education aftercompulsory schooling can be thought of as an investmentwith the potential to bring rewards in the form of futurefinancial returns. People invest in education in two ways(these are the “costs”): directly, for example through thepayment of tuition fees, and indirectly, by sacrificingpotential income when not in work and studying. As withany investment, a rate of return can be calculated. In thiscase, the rate is primarily driven by the reality that peoplewith higher levels of education earn more and are morelikely to be in work (“benefits”). Where the rate of return ishigh, it implies a real financial incentive for people tocontinue their education.
Findings
On average across OECD countries, investing in tertiaryeducation is associated with net returns more than 60%larger than those linked to upper secondary education,reflecting the fact that an upper secondary education hasbecome the norm in OECD countries.
Men generally enjoy better financial returns on their uppersecondary education, except in Estonia, Hungary, Italy,Poland and Spain. On average net returns are close toUSD 90 000 for men and USD 67 000 for women. Thereturns for investing in tertiary education are also higherfor men, except in Australia, where average returns arenearly identical between men and women, and in Spainand Turkey, where the returns are higher for women. Netreturns associated with a tertiary education are close toUSD 162 000 for men and USD 110 000 for women.
A man who invests in upper secondary or post secondarynon-tertiary education can expect a net gain of more thanUSD 90 000 during his working life over a man who has notattained that level of education. But behind these averageslie big variations between countries. In Ireland, Korea,the Slovak Republic and the United States, this levelof education generates a net gain for a man of overUSD 150 000. In Estonia, Finland, Germany, Poland andTurkey, however, these net benefits are less than USD 40 000.
Tertiary education brings substantial net returns for men inPortugal and the United States, where an investmentgenerates over USD 300 000 and thus provides a strongincentive to complete this level of education. The returnson tertiary education are lower in Denmark, Estonia,New Zealand, Sweden and Turkey, where a man with atertiary education can expect a net gain of betweenUSD 52 000 and USD 74 000 over his working life. Much ofthe difference between countries is driven by gaps inearnings.
An individual invests an average USD 55 000 to acquire atertiary qualification, when direct and indirect costs aretaken into account. For a man in Japan, the Netherlands, theUnited Kingdom and the United States, this investmentexceeds USD 100 000. Government grants are particularlyimportant in Austria, Finland and the Netherlands, wherethey account for between 14% and 15% of total costs, forboth men and women. In Denmark, about 45% of what anindividual invests in tertiary education is covered by govern-ment grants.
Definitions
The economic returns to education are measured in termsof net present value, or NPV. In the calculations, privateinvestment costs include after-tax foregone earningsadjusted for the probability of finding a job (unemploymentrate) and direct private expenditures on education. The dis-count rate is set at 3%, which largely reflects the typicalinterest on an investment in long-term government bondsin an OECD country. The rate used in this edition is belowthe rate of 5% used in Education at a Glance 2009. Thischange has a substantial impact on the net present value ofeducation and needs to be taken into account if the resultsfor these two years are compared.
Information on data for Israel:http://dx.doi.org/10.1787/888932315602.
Going further
For additional material, notes and a full explanationof sourcing and methodologies, as well as a technicalexplanation of how the NPV is derived, see Educationat a Glance 2012 (Indicator A9).
Areas covered include:
– Private costs and benefits of tertiary education, bygender.
EDUCATION AT A GLANCE 2012: HIGHLIGHTS © OECD 201232

2. THE ECONOMIC AND SOCIAL BENEFITS OF EDUCATION
What are the incentives for people to invest in education?
Figure 2.5. Private costs and benefits for women obtaining tertiary education, 2008
This figure shows the private costs (tuition fees and foregone earnings) and private benefits (increased lifetime earnings) forwomen obtaining tertiary education as part of initial education. On average across OECD countries, a woman investing intertiary education can expect a net gain of USD 110 000.
Source: OECD (2012), Education at a Glance 2012, Table A9.3, available at: http://dx.doi.org/10.1787/888932665563.
Figure 2.6. Private costs and benefits for men obtaining tertiary education, 2008
This figure shows the private costs (tuition fees and foregone earnings) and private benefits (increased lifetime earnings) formen obtaining tertiary education as part of initial education. On average across OECD countries, a man investing in tertiaryeducation can expect a net gain of close to USD 162 000.
Source: OECD (2012), Education at a Glance 2012, Table A9.3, available at: http://dx.doi.org/10.1787/888932665563.
-200 000 -100 000 0 100 000 200 000 300 000
Private cost Private benefit
Equivalent USD
TurkeySlovak Republic
HungaryPoland
SloveniaPortugal
Czech RepublicEstonia
BelgiumSpainIsrael
AustraliaCanada
OECD averageDenmark
ItalyNew Zealand
FinlandFrance
SwedenAustriaNorway
GermanyIrelandKoreaJapan
NetherlandsUnited States
United Kingdom
-200 000 -100 000 0 200 000100 000 300 000 400 000 500 000
Private cost Private benefit
Equivalent USD
TurkeySlovak Republic
HungaryPoland
SloveniaCzech Republic
EstoniaPortugalBelgium
SpainIsrael
CanadaAustraliaDenmark
OECD averageNew Zealand
ItalyFinlandFrance
SwedenAustriaIreland
NorwayGermany
KoreaJapan
NetherlandsUnited States
United Kingdom
EDUCATION AT A GLANCE 2012: HIGHLIGHTS © OECD 2012 33

2. THE ECONOMIC AND SOCIAL BENEFITS OF EDUCATION
What are the incentives for societies to invest in education?
– As with returns to individuals, the benefits to the public purseare higher when people complete tertiary rather than uppersecondary education.
– On average among OECD countries, the net public return on aninvestment in tertiary education is over USD 100 000 for a man– nearly three times the amount of public investment – andover USD 52 000 for a woman.
– On average across OECD countries, over USD 92 000 is investedin a man’s tertiary education, taking into account both publicand private spending.
Significance
The economic benefits of education flow not just to indi-viduals but also to governments through additional taxreceipts and lower social welfare payments when peopleenter the labour market. These public returns, which takeinto account the fact that providing education is also a costto governments, offer an additional perspective on theoverall returns to education. At the same time, they mustbe understood in the much wider context of the benefitsthat economies and societies gain from increasing levels ofeducation.
Findings
On average across OECD countries, investing in uppersecondary or post-secondary non-tertiary education gener-ates a public net return of USD 36 000 for men and aroundUSD 14 000 less for women across their working life. Publicreturns for a man are positive in all countries exceptEstonia; and for a woman in all countries except in Estonia,Israel and Korea. In Austria, Ireland and the UnitedKingdom, this investment generates a net return of morethan USD 70 000 per man. Public benefits are about twiceas large, on average, as the overall public costs for uppersecondary or post-secondary non-tertiary education, forboth men and women.
Public returns from tertiary education are substantiallylarger, in part because larger shares of the investment costsare borne by the individuals themselves. On average acrossOECD countries, the net public return on an investment intertiary education is over USD 100 000 for a man and overUSD 52 000 for a woman. Public benefits correspond to fourtimes the amount of public investments for men and morethan twice the amount for women. In Hungary, the benefitsare 14 times larger than the public sector’s initial invest-ment in a man’s tertiary education.
For the public sector, the costs of education include directexpenditures on education (such as paying teachers’salaries), public-private transfers, and lost tax revenues onstudents’ foregone earnings. The benefits includeincreased revenue from income taxes and social insurance
payments on higher wages as well as a lower need forsocial transfers (housing benefits and social assistance)that the public sector does not have to pay above a certainlevel of earnings. But in practice, rising levels of educationproduce a much wider – and more complex – set of fiscaleffects on the benefit side. For instance, better educatedindividuals generally have better health, which lowerspublic expenditure on provision of health care. Also, theirearnings premium means they spend more on goods andservices, leading to wider economic benefits.
Together with foregone public earnings in the form of taxesand social contributions, direct and indirect public invest-ment costs for a man with a tertiary education are onaverage USD 36 000 among OECD countries. These costsexceed USD 50 000 in Denmark, Finland, Germany, theNetherlands, Norway and Sweden. In Korea and Turkey, thetotal public investment cost does not exceed USD 15 000.
Definitions
The economic returns to education are measured by the netpresent value or NPV. In the calculations, public costsinclude lost income tax receipts during the school years, andpublic expenditures. The discount rate is set at 3%, whichlargely reflects the typical interest on an investment in long-term government bonds in an OECD country. The rate usedin this edition is below the rate of 5% used in Education at aGlance 2009. This change has a substantial impact on the netpresent value of education and needs to be taken intoaccount if the results for these two years are compared.
Information on data for Israel:http://dx.doi.org/10.1787/888932315602.
Further reading from OECD
Understanding the Social Outcomes of Learning (2007).
Going further
For additional material, notes and a full explanationof sourcing and methodologies, see Education at aGlance 2012 (Indicator A9).
Areas covered include:
– Public rates of return for an individual obtainingtertiary education, as part of initial education.
– Public rates of return for an individual obtaining anupper secondary education or post-secondarynon-tertiary education, as part of initial education.
EDUCATION AT A GLANCE 2012: HIGHLIGHTS © OECD 201234

2. THE ECONOMIC AND SOCIAL BENEFITS OF EDUCATION
What are the incentives for societies to invest in education?
Figure 2.7. Public costs and benefits for a woman obtaining tertiary education, 2008
This figure shows the public costs (direct expenditure and forgone tax revenues) and public benefits (increased tax revenuesand lower need for social transfers, among others) for a woman who successfully completes tertiary education as part of herinitial education. On average across OECD countries, the net public return from an investment in tertiary education exceedsUSD 52 000 for a woman.
Source: OECD (2012), Education at a Glance 2012, Table A9.4, available at: http://dx.doi.org/10.1787/888932665582.
Figure 2.8. Public costs and benefits for a man obtaining tertiary education, 2008
This figure shows the public costs (direct expenditure and forgone tax revenues) and public benefits (increased tax revenuesand lower need for social transfers, among others) for a man who successfully completes tertiary education as part of hisinitial education. On average across OECD countries, the net public return from an investment in tertiary education is overUSD 100 000 for a man.
Source: OECD (2012), Education at a Glance 2012, Table A9.4, available at: http://dx.doi.org/10.1787/888932665582.
-100 000 -50 000 0 50 000 100 000 150 000 200 000
Public cost Public benefit
KoreaTurkey
PortugalCzech Republic
HungaryPoland
IsraelAustralia
Slovak RepublicUnited Kingdom
SloveniaEstonia
BelgiumJapan
ItalyCanada
New ZealandOECD average
IrelandSpain
FranceUnited States
AustriaFinland
SwedenNorway
GermanyNetherlands
Denmark
Equivalent USD
-100 000 -50 000 0 50 000 100 000 150 000 200 000 250 000 300 000
Public cost Public benefit
Equivalent USD
KoreaTurkey
PortugalCzech Republic
HungaryIsrael
PolandAustralia
Slovak RepublicSloveniaEstonia
BelgiumItaly
CanadaNew Zealand
United KingdomJapan
IrelandOECD average
SpainUnited States
FranceAustriaFinland
SwedenNorway
GermanyNetherlands
Denmark
EDUCATION AT A GLANCE 2012: HIGHLIGHTS © OECD 2012 35

2. THE ECONOMIC AND SOCIAL BENEFITS OF EDUCATION
What are the social benefits of education?
– Adults with higher levels of educational attainment are morelikely to live longer, show higher levels of civic engagement andexhibit greater satisfaction with life.
– There is a clear positive relationship between education and lifeexpectancy, although it is not as strong for women.
– There are significant differences in voting behaviour associatedwith educational attainment in most countries. On average, thegap in the voting rate between high- and low-educated adultsis 14.8 percentage points. This gap is particularly wide amongyoung adults with a difference of 26.8 percentage points.
Significance
Raising people’s well-being and improving social cohesionare major concerns for OECD governments. There isgeneral agreement on the important role that educationand skills can play in attaining these outcomes, but far lesscertainty over how exactly this can be achieved. Thissection looks at the relationship between educationalattainment and social measures of well-being in OECDcountries. It focuses on three outcomes: life expectancy,voting and life satisfaction.
Findings
Education is an important predictor of life expectancy. Menwith tertiary education can expect to live eight years longerthan those who have not attained upper secondary educa-tion. The difference is four years among women, althoughon average they live longer than men overall. Differences inlife expectancy are particularly large among men in centralEuropean countries. On average, a 30 year-old man withtertiary education in the Czech Republic can expect to live17 years longer than a 30 year-old man who has notcompleted upper secondary education.
Voting behaviour is also associated with educationalattainment in most countries. On average, the gap in votingrates between adults (25-64 year olds) with tertiary degreesand those not having reached upper-secondary educationis 14.8 percentage points. This gap is considerably wideramong younger adults aged 25-34, at 26.8 percentagepoints. For younger adults in Germany, this gap reaches49.6 percentage points. Furthermore, students in grade 8(approximately 14 years old), with higher levels of civiccompetencies show more supportive attitudes towardsequal rights for ethnic minorities. In New Zealand, for
example, those with strong civic knowledge score anaverage 56.1 points on a scale measuring support for equalrights for ethnic minorities, while those with lower civicknowledge only score an average 45.6 points.
Finally, adults with higher levels of educational attainmentare generally more likely than those with lower levels ofattainment to engage in social activities and exhibit greatersatisfaction with life.
Definitions
Developmental work for this indicator was carried out byINES Network on Labour Market, Economic and SocialOutcomes of Learning in collaboration with the OECD’s Centrefor Educational Research and Innovation (CERI). Calculationsare based on data from the EUROSTAT Statistical Database,STATCAN’s CANSIM Database for Canada, FitzGerald, Byre andZnuderl (2011) for Ireland, Centers for Disease Control andPrevention (CDC) (2010) for the United States, European SocialSurvey (ESS) 2008 and 010, General Social Survey (GSS)2008 for Canada; Current Population Survey (CPS) 2008 for theUnited States; Estudo Eleitoral Brasileiro (ESEB) 2010 for Brazil.
Information on data for Israel:http://dx.doi.org/10.1787/888932315602.
Further reading from OECD
Improving Health and Social Cohesion through Education (2010).
Going further
For additional material, notes and a full explanationof sourcing and methodologies, see Education at aGlance 2012 (Indicator A11).
Areas covered include:
– Education level and life expectancy, voter turnoutand engagement in social activities.
– Relationship between education level and civicbehaviour.
EDUCATION AT A GLANCE 2012: HIGHLIGHTS © OECD 201236

2. THE ECONOMIC AND SOCIAL BENEFITS OF EDUCATION
What are the social benefits of education?
Figure 2.9. Life expectancy gaps between levels of education, by gender, 2010
This figure shows the differences in expected years of life remaining at age 30 between high educated and low educated,by gender.
Source: OECD (2012), Education at a Glance 2012, Table A11.1, available at: http://dx.doi.org/10.1787/888932665753.
Figure 2.10. Voting gaps between levels of education, by age group, 2010
This figure shows the differences in electoral participation between people with high and low levels of education, at differentages. Countries with compulsory voting are included in the data, i.e. Belgium, Greece and Turkey.
Source: OECD (2012), Education at a Glance 2012, Table A11.2, available at: http://dx.doi.org/10.1787/888932665772.
18
16
14
12
10
8
6
4
2
0
Men Women
Portug
al
Sweden
Netherl
ands Ita
ly
Canad
a
Denmark
Finlan
d
Norway
Irelan
d
OECD av
erag
e
United
States
Sloven
ia
Poland
Hunga
ry
Eston
ia
Czech
Rep
ublic
50 45 40 35 30 25 20 15 10 5 0 -5 -5 0 5 10 15 20 25 30 35 40 45 50Percentage pointsPercentage points
Voting gaps between high and low educatedyounger adults (age 25-34)
Voting gaps between high and low educatedolder adults (age 55-64)
GreeceIrelandTurkeyBrazilSpain
HungarySlovak Republic
IsraelRussian Federation
PortugalBelgiumDenmark
OECD averageCanadaNorwaySlovenia
NetherlandsSweden
United KingdomEstoniaPolandFinland
SwitzerlandFrance
Czech RepublicAustria
GermanyUnited States
EDUCATION AT A GLANCE 2012: HIGHLIGHTS © OECD 2012 37

2. THE ECONOMIC AND SOCIAL BENEFITS OF EDUCATION
How does education affect the economy?
– More than half of the GDP growth in OECD countries over thepast decade is related to labour income growth among tertiary-educated individuals.
– Employers pay almost twice as much for a 45-54 year-oldworker with tertiary education, than for someone without anupper secondary education.
– The most attractive wages for people with tertiary educationare found in Australia, Austria, Ireland, Luxembourg, theNetherlands, the United Kingdom and the United States, whereaverage spending power exceeds USD 40 000 per year.
Significance
The skills available in the labour force and the price ofthose skills determine how countries will fare in the globalmarket. As services and production systems become morecomplex, they require workers with higher levels of educa-tion. In order to attract and retain skilled workers, it isimportant for societies to strike the right balance betweenfostering overall equity and offering strong economicincentives.
Increasing attainment levels in the population, betteremployment prospects and the increasing earnings thatcome with higher educational attainment can all contrib-ute to growth and prosperity in OECD countries. In thiscontext, labour income growth in GDP by educationalcategories provides a simple measure to illustrate thismove towards higher skills and the impact it has oneconomic growth.
Findings
On average, about half of the economic growth is related tolabour income growth at the tertiary level of education. InFrance, Norway, Switzerland and the United Kingdom,60% or more of growth in gross domestic product (GDP) isgenerated by those who have attained a tertiary education.In Denmark and Ireland, the labour income growth of thosewith tertiary education exceeds GDP growth, largely as aconsequence of a strong shift towards higher skills and theimpact of the global economic crisis on overall economicactivity in these countries.
Annual labour costs increase substantially with educa-tional attainment. On average across OECD countries, aperson without an upper secondary education costsUSD 38 000 to employ, an individual with an upper second-ary education costs USD 46 000 and a tertiary-educatedperson costs USD 68 000 per year. In Austria, Denmark,Ireland, Italy, Luxembourg, the Netherlands, Norway andthe United States, over the course of a year, employers payat least USD 20 000 more than the OECD average to employindividuals with tertiary degrees.
The most attractive wages for tertiary-educated individualsare found in Australia, Austria, Ireland, Luxembourg, the
Netherlands, the United Kingdom and the United States,where average net spending power exceeds USD 40 000 peryear. There are substantial differences in labour-related taxpolicies among OECD countries. After accounting for taxesand compulsory contributions, an individual between theages of 45 and 54 without an upper secondary educationcan, on average across OECD countries, expect to keep62% of labour costs in net income, while a tertiary-educated worker can expect to keep 56% of those costs.This figure reaches 70% or more for an individual with atertiary education in Israel, Korea and New Zealand, whileit is below 50% in Austria, Belgium, France, Germany,Hungary, Italy, the Netherlands and Sweden.
Trends
Even during the recent economic downturn, labour incomegrowth among tertiary graduates generated a positiveimpact on GDP of more than half a percentage point peryear (between 2008 and 2010). While GDP shrank by almost4% across OECD countries in 2009, labour income growthamong tertiary graduates still made a positive contributionto GDP of 0.4%.
Definitions
This indicator is based on data on GDP and labour incomeextracted from the OECD National Account Statistics Databasein September 2011. Data on earnings are supplementedwith information on employers’ social contributions andnon-tax compulsory payments from the OECD’s TaxingWages Database.
Information on data for Israel:http://dx.doi.org/10.1787/888932315602.
Further reading from OECD
Taxing Wages (2011).
Going further
For additional material, notes and a full explanationof sourcing and methodologies, see Education at aGlance 2012 (Indicator A10).
Areas covered include:
– Relationship between GDP growth and labourincome growth.
EDUCATION AT A GLANCE 2012: HIGHLIGHTS © OECD 201238

2. THE ECONOMIC AND SOCIAL BENEFITS OF EDUCATION
How does education affect the economy?
Figure 2.11. Average GDP growth over one year and labour income growth by education levels between 2000 and 2010
This figure shows the correlation between GDP growth and labour income growth between 2000 and 2010. In manycountries, over half of the GDP growth is related to labour income growth at the tertiary level of education.
Source: OECD (2012), Education at a Glance 2012, Table A10.1, available at: http://dx.doi.org/10.1787/888932665620.
Figure 2.12. Average labour income by education level (2009 or latest available year)
This figure compares average labour income by education level across countries, in PPP-adjusted USD.
Source: OECD (2012), Education at a Glance 2012, Table A10.2, available at: http://dx.doi.org/10.1787/888932665639.
5
4
3
2
1
0
-1
% Upper secondary education
GDP growth
Below upper secondary education
Tertiary education
Israe
lKor
ea
Czech
Rep
ublic
New Ze
aland
Sweden
Finlan
d
Canad
a
Countri
es’ av
erag
e
Switzerl
and
United
States
Hunga
ry
Norway
United
Kingdo
mAus
tria
German
y
Franc
e
Irelan
d
Denmark
60 000
55 000
50 000
45 000
40 000
35 000
30 000
25 000
20 000
15 000
10 000
5 000
0
Below upper secondary education Upper secondary education Tertiary education
Luxe
mbourg
United
States
Austri
a
Irelan
d
Netherl
ands
Austra
lia
United
Kingdo
m
Canad
aKor
ea
Norway
German
yIta
ly
Sweden
OECD av
erag
e
Czech
Rep
ublic
New Ze
aland
Denmark
Finlan
d
Icelan
d
Franc
e
Belgium Spa
inIsr
ael
Sloven
ia
Portug
al
Greece
Slovak
Rep
ublic
Hunga
ry
Poland
Eston
ia
Equivalent USD
EDUCATION AT A GLANCE 2012: HIGHLIGHTS © OECD 2012 39


EDUCATION AT A GLANCE 2012: HIGHLIG
3. PAYING FOR EDUCATION
How much is spent per student?
Has spending per student increased?
What share of national wealth is spent on education?
What share of public spending goes to education?
What is the role of private spending?
How much do tertiary students pay?
What are education funds spent on?
How much do teachers cost?
HTS © OECD 2012 41

3. PAYING FOR EDUCATION
How much is spent per student?
– OECD countries on average spend USD 9 252 per student eachyear between primary and tertiary education, although spend-ing levels vary widely among countries.
– On average, OECD countries spend nearly twice as much perstudent at the tertiary level than at the primary level.
– Most spending in education is devoted to salaries for teachersand other staff.
Significance
This section shows the levels of combined public andprivate spending on education. In debates about learning,demand for high-quality education, which may meanspending more per student, is often tempered by the desireto keep taxes low. This issue is all the more important at atime of economic crisis and tight public spending. While itis difficult to determine the level of spending needed toprepare a student for work and life, international compa-risons can provide reference points for comparisons ofeducation resources.
Findings
OECD countries on average spend USD 9 252 per student eachyear across primary, secondary and tertiary education. Butspending varies widely between countries, ranging fromUSD 4 000 per student or less in Argentina, Brazil, Chile,Indonesia, Mexico and South Africa, to more than USD 10 000in Australia, Austria, Belgium, Denmark, Ireland, Japan, theNetherlands, Norway, Sweden, Switzerland and the UnitedKingdom, and more than USD 15 000 in the United States.
The factors that drive spending vary among countries. Forexample, among the ten countries with the highest expendi-ture at the secondary level, Belgium, Denmark, Ireland,Luxembourg, the Netherlands, Switzerland and the UnitedStates are among the ten countries with the highestteachers’ salaries, while Austria, Belgium, Denmark andNorway are among the countries with the lowest student-to-teacher ratios.
In every OECD country, spending rises sharply fromprimary to tertiary education. OECD countries on averagespend USD 7 719 per student at primary level, USD 9 312 atsecondary level and USD 13 728 at tertiary level.
Most spending in education is devoted to salaries for teach-ers and other staff as well as other core services (schoolbuildings, teaching materials, books and administration). Atthe tertiary level, however, other services, particularlyresearch and development activities (R&D), also constitute a
large slice of expenditure. R&D expenditure represents anaverage of 31% of total expenditure per tertiary student andcan account for more than 40% in Norway, Portugal, Swedenand Switzerland. Once R&D activities and ancillary servicesare excluded, expenditure by educational core servicesin tertiary institutions falls to an average USD 8 944 perstudent. By contrast, spending on ancillary services atprimary, secondary and post-secondary non-tertiary levelsexceeds 10% of the total expenditure per student only inFinland, France, Hungary, Korea, the Slovak Republic,Sweden and the United Kingdom.
Finally, it should be noted that examining only the annualspending per student may not fully reflect the total spent ona student at each level of education. For example, annualspending per tertiary student in Japan is about the same asin Belgium, at USD 15 957 and USD 15 443, respectively.However, it takes more than one year longer to complete atertiary degree in Japan than in Belgium. As a result, thecumulative expenditure for each tertiary student is nearlyUSD 20 000 less in Belgium than in Japan – USD 46 175 versusUSD 66 856.
Definitions
Data refer to the financial year 2009 and are based on theUOE data collection on education statistics administered bythe OECD in 2011. Spending per student at a particular levelof education is calculated by dividing the total expenditureof educational institutions at that level by the correspondingfull-time equivalent enrolment.
Information on data for Israel:http://dx.doi.org/10.1787/888932315602.
Going further
For additional material, notes and a full explanationof sourcing and methodologies, see Education at aGlance 2012 (Indicator B1).
Areas covered include:
– Annual expenditure by educational institutions perstudent for all services, and compared to GDP percapita.
– Cumulative expenditure by educational institutionsper student.
EDUCATION AT A GLANCE 2012: HIGHLIGHTS © OECD 201242

3. PAYING FOR EDUCATION
How much is spent per student?
Figure 3.1. Annual expenditure per student, 2009
This figure shows how much is spent annually (by educational institutions) per student between primary and tertiaryeducation; these data give a sense of the cost per student of formal education.
Source: OECD (2012), Education at a Glance 2012, Table B1.2, available at: http://dx.doi.org/10.1787/888932665905.
Figure 3.2. Expenditure on education relative to spending on primary education, 2009
This figure shows annual spending (by educational institutions) per student for different levels of education compared withspending at primary level.
Source: OECD (2012), Education at a Glance 2012, Table B1.1a, available at: http://dx.doi.org/10.1787/888932665867.
18 000
16 000
14 000
12 000
10 000
8 000
6 000
4 000
2 000
0
Core services Ancillary services (transport, meals, housing provided by institutions) and R&D Total
USD converted using PPPs
United
States
Austri
a
Netherl
ands
Irelan
d
Belgium
Austra
lia
Sweden
Spain
German
yIta
ly
Franc
e
Sloven
ia
Finlan
d
United
Kingdo
m
OECD av
erag
eKor
ea
Portug
alIsr
ael
Czech
Rep
ublic
Poland
Hunga
ry
Slovak
Rep
ublic
Chile
Mexico
Brazil
Switzerl
and
Norway
Denmark
Japa
n
Icelan
d
New Ze
aland
Eston
ia
Russia
n Fed
eratio
n
Argen
tina
South
Africa
Indon
esia
350
300
250
200
150
100
50
0
488 367
Pre-primary education Secondary education Tertiary education
Index
The 100 baseline shows spending per student at primary level,so a ratio of 300 shows spending is three times higher than at primary level.By contrast, a ratio of 50 indicates spending is half that at primary level.
Brazil
Mexico
United
States
Canad
a
German
y
South
Africa
Chile
Franc
e
Netherl
ands
Finlan
d
Indon
esia
Israe
l
Sweden
Japa
n
Switzerl
and
Irelan
d
Czech
Rep
ublic
Austra
lia
Hunga
ry
Belgium Spa
in
Portug
al
United
Kingdo
m
OECD av
erag
e
Denmark
Argen
tina
Norway
New Ze
aland
Poland
Korea
Austri
a
Slovak
Rep
ublic
Eston
iaIta
ly
Icelan
d
EDUCATION AT A GLANCE 2012: HIGHLIGHTS © OECD 2012 43

3. PAYING FOR EDUCATION
Has spending per student increased?
– Expenditure by educational institutions per student at primary,secondary and post-secondary non-tertiary levels increased bymore than 36% on average between 2000 and 2009, a periodwhen enrolment levels remained generally static.
– At the tertiary level, spending per student rose by 15% onaverage in OECD countries between 2000 and 2009. However,in six countries spending per student fell because overall spend-ing did not keep pace with a rise in student numbers.
– As of 2009, the economic crisis had not yet affected investmentin education in most OECD countries.
Significance
This section looks at whether spending on education hasrisen or fallen in recent years. Policy makers are underconstant pressure to improve the quality of educationalservices while expanding access to educational opportuni-ties, in particular at the tertiary level. Over time, spendingon educational institutions tends to rise, in large partbecause teachers’ salaries rise in line with general earn-ings. However, if the cost of schooling each student is notaccompanied by improvements in educational outcomes, itraises the spectre of falling productivity levels.
Findings
Spending per student by educational institutions at theprimary, secondary and post-secondary non-tertiary levelsincreased in OECD countries by an average of 56%between 1995 and 2009. The increase is quite similar overthe periods 2000-05 and 2005-09, showing that the globaleconomic crisis has not yet affected investment in educationin most countries. Only Hungary and Mexico showed adecrease in expenditure per student at these levels of educa-tion between 2005 and 2009. In 24 countries, expenditureper primary, secondary and post-secondary non-tertiarystudent increased by at least 16% between 2000 and 2009.The increase exceeded 50% in Brazil, the Czech Republic,Estonia, Hungary, Ireland, Korea, Poland, the Slovak Republicand the United Kingdom. By contrast, in France, Israel andItaly, this expenditure increased by only 10% or lessbetween 2000 and 2009. Changes in enrolments do not seemto have been the main factor behind changes in expenditureat these levels.
The pattern is different at the tertiary level. In some cases,spending per student fell between 1995 and 2009, asexpenditure did not keep up with expanding enrolments.Between 2000 and 2009, Iceland, Israel and the United Statesrecorded a decrease in per-student expenditure in tertiaryeducation. This is also the case in Brazil, Hungary andSwitzerland, where public expenditure per studentdecreased during the period. In all of these countries, thedecline was mainly the result of a rapid increase of 25% ormore in the number of tertiary students. On average in OECDcountries, such spending remained stable between 1995
and 2000 but then increased in 2000-05 and 2005-09, asgovernments invested massively in response to the expan-sion of tertiary education. Between 2000 and 2009, Estonia,Korea, Portugal, Spain and the United Kingdom increasedexpenditure per student by 30% or more.
Trends
In many OECD countries, expenditure has not kept up withexpanding enrolments. In addition, some OECD countriesemphasise broad access to higher education, while othersinvest in near-universal education for children as young asthree or four.
Both investment in education and the number of studentsenrolled in education can be affected by financial crises.Consequently, the recent global economic crisis is likely tohave resulted in changes in the level of expenditure perstudent. However, because the crisis began in late 2008,available data cannot show yet the full extent of thisimpact.
Definitions
Data for the 2009 financial year are based on the UOE datacollection on education statistics administered by theOECD in 2011. OECD countries were asked to collectthe 1995, 2000 and 2005 data according to the definitionsand the coverage of UOE 2011 data collection. All expen-diture data, as well as the GDP for 1995, 2000 and 2005, areadjusted to 2009 prices using the GDP price deflator. Spend-ing per student at a particular level of education is calcu-lated by dividing the total expenditure of educationalinstitutions at that level by the corresponding full-timeequivalent enrolment.
Information on data for Israel:http://dx.doi.org/10.1787/888932315602.
Further reading from OECD
Trends Shaping Education 2010.
Going further
For additional material, notes and a full explanationof sourcing and methodologies, see Education at aGlance 2012 (Indicator B1).
Areas covered include:
– Changes in expenditure by educational institutionsby level of education.
– Changes in expenditure and in GDP per capita.
EDUCATION AT A GLANCE 2012: HIGHLIGHTS © OECD 201244

3. PAYING FOR EDUCATION
Has spending per student increased?
Figure 3.3. Trends in expenditure per student in non-tertiary education (2000, 2009)
This figure shows the increase or decline in spending in real terms per student in primary, secondary and post-secondarynon-tertiary education.
Source: OECD (2012), Education at a Glance 2012, Table B1.5a, available at: http://dx.doi.org/10.1787/888932665981.
Figure 3.4. Trends in expenditure per student in tertiary education (2000, 2009)
This figure shows the increase or decline in spending in real terms per student in tertiary education.
Source: OECD (2012), Education at a Glance 2012, Table B1.5b, available at: http://dx.doi.org/10.1787/888932666000.
250
200
150
100
50
0
Brazil
Slovak
Rep
ublic
Eston
iaKor
ea
Irelan
d
Czech
Rep
ublic
Poland
United
Kingdo
m
Hunga
ry
Austra
lia
OECD av
erag
e
Canad
aSpa
in
Netherl
ands
Icelan
d
Finlan
d
Switzerl
and
United
States
Sweden
Norway
Portug
al
Mexico
Austri
aJa
pan
German
y
Belgium
Denmark
Israe
l
Franc
eIta
ly
Bars below this line indicate spending per student has fallen;bars above indicate it has risen since 2000.
Index of change 2000 = 100
180
160
140
120
100
80
60
40
20
0
United
Kingdo
mKor
ea
Eston
iaSpa
in
Portug
al
Poland
Finlan
d
Czech
Rep
ublic
Mexico
Austri
aJa
pan
Denmark
Franc
e
Irelan
d
OECD av
erag
e
Belgium Ita
ly
Sweden
German
y
Norway
Slovak
Rep
ublic
Netherl
ands
Hunga
ryBraz
il
Icelan
d
United
States
Israe
l
Switzerl
and
Bars below this line indicate spending per student has fallen;bars above indicate it has risen since 2000.
Index of change 2000 = 100
EDUCATION AT A GLANCE 2012: HIGHLIGHTS © OECD 2012 45

3. PAYING FOR EDUCATION
What share of national wealth is spent on education?
– OECD countries spend 6.2% of their GDP on educationalinstitutions, on average.
– Between 2000 and 2009, expenditure on educational institu-tions across all levels of education increased by an average of36% in OECD countries, reflecting the fact that more people arecompleting upper secondary and tertiary education than everbefore.
– Despite the economic crisis, expenditure for all levels of educa-tion combined increased in 24 out of the 31 countries withavailable data between 2008 and 2009, although GDP in 26 ofthese countries decreased.
Significance
This section examines the proportion of a nation’s wealththat is invested in education. In other words, it shows to whatextent a country – including its government, private enter-prise, individual students and their families – prioritiseseducation in relation to overall spending.
Findings
OECD countries spend 6.2% of their GDP on education, onaverage, although the proportions vary by country: above7% in Denmark, Iceland, Israel, Korea, New Zealand andthe United States, but less than 5% in the Czech Republic,Hungary, India, Indonesia, Italy, the Slovak Republic andSouth Africa.
About 64% of OECD expenditure on educational institu-tions, or 4.0% on average of GDP, is devoted to primary,secondary and post-secondary non-tertiary education.Tertiary education accounts for nearly one-quarter of theaverage OECD spending on education, or on average 1.6% ofGDP. Canada, Chile, Korea and the United States spendbetween 2.4% and 2.6% of their GDP on tertiary institutions.Four countries devote less than 1% of GDP to tertiary educa-tion, namely Brazil (0.8%), Indonesia (0.7%), the SlovakRepublic (0.9%) and South Africa (0.6%). In Belgium, Brazil,France, Iceland, Norway, Portugal, Switzerland and theUnited Kingdom the share of GDP spent on tertiary institu-tions is below the OECD average while the share of GDPspent on primary, secondary and post-secondary non-tertiary education is above the OECD average.
Differences in spending on educational institutions are moststriking at the pre-primary level, where they range from lessthan 0.2% of GDP in Australia, India, Indonesia, Ireland andSouth Africa to about 0.9% or more in Denmark, Iceland,Israel, Spain and the Russian Federation. However, as coun-tries often structure and fund pre-primary education in verydifferent ways, it is unsafe to draw inferences from thesedata on access to and quality of early childhood education.
Trends
With an unprecedented number of people completingsecondary and tertiary education between 2000 and 2009,many countries made massive financial investments ineducation during that period. For all levels of educationcombined, public and private investment in educationincreased on average by 36% in OECD countries over thisperiod.
The global economic crisis that began in 2008 had (and isstill having) a major negative impact on different sectors ofthe economy. While it is still early to assess the full impactof the crisis, education seems to have been spared fromearly budget cuts. Only Israel shows a decrease in expendi-ture on educational institutions as a percentage of GDP.Between 2008 and 2009, expenditure on education institu-tions started to fall in Belgium, Estonia, Iceland, Italy, Japanand the United States but the reductions seen in these sixcountries were smaller than the drop in GDP. As a result,the share of GDP devoted to education continued to rise. Inthe remaining countries, education expenditure increasedby an average of 4%.
Definitions
Data refer to the 2009 financial year and are based on theUOE data collection on education statistics administered bythe OECD in 2011. Expenditure on educational institutionsincludes expenditure on both instructional institutions(those that provide teaching to individuals in an organisedgroup setting or through distance education) and non-instructional institutions (those that provide administra-tive, advisory or professional services to other educationalinstitutions, but do not enrol students themselves).
Information on data for Israel:http://dx.doi.org/10.1787/888932315602.
Going further
For additional material, notes and a full explanationof sourcing and methodologies, see Education at aGlance 2012 (Indicator B2).
Areas covered include:
– Expenditure on educational institutions as apercentage of GDP.
– Change in expenditure, 1995, 2000, 2005 and 2008-09.
EDUCATION AT A GLANCE 2012: HIGHLIGHTS © OECD 201246

3. PAYING FOR EDUCATION
What share of national wealth is spent on education?
Figure 3.5. Trends in education expenditure as a percentage of GDP (2000, 2009)
This figure shows the share of national income that countries devote to expenditure on educational institutions, and how thatshare has changed over time.
Source: OECD (2012), Education at a Glance 2012, Table B2.1, available at: http://dx.doi.org/10.1787/888932666076.
Figure 3.6. Expenditure as a percentage of GDP, 2009
These figures show the share of national income – both public and private – devoted to each level of education.
Source: OECD (2012), Education at a Glance 2012, Table B2.3, available at: http://dx.doi.org/10.1787/888932666114.
9
8
7
6
5
4
3
2
1
0
2009 2000
% of GDP
Icelan
dKor
ea
Denmark
New Ze
aland
United
States
Israe
l
Argen
tina
Chile
Sweden
Belgium
Finlan
d
Irelan
d
Franc
e
Eston
ia
Mexico
OECD av
erag
e
Netherl
ands
Norway
Canad
a
United
Kingdo
m
Austra
lia
Sloven
ia
Switzerl
and
Portug
al
Austri
a
Poland
Spain
Brazil
Russia
n Fed
eratio
n
German
yJa
pan
Italy
Hunga
ry
Czech
Rep
ublic
South
Africa
Slovak
Rep
ublic
Indon
esia
India
5.55.04.54.03.53.02.52.01.51.00.5
2.52.01.51.00.5
0
0
3.0
% of GDP
% of GDP
Primary, secondary and post-secondary non-tertiary education
Public expenditure Private expenditure
OECD average (total expenditure)
OECD average (total expenditure)
Icelan
d
New Ze
aland
Argen
tina
Denmark
Irelan
dKor
ea
United
Kingdo
m
Belgium
Switzerl
and
United
States
Sweden
Austra
lia
Eston
ia
Netherl
ands
Finlan
d
Franc
eIsr
ael
Mexico
Portug
al
Sloven
ia
Austri
aChil
e
Poland
Canad
aIta
ly
Luxe
mbourg
Spain
German
y
Slovak
Rep
ublic
Japa
n
Czech
Rep
ublic
Indon
esia
Russia
n Fed
eratio
nBraz
il
Norway
South
Africa
Hunga
ryInd
ia
Tertiary education
Icelan
d
New Ze
aland
Argen
tina
Denmark
Irelan
dKor
ea
United
Kingdo
m
Belgium
Switzerl
and
United
States
Sweden
Austra
lia
Eston
ia
Netherl
ands
Finlan
d
Franc
eIsr
ael
Mexico
Portug
al
Sloven
ia
Austri
aChil
e
Poland
Canad
aIta
ly
Luxe
mbourg
Spain
German
y
Slovak
Rep
ublic
Japa
n
Czech
Rep
ublic
Indon
esia
Russia
n Fed
eratio
nBraz
il
Norway
South
Africa
Hunga
ryInd
ia
EDUCATION AT A GLANCE 2012: HIGHLIGHTS © OECD 2012 47

3. PAYING FOR EDUCATION
What share of public spending goes to education?
– Public funding of education is a social priority, accounting for13% of total public spending, on average in OECD countries.
– Public expenditure on primary, secondary and post-secondarynon-tertiary education is on average more than twice that ontertiary education in OECD countries.
– The proportion of public spending devoted to educationincreased slightly between 1995 and 2009 in most countries.Over the period 2005-09 however, this proportion remainedstable.
Significance
Public spending on education, as a percentage of totalpublic spending, indicates the importance placed on edu-cation relative to that of other areas of public spending,such as health care, social security and national security.Since the second half of the 1990s, most OECD countrieshave sought to consolidate public budgets, and educationhas had to compete with several other sectors for publicfinancial support. This section evaluates the change inspending on education, both in absolute terms and relativeto changes in the size of public budgets.
Findings
On average, OECD countries devote 13% of total public expen-ditures to education, with levels ranging from less than 10% inthe Czech Republic, Italy, Japan and the Slovak Republic, tomore than 19% in Chile, Mexico and New Zealand.
Even in countries with relatively low rates of public spend-ing, education is considered a priority. For example, theshare of public spending devoted to education in Brazil,Chile, Mexico, New Zealand and Switzerland is among thehighest, yet total public spending accounts for a relativelylow proportion of GDP in these countries.
In most countries, about two-thirds of total public expendi-ture on education is devoted to primary, secondary andpost-secondary non-tertiary education. This is mainly dueto the near-universal enrolment rates at these levels ofeducation. The private share also tends to be greater at thetertiary level. In OECD and G20 countries, the percentagesof public expenditure devoted to the tertiary level rangefrom below 15% in the United Kingdom to over 30% inCanada, Finland and Norway.
Trends
Over the past 15 years (1995-2009), public expenditure onall levels of education has increased slightly in two-thirds
of the countries with available data. The 0.5 percentagepoint average increase, however, hides strong disparitiesbetween countries. Brazil, Denmark, the Netherlands,New Zealand, Sweden and Switzerland, have all increasedthe share of education in public spending by more than twopercentage points, while other countries, such as Mexico(–1.9 percentage points) have seen it decrease considerably.
In addition, spending patterns changed considerablybetween 2005 and 2009. During this period, public expendi-ture on education as a percentage of total expendituredecreased in 19 countries. The beginning of the economiccrisis in 2008, which put more pressure on public budgets,may be related to decreases in the later years. The largestdecrease was seen in Iceland with a 2.7 percentage pointfall. New Zealand, however, increased the share of publicspending on education as a percentage of total publicexpenditure by 5.8 percentage points.
Definitions
Data refer to the financial year 2009 and are based on theUOE data collection on education statistics administered bythe OECD in 2011. Public expenditure on education includesexpenditure by all public entities, including ministries otherthan the Ministry of Education, local and regional govern-ments and other public agencies. Total public expenditure,also referred to as total public spending, corresponds to thenon-repayable current and capital expenditure of all levelsof government.
Information on data for Israel:http://dx.doi.org/10.1787/888932315602.
Going further
For additional material, notes and a full explanationof sourcing and methodologies, see Education at aGlance 2012 (Indicator B4).
Areas covered include:
– Distribution of total public expenditure on education.
– Initial sources of public educational funds and finalpurchasers of educational resources by level ofgovernment.
EDUCATION AT A GLANCE 2012: HIGHLIGHTS © OECD 201248

3. PAYING FOR EDUCATION
What share of public spending goes to education?
Figure 3.7. Trends in public spending on education as a percentage of total public expenditure (2000, 2009)
This figure shows total public spending on education (which includes spending on educational institutions and spending suchas public subsidies to households), and how it has evolved.
Source: OECD (2012), Education at a Glance 2012, Table B4.3, available at: http://dx.doi.org/10.1787/888932666342.
Figure 3.8. Total public expenditure as a percentage of GDP (2000, 2009)
This figure shows the size of public spending as a percentage of the overall economy. These data provide context forexamining the proportion of public spending that is devoted to education.
Source: OECD (2012), Education at a Glance 2012, Chart B4.2, available at: http://dx.doi.org/10.1787/888932662732.
25
20
15
10
5
0
2009 2000
% of total public expenditure
New Ze
aland
Mexico Chil
eBraz
il
Switzerl
and
Norway
Icelan
dKor
ea
Denmark
Austra
liaIsr
ael
Eston
ia
Irelan
d
Sweden
United
States
OECD av
erag
e
Canad
a
Belgium
Finlan
d
Portug
al
Sloven
ia
Netherl
ands
Poland
Austri
a
United
Kingdo
mSpa
in
German
y
Franc
e
Hunga
ry
Slovak
Rep
ublic
Czech
Rep
ublic Ita
lyJa
pan
60
50
40
30
20
10
0
2009 2000
% of GDP
Denmark
Franc
e
Finlan
d
Sweden
Belgium
Austri
aIta
ly
Netherl
ands
Hunga
ry
Icelan
d
United
Kingdo
m
Portug
al
Sloven
ia
Irelan
d
German
y
Norway
Spain
Eston
ia
Czech
Rep
ublic
Poland
Israe
l
Japa
n
United
States
Slovak
Rep
ublic
Canad
a
Austra
lia
New Ze
aland
Brazil
Switzerl
and
Korea
Mexico Chil
e
EDUCATION AT A GLANCE 2012: HIGHLIGHTS © OECD 2012 49

3. PAYING FOR EDUCATION
What is the role of private spending?
– Public funding accounts for 84% of all funds for educationalinstitutions, on average in OECD countries.
– For all levels of education, private institutions receive abouthalf as much public funding per student as public institutions:USD 4 301 versus USD 8 329.
– Tertiary institutions obtain about 30% of their funds fromprivate sources.
Significance
This section shows how the financing of educational insti-tutions is shared between public and private entities,particularly at tertiary level. Public funding provides a verylarge part of investment in education, but the role ofprivate sources has become increasingly important. Somestakeholders are concerned that this balance should notbecome so tilted that it discourages potential studentsfrom attending tertiary education. Thus, it is important toexamine changes in public/private funding shares to deter-mine if they are influencing patterns and levels of studentparticipation.
Findings
Public funding represents on average 84% of all funds foreducation in OECD countries for which comparable data areavailable. At the primary, secondary and post-secondarynon-tertiary levels of education, 91% of the funds come frompublic sources. Only in Chile, Korea and the United Kingdomis this share less than 80%. Private funding tends to be morefrequent at two levels of education – pre-primary andtertiary.
At the pre-primary level, private funding represents onaverage 18% of the total expenditure in OECD countries.This figure varies widely however, ranging from 5% or lessin Belgium, Estonia, Luxembourg, the Netherlands andSweden, to over 48% in Australia, Japan and Korea.
At the tertiary level, private funding represents on average30% of total expenditure on educational institutions. Theproportion of expenditure on tertiary institutions covered byindividuals, businesses and other private sources, rangesfrom less than 5% in Denmark, Finland and Norway, to morethan 40% in Australia, Israel, Japan and the United States,and to over 70% in Chile, Korea and the United Kingdom.
Private entities other than households contribute more, onaverage, to tertiary education than to other levels of educa-tion. In Australia, Canada, the Czech Republic, Israel, Japan,Korea, the Netherlands, the Slovak Republic, Sweden, theUnited Kingdom and the United States, 10% or more ofspending on tertiary education comes from private entitiesother than individual households.
While public expenditure mainly funds public institutions,it can also play a role in funding private institutions. Onaverage among OECD countries, and across all levels ofeducation, governments spend twice as much per student
on public institutions as on private ones (USD 8 329 andUSD 4 301, respectively).
Trends
While public funding for all levels of education increasedacross OECD countries for which comparable data areavailable between 2000 and 2009, private spending on educa-tion increased even more in over three-quarters of thesecountries. As a result, the share of private funding for tertiaryeducation increased between 2000 and 2009 in 18 out of25 countries. The share increased by 5 percentage points onaverage, and by more than 12 percentage points in the SlovakRepublic and the United Kingdom.
Decreases in the share of public expenditure in totalexpenditure on educational institutions and, consequently,increases in the share of private expenditure, have notgenerally gone hand in hand with cuts (in real terms) inpublic expenditure on educational institutions. In fact,many OECD countries with the highest growth in privatespending have also shown the highest increase in publicfunding of education. This indicates that an increase inprivate spending is less likely to replace public investmentthan to complement it.
Definitions
Data refer to the 2009 financial year and are based on theUOE data collection on education statistics, administeredby the OECD in 2011. Private spending includes all directexpenditure on educational institutions, whether partiallycovered by public subsidies or not.
Information on data for Israel:http://dx.doi.org/10.1787/888932315602.
Further reading from OECD
OECD Reviews of Tertiary Education (ongoing).
Higher Education Management and Policy (journal).
Going further
For additional material, notes and a full explanationof sourcing and methodologies, see Education at aGlance 2012 (Indicator B3).
Areas covered include:
– Relative proportions and trends of public andprivate expenditure on educational institutions forall levels of education.
– Annual public expenditure on educational institu-tions per student by type of institution.
EDUCATION AT A GLANCE 2012: HIGHLIGHTS © OECD 201250

3. PAYING FOR EDUCATION
What is the role of private spending?
Figure 3.9. Share of private expenditure on educational institutions, 2009
This figure shows the percentage of spending on educational institutions that comes from private funding, by level ofeducation.
Source: OECD (2012), Education at a Glance 2012, Tables B3.2a and B3.2b, available at:http://dx.doi.org/10.1787/888932666209 and http://dx.doi.org/10.1787/888932666228.
Figure 3.10. Trends in the share of private expenditure (2000, 2009)
This figure shows the increase – or otherwise – in private spending as a percentage of total expenditure on all levels ofeducation from 2000 to 2009.
Source: OECD (2012), Education at a Glance 2012, Table B3.1, available at: http://dx.doi.org/10.1787/888932666190.
80
70
60
50
40
30
20
10
0
% Primary, secondary and post-secondary non-tertiary education Tertiary education
ChileKor
ea
United
Kingdo
mJa
pan
United
States
Austra
liaIsr
ael
Canad
a
Russia
n Fed
eratio
n
New Ze
aland Ita
ly
Mexico
Poland
OECD av
erag
e
Slovak
Rep
ublic
Portug
al
Netherl
ands
Spain
Czech
Rep
ublic
Eston
ia
Argen
tina
Franc
e
Irelan
d
German
y
Sloven
ia
Austri
a
Belgium
Sweden
Icelan
d
Denmark
Finlan
d
Norway
Switzerl
and
Luxe
mbourg
45
30
15
40
25
10
35
20
5
0
2009 2000%
OECD av
erag
e
EU21 ave
rage
Chile
Korea
Japa
n
United
Kingdo
m
United
States
Austra
lia
Canad
a
Mexico
Israe
l
New Ze
aland
Netherl
ands
Slovak
Rep
ublic
Russia
n Fed
eratio
n
German
y
Argen
tina
Poland
Spain
Czech
Rep
ublic
Sloven
ia
Franc
eIta
ly
Icelan
d
Austri
a
Portug
al
Eston
ia
Irelan
d
Belgium
Denmark
Sweden
Finlan
d
EDUCATION AT A GLANCE 2012: HIGHLIGHTS © OECD 2012 51

3. PAYING FOR EDUCATION
How much do tertiary students pay?
– University students pay more than USD 1 500 in tuition feesfor public institutions in their own country in a third of OECDcountries; they pay nothing in eight countries.
– Countries with high levels of tuition fees tend to be those whereprivate sources such as companies contribute the most tofunding tertiary institutions.
– Countries where students pay tuition fees but can benefit fromsizeable financial support do not have below-average levels ofaccess to university education.
Significance
This section examines the relationships between annualtuition fees, direct and indirect public spending on educa-tion and public subsidies for student living costs. Govern-ments can address issues of access to and equality ofeducation opportunities by subsidising tuition fees andfinancially aiding students and their families, particularlystudents from low-income families. But how this aid isgiven – whether through grants, scholarships or loans – is asubject of debate in many countries.
Findings
Overall, there are significant differences among OECDcountries in the average tuition fees charged for university-level public education. Fees are negligible or low in theNordic countries, the Czech Republic, Ireland and Mexico,but exceed USD 5 000 in the United States and Korea.However, tuition fees are only part of the picture. It is alsoimportant to look at broader support that may be availableto students. Student support systems have developedextensively in Australia, Chile, Denmark, Japan, theNetherlands, New Zealand, Norway and the UnitedKingdom. On average, OECD countries spend 21% of theirpublic budgets for tertiary education on subsidies tohouseholds and other private entities.
In this context, countries can be grouped into four maincategories:
• No or low tuition fees, and generous student supportsystems; this includes the Nordics.
• High tuition fees and well-developed student supportsystems; this includes Australia, Canada, the Netherlands,New Zealand, the United Kingdom and the United States.
• High tuition fees but less developed student supportsystems; Japan and Korea.
• Low tuition fees and less developed student supportsystems; this includes Austria, Belgium, the CzechRepublic, France, Ireland, Italy, Poland, Portugal,Switzerland, Spain and Mexico.
Trends
Tuition fees continue to spark lively debate, and over thepast decades there have been substantial reforms in OECDcountries. Since 1995, some German federal states have
introduced fees, while other countries such as Australia,Austria, Japan, the Netherlands, New Zealand, Portugal, theUnited Kingdom and the United States have increased fees.Similarly, Denmark, Ireland and the Slovak Republicincreased tuition fees charged for international students(only international students are charged tuition fees inthese countries). A few countries, however, have reducedtuition fees. In 2009, Austria for example, eliminated thetuition fees it introduced in 2001/02, for a majority ofstudents.
Since 2009, further changes have been made to tuition feesand public support systems in various countries. Forexample in 2011 Korea implemented reforms to increase thelevel of public support available to students for highereducation, with the goal of strengthening access and equityin university-level education. In the United Kingdom, tuitionfees are scheduled to triple in some universities in 2012, aspart of a government plan to stabilise university finances.
Definitions
Data refer to the financial year 2009 and are based on theUOE data collection on education statistics administered bythe OECD in 2011. Data on tuition fees charged by educa-tional institutions and financial aid to students werecollected through a special survey undertaken in 2010 andrefer to the academic year 2008-09. Public subsidies tohouseholds include grants/scholarships, public studentloans, family or child allowances contingent on studentstatus, public subsidies in cash or in kind for housing,transport, medical expenses, books and supplies, social,recreational and other purposes, and interest-relatedsubsidies for private loans.
Information on data for Israel:http://dx.doi.org/10.1787/888932315602.
Further reading from OECD
OECD Reviews of Tertiary Education (ongoing).
Higher Education Management and Policy (journal).
Going further
For additional material, notes and a full explanationof sourcing and methodologies, see Education at aGlance 2012 (Indicator B5).
Areas covered include:
– Average tuition fees charged by university-leveleducational institutions.
– Distribution of financial aid to students.
– Governance of tertiary institutions.
EDUCATION AT A GLANCE 2012: HIGHLIGHTS © OECD 201252

3. PAYING FOR EDUCATION
How much do tertiary students pay?
Figure 3.11. Tuition fees in tertiary education, 2008-09
This figure shows the average annual tuition fees charged to full-time national students in public institutions for universitylevel education.
Source: OECD (2012), Education at a Glance 2012, Table B5.1, available at: http://dx.doi.org/10.1787/888932666418.
Figure 3.12. Public subsidies for tertiary education, 2009
This figure shows the public subsidies for education given to households and other private entities as a percentage of totalpublic expenditure on education, broken down by the type of subsidy.
Source: OECD (2012), Education at a Glance 2012, Table B5.3, available at: http://dx.doi.org/10.1787/888932666456.
0
500
1 000
2 000
3 000
4 000
5 000
6 000
Average annual tuition fees in USD
Spain
United KingdomJapanAustralia
Canada
Netherlands
United States
Belgium (French and Flemish)France
New Zealand
Austria, Switzerland
Korea
Portugal,Italy
Czech Republic, Denmark, Finland, Ireland, Iceland, Mexico, Norway, Sweden
60
50
40
30
20
10
5
55
45
35
25
15
0
% of total public expenditure on education
Scholarships/other grants to households Transfers and payments to other private entities Student loans
Chile
Denmark
Sloven
iaIta
ly
Slovak
Rep
ublic
United
Kingdo
mAus
tria
United
States
Finlan
d
Portug
al
Hunga
ry
New Ze
aland
Belgium
Irelan
d
German
y
Norway
OECD av
erag
e
Netherl
ands
Austra
lia
Sweden
Spain
Israe
l
Switzerl
and
Franc
eBraz
il
Eston
ia
Canad
a
Mexico
Korea
Czech
Rep
ublic
Indon
esia
Argen
tina
Poland
Japa
n
Icelan
d
EDUCATION AT A GLANCE 2012: HIGHLIGHTS © OECD 2012 53

3. PAYING FOR EDUCATION
What are education funds spent on?
– Current expenditure accounts for an average of more than90% of total spending on education, all levels of educationcombined except pre-primary.
– Teachers’ salaries account for most current expenditure inOECD and other G20 countries with available data.
– Current expenditure other than staff costs is largest at thetertiary level, where it reaches 32% of all current expenditure,on average. This is partly due to the higher costs of facilitiesand equipment in tertiary education.
Significance
This section details how OECD countries spend their fundsfor education, including the split between capital expendi-ture, which is one-off spending on items such as schoolbuildings, and current expenditure, which is recurringspending on items such as teacher salaries. How spendingis apportioned, both between current and capital outlaysand within these categories, can affect the quality ofservices, the condition of facilities, and the ability ofeducation systems to adjust to changing demographic andenrolment trends.
Findings
Current expenditure is the largest share of educationspending. This is due to the labour-intense nature ofeducation, with teacher salaries accounting for a very largeslice of current – and total – education spending. In 2009,more than 90% of total expenditure was devoted to currentexpenditure at the primary, secondary and post-secondarynon-tertiary levels of education combined (91.3%) and atthe tertiary level (91.0%).
Staff salaries make up on average 78% of current expendi-ture in primary, secondary and post-secondary non-tertiary education in OECD countries. In tertiary education,most current expenditure is also related to staff costs in allcountries except the Czech Republic and Indonesia. Over80% of current expenditure in tertiary education is devotedto compensation of staff in Argentina, Brazil, Denmark andIsrael (88%, 80%, 83% and 80%, respectively).
There are relatively large differences in how current expen-diture is allocated between the primary, secondary, andpost-secondary non-tertiary levels on the one hand and
tertiary education on the other. In all countries butDenmark, the share devoted to compensation of teachers issmaller at the tertiary level. Only seven countries spendmore than 30% of their current expenditure on currentexpenditure other than compensation of all staff inprimary, secondary and post-secondary non-tertiaryeducation: the Czech Republic (37.6%), Finland (35.6%),Indonesia (31.1%), Korea (33.1%), Poland (32.4%), the SlovakRepublic (36.4%) and Sweden (32.2%).
Current expenditure other than staff costs is largest at thetertiary level, where it reaches 32% of all current expendi-ture, on average for OECD countries. This is partly due tothe higher costs of facilities and equipment in tertiary edu-cation. At the tertiary level of education, the share of totalexpenditure devoted to capital expenditure is higher thanthat for primary, secondary and post-secondary non-tertiary education combined in 18 OECD countries. Thismay be linked to the expansion of tertiary education inrecent years, and a consequent need for new buildings tobe constructed.
Definitions
Data refer to the financial year 2009 and are based on UOEdata collection on education statistics administered by theOECD in 2011. Calculations cover expenditure by publicinstitutions or, where available, by both public and privateinstitutions.
Information on data for Israel:http://dx.doi.org/10.1787/888932315602.
Going further
For additional material, notes and a full explanationof sourcing and methodologies, see Education at aGlance 2012 (Indicator B6).
Areas covered include:
– Expenditure on educational institutions by servicecategory as a percentage of GDP.
– Distribution of current expenditure on educationalinstitutions by level of education.
EDUCATION AT A GLANCE 2012: HIGHLIGHTS © OECD 201254

3. PAYING FOR EDUCATION
What are education funds spent on?
Figure 3.13. Staff costs as a proportion of current expenditure in education, 2009
This figure shows the proportion of current expenditure devoted to paying staff in primary, secondary and post-secondarynon-tertiary education. Other areas of current spending include transport, student counselling, and recurring spending onschool materials and research.
Source: OECD (2012), Education at a Glance 2012, Table B6.2, available at: http://dx.doi.org/10.1787/888932666532.
Figure 3.14. Current and capital expenditure in tertiary education, 2009
This figure shows the distribution of current and capital expenditure in tertiary education by country.
Source: OECD (2012), Education at a Glance 2012, Table B6.2, available at: http://dx.doi.org/10.1787/888932666532.
100
90
80
70
60
50
40
30
20
10
0
% Compensation of all staff Other current expenditure
Portug
al
Mexico
Argen
tina
Belgium
Japa
n
Luxe
mbourg
South
Africa
Switzerl
and
Spain
Netherl
ands
Israe
l
United
States
German
y
Franc
eIta
ly
Irelan
d
Denmark
OECD av
erag
e
Sloven
ia
Norway
Canad
a
Austri
a
Austra
lia
Hunga
ry
Icelan
dBraz
il
United
Kingdo
m
Indon
esia
Sweden
Poland
Korea
Finlan
d
Slovak
Rep
ublic
Czech
Rep
ublic
90
80
70
60
50
40
30
20
10
100
0
% Current expenditure Capital expenditure
Icelan
d
Argen
tina
Belgium
Sweden
Denmark
Finlan
d
United
Kingdo
m
Portug
alChil
e
Norway
Mexico
Austri
a
United
States
Netherl
ands
OECD av
erag
e
Franc
e
Switzerl
and
Italy
Slovak
Rep
ublic
German
y
Czech
Rep
ublic
Canad
aIsr
ael
Irelan
d
Sloven
ia
Austra
lia
Poland
Brazil
Japa
n
Hunga
ryKor
eaSpa
in
Indon
esia
Saudi
Arabia
EDUCATION AT A GLANCE 2012: HIGHLIGHTS © OECD 2012 55

3. PAYING FOR EDUCATION
How much do teachers cost?
– Salary cost of teacher per student varies significantly betweencountries. In 2010, the salary cost of teacher per student variedby a ratio of 1 to 14 or 15, depending on the education level.
– Four factors influence the salary cost of teachers: how manyhours students spend in the classroom, teachers’ teachinghours, estimated class size and teachers’ salaries.
– The higher the level of education, the greater the impact ofteachers’ salaries and the lower the impact of class size onsalary cost per student.
– France and Italy are the only countries where the salary cost ofteachers decreased between 2000 and 2010 at primary andlower secondary levels of education.
Significance
The relationship between resources devoted to educationand outcomes achieved has been the focus of much educa-tion policy debate in recent years, as governments seek toensure value for money in public spending while satisfyingthe educational needs of society and the economy. Indeed,various reforms implemented during the last decade inprimary and secondary education have had importantimpacts in this area. Consequently, there is considerableinterest in international comparisons of how variousschool systems allocate resources. Since teachers accountfor a major part of spending, their costs are of particularinterest.
Findings
There are large differences in the salary cost of teachers perstudent between countries. In 2010, the salary cost of teach-ers per student varied by a ratio of 1 to 14 at the primary level(USD 662 in Mexico to USD 9 404 in Luxembourg), 1 to 15 atthe lower secondary level (USD 729 in Mexico to USD 11 145in Luxembourg) and at the upper secondary level(USD 758 in Estonia to USD 11 145 in Luxembourg).
How much teachers cost depends on how much timestudents spend in the classroom, how much time teachersspend teaching, teachers’ salaries and class sizes (whichdetermines how many teachers are needed). Differences inthese four factors may explain differences in the level ofexpenditure between countries. In the same way, a givenlevel of expenditure may result from a different combina-tion of these factors.
Teachers’ salaries are most often the main driver of thedifference from the average salary cost of teachers per
student at each level of education. Estimated class size isthe second main driver of the difference at each level.
Naturally, teachers’ salaries vary according to countries’relative level of wealth and it can be useful to comparesalary cost per student in terms of GDP per capita. Usingthis measure, there are still large variations betweencountries: on average in OECD countries, the salary cost perstudent at upper secondary level represents 9.4% of theGDP per capita, but varies from 4.2% in the Slovak Republicto 23.3% in Portugal.
Trends
The salary cost of teachers per student increased substan-tially between 2000 and 2010 at the primary and lowersecondary levels of education in most countries. On aver-age, it increased by one-third and one-quarter, respectively,among countries with available data in both years: fromUSD 1 733 to USD 2 307 at the primary level and fromUSD 2 273 to USD 2 856 at the lower secondary level.
France and Italy are the only countries where the salary costof teachers per student decreased (slightly) between 2000and 2010.
Definitions
Values for variables are derived mainly from Education ata Glance 2012, and refer to the school years 2009-10and 1999-2000. Data for school year 1999-2000 are derivedfrom Education at a Glance 2002 when they are not availablein the current edition. Salary cost per student is calculatedbased on teachers’ salaries, the number of hours of instruc-tion for students, the number of hours of teaching forteachers and a proxy class size.
Going further
For additional material, notes and a full explanationof sourcing and methodologies, see Education at aGlance 2012 (Indicator B7).
Areas covered include:
– Salary cost per student by level of education.
– Salary cost per student as a percentage of GDP percapita.
EDUCATION AT A GLANCE 2012: HIGHLIGHTS © OECD 201256

3. PAYING FOR EDUCATION
How much do teachers cost?
Figure 3.15. Salary cost of teacher per student at lower secondary level (2000, 2010)
This figure compares the salary cost of teacher per student in 2000 and 2010, in lower secondary education.
Source: OECD (2012), Education at a Glance 2012, Table B7.3, available at: http://dx.doi.org/10.1787/888932666665.
Figure 3.16. Contribution of various factors to salary cost per student at lower secondary level (2000, 2010)
This figure shows the contribution (in USD) of the four factors that affect differences between salary cost of teacher perstudent and the overall change in salary cost in 2000 and 2010.
Source: OECD (2012), Education at a Glance 2012, Chart B7.3, available at: http://dx.doi.org/10.1787/888932662922.
5 000
4 500
4 000
3 500
3 000
2 500
2 000
1 500
1 000
500
0
USD 2010 2000
Austri
a
Denmark
Finlan
d
Austra
lia Italy
Spain
Japa
n
Portug
al
United
States
Irelan
d
Franc
e
Icelan
dKor
ea
Hunga
ry
Czech
Rep
ublic
Mexico
3 000
2 500
2 000
1 500
1 000
500
0
-500
-1 000
USD Change in salary cost between 2000 and 2010Contribution of estimated class size
Contribution of teachers’ salary Contribution of instruction time Contribution of teaching time
Austri
a
Denmark
Finlan
d
Austra
lia Italy
Spain
Japa
n
Portug
al
United
States
Irelan
d
Franc
e
Icelan
dKor
ea
Hunga
ry
Czech
Rep
ublic
Mexico
EDUCATION AT A GLANCE 2012: HIGHLIGHTS © OECD 2012 57


EDUCATION AT A GLANCE 2012: HIGHLIG
4. THE SCHOOL ENVIRONMENT
How long do students spend in the classroom?
How many students are in each classroom?
How much are teachers paid?
How much time do teachers spend teaching?
Who are the teachers?
HTS © OECD 2012 59

4. THE SCHOOL ENVIRONMENT
How long do students spend in the classroom?
– It is expected that students in OECD countries will receive anaverage of 6 862 hours of instruction between the ages of 7and 14, of which 6 710 hours are compulsory.
– Reading, writing and literature, mathematics, and science accountfor almost 55% of compulsory instruction time for 7-8 year-olds inOECD countries, almost 47% for 9-11 year-olds and 41% for12-14 year-olds.
Significance
This section examines the amount of time students spend informal education between the ages of 7 and 14. The choicesthat countries make about how much time should bedevoted to education and which subjects should be compul-sory reflect national education priorities. Since a large partof public investment in education goes to instruction time informal classroom settings, the length of time studentsspend in school is an important factor in determining theamount of funding that should be devoted to education.
Findings
In OECD countries, students are intended to receive6 862 hours of instruction on average between the ages of7 and 14. Formal requirements range from 5 644 hours inEstonia to 8 664 hours in Chile. In OECD countries, studentsbetween the ages of 7 and 14 receive an average of6 710 hours of compulsory instruction.
The proportion of the compulsory curriculum that isdevoted to reading, writing and literature varies widely. Onaverage, for 7-8 year-olds in OECD countries, almost 55% ofthe compulsory curriculum is devoted to three basicsubjects: reading, writing and literature (30.4%), mathe-matics (17.8%) and science (6.5%). Together with the arts(12%), physical education (9%) and social studies (6%), thesesix study areas form the major part of the curriculum forthis age group. On average, the largest portion of the curric-ulum for 7-8 year-olds is devoted to reading and writing,but the differences among countries are large. For example,in Iceland, reading and writing accounts for 20% of compul-sory instruction time while in Denmark, Hungary andTurkey, it accounts for 40% or more of compulsory instruc-tion time.
For 9-11 year-olds in OECD countries, almost 47% of thecompulsory curriculum is devoted to three basic subjectareas: reading, writing and literature (22.5%), mathematics(16.1%) and science (8.2%). An additional 9% of the compul-sory curriculum is devoted to social studies and 8% toforeign languages. However, there is great variation amongcountries in the percentage of class time devoted to thesesubjects. Reading, writing and literature, for example,accounts for 13% of instruction time in England, comparedwith 30% or more in France, Ireland, Mexico and theNetherlands.
For 12-14 year-olds in OECD countries, an average of 41% ofthe compulsory curriculum is devoted to three subjects:reading, writing and literature (16%), mathematics (13%) andscience (12%). The allocation of time for the different sub-jects within the compulsory curriculum for 12-14 year-oldsvaries less among countries than it does for 9-11 year-olds.Again, one of the greatest variations is in the time spentteaching reading and writing, which ranges from 11% ofcompulsory instruction time in Japan and Portugal to 26% inIreland.
Most OECD countries define a specific number of hours forcompulsory instruction. Within that part of the curriculum,schools, teachers and/or students have varying degrees offreedom to choose the subjects they want to teach or study.On average among OECD countries, the flexible part of thecurriculum accounts for some 6% of compulsory instructiontime for 7-8 year-olds and 9-11 year-olds and 7% for12-14 year-olds. The Czech Republic allows complete flexi-bility (100%) in the compulsory curriculum for 7-14 year-oldsand Poland allows this for 7-8 year-olds.
Definitions
Data on teaching time distinguish between “compulsory”and “intended” teaching time. Compulsory teaching timerefers to the minimum amount of teaching that schools areexpected to provide. Intended instruction time is an esti-mate of the number of hours during which students aretaught both compulsory and non-compulsory parts of thecurriculum. It does not, however, indicate the quality of theeducation provided nor the level or quality of the humanand material resources involved. Data on instruction timeare from the 2011 OECD-INES Survey on Teachers and theCurriculum and refer to the 2009-10 school year.
Information on data for Israel:http://dx.doi.org/10.1787/888932315602.
Further reading from OECD
21st Century Learning Environments (2006).
Going further
For additional material, notes and a full explanationof sourcing and methodologies, see Education at aGlance 2012 (Indicator D1).
Areas covered include:
– Compulsory and intended instruction time inpublic institutions.
– Instruction time per subject.
EDUCATION AT A GLANCE 2012: HIGHLIGHTS © OECD 201260

4. THE SCHOOL ENVIRONMENT
How long do students spend in the classroom?
Figure 4.1. Total number of instruction hours in public institutions, 2010
This figure shows the hours of intended instruction that students receive between ages 7 and 14 (this represents thecompulsory instruction time public schools are required to deliver as well as the time devoted to non-compulsory instruction).
Source: OECD (2012), Education at a Glance 2012, Table D1.1, available at: http://dx.doi.org/10.1787/888932667862.
Figure 4.2. Instruction time by subject, 2010
These figures show the percentage of compulsory instruction time devoted to each subject for 7-8 year-olds and for12-14 year-olds.
Source: OECD (2012), Education at a Glance 2012, Table D1.2a and D1.2c, available at:http://dx.doi.org/10.1787/888932667881 and http://dx.doi.org/10.1787/888932667919.
9 0008 0007 0006 0005 0004 0003 0002 0001 000
0
Ages 7 to 8 Ages 9 to 11 Ages 12 to 14
Chile
Austra
liaIsr
ael
Belgium
(Fr.)
Netherl
andsIta
lySpa
in
Mexico
Franc
e
Canad
a
Irelan
d
Luxe
mbourg
Portug
al
Engla
nd
Icelan
d
Belgium
(Fl.)
Turke
y
OECD av
erag
e
Austri
a
Denmark
Japa
n
Slovak
Rep
ublic
German
y
Greece
Norway
Poland
Hunga
ry
Indon
esia
Sweden
Korea
Czech
Rep
ublic
Sloven
ia
Russia
n Fed
eratio
n
Finlan
d
Eston
ia
Hours
1009080706050403020100
1009080706050403020100
%
%
Reading, writing and literature
Modern foreign languages
Mathematics
Other compulsory core curriculum
Science
Compulsory flexible curriculum
Ages 7 to 8
Ages 12 to 14
Denmark
Hunga
ry
Turke
y
Russia
n Fed
eratio
n
Mexico
Franc
e
Luxe
mbourg
Norway
Finlan
d
Greece
Slovak
Rep
ublic
Austri
a
OECD av
erag
e
Irelan
d
Sloven
ia
Canad
a
Eston
iaJa
pan
Korea
Israe
lSpa
in
Belgium
(Fl.)
Italy
German
yChil
e
Icelan
d
Irelan
dIta
ly
Denmark
Israe
l
Canad
a
Greece
Luxe
mbourg
Spain
Belgium
(Fr.)
Poland
Hunga
ry
Norway
Franc
e
Turke
y
Argen
tina
Slovak
Rep
ublic
OECD av
erag
eChil
e
Russia
n Fed
eratio
n
Mexico
Eston
ia
Icelan
d
Belgium
(Fl.)
German
y
Austri
aKor
ea
Finlan
d
Indon
esia
Engla
nd
Sloven
ia
Portug
al
Japa
n
EDUCATION AT A GLANCE 2012: HIGHLIGHTS © OECD 2012 61

4. THE SCHOOL ENVIRONMENT
How many students are in each classroom?
– On average, there are more than 21 students per class atprimary level in OECD countries, but numbers are usuallylarger in other G20 countries. Overall class size varies frommore than 29 in Chile and China to nearly half that number inLuxembourg and the Russian Federation.
– On average, the number of students per class increases by two ormore between primary and lower secondary education. In lowersecondary education, the average class in OECD countries hasabout 23 students.
– The student-to-teacher ratio in lower and upper secondaryeducation is slightly lower in private than in public institutions.
Significance
This section examines the number of students per class atthe primary and lower secondary levels, in both public andprivate institutions. Class size is a hotly debated topic inmany OECD countries. While smaller classes are often per-ceived as enabling a higher quality of education, evidenceon the impact of class size on student performance ismixed.
Findings
At the primary level, the average class size in OECD andG20 countries is around 21 students, ranging from morethan 29 in Chile and China to fewer than 20 in Austria, theCzech Republic, Denmark, Estonia, Finland, Greece,Iceland, Italy, Luxembourg, Mexico, Poland, the RussianFederation, the Slovak Republic, Slovenia and Switzerland(in public institutions).
The number of students per class tends to increasebetween primary and lower secondary education. In lowersecondary education, the average class size is more than23 students, ranging from 20 or fewer in Denmark, Estonia,Finland, Iceland, Luxembourg, the Russian Federation,Slovenia, Switzerland (in public institutions) and theUnited Kingdom to more than 34 students per class inIndonesia and Korea and to over 50 in China.
In Brazil, China, Greece, Indonesia, Japan, Korea, Mexico andPoland, the increase in average class size between primaryand lower secondary education exceeds four students whilethe United Kingdom and, to a lesser extent, Switzerland(public institutions only) show a drop in the number ofstudents per class between these two levels of education.
Across the OECD, average class sizes at the primary andlower secondary levels do not differ by more than onestudent per class between public and private institutions.There are, however, marked differences between countries.At primary level, the average class in a public institutionhas at least four more students than a private institution inBrazil, the Czech Republic, Iceland, Indonesia, Israel,
Poland, the Russian Federation, Turkey and the UnitedKingdom. By contrast, the reverse is true for China andSpain. At the lower secondary level, where private educa-tion is more prevalent than at primary level, class sizes arelarger in private institutions in 13 OECD countries.
Trends
From 2000 to 2010, the average class size in countries withavailable data for both years decreased by one student atboth the primary and lower secondary levels. The decreasein average primary class size can be partly explained byreforms of class size during that period. Primary class sizesdecreased most notably (by more than four students) incountries that had relatively large class sizes in 2000, suchas Korea and Turkey. By contrast, class size increased orwas unchanged in countries that had the smallest classesin 2000, such as Denmark, Iceland, Italy and Luxembourg.
Definitions
Class sizes have been calculated by dividing the number ofstudents enrolled by the number of classes. Data forSwitzerland refer to public institutions. Data refer tothe 2009-10 school year, and are based on the UOE datacollection on education statistics administered by theOECD in 2011.
Information on data for Israel:http://dx.doi.org/10.1787/888932315602.
Further reading from OECD
Improving School Leadership (Volume 1: Policy and Practice) (2008).
21st Century Learning Environments (2006).
Going further
For additional material, notes and a full explanationof sourcing and methodologies, see Education at aGlance 2012 (Indicator D2).
Areas covered include:
– Average class size, by type of institution and level ofeducation.
– Ratio of students to teaching staff.
– Teaching staff and non-teaching staff employed ineducational institutions.
EDUCATION AT A GLANCE 2012: HIGHLIGHTS © OECD 201262

4. THE SCHOOL ENVIRONMENT
How many students are in each classroom?
Figure 4.3. Trends in average class size in primary education (2000, 2010)
This figure shows the number of students on average in primary classes, and whether these numbers have risen or fallen.
Source: OECD (2012), Education at a Glance 2012, Tables D2.1 and D2.5, available at:http://dx.doi.org/10.1787/888932667976 and http://dx.doi.org/10.1787/888932668071.
Figure 4.4. Average class size, by level of education, 2010
These figures show how class sizes differ between primary and lower secondary education.
Source: OECD (2012), Education at a Glance 2012, Table D2.2, available at: http://dx.doi.org/10.1787/888932667995.
40
30
20
10
0
2010 2000
Number of students per classroom
China
ChileJa
pan
Israe
lKor
ea
Indon
esia
Turke
y
Argen
tina
Brazil
United
Kingdo
mIre
land
Austra
lia
Franc
e
German
ySpa
in
Belgium
(Fr.)
Hunga
ry
Portug
al
United
States
Mexico
Czech
Rep
ublic
Finlan
d
Denmark
Switzerl
and
Italy
Poland
Sloven
ia
Austri
a
Icelan
d
Eston
ia
Slovak
Rep
ublic
Greece
Russia
n Fed
eratio
n
Luxe
mbourg
60
40
50
40
50
30
20
10
0
60
30
20
10
0
Number of students per teacher in full-time equivalentsPrimary education
Number of students per teacher in full-time equivalentsLower secondary education
OECD average
OECD average
China
ChileJa
pan
Israe
lKor
ea
Indon
esia
Turke
y
Argen
tina
Brazil
United
Kingdo
mIre
land
Austra
lia
Franc
e
German
ySpa
in
Belgium
(Fr.)
Hunga
ry
Portug
al
United
States
Mexico
Czech
Rep
ublic
Finlan
d
Denmark
Switzerl
and
Italy
Poland
Sloven
ia
Austri
a
Icelan
d
Eston
ia
Slovak
Rep
ublic
Greece
Russia
n Fed
eratio
n
Luxe
mbourg
EDUCATION AT A GLANCE 2012: HIGHLIGHTS © OECD 2012 63

4. THE SCHOOL ENVIRONMENT
How much are teachers paid?
– Salaries for teachers with at least 15 years of experienceaverage USD 35 630 at the pre-primary level, USD 37 603 atthe primary level, USD 39 401 at the lower secondary level andUSD 41 182 at the upper secondary level.
– On average in OECD countries, teachers’ salaries at the primarylevel represent 82% of average earnings for 25-64 year-olds witha tertiary education against 90% at the upper secondary level.
– Teachers’ salaries rose, in real terms, in most countries withavailable data between 2000 and 2010.
Significance
This section shows the starting, mid-career and maximumstatutory salaries of teachers in public pre-primary, pri-mary and secondary education. Since teachers’ salaries arethe largest single cost in education, teacher compensationis a critical consideration for policy makers seeking tomaintain both the quality of teaching and a balancededucation budget.
Findings
Teachers’ salaries vary widely across countries. Salaries forlower secondary teachers with at least 15 years’ experiencerange from less than USD 15 000 in Argentina, Estonia,Hungary, Indonesia and the Slovak Republic to more thanUSD 100 000 in Luxembourg.
In most OECD countries, teachers’ salaries rise with the levelof education they teach. For example, in Belgium, the CzechRepublic, Denmark and Poland, the salary of an uppersecondary teacher with at least 15 years of experience isabout 30% higher than that of a pre-primary teacher withthe same amount of experience. In Finland, this differenceexceeds 50%. In Australia, Canada, Israel, Korea and Turkey,there is less than a 5% difference between upper secondaryand pre-primary school teachers’ salaries; in England,Greece, Ireland, Portugal, Scotland and Slovenia, teachersreceive the same salary irrespective of the level of educationtaught. In contrast, in Argentina teachers’ salaries decreasewith the level of education taught.
Salaries at the top of the scale are, on average, 60% and 62%higher, respectively, than starting salaries in primary andlower secondary education. At the lower secondary level,new teachers entering the profession with the minimumqualification earn on average USD 29 801. For teachers atthe top of the salary scale and with the maximum qualifi-cations, salaries average USD 51 872.
To get a sense of the relative value of teachers’ salarieswithin countries, a number of comparisons are useful, suchas with the earnings of other tertiary graduates. In theFlemish Community of Belgium (upper secondary level),Korea, Luxembourg (lower and upper secondary levels) andSpain, teachers’ salaries are at least 20% higher than thoseof workers with comparable education. By contrast, inIceland in both primary and lower secondary education,and in the Slovak Republic at all levels of education, teach-ers with 15 years of experience are paid 50% or less, on
average, of what a worker with tertiary education earns.On average in OECD countries, teachers’ salaries at theprimary level represent 82% of average earnings for25-64 year-olds with a tertiary education against 90% at theupper secondary level.
Trends
Teachers’ salaries increased in real terms in most countriesbetween 2000 and 2010. In Denmark, Estonia, Ireland,Portugal and Scotland, salaries increased at all levels ofeducation by at least 20%. In the Czech Republic (primaryand lower secondary levels) and in Turkey, salaries doubledover the past decade. Only in France and Japan didteachers’ salaries decrease in real terms, by more than 5%.
Definitions
Gross teachers’ salaries were converted using purchasingpower parities (PPPs) for private consumption from theOECD National Accounts Database. Starting salaries refer tothe average scheduled gross salary per year for a fully qual-ified full-time teacher at the beginning of the teachingcareer. Earnings for workers with tertiary education areaverage earnings for full-time, full-year workers aged 25 to64 years. Large differences in taxation, social benefits andallowances and additional payments for teachers as well asvariations in teaching time, workloads and the use of part-time teachers must also be taken into account in makinginternational comparisons of teachers’ benefits. It is thusimportant to exercise caution in interpreting comparisonsof teachers’ salaries. Data are from the 2011 OECD-INESSurvey on Teachers and the Curriculum and refer to the2009-10 school year.
Information on data for Israel:http://dx.doi.org/10.1787/888932315602.
Further reading from OECD
Evaluating and Rewarding the Quality of Teachers: InternationalPractices (2009).
Teachers Matter: Attracting, Developing and Retaining EffectiveTeachers (2005).
Going further
For additional material, notes and a full explanationof sourcing and methodologies, see Education at aGlance 2012 (Indicator D3).
Areas covered include:
– Teachers’ salaries and trends.
– Additional payments for teachers.
EDUCATION AT A GLANCE 2012: HIGHLIGHTS © OECD 201264

4. THE SCHOOL ENVIRONMENT
How much are teachers paid?
Figure 4.5. Teachers’ salaries in lower secondary education, 2010
The upper chart in this figure shows how much teachers are paid after 15 years of experience. The lower chart compares teacher salarieswith the earnings of other full-time workers with tertiary education.
Source: OECD (2012), Education at a Glance 2012, Table D3.1, available at:http://dx.doi.org/10.1787/888932668109 and http://dx.doi.org/10.1787/888932668128.
Figure 4.6. Minimum and maximum teacher salaries, 2010
This figure shows the gap between teachers’ salaries at the start of their career, with minimum training and at the top of the scale withmaximum qualification, in lower secondary education.
Source: OECD (2012), Education at a Glance 2012, Table D3.4, available at: http://dx.doi.org/10.1787/888932668242.
100 000
80 000
60 000
40 000
20 000
0
1.5
1.0
0.5
0
Ratio
Average earnings for full-time earner with tertiary education
Equivalent USD converted using PPPs
Above tertiarygraduates’earnings
Below tertiarygraduates’earnings
Luxe
mbourg
Switzerl
and
German
y
Netherl
ands
Canad
a
Irelan
d
Denmark
Scotla
ndSpa
in
Austra
liaKor
ea
United
StatesJa
pan
Austri
a
Engla
nd
Belgium
(Fl.)
Belgium
(Fr.)
New Ze
aland
Finlan
d
OECD av
erag
e
Portug
al
Norway
Franc
eIta
ly
Sweden
Sloven
ia
Greece
Icelan
d
Mexico Chil
eIsr
ael
Czech
Rep
ublic
Poland
Argen
tina
Hunga
ry
Slovak
Rep
ublic
Eston
ia
Indon
esia
140 000
120 000
100 000
80 000
60 000
40 000
20 000
0
Starting salary/minimum training Salary at top of scale/maximum qualifications
Equivalent USD converted using PPPs
Luxe
mbourg
Switzerl
and
German
y
Denmark
Spain
Netherl
ands
United
States
Canad
a
Austra
lia
Norway
Irelan
d
Austri
a
Finlan
d
Belgium
(Fl.)
Portug
al
Scotla
nd
Engla
nd
Belgium
(Fr.)
OECD av
erag
e
Sweden Ita
ly
New Ze
aland
Franc
e
Sloven
iaKor
ea
Greece
Japa
n
Icelan
d
Mexico Chil
eIsr
ael
Czech
Rep
ublic
Eston
ia
Argen
tina
Slovak
Rep
ublic
Poland
Hunga
ry
Indon
esia
EDUCATION AT A GLANCE 2012: HIGHLIGHTS © OECD 2012 65

4. THE SCHOOL ENVIRONMENT
How much time do teachers spend teaching?
– The number of teaching hours per teacher in public schoolsaverages 782 hours per year in primary education, 704 hoursin lower secondary education and 658 hours in upper second-ary education.
– Average teaching time remained largely unchanged between 2000and 2010 at all levels of education.
– The way teachers’ working time is regulated varies signifi-cantly among countries.
Significance
This section examines the time teachers spend teachingand doing non-teaching work, such as preparing lessonsand assessing students. Although working time and teach-ing time only partly determine teachers’ actual workload,they do provide valuable insights into differences in what isdemanded of teachers in different countries. Teachinghours and the extent of non-teaching duties may alsoaffect the attractiveness of teaching as a profession. Theamount of time that teachers spend teaching is also one ofthe factors that affect the financial resources countriesneed to allocate to education.
Findings
The average number of teaching hours in public primaryschools is 782 hours per year in OECD countries but rangesfrom fewer than 600 hours in Greece and Poland to over1 000 hours in Chile and the United States. The averagenumber of teaching hours per year in public lower second-ary school is 704 hours but ranges from less than 500 hoursin Greece and Poland to over 1000 hours in Argentina,Chile, Mexico and the United States. The average numberof teaching hours in public upper secondary general educa-tion is 658 hours per year but ranges from 377 hours inDenmark to 1 368 hours in Argentina.
Primary teachers tend to spend more hours teaching thansecondary teachers, although the size of the gap variesbetween countries. In the Czech Republic, France, Greeceand Israel, primary school teachers have at least 30% moreannual teaching time than lower secondary teachers. Incontrast, the difference does not exceed 3% in Poland andthe United States, and there is no difference in Brazil, Chile,Denmark, Estonia, Hungary, Iceland, Scotland and Slovenia.Argentina, England and Mexico are the only countries inwhich the teaching load for primary school teachers islighter than that for lower secondary school teachers.
The composition of teachers’ annual teaching time, interms of days, weeks and hours, varies considerablybetween countries. As a result, the average number ofhours per day that teachers teach also varies widely, rang-ing at the lower secondary level from three hours or lessper day in Greece, Indonesia, Japan, Korea, Poland and the
Russian Federation, to more than five hours in Argentina,Chile, Mexico and the United States.
In most countries, teachers are formally required to work aspecified number of hours per week, including teachingand non-teaching time, to earn their full-time salary. Thenumber of hours for teaching is usually specified, except inSweden; but some countries also regulate the time ateacher has to be present in the school.
Trends
In most OECD countries with available data, teaching timeremained largely unchanged between 2000 and 2010. Thenumber of teaching hours changed dramatically in a fewcountries, however. It decreased by more than 30% inDenmark at the upper secondary level, while it increasedby more than 25% in the Czech Republic at the primarylevel and in Portugal and Spain at the secondary level.
Definitions
Teaching time is defined as the number of hours per yearthat a full-time teacher teaches a group or class of students.Working time refers to the normal working hours of afull-time teacher and includes time directly associated withteaching as well as the hours devoted to teaching-relatedactivities, such as preparing lessons, counselling students,correcting assignments and tests, and meeting with parentsand other staff. Data are from the 2011 OECD-INES Surveyon Teachers and the Curriculum and refer to the 2009-10school year.
Information on data for Israel:http://dx.doi.org/10.1787/888932315602.
Further reading from OECD
21st Century Learning Environments (2006).
Teachers Matter: Attracting, Developing and Retaining EffectiveTeachers (2005).
Going further
For additional material, notes and a full explanationof sourcing and methodologies, see Education at aGlance 2012 (Indicator D4).
Areas covered include:
– Organisation of teachers’ working time.
– Number of teaching hours per year, by level ofeducation.
EDUCATION AT A GLANCE 2012: HIGHLIGHTS © OECD 201266

4. THE SCHOOL ENVIRONMENT
How much time do teachers spend teaching?
Figure 4.7. Annual teaching hours by education level, 2010
This figure shows the variation in annual teaching hours for teachers at different levels of education.
Source: OECD (2012), Education at a Glance 2012, Table D4.1, available at: http://dx.doi.org/10.1787/888932668318.
Figure 4.8. Percentage of teachers’ working time spent teaching, 2010
This figure shows the amount of their working time that teachers spend teaching. Contact time with students is a major partof teachers’ workloads, but duties also include preparing classes and correcting assignments.
Source: OECD (2012), Education at a Glance 2012, Table D4.1, available at: http://dx.doi.org/10.1787/888932668318.
1 5001 4001 3001 2001 1001 000
900800700600500400300200100
0
Lower secondary educationPrimary education Upper secondary education, general programmes
Hours per year
Argen
tinaChil
e
United
States
Mexico
Scotla
nd
New Ze
aland
Austra
liaBraz
il
Portug
al
German
y
Netherl
ands
Canad
a
Irelan
dSpa
in
OECD av
erag
e
Engla
nd
Sloven
ia
Belgium
(Fl.)
Belgium
(Fr.)
Norway
Slovak
Rep
ublic
Denmark
Czech
Rep
ublic
Franc
e
Luxe
mbourg
Eston
iaIta
lyKor
ea
Icelan
d
Turke
y
Austri
a
Hunga
ryJa
panIsr
ael
Finlan
d
Indon
esia
Russia
n Fed
eratio
n
Poland
Greece
100
80
90
70
60
50
40
30
20
10
0
% Primary education Lower secondary education Upper secondary education, general programmes
Brazil
Indon
esia
Scotla
ndSpa
in
Portug
al
United
States
Netherl
ands
Engla
nd
Slovak
Rep
ublic
Chile
Czech
Rep
ublic
Korea
German
y
Norway
Austri
a
Eston
ia
Denmark
Japa
n
Icelan
d
Turke
y
Poland
Hunga
ry
EDUCATION AT A GLANCE 2012: HIGHLIGHTS © OECD 2012 67

4. THE SCHOOL ENVIRONMENT
Who are the teachers?
– About 58% of primary teachers and 63% of secondary teachersare at least 40 years old, on average in OECD countries.
– Some two-thirds of teachers and academic staff are women onaverage in OECD countries, but the proportion of womenamong teaching staff tends to decline at higher levels of educa-tion: from 97% at the pre-primary level to 41% at the tertiarylevel.
– Thirteen OECD countries require that teachers at some or alllevels of education participate in continuing training/education.
Significance
This section presents a profile of the teaching workforce.Getting a better understanding of the teaching workforcemeans countries can anticipate teacher shortages andwork to make the teaching profession a more attractivecareer choice.
Findings
On average across OECD countries, 58% of primary teachersare at least 40 years old. This proportion exceeds 70% in theCzech Republic, Germany, Italy and Sweden. In only sevencountries – Belgium, Brazil, Ireland, Israel, Korea, Luxembourgand the United Kingdom – are more than half of primaryteachers under the age of 40. The age distribution of teachersat the secondary level is roughly the same. On average amongOECD countries, 63% of secondary teachers are at least40 years old. In Austria, the Czech Republic, Estonia, Germanyand Italy, however, the share rises to 70% or more. The propor-tion of secondary school teachers aged 50 or older is largerthan that of primary school teachers in most countries.
Across all levels of education, women represent two-thirdsof the teachers and academic staff, but the percentage ofwomen teachers declines from each level of education tothe next. For example, on average across the OECD area,women account for almost 97% of teachers at pre-primarylevel; 82% at primary level; less than 68% at lower second-ary level; 56% at upper secondary level; and 41% in tertiaryeducation. The share of women at the tertiary level variesconsiderably between countries: from about one-third orless of the teaching staff in Japan and Korea (19% and 34%,respectively) to more than half in Finland, New Zealand,the Russian Federation and South Africa (51%, 52%, 56%and 53% respectively).
The duration of teacher training for pre-primary educationvaries widely among OECD countries. It ranges from twoyears for basic certification in Japan, Korea and the UnitedStates, to five years in France and Portugal. Teacher train-ing for upper secondary teachers ranges from 3 to 4 yearsin England and Israel to 6.5 years in Germany. Furthermore,11 OECD countries and Indonesia require that teachers
acquire a license or supplementary credential to becomefully certified.
Continuing education for teachers takes on new signifi-cance with the rising demand for both differentiatedinstruction to address a wider range of learning styles andthe integration of technology to connect the classroom tothe outside world. Only 13 OECD countries now requirecontinuing education for teachers, but that number is likelyto increase in the coming years.
Trends
Between 1998 and 2010, the proportion of secondary teach-ers aged 50 or older climbed from 28.8% to 34.2% on averageamong countries with comparable data. This increase isparticularly large in Austria, Germany, Ireland, Japan,Norway, Switzerland and the United Kingdom, with anincrease of 8 percentage points or more.
Definitions
Data on teachers by age and by gender refer to the 2009-10school year and are based on the UOE data collection oneducation statistics administered by the OECD in 2011.
Data refer to the academic year 2009-10 and are based onthe 2011 OECD-INES Survey on Teachers and the Curriculum.
Further reading from OECD
Educating Teachers for Diversity: Meeting the Challenge (2010).
Evaluating and Rewarding the Quality of Teachers: InternationalPractices (2009).
Going further
For additional material, notes and a full explanationof sourcing and methodologies, see Education at aGlance 2012 (Indicator D5).
Areas covered include:
– Age distribution of teachers by country and level ofeducation.
– Gender distribution of teachers by country and levelof education.
– Teachers’ knowledge and skills.
– Requirements to enter the teaching profession.
– Level of government at which different types ofdecisions about teachers are taken.
EDUCATION AT A GLANCE 2012: HIGHLIGHTS © OECD 201268

4. THE SCHOOL ENVIRONMENT
Who are the teachers?
Figure 4.9. Age distribution of teachers, 2010
This figure shows the average percentage of teachers in each age group in primary, lower secondary and upper secondaryeducation in OECD countries.
Source: OECD (2012), Education at a Glance 2012, Tables D5.1 and D5.2, available at:http://dx.doi.org/10.1787/888932668375 and http://dx.doi.org/10.1787/888932668394.
Figure 4.10. Gender distribution of teachers, 2010
The upper chart shows the percentage of teachers who are women across all levels of education, by country. The lower chartshows the percentage of teachers who are women by level of education, on average in OECD countries.
Source: OECD (2012), Education at a Glance 2012, Table D5.3, available at: http://dx.doi.org/10.1787/888932668413.
14.0
27.7
28.4
29.9
10.8
26.1
28.2
35.0
Below 30 years 30-39 years 40-49 years 50 years or above
Primary education Secondary education
80
70
60
50
40
30
20
10
10
0
%
100
90
80
70
60
50
40
20
30
0
%
9782
68
56 54
41
67
Across all levels of education
By level of education (OECD average)
Italy
Hunga
ry
Slovak
Rep
ublic
Russia
n Fed
eratio
nBraz
il
Sloven
ia
Sweden
Poland
Icelan
d
Finlan
d
Portug
al
EU21 ave
rage
New Ze
aland
United
States
Belgium Chil
e
United
Kingdo
m
OECD av
erag
e
Franc
eSpa
in
German
y
Austri
a
Netherl
ands
South
Africa
Norway
Switzerl
and
Indon
esia
Korea
China
Turke
y
Saudi
Arabia
Japa
n
Pre-primary Primary Lower secondary Upper secondary Post secondary,non-tertiary
Tertiary All levels
EDUCATION AT A GLANCE 2012: HIGHLIGHTS © OECD 2012 69


EDUCATION AT A GLANCE 2012: HIGHLIG
5. SPECIAL SECTION: EQUITY
What is equity in education?
Access to early childhood education
Access to secondary and tertiary education
Access to the labour market
Access to lifelong learning
Does parental education affect students’ chances?
Integrating immigrants’ children
Reducing the gender gap
HTS © OECD 2012 71

5. SPECIAL SECTION: EQUITY
What is equity in education?
– About a quarter of children in OECD countries miss out onpre-primary education, although it leads to better schoolperformance overall.
– About one in five youngsters (19%) across OECD countrieslacks basic literacy skills.
– Students with an immigrant background tend to do less well inschool, with a performance gap of up to 1.5 years in somecountries.
– Across OECD countries, 50% of 25-34 year-olds, but only27% of 55-64 year-olds participate in formal and/or non-formaleducation.
Introduction
A well-educated population is essential to a country’s eco-nomic and social development – a higher level of educationmeans higher earnings, better health and a longer life. So itis in society’s interest to ensure that all children and adultshave access to a wide variety of educational opportunities.
Are you less likely to complete secondary school or gain auniversity place if you live in a disadvantaged part of town?Will children lose out if they do not go to kindergarten, or iftheir parents are immigrants? Is it harder to top up yourskills or retrain as an adult if you are above a certain age, orif you are a woman? And what can governments do to helplevel the playing field? This section looks at equity ineducation and how it can help overcome social andeconomic inequalities.
Key features of equity in education
Students’ background has an impact on their academicachievement – those whose parents have a low level ofeducation, who have low socio-economic status, or comefrom an immigrant background, as well as boys, have ahigher risk of low performance at age 15. Some 19% ofpeople at this age in OECD countries lack basic literacyskills, making it more likely that they will drop out ofschool with no qualifications. Indeed, some 20% of25-34-year-olds across OECD countries have not attainedupper secondary education. Students with an immigrantbackground are more likely to leave school earlier thantheir classmates, and when they stay in school many ofthem are behind their peers – a difference that in somecountries is equivalent to 1.5 years of schooling.
When it comes to improving equity in educational results,the key is to start early. When children attend pre-primary
education, they are more likely to be successful at schoolwhen they get to 15 and in the years beyond.
Catching up later in life is possible but not always easy. Onaverage in OECD countries, 8% of adults aged 25-64 are informal education, but far more of them (17%) are in the25-34 age group than in the 55-64 age group, where the rateis just 2%.
And there is also the question of equity of expectation – therehas been much progress in reducing the gender gap in termsof educational attainment, but girls are still less likely tochoose studies or careers in fields such as maths or computerscience, at least partly because of their vision of the rightcareer for them.
Definitions
Items in this section are taken from OECD Education at aGlance 2012 and from Equity and Quality in Education:Supporting Disadvantaged Students and Schools (OECD, 2012).The information in both publications is drawn from theresults of the PISA 2009 assessment of students’ compe-tence in reading, mathematics and science.
Information on data for Israel:http://dx.doi.org/10.1787/888932315602.
Further reading from OECD
OECD (2012), Equity and Quality in Education: SupportingDisadvantaged Students and Schools.
Going further
For additional material, notes and a full explanationof sourcing and methodologies, see PISA 2009 Results:Volume I, “What Students Know and Can Do: StudentPerformance in Reading, Mathematics and Science”(Chapter 2), and PISA 2009 Results: Volume II ,“Overcoming Social Background: Equity in LearningOpportunities and Outcomes”.
For additional material on adult learning, notes and afull explanation of sourcing and methodologies, seeEducation at a Glance 2012 (Indicator C6).
EDUCATION AT A GLANCE 2012: HIGHLIGHTS © OECD 201272

5. SPECIAL SECTION: EQUITY
What is equity in education?
Figure 5.1. A significant number of students do not master basic skills15-year-old students’ attainment at or below Level 2 of the PISA reading scale, 2009
Students below proficiency Level 2 are at risk of dropping out, while those below Level 1 can be regarded as having aneducational level that puts them at a serious disadvantage for full participation in society and the economy.
Source: OECD (2012), Equity and Quality in Education: Supporting Disadvantaged Students and Schools, Figure 1.2, available at:http://dx.doi.org/10.1787/888932560835.
Figure 5.2. A considerable reading gap exists between immigrant students and nativesReading performance by immigrant status in PISA, 2009
This figure shows performance differences between natives (bars), first-generation students (blobs) and second-generationstudents (diamonds). For example, in Italy students without an immigrant background performed 45 points higher thanthose who were born in the country but whose parents are foreign-born (second-generation) students, which is equivalent toone school year. Non-OECD member economies are included for comparison.
Source: OECD (2012), Equity and Quality in Education: Supporting Disadvantaged Students and Schools, Figure 1.7, available at:http://dx.doi.org/10.1787/888932560911.
80
70
60
50
40
30
20
10
0
Below level 2 Level 2
Percentage of students
Korea
Finlan
d
Hong K
ong,
China
Canad
a
Eston
iaJa
pan
Austra
lia
Netherl
ands
New Ze
aland
Macao
, Chin
a
Norway
Poland
Denmark
Switzerl
and
Icelan
d
Irelan
d
Sweden
Hunga
ry
United
States
Portug
al
Belgium
United
Kingdo
m
German
y
OECD av
erag
eSpa
in
Franc
eIta
ly
Sloven
ia
Greece
Slovak
Rep
ublic
Czech
Rep
ublic
Turke
y
Luxe
mbourg
Israe
l
Austri
aChil
e
Mexico
Brazil
Shang
hai, C
hina
Russia
n Fed
eratio
n
550
500
450
400
350
300
Students without an immigrant background Second-generation studentsFirst-generation students
Mean performance in the reading scale
Finlan
d
Canad
a
New Ze
aland
Belgium
Netherl
ands
Austra
lia
Switzerl
and
German
y
Norway
Sweden
United
States
Eston
ia
Franc
e
Irelan
d
Denmark
OECD av
erag
e
United
Kingdo
m
Hunga
ry
Luxe
mbourg
Portug
alIta
ly
Greece
Sloven
iaSpa
in
Austri
aIsr
ael
Czech
Rep
ublic
Russia
n Fed
eratio
n
Mexico
Brazil
EDUCATION AT A GLANCE 2012: HIGHLIGHTS © OECD 2012 73

5. SPECIAL SECTION: EQUITY
Access to early childhood education
– Fifteen-year-olds who attended pre-primary education tend toperform better at school.
– More than three-quarters of 4-year-olds (79%) are enrolled inearly childhood education across OECD countries.
– Expenditure on pre-primary education accounts for 9% of OECDspending on educational institutions.
– Compared to primary, secondary and post-secondary non-tertiary education, pre-primary institutions have the largestproportion of funds from private sources with 18%.
Significance
Early childhood education helps to build a strong founda-tion for lifelong learning and can pIay a significant role in achild’s development. Making sure all children start on anequal footing can also mitigate social inequalities. It is thusimportant to promote sustained public funding to supportthe growth and quality of early childhood programmes.
As countries expand their early childhood programmes,they need to consider parents’ needs and expectationsregarding accessibility, cost, programme, quality andaccountability. Private institutions, child care, or extra-curricular activities can result in heavy financial burdensfor parents, even when government subsidies are provided.
Findings
Results from the OECD’s PISA assessment of students atage 15 show that, in most countries, pupils who haveattended pre-primary education programmes tend toperform better than those who have not. PISA research alsoshows that longer duration of pre-primary education,smaller pupil-to-teacher ratios and higher public expendi-ture per child all enhance the positive effects of pre-primary attendance.
Education now begins for most children well before theyare 5 years old in the majority of OECD countries. Morethan three quarters (79%) of 4-year-olds are enrolled inearly childhood education programmes across OECDcountries and this reaches 83%, on average, in OECDcountries that are part of the European Union.
Annual expenditure per pupil for both public and privateinstitutions at pre-primary level averages USD 6 670 inOECD countries. Expenditure varies, however, fromUSD 2 500 or less in Argentina, Brazil, Indonesia, Mexicoand South Africa to more than USD 10 000 in Luxembourgand New Zealand. As a percentage of GDP, expenditure onpre-primary education accounts for 9% of total OECDexpenditure on educational institutions. Publicly-fundedpre-primary education tends to be more strongly developedin the European countries than the non-European coun-tries of the OECD.
Pre-primary institutions obtain the largest proportion offunds from private sources compared to primary, second-ary and post-secondary non-tertiary education, with 18%.Private funding varies widely, however, between countries,ranging from 5% or less in Belgium, Estonia, Luxembourg,the Netherlands and Sweden, to 25% or more in Argentina,Austria and Germany and over 48% in Australia, Japanand Korea.
Trends
Enrolment in early childhood education programmes rosefrom 77% of 4-year-olds in 2005 to 81% in 2010 on averagefor OECD countries. In Mexico and Poland, enrolment ratesof 4 year-olds increased by more than 20 percentage pointsduring this period.
Definitions
Items in this section are taken from the PISA 2009 assess-ment of students’ competence in reading, mathematicsand science and from Starting Strong II and III: EarlyChildhood Education and Care (OECD, 2006 and 2011).
Information on data for Israel:http://dx.doi.org/10.1787/888932315602.
Further reading from OECD
The following additional material relevant to this indicatoris available online:
– PISA Volume II.
– Starting Strong II and III: Early Childhood Education and Care,2006 and 2011.
Going further
For additional material, notes and a full explanationof sourcing and methodologies, see Education at aGlance 2012 (Indicator C2).
Areas covered include:
– Enrolment rates in pre-primary programmes.
– Expenditure by public and private sources.
– Influence of pre-primary education policies on PISAresults.
EDUCATION AT A GLANCE 2012: HIGHLIGHTS © OECD 201274
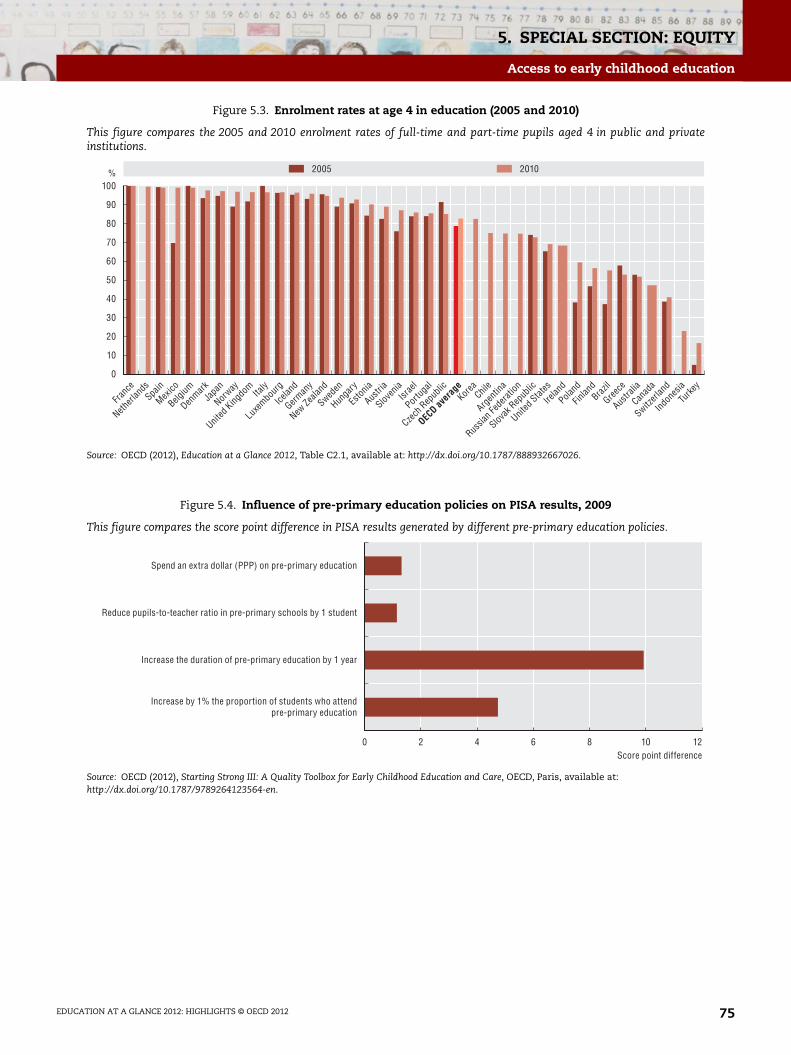
5. SPECIAL SECTION: EQUITY
Access to early childhood education
Figure 5.3. Enrolment rates at age 4 in education (2005 and 2010)
This figure compares the 2005 and 2010 enrolment rates of full-time and part-time pupils aged 4 in public and privateinstitutions.
Source: OECD (2012), Education at a Glance 2012, Table C2.1, available at: http://dx.doi.org/10.1787/888932667026.
Figure 5.4. Influence of pre-primary education policies on PISA results, 2009
This figure compares the score point difference in PISA results generated by different pre-primary education policies.
Source: OECD (2012), Starting Strong III: A Quality Toolbox for Early Childhood Education and Care, OECD, Paris, available at:http://dx.doi.org/10.1787/9789264123564-en.
100%
90
80
70
60
50
40
30
20
10
0
2005 2010
Spain
Mexico
Franc
e
Netherl
ands
Belgium
Denmark
Japa
n
Norway
United
Kingdo
mIta
ly
Luxe
mbourg
Icelan
d
German
y
New Ze
aland
Sweden
Hunga
ry
Eston
ia
Austri
a
Sloven
iaIsr
ael
Portug
al
Czech
Rep
ublic
OECD av
erag
eKor
eaChil
e
Argen
tina
Russia
n Fed
eratio
n
Slovak
Rep
ublic
United
States
Irelan
d
Poland
Finlan
dBraz
il
Greece
Austra
lia
Canad
a
Switzerl
and
Indon
esia
Turke
y
0 2 4 6 8 10 12Score point difference
Spend an extra dollar (PPP) on pre-primary education
Reduce pupils-to-teacher ratio in pre-primary schools by 1 student
Increase the duration of pre-primary education by 1 year
Increase by 1% the proportion of students who attendpre-primary education
EDUCATION AT A GLANCE 2012: HIGHLIGHTS © OECD 2012 75

5. SPECIAL SECTION: EQUITY
Access to secondary and tertiary education
– National examinations are more prevalent at the upper second-ary level than at the primary level. Twenty-three countries havenational examinations at the upper secondary level.
– Thirty-two countries reported using entrance examinations fortertiary education.
– Twenty countries reported that they have alternative routes orflexible pathways that can be used to gain access to tertiaryeducation.
Significance
A number of factors motivate students to learn. Thissection looks at some of the key factors that may influencethe amount of pressure placed on students to work hard inschool, such as the presence and nature of examinationsthat influence access to secondary and tertiary education.Other factors that can motivate students include require-ments for access to tertiary education and the availabilityand competition for places in tertiary education; however,alternative routes or flexible pathways to higher educationare necessary to strengthen equity in access to education.
Findings
National examinations are more prevalent at the uppersecondary level than at primary and lower secondary level.Twenty-three of 36 countries have national examinationsat the upper secondary level, and in 18 of them theseexaminations are compulsory for students in generalprogrammes. In addition to national examinations, sevencountries reported using other non-national standardisedexaminations at the upper secondary level.
A total of 32 countries use entrance examinations that arenot administered by upper secondary schools, for tertiaryeducation; in nine of these countries the examinationcovers all fields of study, in seven the examinations covermore than half of the fields of study, and in the remaining16 countries the examinations cover only some of the fieldsof study available. In addition to entrance examinations,other factors, criteria or special circumstances are used todetermine access to tertiary education. The most commonis Grade Point Average (GPA) from secondary schools:21 countries reported using GPA as a criterion. Otherfactors include previous work experience in 14 countries,application letters or written rationale in 11 countries andpast service or volunteer work in 10 countries. Familybackground factors, such as ethnicity of the applicant orfamily income, were used in only six and eight countries,respectively.
The number of available places at tertiary level and thedegree of competition for these places are importantfactors in determining how much pressure students mayexperience as they go through primary and secondaryschool. For example, if tertiary education is guaranteed forall upper secondary graduates, students will probably feel
less pressure than if they had to compete with peers or hadto meet certain performance standards to be admitted.University entry rates illustrate the relative accessibility oftertiary education within each country.
Additional alternative routes or flexible pathways can beused to access tertiary education in 20 countries. InSweden, higher education institutions can use alternativeselection criteria for as many as a third of the availableplaces, though these alternative criteria are mainly used toselect from among applicants who have the necessaryformal qualifications. Special tests other than the standarduniversity entrance examinations, relevant knowledge,professional or vocational experience and other criteria rel-evant to the programme can be considered in these cases.
Trends
In addition to certifying student performance, nationalexaminations are also a prominent means of holdingschools and education systems accountable. This methodof ensuring accountability has become increasingly impor-tant internationally in the past few decades. This shift togreater use of national examinations is also partly attrib-uted to the technological advances that make it easier totest large populations of students regularly.
Definitions
Data are from the 2011 OECD-INES Survey on NationalExaminations and Access to Tertiary Education and refer tothe school year 2010-11.
Information on data for Israel:http://dx.doi.org/10.1787/888932315602.
Further reading from OECD
OECD (2011), “Resources, Policies and Practices”, PISA 2009Results: What Makes a School Successful?.
Going further
For additional material, notes and a full explanationof sourcing and methodologies, see Education at aGlance 2012 (Indicator D7).
Areas covered include:
– Examinations and access to secondary and tertiaryeducation.
– Influence of factors other than examinations todetermine access to tertiary education.
EDUCATION AT A GLANCE 2012: HIGHLIGHTS © OECD 201276

5. SPECIAL SECTION: EQUITY
Access to secondary and tertiary education
Figure 5.5. Examinations and access to secondary and tertiary education, 2011
These figures show national examination requirements that determine access to secondary and tertiary education, by country.
Source: OECD (2012), Education at a Glance 2012, Tables D7.1a, D7.2a, D7.3a and D7.1b, D7.1c, D7.2b, D7.2c, available at: http://dx.doi.org/10.1787/888932668812; http://dx.doi.org/10.1787/888932668869; http://dx.doi.org/10.1787/888932668945;http://dx.doi.org/10.1787/888932668831; http://dx.doi.org/10.1787/888932668850; http://dx.doi.org/10.1787/888932668888; http://dx.doi.org/10.1787/888932668907.
Figure 5.6. Influence of factors other than examinations in access to tertiary education, 2011
This figure shows the number of countries which use selection mechanisms other than examinations and the importance of these criteriain determining access to the first stage of tertiary education.
Source: OECD (2012), Education at a Glance 2012, Table D7.4a, available at: http://dx.doi.org/10.1787/888932668983.
No examination Not compulsory for students Compulsory for students Not applicable
Yes, for all fields of study Yes, for most (more than half) fields of study Yes, for some fields of study No entrance examinations
Primary
Lower secondary
Upper secondary
Austra
lia
Austri
a
Belgium
(Fl.)
Belgium
(Fr.)
Chile
Czech
Rep
ublic
Denmark
Engla
nd
Eston
ia
Finlan
d
Franc
e
German
y
Greece
Hunga
ry
Icelan
d
Irelan
dIsr
aelIta
lyJa
panKor
ea
Luxe
mbourg
Mexico
Netherl
ands
Norway
Poland
Portug
al
Scotla
nd
Slovak
Rep
ublic
Spain
Sweden
Switzerl
and
Turke
y
United
States
Brazil
Indon
esia
Russia
n Fed
eratio
n
Existenceof national
examinations
Austra
lia
Austri
a
Belgium
(Fl.)
Belgium
(Fr.)
Chile
Czech
Rep
ublic
Denmark
Engla
nd
Eston
ia
Finlan
d
Franc
e
German
y
Greece
Hunga
ry
Icelan
d
Irelan
dIsr
aelIta
lyJa
panKor
ea
Luxe
mbourg
Mexico
Netherl
ands
Norway
Poland
Portug
al
Scotla
nd
Slovak
Rep
ublic
Spain
Sweden
Switzerl
and
Turke
y
United
States
Brazil
Indon
esia
Russia
n Fed
eratio
n
Existence of entrance examinationsfor tertiary education
which are not administeredby upper secondary schools
35
30
25
20
15
10
5
0
High level of importance Moderate level of importance Low level of importance Used but importance unknown
Number of countries reporting existence of other factors than examinations
Grade-point averagefrom secondary
schools
Past work experience Applicant letteror written rationaleto justify admission
Past serviceor volunteer work
Family incomeof applicant
Recommendations Ethnicity of applicant
EDUCATION AT A GLANCE 2012: HIGHLIGHTS © OECD 2012 77

5. SPECIAL SECTION: EQUITY
Access to the labour market
– Women have higher tertiary attainment rates on averageacross OECD countries, but their employment rates are muchlower than those of men.
– Younger people face higher risks of unemployment at all levelsof education.
– Individuals with a vocational upper secondary education astheir highest degree have higher employment rates than adultswith a general upper secondary education.
Significance
This section looks at how gender, type of education and agecan restrict or accelerate access to the labour market. Thebenefits of education on employability are indisputable.These benefits, however, are not equally shared betweenmen and women, people with general education asopposed to vocational education or between young andsenior adults. This is especially relevant in times ofeconomic hardship as the impact of economic conditionson individuals’ chances of being employed or unemployedvaries significantly. Data on the relationship betweeneducational attainment on employment and unemploy-ment provide valuable information to policy makers seek-ing to understand and respond to challenging economiccircumstances.
Findings
Women have higher tertiary attainment rates than men onaverage across OECD countries, but in most countries, theemployment rates of highly-skilled women are still remark-ably low. On average among OECD countries, 32% of25-64 year-old women had successfully completed tertiaryeducation in 2010, compared with 29% of men. The employ-ment rate for women with tertiary education was still9 percentage points lower than that of men, however. Thisgap is particularly large in Chile, the Czech Republic, Japan,Korea, Mexico and Turkey, where the difference reaches29 percentage points. In the Nordic countries, wherewomen’s employment rates are highest, expansion of child-care services was implemented specifically to increase jobopportunities for women. In Sweden, for example, theexpansion of child care services during the 1970s is thoughtto have helped increase women’s employment rates from60% to over 80%. There are fewer women working full-timethan men in most OECD countries. Although this rateincreases with higher education levels, only 69% of tertiary-educated women work full-time compared with 84% of men,on average, across OECD countries.
Unemployment rates vary considerably, depending on the agegroup. Overall, unemployment rates among 55-64 year-oldsare much lower than those for 25-34 year-olds. On averageacross OECD countries, 19.1% of 25-34 year-olds withoutupper secondary education are unemployed, while this
concerns only 8.8% of 55-64 olds. Unemployment is lower forpeople with tertiary education but there is still an age gap. For55-64 year-olds with a tertiary education, the unemploymentrate is 4%, while it is 6.5% for 25-34 year-olds.
Vocational education and training (VET) is generally gearedtowards giving students relevant labour market skills for aparticular occupation or industry. Research has shown thatinvesting in VET can yield good economic returns andcountries with strong VET systems, like Germany, havebeen relatively successful in tackling youth unemploy-ment. On average across OECD countries, 31% of the popu-lation has attained vocational upper secondary education.The average employment rate of these individuals is 75.5%which is 4.8 percentage points higher than those withgeneral upper secondary education. This may be due to thefact that throughout the course of vocational education,individuals typically learn specific skills that are immedi-ately needed in the labour market. By contrast, skillslearned in general education at an upper secondarylevel might be less specific and have weaker links to thelabour market. In addition, the inactivity rate is about5 percentage points lower among 25-64 year-olds with avocational education, compared with adults with a generaleducation.
Definitions
The employment rate refers to the number of persons inemployment as a percentage of the population of workingage. The unemployment rate refers to unemployed personsas a percentage of the civil labour force. The unemployedare defined as people actively seeking employment andcurrently available to start work. The employed are definedas those who work for pay or profit for at least one hour aweek, or who have a job but are temporarily not at workdue to illness, leave or industrial action.
Information on data for Israel:http://dx.doi.org/10.1787/888932315602.
Going further
For additional material, notes and a full explanationof sourcing and methodologies, see Education at aGlance 2012 (Indicator A7).
Areas covered include:
– Size and labour outcomes of vocational educationand training by gender.
– Difference between employment rates of vocationaland general education attainment by gender.
EDUCATION AT A GLANCE 2012: HIGHLIGHTS © OECD 201278

5. SPECIAL SECTION: EQUITY
Access to the labour market
Figure 5.7. Proportion of full-time earners among 25-64 year-old tertiary-educated individuals, by gender (2010 or latest available year)
This figure compares the proportion of full-time workers among men and women with tertiary education. Only 69% oftertiary-educated women work on a full-time basis compared with 84% for men, on average, across OECD countries.
Source: OECD (2012), Education at a Glance 2012, Table A7.5, available at: http://dx.doi.org/10.1787/888932665278.
Figure 5.8. Employment rates of people with vocational and general upper secondary education, 2010
This figure compares the employment rates of individuals with vocational upper-secondary education and those with generalupper-secondary education. People with a vocational upper secondary education tend to have higher employment rates thanadults with a general upper secondary education.
Source: OECD (2012), Education at a Glance 2012, Table A7.6, available at: http://dx.doi.org/10.1787/888932665297.
100
90
80
70
60
50
40
30
20
10
0
Men Women
Netherl
ands
German
y
Austri
a
Canad
a
Denmark
Sweden
Brazil
Irelan
d
Belgium
New Ze
aland
Franc
e
Slovak
Rep
ublic
Austra
lia
Luxe
mbourg
United
Kingdo
mIsr
ael
OECD av
erag
e
United
States Ita
lySpa
inKor
ea
Poland
Greece
Finlan
d
Eston
ia
Hunga
ry
Portug
al
85
80
75
70
65
60
55
90
50
Vocational education General education
Turke
y
Irelan
d
Hunga
ry
Eston
iaSpa
in
Poland
Slovak
Rep
ublic
Korea
Luxe
mbourg
Sloven
ia
Greece
Finlan
d
Franc
e
Czech
Rep
ublic Ita
ly
OECD av
erag
eIsr
ael
Belgium
German
y
Canad
a
Austri
a
Portug
al
Denmark
Netherl
ands
Switzerl
and
New Ze
aland
Norway
Sweden
Austra
lia
Icelan
d
EDUCATION AT A GLANCE 2012: HIGHLIGHTS © OECD 2012 79

5. SPECIAL SECTION: EQUITY
Access to lifelong learning
– More than 40% of adults participate in formal and/or non-formal education in a given year across OECD countries.
– Age and educational attainment both influence participation inadult learning.
– Employers invest more in non-formal education per participantfor men than for women.
Significance
Investing in education and training after leaving initialeducation is essential for upgrading the skills of the labourforce. Competition for skills is fierce, particularly in high-growth, high-technology markets. In order to meet theneeds of a changing labour market, an ever-larger segmentof the population must be able to adapt to changingtechnologies and to learn and apply new sets of skills.Increasing investment in adult learning and reducinginequity in participation are among the policy goals foundin many OECD countries.
Findings
More than 40% of adults participate in formal and/or non-formal education in a given year across OECD countries.This proportion ranges from less than 15% in Greece andHungary to more than 60% in New Zealand and Sweden.
Age and educational attainment both influence participa-tion in adult learning. Participation in all types of adultlearning – formal, non-formal and informal – tends todecline for older people in many OECD countries. AcrossOECD countries, 50% of 25-34 year-olds participate informal and/or non-formal education compared with only27% of 55-64 year-olds. The lowest overall participationrate, 14%, is found amongst the older cohort with a lowlevel of education. The highest participation rate, 65%, isfound amongst younger people with tertiary education.
Formal education delivered by educational institutions suchas schools, colleges or universities, is provided to 8% ofadults on average in OECD countries. Formal education isprovided to 17% of 25-34 year-olds and 2% of 55-64 year-olds.Across OECD countries, a participant in non-formal educa-tion receives 76 hours of instruction annually. Four out of
five of these hours are job-related. In all OECD countries, theoldest cohort (55-64 year-olds) receives fewer hours ofinstruction in job-related non-formal education than aver-age. The difference in instruction hours between the young-est and the oldest cohort amount to more than 30 hours inBelgium, Hungary, Korea and the United Kingdom.
Gender can also have an impact on access to non-formaleducation, as the annual investment per participant inemployer-sponsored non-formal education is substantiallyhigher for men than for women. The labour costs ofworking time devoted to non-formal education are higherfor men in every country but the estimated total number ofhours in employer-sponsored non-formal education ishigher for women in the Czech Republic, Denmark,Finland, Hungary, Portugal and Spain.
Definitions
Data for non-European countries were calculated fromcountry-specific household surveys (see Annex 3). Data forcountries in the European Statistical System come from thepilot EU Adult Education Survey (AES). The EU AES wasconducted by 29 countries in the EU, EFTA and candidatecountries between 2005 and 2008. The EU AES is a pilotexercise using a common framework, including a standardquestionnaire, tools and quality reporting.
Information on data for Israel:http://dx.doi.org/10.1787/888932315602.
Going further
For additional material, notes and a full explanationof sourcing and methodologies, see Education at aGlance 2012 (Indicator C6).
Areas covered include:
– Participation in non-formal education and adultlearning by age group.
– Mean hours of job-related non-formal education byage group.
EDUCATION AT A GLANCE 2012: HIGHLIGHTS © OECD 201280

5. SPECIAL SECTION: EQUITY
Access to lifelong learning
Figure 5.9. Participation in non-formal education, by age group, 2007
This figure compares the participation levels of 25-34 year-olds and 55-64 year-olds in non-formal education.
Source: OECD (2012), Education at a Glance 2012, Table C6.4a, available at: http://dx.doi.org/10.1787/888932667672.
Figure 5.10. Mean hours of job-related non-formal education by age group, 2007
This figure compares hours of job-related non-formal education received on average by 25-34 year-olds and 55-64 year-olds.
Source: OECD (2012), Education at a Glance 2012, Table C6.8, available at: http://dx.doi.org/10.1787/888932667767.
80%
70
60
50
40
30
20
10
0
25-34 years 55-64 years
Sweden
Switzerl
and
Norway
United
States
Finlan
d
United
Kingdo
m
Netherl
ands
New Ze
aland
Denmark
Eston
ia
German
y
Canad
a
Austri
a
Slovak
Rep
ublic
Korea
Austra
lia
OECD av
erag
e
Sloven
ia
Czech
Rep
ublic
Belgium Spa
in
Irelan
dIta
ly
Portug
al
Poland
Greece
Turke
y
Hunga
ry
200
150
100
50
250
0
25-34 years 55-64 years
Denmark
Poland
Norway
Hunga
ry
Finlan
d
Belgium
Greece
Korea
Sweden
Spain
New Ze
aland
United
States
Austri
a
Switzerl
and
OECD av
erag
e
Portug
al
Czech
Rep
ublic
German
y
Netherl
ands
Eston
ia
Canad
a
Slovak
Rep
ublic Ita
ly
United
Kingdo
m
Sloven
ia
Turke
y
EDUCATION AT A GLANCE 2012: HIGHLIGHTS © OECD 2012 81

5. SPECIAL SECTION: EQUITY
Does parental education affect students’ chances?
– Only one in five students from families with low levels ofeducation attains a tertiary degree. On average across OECDcountries, 66% of students with at least one parent withtertiary education graduate from tertiary education.
– Young women are more successful than young men in attaininga higher level of education than their parents.
– On average across OECD countries, approximately half of25-34 year-old non-students have achieved the same level ofeducation as their parents while more than one-third havesurpassed their parents’ educational level.
Significance
Because of its strong links to earnings, employment, overallwealth and the well-being of individuals, education is a keyelement in mitigating inequalities in societies. It is impor-tant, then, to level the playing field for young people fromweak educational backgrounds. Various policy options,such as maintaining reasonable costs for higher educationand robust student-support systems, can help thesestudents. Ensuring access to and success in higher educa-tion for all is important, but so is addressing inequalities atthe earliest stages of schooling. Little can be done toremedy poor outcomes at the last stage of the educationladder without also compromising the quality of highereducation.
Findings
On average across OECD countries, 66% of individuals withat least one highly educated parent succeed in attaining atertiary degree, while only 20% of individuals whoseparents have low levels of education have a tertiary degree.Young people aged 25-34 with low educational back-grounds enjoy the greatest educational opportunities inAustralia, Canada, Denmark, Finland, France, Iceland,Ireland, the Netherlands, Spain and Sweden, where at least25% of this cohort have reached tertiary education and lessthan 30% have not completed at least an upper secondaryeducation. At the other end of the spectrum, in Italy,Portugal, Turkey and the United States more than 40% ofyoung people from low educational backgrounds do notcomplete upper secondary education and fewer than 20%have made it to tertiary education.
Young women (25-34 year-olds) are more likely than youngmen to attain a higher level of education than theirparents. The differences in intergenerational mobility areparticularly stark in Greece, Iceland, Norway, Portugal,Slovenia and Spain, where young women are at least10 percentage points more likely than young men to belongto this group.
Trends
The expansion of education systems in many OECDcountries, both at the upper secondary or post-secondarynon-tertiary and the tertiary levels of education, has givenyoung people an opportunity to attain a higher level ofeducation than their parents. On average, 37% of youngpeople have achieved a higher level of education than theirparents, while only 13% have not been able to reach theirparents’ educational level. In all countries except Estonia,Germany and Iceland, upward mobility in education ismore common than downward mobility, reflecting theexpansion of education systems in most OECD countries.The expansion of education has been particularlypronounced in Australia, the Czech Republic, Greece,Hungary, Ireland, Italy and Poland, where the differencebetween upward and downward educational mobility is40 percentage points or more.
Definitions
The 2009 Transition Ad Hoc Module, a supplement tothe 2009 EU Labour Force Surveys, was used for most of thecountries in this analysis. The Adult Literacy and LifeskillsSurvey (ALL) was used as a data source for Australia,Canada, New Zealand and the United States. The firstwave, which took place in 2003, includes Canada and theUnited States. The second wave took place in 2006 forNew Zealand and Australia.
Information on data for Israel:http://dx.doi.org/10.1787/888932315602.
Further reading from OECD
OECD (2012), Let’s Read Them a Story! The Parent Factor inEducation.
Going further
For additional material, notes and a full explanationof sourcing and methodologies, see Education at aGlance 2012 (Indicator A6).
Areas covered include:
– Odds of attending higher education if parents arehighly educated.
– Intergenerational mobility.
EDUCATION AT A GLANCE 2012: HIGHLIGHTS © OECD 201282

5. SPECIAL SECTION: EQUITY
Does parental education affect students’ chances?
Figure 5.11. The odds of attending higher education if parents are highly educated, 2009
This figure compares the level of influence high parental education levels can have on higher education attainment,by country.
Source: OECD (2012), Education at a Glance 2012, Table A6.1, available at: http://dx.doi.org/10.1787/888932664955.
Figure 5.12. Intergenerational mobility in education, 2009
This figure shows the shares of both ascending and descending mobility in education, by country.
Source: OECD (2012), Education at a Glance 2012, Table A6.3, available at: http://dx.doi.org/10.1787/888932664993.
80
70
60
50
40
30
20
10
0
4.0
3.5
3.0
2.5
2.0
1.5
1.0
0.5
0
%
Odds of being a student in higher education if parents have high levels of education (right axis)
Proportion of young students (20-34 year-olds) in higher education whose parents have high levels of education (left axis)
Odds ratio
Turke
y
Portug
alIta
ly
Czech
Rep
ublic
Hunga
ry
Slovak
Rep
ublic
Spain
Greece
Austri
a
Franc
e
Poland
New Ze
aland
OECD av
erag
e
Austra
lia
Irelan
d
Belgium
German
y
United
Kingdo
m
Switzerl
and
United
States
Sloven
ia
Canad
a
Netherl
ands
Finlan
d
Eston
ia
Sweden
Luxe
mbourg
Norway
Icelan
d
Denmark
70
60
50
40
30
20
10
0
100
80
90
% Upward mobility Downward mobility Status quo
Poland
Irelan
d
Hunga
ry
Czech
Rep
ublic
Austra
lia
Greece Ita
ly
Franc
eSpa
in
Sweden
United
Kingdo
m
Luxe
mbourg
Belgium
Sloven
ia
Netherl
ands
Portug
al
OECD av
erag
e
Canad
a
Turke
y
Switzerl
and
Denmark
Finlan
d
New Ze
aland
Austri
a
Icelan
d
Norway
United
States
German
y
Slovak
Rep
ublic
Eston
ia
EDUCATION AT A GLANCE 2012: HIGHLIGHTS © OECD 2012 83

5. SPECIAL SECTION: EQUITY
Integrating immigrants’ children
– In many countries, the level of reading performance of immi-grant students is lower than that of non-immigrant students.
– The educational attainment of mothers has a stronger impacton the reading performance of students in a school than theprimary language at home or the proportion of immigrantstudents in that school.
– In many countries and for all students – not only immigrantstudents – being in an advantaged versus a disadvantagedschool has a stronger impact on reading scores than familybackground.
Significance
A country’s success in integrating immigrant students is akey measure of its education system’s quality and equityand also sheds light on the efficiency of its broader socialpolicies. Designing education policies to address the needsof immigrant students is often difficult and expensive andeducation policy alone is unlikely to address thesechallenges fully. Reducing the concentration of educationaldisadvantage in schools may imply changes in other areasof social policy – for example, housing policies that pro-mote a more balanced social mix in schools at an early age.
Findings
In many countries, the performance level in reading ofimmigrant students is lower than that of non-immigrantstudents. Non-immigrant students outperformed immi-grant students by more than 40 score points on both 2000and 2009 PISA assessments.
The school’s composition – that is, the characteristics ofthe student population – can exert a significant influenceon a student’s performance. Three measures can definea school’s composition: the percentage of immigrantstudents, the percentage of immigrant students in a schoolspeaking another language at home and the percentage ofstudents (whatever their origin) in a school who havemothers with low educational attainment. The greatestimpact on reading performance comes from the percentageof students from disadvantaged backgrounds, i.e. schoolsthat have a high concentration of students with motherswith low educational attainment. Across OECD countries,the gap between students attending disadvantaged versusadvantaged schools is nearly the equivalent of two schoolyears. The percentage of children who mostly speak a for-eign language at home is next in terms of correlation whilethe percentage of immigrant students is last.
Across OECD countries, more than one third of immigrantstudents attend schools with the highest concentrations ofstudents with mothers with low educational attainment.There are very large differences in scores between schools,except in nordic and eastern European countries and somecountries with a long tradition of attracting immigrantssuch as Australia, Canada and New Zealand.
Immigrant students from socio-economically disadvan-taged neighbourhoods but with highly educated mothersare overrepresented in “disadvantaged schools”. AcrossOECD countries, more than a quarter of students withhighly educated mothers in disadvantaged schools areimmigrant students. In the European Union, these studentsare more than twice as likely to attend disadvantagedschools as their non-immigrant counterparts. There isstrong overrepresentation of immigrant students withhighly educated mothers in disadvantaged schools in allcountries except Brazil, Estonia, Israel and Norway.
Trends
On average among OECD countries with comparable data,the percentage of immigrant students increased by twopercentage points between 2000 and 2009. The perfor-mance difference between immigrant and non-immigrantstudents remained broadly similar. Non-immigrantstudents outperformed immigrant students by more than40 score points on both 2000 and 2009 PISA assessments.
Definitions
Items in this section are taken from the PISA 2009 assess-ment of students’ competence in reading. PISA coversstudents who are between 15 years 3 months and 16 years2 months of age at the time of assessment, and who havecompleted at least 6 years of formal schooling, regardlessof the type of institution in which they are enrolled and ofwhether they are in full-time or part-time education,whether they attend general or vocational programmes,and whether they attend public, private or foreign schoolswithin the country.
For information on the PISA assessment instruments and themethods used in PISA see the PISA website, www.pisa.oecd.org.
Information on data for Israel:http://dx.doi.org/10.1787/888932315602.
Further reading from OECD
OECD (2010), Closing the Gap for Immigrant Students.
OECD (2012), Untapped Skills: Realising the Potential ofImmigrant Student, PISA.
Going further
For additional material, notes and a full explanationof sourcing and methodologies, see Education at aGlance 2012 (Indicator A5).
EDUCATION AT A GLANCE 2012: HIGHLIGHTS © OECD 201284

5. SPECIAL SECTION: EQUITY
Integrating immigrants’ children
Figure 5.13. Factors affecting reading performance
These figures show that having more students with a low-educated mother has a greater negative effect on readingperformance than having more immigrants or students who speak a foreign language at home.
Source: OECD (2012), Education at a Glance 2012, Table A5.1, available at: http://dx.doi.org/10.1787/888932664860.
0.2
0.1
0
-0.1
-0.2
-0.3
-0.4
-0.1
-0.2
-0.3
-0.4
-0.5
-0.5
0
-0.6
Concentration of immigrant students Concentration of immigrant students with a foreign language
German
y
Hunga
ry
Luxe
mbourg Ita
ly
Austri
a
Franc
e
Switzerl
and
Mexico
Sloven
ia
Greece
Israe
l
Belgium
Netherl
ands
Portug
al
OECD av
erag
e
Russia
n Fed
eratio
n
Argen
tina
United
Kingdo
m
Czech
Rep
ublic
United
States
New Ze
aland
Austra
liaSpa
in
Denmark
Sweden
Norway
Brazil
Canad
a
Finlan
d
Irelan
d
Icelan
d
Eston
ia
Immigrant students’ reading performance
Reading performance and concentration in schools of students whose mother has a low level of education
Reading performance and concentration in schools of immigrant studentsand students speaking a foreign language at home
EDUCATION AT A GLANCE 2012: HIGHLIGHTS © OECD 2012 85

5. SPECIAL SECTION: EQUITY
Reducing the gender gap
– In almost all countries, girls have more ambitious professionalaspirations than boys.
– Countries where girls are significantly more ambitious thanboys tend to be those where women outnumber men atuniversity.
– Only 5% of 15 year-old girls in OECD countries aim for a careerin engineering and computing compared with 18% for boys.
Significance
Significant progress has been achieved in reducing thegender gap in educational attainment, although in certainfields of study such as mathematics and computer science,gender differences still exist. Gender equality is not only agoal in itself, it is also economically beneficial. Educationsystems can influence students’ perceptions of what occu-pations lie ahead of them and prior to that their academicdecisions and performance. Strengthening the role thateducation systems can play in moderating gender differ-ences in performance in different subject areas should bean important policy objective. This indicator begins byexamining data from OECD’s PISA study on gender differ-ences in the occupations which 15-year old students expectto practice by the age of 30 and then goes on to analysewhich fields girls and boys choose to study several yearsafter.
Findings
When asked what they expect to be doing around the ageof 30, 15-year-old girls tend to have more ambitious pro-fessional aspirations than boys. On average, girls are11 percentage points more likely than boys to expect towork in high-status careers such as legislators, seniorofficials, managers and professionals. France, Germanyand Japan are the only OECD countries where similarproportions of boys and girls aspire to these careers, whilein Switzerland, boys generally have slightly moreambitious aspirations than girls. The gender gap in careerexpectations is particularly wide in Greece and Polandwhere it reaches 20 percentage points.
Countries where 15-year-old girls have significantly highercareer aspirations than boys tend to be those wherewomen are over-represented at university. The proportionof women with a first university degree exceeds that ofmen in 35 out of 39 countries and on average in OECDcountries, 59% of all university graduates are women. Theproportion is below 50% only in China, Japan, Korea andTurkey. However men are still more likely than women tohold advanced research qualifications across the OECD. InJapan and Korea, two-thirds or more of advanced researchqualifications are awarded to men.
In recent years, girls in many countries have caught upwith or even surpassed boys in science proficiency. Betterperformance in science among girls, however, does notnecessarily mean that girls will pursue all types of science-related careers. Careers in “engineering and computing”still attract relatively few girls. On average, only 5% of15 year-old girls in OECD countries aim for a career inengineering and computing, compared with 18% of boys. Incontrast, more girls than boys expect a career in health andservices in every OECD country.
Trends
Gender gaps still exist both in the education system and inthe labour market, although these have narrowed slightlysince 2000. For example, the proportion of women whoentered university rose from 60% in 2005 to 69% in 2010,while the proportion of men who entered similarprogrammes only rose from 48% in 2005 to 55% in 2010.
While few girls expect to enter certain science careers, suchas engineering and computing, the proportion of women inthese fields of education has increased slightly, from 23% to27%, over the past decade.
Definitions
Data on graduates and new entrants refer to the academicyear 2009-10 and are based on the UOE data collection oneducation statistics administered by the OECD in 2011 (fordetails, see Annex 3 at www.oecd.org/edu/eag2012).
Information on data for Israel:http://dx.doi.org/10.1787/888932315602.
Further reading from OECD
OECD (2011), “Gendered Career Expectations of Students:Perspectives from PISA 2006”, OECD Education WorkingPapers.
Going further
For additional material, notes and a full explanationof sourcing and methodologies, see Education at aGlance 2012 (Indicator A4).
Areas covered include:
– Career expectations by gender.
– Gender differences by field of education.
EDUCATION AT A GLANCE 2012: HIGHLIGHTS © OECD 201286

5. SPECIAL SECTION: EQUITY
Reducing the gender gap
Figure 5.14. Percentage of 15-year-old boys and girls planning a career in health services
Source: OECD (2012), Education at a Glance 2012, Table A4.3, available at: http://dx.doi.org/10.1787/888932664727.
Figure 5.15. Percentage of 15-year-old boys and girls planning a career in engineering or computing
Source: OECD (2012), Education at a Glance 2012, Table A4.2, available at: http://dx.doi.org/10.1787/888932664708.
Figure 5.16. Share of women graduates, by field of education, 2010
This figure shows the percentage of tertiary qualifications awarded to women in university and advanced research programmes, by fieldof education.
Source: OECD (2012), Education at a Glance 2012, Table A4.6, available at: http://dx.doi.org/10.1787/888932664784.
30%
25
20
15
10
5
0
Boys Girls
Brazil
United
States
Chile
Canad
a
Portug
alIsr
ael
Franc
e
Icelan
d
Argen
tina
New Ze
aland
Spain
Sloven
ia
Irelan
d
Mexico
Japa
n
Poland
Denmark
OECD av
erag
e
Norway
Italy
Austra
lia
Switzerl
and
Netherl
ands
Turke
y
United
Kingdo
m
Finlan
d
Russia
n Fed
eratio
n
Sweden
Belgium
Austri
a
German
y
Greece
Eston
ia
Luxe
mbourg
Hunga
ry
Slovak
Rep
ublic
Czech
Rep
ublic
Korea
30
25
20
15
10
5
0
35% Boys Girls
Poland
Sloven
ia
Mexico Chil
e
Portug
alSpa
in
Slovak
Rep
ublic Ita
ly
Russia
n Fed
eratio
n
Turke
y
Czech
Rep
ublic
Norway
Greece
Hunga
ry
Canad
a
Belgium
Argen
tina
Eston
ia
Franc
e
OECD av
erag
e
Irelan
dBraz
il
Luxe
mbourg
United
States
Austra
liaIsr
ael
Sweden
Japa
n
Austri
a
Switzerl
and
German
y
Icelan
d
Denmark
United
Kingdo
mKor
ea
New Ze
aland
Finlan
d
Netherl
ands
100%
9080706050403020100
Engineering, manufacturing and construction Health and welfare Education All fields
Eston
ia
Icelan
d
Poland
Sloven
ia
Slovak
Rep
ublic
Sweden
Hunga
ryBraz
il
Saudi
Arabia
Greece
Norway
New Ze
aland
Portug
al
Finlan
d
Canad
a
Denmark
Argen
tinaSpa
inIta
ly
Czech
Rep
ublic
South
Africa
OECD av
erag
e
United
States
Irelan
dIsr
ael
Netherl
ands
Austra
liaChil
e
German
y
United
Kingdo
mMex
ico
Belgium
Franc
e
Austri
a
Indon
esia
Switzerl
andKor
ea
Turke
yJa
pan
EDUCATION AT A GLANCE 2012: HIGHLIGHTS © OECD 2012 87


Education at a Glance 2012
Highlights
© OECD 2012
Statistical note
Coverage of statisticsAlthough a lack of data still limits the scope of the indicators in many countries, the
coverage extends, in principle, to the entire national education system (within the national
territory) regardless of the ownership or sponsorship of the institutions concerned and
regardless of education delivery mechanisms. With one exception described below, all
types of students and all age groups are meant to be included: children (including students
with special needs), adults, nationals, foreigners, as well as students in open distance
learning, in special education programmes or in educational programmes organised by
ministries other than the Ministry of Education, provided the main aim of the programme
is the educational development of the individual. However, vocational and technical
training in the workplace, with the exception of combined school and work-based
programmes that are explicitly deemed to be parts of the education system, is not included
in the basic education expenditure and enrolment data.
Educational activities classified as “adult” or “non-regular” are covered, provided that
the activities involve studies or have a subject matter content similar to “regular”
education studies or that the underlying programmes lead to potential qualifications
similar to corresponding regular educational programmes. Courses for adults that are
primarily for general interest, personal enrichment, leisure or recreation are excluded.
Calculation of international meansFor many indicators an OECD average is presented and for some an OECD total.
OECD average: This is calculated as the unweighted mean of the data values of all
OECD countries for which data are available or can be estimated. The OECD average
therefore refers to an average of data values at the level of the national systems and can be
used to answer the question of how an indicator value for a given country compares with
the value for a typical or average country. It does not take into account the absolute size of
the education system in each country.
OECD total: This is calculated as a weighted mean of the data values of all OECD
countries for which data are available or can be estimated. It reflects the value for a given
indicator when the OECD area is considered as a whole. This approach is taken for the
purpose of comparing, for example, expenditure figures for individual countries with those
of the entire OECD area for which valid data are available, with this area considered as a
single entity.
EU21 average: This is calculated as the unweighted mean of the data values of the
21 members of the European Union for which data are available or can be estimated (see
the “Reader’s Guide”).
89

STATISTICAL NOTE
G20 average: This is calculated as the unweighted mean of the data values of all
G20 countries (see the “Reader’s Guide”) for which data are available or can be estimated
(the European Commission is not included in the calculation). The G20 average is not
computed if data for China or India are not available.
EDUCATION AT A GLANCE 2012: HIGHLIGHTS © OECD 201290

ORGANISATION FOR ECONOMIC CO-OPERATION AND DEVELOPMENT
The OECD is a unique forum where governments work together to address the economic, social and
environmental challenges of globalisation. The OECD is also at the forefront of efforts to understand and
to help governments respond to new developments and concerns, such as corporate governance, the
information economy and the challenges of an ageing population. The Organisation provides a setting
where governments can compare policy experiences, seek answers to common problems, identify good
practice and work to co-ordinate domestic and international policies.
The OECD member countries are: Australia, Austria, Belgium, Canada, Chile, the Czech Republic,
Denmark, Estonia, Finland, France, Germany, Greece, Hungary, Iceland, Ireland, Israel, Italy, Japan, Korea,
Luxembourg, Mexico, the Netherlands, New Zealand, Norway, Poland, Portugal, the Slovak Republic, Slovenia,
Spain, Sweden, Switzerland, Turkey, the United Kingdom and the United States. The European Union takes
part in the work of the OECD.
OECD Publishing disseminates widely the results of the Organisation’s statistics gathering and
research on economic, social and environmental issues, as well as the conventions, guidelines and
standards agreed by its members.
OECD PUBLISHING, 2, rue André-Pascal, 75775 PARIS CEDEX 16
(96 2012 04 1 P) ISBN 978-92-64-17956-1 – No. 60195 2012


![Oecd 2012_education at a Glance, Oecd Indicators [Germany]](https://static.fdocuments.net/doc/165x107/577ce4b41a28abf1038ef751/oecd-2012education-at-a-glance-oecd-indicators-germany.jpg)