Education as Liberation
51
Education as Liberation? * Willa Friedman University of California, Berkeley Michael Kremer Harvard University and NBER Edward Miguel University of California, Berkeley and NBER Rebecca Thornton University of Michigan First version: February 2011 This version: April 2011 Abstract: Less developed regions have experienced massive increases in both education and democracy over the past half century, and it is widely claimed that many recent democratic transitions have been propelled by increasingly educated youth populations. Scholars have also speculated about education’s social and political impacts, variously arguing that education promotes “modern” pro-democratic and secular attitudes and weakens ethnic attachments; that it instills acceptance of existing authority; and that it empowers the disadvantaged. These views have informed international efforts to promote education in poor countries, often focusing on girls. We assess the social and political impacts of a randomized girls’ merit scholarship incentive program in Kenya that raised test scores and secondary school enrollment. Counter to modernization theory, increased human capital did not produce more pro-democratic or secular attitudes and, if anything, it strengthened ethnic identification. Consistent with the empowerment view, young women in program schools had fewer arranged marriages and were less likely to accept domestic violence as legitimate. Moreover, the program increased objective political knowledge, and reduced both acceptance of political authorities and satisfaction with politics. However, in our Kenyan context, this rejection of the status quo did not translate into greater perceived political efficacy, community participation or voting intentions. Instead, the program increased the perceived legitimacy of political violence. We argue that selection bias may account for the view that education instills greater acceptance of authority. * We thank seminar audiences at Stanford University, at the U.C. Berkeley Working Group for African Political Economy (WGAPE) meetings, the JICA Conference on Ethnic Diversity and Economic Instability in Kenya, and the Centre for the Study of African Economies Conference for helpful comments. We appreciate helpful comments from Paul Collier, Marcel Fafchamps, Ray Fisman, Nahomi Ichino, and Dan Posner. Kenny Ajayi, Blastus Bwire, Lorenzo Casaburi, Garret Christensen, Joan Hamory Hicks and Owen Ozier provided excellent research assistance. We are grateful to the National Institutes of Health, National Science Foundation and Social Science Research Council for generous research support. The usual disclaimer applies. Corresponding author: Edward Miguel ([email protected], 1-510-642-7162).
Transcript of Education as Liberation

Education as Liberation?*
Willa Friedman
University of California, Berkeley
Michael Kremer
Harvard University and NBER
Edward Miguel
University of California, Berkeley and NBER
Rebecca Thornton
University of Michigan
First version: February 2011
This version: April 2011
Abstract: Less developed regions have experienced massive increases in both education
and democracy over the past half century, and it is widely claimed that many recent
democratic transitions have been propelled by increasingly educated youth populations.
Scholars have also speculated about education’s social and political impacts, variously
arguing that education promotes “modern” pro-democratic and secular attitudes and
weakens ethnic attachments; that it instills acceptance of existing authority; and that it
empowers the disadvantaged. These views have informed international efforts to
promote education in poor countries, often focusing on girls. We assess the social and
political impacts of a randomized girls’ merit scholarship incentive program in Kenya
that raised test scores and secondary school enrollment. Counter to modernization
theory, increased human capital did not produce more pro-democratic or secular
attitudes and, if anything, it strengthened ethnic identification. Consistent with the
empowerment view, young women in program schools had fewer arranged marriages
and were less likely to accept domestic violence as legitimate. Moreover, the program
increased objective political knowledge, and reduced both acceptance of political
authorities and satisfaction with politics. However, in our Kenyan context, this
rejection of the status quo did not translate into greater perceived political efficacy,
community participation or voting intentions. Instead, the program increased the
perceived legitimacy of political violence. We argue that selection bias may account
for the view that education instills greater acceptance of authority.
*We thank seminar audiences at Stanford University, at the U.C. Berkeley Working Group for African Political
Economy (WGAPE) meetings, the JICA Conference on Ethnic Diversity and Economic Instability in Kenya, and the
Centre for the Study of African Economies Conference for helpful comments. We appreciate helpful comments
from Paul Collier, Marcel Fafchamps, Ray Fisman, Nahomi Ichino, and Dan Posner. Kenny Ajayi, Blastus Bwire,
Lorenzo Casaburi, Garret Christensen, Joan Hamory Hicks and Owen Ozier provided excellent research assistance.
We are grateful to the National Institutes of Health, National Science Foundation and Social Science Research
Council for generous research support. The usual disclaimer applies.
Corresponding author: Edward Miguel ([email protected], 1-510-642-7162).

1
1. Introduction
This paper exploits a randomized merit scholarship competition for adolescent girls in Kenyan
primary schools to estimate the political and social impacts of education. Previous work
demonstrated that the incentives created by the merit scholarship program, called the Girls
Scholarship Program (GSP), led to substantial increases in academic test scores (Kremer, Miguel,
and Thornton 2009). In the current paper we analyze data from a follow-up survey collected four to
five years after the GSP competition, when the young women were between 17 and 21 years of age,
and estimate impacts of this exogenous increase in human capital on political and social variables.
Less developed regions have experienced massive increases in both education and democracy
over the past half century, as illustrated by our study country of Kenya (see Figure 1), and there has
been extensive popular debate on how these trends might be interrelated. A widely repeated claim is
that the recent democratic transitions in North Africa and the Middle East – the world’s least
democratic region, together with sub-Saharan Africa – have been propelled by increasingly well-
educated youth populations pushing for change, notably including young women (Saunders 2011).
Scholars have also long speculated about the social and political impacts of education, and
many leaders have based public policy on beliefs about these impacts. Early modernization theorists
argued that education weakens traditional, ascriptive attachments based on characteristics such as
gender, hereditary position, ethnicity, or religion, in favor of achievement and merit (Levy 1966).
Lipset’s (1959) classic work drew on modernization theory to argue that education promotes
democratization. Dahl (1971) similarly argues that higher levels of socioeconomic development
increase the potential for successful democracy, as a literate populace engages in the types of popular
participation necessary to maintain representative government, and Huntington (1991) argues that
education was a key contributor to the “Third Wave of Democratization” in the 1970s and 1980s.
The modernization view has been widely influential, from post-colonial leaders seeking to use
education as a tool for nation building, to newspaper columnists arguing that education can weaken

2
support for violent extremism (Kristof, 2010), to the contemporary scholars studying the relationship
between education and democracy (see Barro and Lee 2001, Boix and Stokes 2003, Boix 2009,
Acemoglu et al. 2005, Acemoglu et al. 2008, Papaioannou and Siourounis 2005, Epstein et al. 2006).
Another view argues that education can serve as a tool of cultural indoctrination and social
control, instilling obedience to authority and reinforcing existing political authorities. Gramsci (1971)
and other social theorists (including Freire 1972 and Fanon 2005) advance related arguments on
education’s central role in bolstering the cultural hegemony of ruling elites, while simultaneously
emphasizing that alternative forms of “popular” education could be instruments for social change
favoring the “liberation” of the oppressed. In a related contribution in economics, Bowles and Gintis
(1976) argue that modern American education reinforces the existing social class structure by
training the masses to obey authority within the hierarchical structure of the modern corporation.
Lott (1999), Pritchett (2003), and Kremer and Sarychev (2008) argue that governments deliberately
design public education systems to legitimize current political authorities and institutions.
A third school of thought views education as politically and socially empowering. In
observational studies, for instance, education is correlated with greater individual political knowledge
(Almond and Verba 1963, Verba and Nie 1972, Hanushek 2002, Mattes and Bratton 2007); with
interest in obtaining political information (Dee 2004); with greater dissatisfaction with existing
institutions, and with more support for women’s rights (Weakliem 2002).1 While strong correlations
have also been documented between education and political interest, participation and voting among
individuals in wealthy countries (Verba and Nie 1972, Wolfinger and Rosenstone 1980, Inglehart et
al 1998, Weakliem 2002, Dee 2004, Milligan et al 2004, Glaeser et al 2007, Oreopoulos and
Salvanes 2011), the evidence in less developed countries is more mixed. Logan and Bratton (2006),
find a positive correlation between education and political participation using AfroBarometer
1 An exception is Galston (2001), who notes that large historical increases in U.S. education have not been followed
by higher voter turnout or measured political knowledge. Refer to Lochner (2011) and Oreopoulos and Salvanes
(2011) for surveys of the literature linking education to political interest, information, and participation.

3
individual-level survey data from fifteen African countries. However, education is not always
associated with greater political participation. Blaydes (2006) finds a negative association between
voting and education in Egypt, and argues that this relationship holds because the poor are more
sensitive to vote-buying. This is consistent with other work that finds that vote-buying is more
prevalent among the poor and less educated (Brusco et al. 2004; Finan and Shechter 2010; Stokes
2005). Education is often seen as empowering women in particular. Basu and King (2001)’s study in
Bangladesh finds that educated women are three times more likely to participate in political meetings
and are also more likely to speak up during the proceedings.
Political empowerment and mobilization need not always be benign, of course. Davies’
(1974) “J-curve theory” posits that rapid expansions in opportunities build up expectations, which, if
unmet, can lead to frustration and in some cases, political violence. This theory was used to explain
the relatively high education levels among participants in U.S. urban social unrest during the 1960s
and 1970s (Miller et al 1977, Mason and Murtagh 1985). Similarly, Krueger and Maleckova (2003)
find that having more education predicts greater participation in Hezbollah activities in Lebanon, and
Berrebi (2003) finds that more educated Palestinians are more likely to become suicide bombers.
Education policies have often been motivated by views on the political impacts of education.2
Post-independence authorities in Africa expanded education with the stated goal of promoting
national identity and integration (Nyerere 1973), as it had earlier been used in European nation-
building (Weber 1976). Recently, the view that greater access to education for girls will lead to
egalitarian changes in gender power relations within the household and in society as a whole has
been an important factor in the United Nations’ adoption of the third Millennium Development Goal,
which explicitly states that greater schooling opportunities are key to speeding the rise of women into
political power and increasing women’s empowerment (see Herz and Sperling 2004; Levine et al.,
2 Several U.S. states historically restricted the education of slaves for fear that it would encourage revolt (Woodson
1915), and Belgian colonial authorities in Africa enacted similarly restrictive education policies (Hochschild 1999).

4
2008, Lloyd 2009).3 Girls’ scholarship programs in particular have been used in many countries to
move towards this Millennium Development Goal. Ministry of Education officials in Bangladesh cite
women’s empowerment as a main objective of their large-scale girls’ scholarship program (Reynor
and Wesson, 2006; Khandker et al, 2003; Fuwa, 2006). Similarly large-scale programs have been
adopted in Egypt (Save the Children 2005, Iqbal and Riad 2004), Cambodia and Pakistan (Filmer and
Schady, 2008; Chaudhury and Parajuli, 2006), and West Bengal in India (India edunews.net, 2010).
While strong claims have been made about the social and political impacts of girls’ education
based on both cross-country data and observational data comparing individuals within countries, it
has been difficult to establish causality. The main limitation of most existing micro-studies is the fact
that they document cross-sectional correlations rather than pinpointing causal impacts. This is a
major concern given the fact that a large number of personal, family and community characteristics,
many of them unmeasured by the researcher, are likely to be correlated with individual educational
attainment.4 In this study, we exploit a prospective randomized experimental design to address this
central methodological concern.
This paper takes advantage of the experimental Girls Scholarship Program in a sample of 69
Kenyan primary schools, which we find persistently boosted academic test scores and increased
secondary school enrollment among girls in treatment schools.5 We also find that exposure to the
program reduces the likelihood that parents are involved in choosing their daughter’s spouse, as well
as the young women’s expressed acceptance of the legitimacy of domestic violence. These findings
are broadly consistent with both modernization theory and the “empowerment” view but are harder
to reconcile with the claim that education tends to reinforce existing patterns of authority.
3 Refer to the official United Nations Millennium Development Goals website, http://www.un.org/millenniumgoals/.
4 Some exceptions include Milligan et al (2004) and Dee (2004). Milligan et al (2004) exploit exogenous variation
in educational attainment generated by compulsory schooling laws in both the United States and the United
Kingdom, finding strong impacts on both political knowledge and voting in the U.S. with weaker effects in the U.K.
Dee (2004) uses the availability of junior and community colleges, and teen exposure to child labor laws, as natural
experiments, also finds that education is associated with higher voting rates in the U.S. 5 Jakiela et al (2010) exploit the random assignment of the GSP program to estimate the impact of education on
respect for earned property rights using lab experiment data.

5
The evidence on attitudes beyond the household is not consistent with a modernization
perspective but is more readily reconciled with the empowerment view of education. In particular,
there is no evidence that the human capital created by the Girls Scholarship Program leads to more
pro-democratic or secular attitudes, or weakened ethnic identification. In fact, there is some
suggestive evidence that ethnic identity even grows stronger among program beneficiaries, somewhat
ironically given the Kenyan school curriculum’s stated aim of promoting feelings of national unity.
Consistent with the empowerment view, GSP participants are more likely to read newspapers
and are better able to identify a favorite newspaper. They possess more objective knowledge about
politics and express less satisfaction with Kenya’s democracy and current economic conditions.
However, these impacts do not translate into greater perceived political efficacy or civic participation
as measured by voting intentions or participation in community groups. Instead, the young women
express greater willingness to accept the legitimacy of the use of violence in politics. The increased
acceptance of political violence may not be surprising given the limited scope for our study
participants to affect change in Kenya’s fledgling democracy; their greater dissatisfaction with, but
no greater participation in (or belief in), democracy; and the finding that ethnic identification does
not diminish with greater education (and might even grow stronger), and it also resonates with the
fact that violence has often been a feature of political change in Kenya, from the Mau May uprising
against the British in the 1950s to the contested 2007 presidential election.
Going back to the three theoretical perspectives outlined above, our findings appear equally
inconsistent with the view that education promotes a constellation of “modern” attitudes, and with
the claim that education instills acceptance of existing authority structures. Rather the results suggest
that education promotes a desire for personal autonomy in the highly marginalized population of
young rural Kenyan women that we study, but that this desire is not necessarily expressed through
democratic channels alone. In the realm of household power relations, there is evidence that
education not only changed views of the legitimacy of patriarchal authority but also altered the

6
process of marriage. In the political realm we see evidence of greater knowledge and raised
expectations, but no evidence of actual empowerment (as measured by political involvement), and
perhaps as a result, we document greater frustration and acceptance of political violence.
To get at the channels of impact, and in particular at whether these effects are directly due to
receiving additional education through the merit-based scholarship competition, or to the prestige or
money garnered by winning a scholarship itself, we examine a subset of girls who had very low ex
ante odds of winning the scholarship, based on their baseline test scores. As discussed in Kremer,
Miguel, and Thornton (2009) these girls also experience large test score gains through the program.
The main impacts on social and political variables also hold in this subsample, supporting the view
that the effects are due to human capital gains rather than winning an award per se.
In addition, we compare non-experimental and experimental estimates of the impact of
education on the acceptance of authority and find significant differences. One interpretation is that
selection bias may account for the view that education instills greater acceptance of authority, to the
extent that those unwilling to accept authority are less academically successful and ultimately
complete less schooling.
The remainder of the paper is organized as follows: section 2 provides background on the
setting and the GSP program; section 3 summarizes the data collection and empirical methods, and
the impact of the program on human capital; section 4 reports results on household power dynamics;
Section 5 reports results on political attitudes; Section 6 examines channels of impact, Section 7
compares our experimental results with non-experimental estimates, and the final section concludes.
2. Background
2.1 The Study Setting

7
The Kenyan girls in the setting we study are socially marginalized and politically disempowered.
They are female and young in a society where older males hold authority; residents of a rural
backwater; and overwhelmingly from the relatively politically weak Luhya and Teso ethnic groups.
More broadly, women are disadvantaged in Kenyan society. Female participation in
parliament is low, at just 10% (Gathigah 2010). Spousal violence is also widespread, with 75% of
women claiming abuse in recent reports (FIDA 2008), and such self-reports are likely to be
underestimates. In the household realm, Kenyan girls are generally subject to their parents’ – and in
particular their father’s – authority until they leave the household, and then are often under their
husband’s authority. Traditionally, parents played a central role in selecting husbands for their
daughters and received bridewealth from the groom in the form of livestock. However, while this
system remains normative in some sense, in practice it has partially broken down in recent decades in
favor of a system in which young people often “elope” with partners of their own choice, and
bridewealth is either never paid or is paid later once the groom has accumulated sufficient resources.
In rural areas, unmarried women (unlike young men) are not permitted to build their own separate
house on a family compound and are thus more directly subject to parental authority. Many young
women therefore seek out marriage partners at an early age at least in part to escape parental control.
Our study site is rural Busia, an area in western Kenya with below average income levels for
the country, although education levels are fairly similar to the rural Kenya average.6 Ethnic Luhyas
comprise roughly 80% of the survey sample, with smaller numbers of Luos and Tesos also present
(Table 1). Although Luhyas are one of Kenya’s most populous ethnic groups, politicians from
Kenya’s Western Province have been largely sidelined in the competition for the top national
6 To illustrate, 62% of Busia households fall below the poverty line compared to 41% nationally. Given that Kenyan
per capita income levels are somewhat higher than the sub-Saharan African average (if South Africa is excluded),
the fact that Busia is slightly poorer than the Kenyan average arguably makes the district more representative of
rural Africa as a whole. The 2005 Kenya Integrated Household Budget Survey shows that 96% of children aged 6 to
17 in Busia had “ever attended” school compared to 93% nationally. The gross enrollment rate for Busia was
approximately 119 compared to 117 nationally, while 75% of adults were literate compared to 80% nationally.

8
political leadership posts in Kenyan politics. Kenya’s first President was Jomo Kenyatta, from the
Kikuyu ethnic group, its second (Daniel arap Moi) was from the Kalenjin group, and the third (and
current) president, Mwai Kibaki, is once again Kikuyu. There is a widespread perception in Busia
that elites drawn from each of these presidents’ ethnic groups wielded disproportionate power during
their rule, largely to the detriment of Western Kenya.
Like many African countries, Kenya became a de facto single-party state shortly after
independence in the 1960s and underwent democratic reforms in the early 1990s at the end of the
Cold War. The Kenyan African National Union (KANU) retained power from independence until
2002, when a multi-ethnic coalition led by Mwai Kibaki defeated Moi’s handpicked candidate and
Kenya experienced its first non-KANU government. When Kibaki’s government proposed a new
constitution in 2005 widely seen as preserving a strong “imperial” presidency and favoring Kikuyu
elites from the country’s Central Province (near Nairobi), Kenyan voters overwhelmingly rejected it,
including voters in our study area. Thus during the 2005-07 period when our survey data collection
was taking place, Kenya could be described as an imperfect but reasonably competitive multi-party
democracy. This is reflected in Kenya’s Freedom House score of 3 during this period (on a scale of 1
to 7, with 1 being most democratic, see Figure 1). Yet the fragility of Kenyan democracy was starkly
demonstrated in late 2007 and early 2008 by the widespread ethnic violence that followed a disputed
presidential election featuring vote rigging by the incumbent (Gibson and Long 2009).
Since independence from Britain in 1963, Kenya has experienced massive increases in
education, with adult literacy rising from just 32% in 1970 to 87% today (UNDP 1993, 2010).
Although there are huge gender disparities in other areas of Kenyan society, and girls remain
disadvantaged in education overall, girls’ enrollment has increased at a faster rate than boys’
enrollment at lower levels of the education system (as shown in Figure 1), and there is now gender
parity in enrollment in primary education in the region we study (UNDP 2009). Kenya’s increase in
education is dramatic, but many other low income countries have also seen massive increases in

9
educational attainment since independence, and girls’ enrollment is now catching up to boys’ in
many countries. To illustrate, in 1960, the average working-age person in low-income countries had
1.8 years of education, while by 2000 they had more than five (Barro and Lee 2001).
The Kenyan education system is quite authoritarian. Corporal punishment is commonplace in
practice (Human Rights Watch 1999) and challenges to teacher authority are rarely tolerated, there is
a system of student prefects which teachers use to maintain classroom control, students wear
uniforms, learning is by rote, and creativity and critical thinking in the classroom is not highly prized.
It is unlikely that Kenyan schools would be viewed as instruments of liberation in the sense of Freire
(1972) or other education theorists.
Despite the strict and authoritarian classroom setting, the Kenyan school curriculum officially
attempts to promote democratic values and the idea of a national Kenyan, as opposed to ethnic,
identity. For example, the last two chapters of “History and Government”, a first year (Form 1) of
high school text published by the Kenya Literature Bureau and approved by the Ministry of
Education7, are entitled “Citizenship” and “National Integration”. The book states that “Citizens have
the responsibility of participating in the democratic process through which our leaders are elected.”
Under “Elements of Good Citizenship” it lists nationalism, explaining that “a nationalist works for
one’s country and devotes oneself to serving the nation and the unity of his/her nation. Thus a
Kenyan nationalist is devoted to Kenya and seeks to unite fellow countrymen above interests of race,
tribe, religion or parochialism.” Education is described as a factor promoting national unity, and the
textbook notes that one of the first measures to be taken by independent Kenya was to integrate
schools: “Through a conscious mixing within the education system, children are encouraged from an
early age to think of themselves as Kenyans. The school curriculum stresses the importance of
national unity and develops a feeling of belonging to the nation in young people”. A natural question
7 We focus on the Form 1 textbook since Form 1 is the first year of secondary school and the program we examine
increased secondary school participation, as discussed below. Miguel (2004) argues that these and other nation-
building efforts have been much less concerted in Kenya than in its neighbor Tanzania.

10
is what the long-run impacts of this massive educational expansion will be on gender roles and
household authority structures, and individual political attitudes and behaviors, as well as ultimately
on the performance of Kenya’s democracy and political stability.
2.2 The Girls Scholarship Program (GSP)
In March 2001, ICS, a Dutch non-profit organization, introduced a merit scholarship competition in
34 primary schools in the western Kenya district of Busia, with 35 other schools serving as the
control group. This Girls Scholarship Program (GSP) provided an award to grade 6 girls in treatment
schools whose performance on the government’s standardized end-of-year exam placed them in the
top 15% (among all girls in the treatment schools). The award included a grant of 500 KSh (or
roughly US$6.40 at the time) paid to the girl’s school to cover school fees, and a cash grant of 1000
KSh (or US$12.80) paid to the girl’s family to pay for other school expenses, in each of the two years
following the competition, covering the last two years of primary school. Thus the total award for
winners was valued at nearly US$38 over two years, an amount comparable to the large-scale girls’
scholarship programs in other less developed countries mentioned above.8 For comparison, Kenya’s
annual per capita income was roughly US$400 in 2001. The awards were presented at assemblies
with students, parents, teachers, and local officials.9
The randomization into treatment and control schools was carried out using a computer
random number generator, after first stratifying by administrative division and participation in a
previous NGO program (that distributed flip-charts as classroom learning aids) also carried out by
ICS. All 34 schools invited to participate chose to take part in the project. GSP treatment and control
8 For example, the households received up to $21 per year in Bangladesh’s Primary Education Stipend Project
(Khandker et al., 2003), Egypt’s Education Enhancement Program provided uniforms and school supplies worth
approximately $10 annually (Iqbal and Riad, 2004), the Cambodia programs provided roughly $45 per year and the
Pakistan grants were valued at $3 dollars per month (Filmer and Schady, 2008; Chaudhary and Parajuli, 2006). 9 Although primary school fees were eliminated after the December 2002 national elections, substantial expenses
remained for uniforms, textbooks, writing, implements and other school supplies. Duflo, Dupas, Kremer and Sinei
(2006) and Evans, Kremer, and Ngatia (2010) find that these remained an important barrier to school participation.
11
schools in Busia are similar on observable baseline characteristics (Table 1, Panel A), indicating that
the randomization worked in generating similar groups; the first column in Table 1 presents the mean
(and s.d.) in the GSP control group, and the second column presents the coefficient estimate on the
GSP treatment indictor variable. The NGO did not conduct other activities at these schools during the
study period so we can attribute impacts to the GSP. There was a simultaneous evaluation in
neighboring Teso district that is also discussed in earlier work (Kremer et al 2009). However,
since there was considerable attrition in the Teso sample during the original study, and it is unclear if
the program actually increased human capital there, the follow-up surveys were only conducted in
Busia district and we thus focus on the Busia program and data in this paper.
The Kenyan school year runs on the calendar year, from January to December (as presented
in the timeline in Appendix Figure A1). The program was first publicly announced early in the 2001
school year. The competition was carried out a second time in treatment schools in 2002 among
students in grade 6 in that year (and eligibility was restricted to those girls who had been initially
enrolled in grade 5 in those same schools in 2001, to eliminate the problem of selective transfers into
treatment schools). There are thus two cohorts of girls who competed in the program, those in grade
6 in 2001 and those in grade 6 in 2002. A more detailed discussion of the design of the GSP is in
Kremer et al. (2009).
The average 2001-2002 treatment effect of GSP incentives in Busia district was nearly 0.3
standard deviations, and the 2001-2002 estimated effect among those in our smaller follow-up
sample was slightly higher at 0.39 standard deviations (Table 1, Panel B; see Kremer et al 2009); as
is standard, these and all other test scores in this paper are normalized such that the control group
distribution has a mean of zero and a standard deviation of one. These test score gains are considered
large in the education literature. Importantly, the program generated improvements in test scores in
treatment schools both for those who were most likely to benefit from the scholarship – girls at the

12
top of the test distribution – but also for girls who were lower in the initial distribution and thus
unlikely to win the award, and the hypothesis that treatment effects were the same throughout the
baseline test score distribution cannot be rejected. The explanation for the apparently large spillover
effects for low-performing girls offered in Kremer et al. (2009) is that the incentives led to a number
of improvements in teacher performance and student effort that generated positive classroom
externalities for all (including for boys, who also show moderate test gains despite being entirely
ineligible for the scholarships). This claim is supported by the substantial increases in both pupil and
teacher attendance in treatment schools (Table 1, Panel B).
3. Data Collection, Estimation Strategy, and Program Impact on Human Capital
3.1 Follow-up Data Collection (2005-2007)
To assess the persistence of these academic gains and other long-term impacts of the program, a
follow-up survey was undertaken from late 2005 through early 2007, approximately four to five
years after the GSP competitions, when sample individuals were young women between 17 and 21
years of age. This involved tracking down the two cohorts of girls from both treatment and
comparison schools. Because the original intervention was aimed at girls, and the research budget
was limited, the follow-up data collection sample was limited to females, and thus we are
unfortunately unable to estimate impacts on males. Respondents were followed by the survey team
wherever they moved in Kenya or elsewhere in East Africa (e.g., Uganda) using an approach similar
to Baird, Hamory and Miguel (2008). This resulted in an effective survey follow up rate of nearly
80% (Table 2, Panel A), quite a high rate for a mobile young adult population, and one that places
this project among the more successful longitudinal survey tracking efforts over a four to five year

13
timeframe in a less developed country (Alderman et al, 2001; Thomas et al, 2001).10 The final
analysis sample with baseline survey data, 2001 or 2002 test scores, and follow-up survey data
includes 1,385 girls, nearly equally balanced among treatment and control schools.
Once respondents were located, enumerators administered short tests on English vocabulary,
Swahili vocabulary, arithmetic, reading, and spatial reasoning (using a Raven’s matrix module). The
survey itself also included questions on schooling attainment, marriage, fertility, and migration, as
well as on social and political attitudes. To the extent possible, these latter questions were adapted
from questions in the World Values Survey and Afrobarometer Surveys, building on Logan and
Bratton (2006), Mattes and Bratton (2007), and Weakliem (2002), among others, while some new
questions were developed specifically for the Kenyan context. In the tables, we denote questions
drawn from the World Value Surveys as “WVS” and those drawn from the Afrobarometer Survey
with “AFB”. Some of these questions are indicator variables (denoted “0-1” in the tables), while
others were asked on a four- or five-point scale and these variables were rescaled so the lowest
possible answer takes on a value of zero and the highest answer a value of one (denoted “0 to 1”).
There are no statistically significant differences in follow-up survey attrition across the
treatment and control groups (Table 2, Panel A). We also do not find that survey attrition over time
is significantly related to the baseline 2000 test score, the presence of a toilet, iron roof, or mosquito
net in the pupil’s home compound, time spent on chores and schoolwork, attitudes towards school,
and number of siblings, nor are these characteristics significant predictors of survey attrition when
interacted with the treatment indicator (not shown), evidence that differential survey attrition across
the treatment and control groups does not appear to be a leading concern. As with the baseline survey
data, the follow-up subsample is balanced along observed baseline individual and household
characteristics across the treatment versus control samples (Table 1, Panel A).
10
The effective tracking rate takes into account the differential tracking rates during the “regular” tracking and the
“intensive” tracking phases. This two-phase tracking approach is commonly used in longitudinal data collection
efforts, as discussed in Baird, Hamory and Miguel (2008).

14
3.2 Estimation Strategy
We first estimate the impact of the Girls Scholarship Program on political and social attitudes
(POLIT), in a reduced form specification, by regressing POLIT on the indicator variable for GSP
treatment schools (TREAT). We also include some additional control variables (denoted X) –
including an indicator for student cohort, student age at time of the survey, the mean pre-program
(2000) school test score, educational attainment of each parent, and month of the follow-up survey –
to address any minor baseline differences between the treatment and controls schools that exist
despite the randomization. Since the randomization successfully produced treatment and control
groups balanced along most baseline characteristics, as shown above in Table 1, the inclusion of
these controls does not meaningfully alter the treatment effect estimates but does sometimes improve
statistical precision. Equation 1 presents the reduced form specification:
(1) POLITis = + TREATs + Xis + is
where individuals i are in school s. The main coefficient of interest is . Disturbance terms are
clustered by school. We employ OLS for both continuous and limited dependent variables in part to
facilitate the use of the mean effects approach (described below), but results are nearly unchanged in
probit specifications (not shown).
There are at least two possible channels through which the GSP program could have affected
political attitudes. The first is through its impact on human capital. The second is through other
impacts of winning a GSP scholarship, such as the cash transfers and public recognition received by
winners. Recall that girls in the top 15% in the treatment schools won scholarships. We find that
girls with normalized baseline test scores less than +2 standard deviations have just an 8% chance of
winning the scholarship, as compared to a 58% likelihood among girls with baseline scores above +2

15
s.d.11 These treatment school girls with low baseline scores are thus unlikely to receive the cash prize
and community recognition, but as shown in Kremer et al (2009), they nonetheless attended school
more often in response to the incentive of a potential scholarship and experience large positive test
score gains. As we discuss in section 6 below, estimating treatment effects in this subgroup sheds
light on the relative importance of the “public recognition” and “human capital” channels, suggesting
that the human capital channel is more important. We also assess the possibility that the “public
recognition” channel operates not at the level of individual students but rather at the school level.
To convey a sense of the magnitude of the human capital effects, and to allow comparison of
our experimental estimates with non-experimental estimates, we report IV estimates of the impact of
human capital on political attitudes by using the 2005-2007 follow-up survey test score measure as
the endogenous variable (i.e. the dependent variable in the first stage), denoted H. We view the test
score as an attractive summary measure of human capital. We focus on the normalized average test
score across all subjects (arithmetic, English, Swahili, reading, spatial reasoning) as our best measure
of overall skills and human capital, where the normalized variable is mean zero with a standard
deviation of one (the common approach in the education literature). The first stage equation is:
(2) His = a1 + b1TREATs + Xisc1 + e1,is .
The predicted values from this first stage specification allow us to estimate the impact of human
capital on political attitudes and behavior in an instrumental variable two-stage least squares (IV-
2SLS) specification, where the second stage is:
(3) POLITis = a2 + b2His + Xisc2 + e2,is .
For comparison with observational studies, we also provide similar estimates but running the second
stage equation (equation 3) using the actual test score rather than the predicted score, while
restricting attention to the control group to isolate non-experimental variation. For each set of
11
Approximately 2% of girls score more than 2 s.d. above the mean of the normalized distribution.

16
outcomes, we then compare the analogous OLS and IV coefficient estimates, and compute the
statistical significance of the difference between them using the method in Hausman (1978).
For various distinct categories of outcomes12, we estimate the “mean effect” of either GSP
treatment or human capital on each set of outcomes following Kling, Liebman, and Katz (2007). The
groupings of related outcome variables are denoted by Yk, k = 1, ..., K. We then standardize each
outcome by subtracting the mean and dividing by the standard deviation of the outcome variable
among the GSP control group, such that the control group mean (s.d.) is zero (one). The standardized
outcome variables are denoted Yk*. With these, we form Y* = k Yk
* / K, a single index of outcomes,
and we regress this index on TREAT (as in equation 1) or on H (equation 3). The resulting coefficient
estimate is called the mean effect size and, due to the normalization, it captures the average impact in
terms of standard deviations of the outcome variables. This normalization facilitates the comparison
of impact magnitudes across outcomes, as well as possibly across studies.
3.3 Impacts on Human Capital
Before presenting the estimated effects of education on political and social attitudes, which are the
focus of this paper, it is worth first discussing the program’s impact on human capital. The human
capital gains that occurred as girls competed for scholarships persisted, with significant test score
gains in treatment schools relative to the control group (Table 2, Panel B). In specifications
analogous to the first stage regression (equation 2), test scores improved in all five subjects in the
2005-2007 follow-up survey, with statistically significant gains in four subjects. The mean effect
across all tests is 0.196 standard deviations (s.e. 0.089), which is significant at 95% confidence.
Test score impacts are nearly unchanged among two subgroups, those with baseline
normalized test scores at less than +2 s.d. (who we noted above were individually quite unlikely to
12
We describe the exact survey questions below.

17
win the award), at 0.154 s.d. (s.e. 0.084), and among those in schools predicted to have five or fewer
GSP winners, at 0.180 s.d. (s.e. 0.083), and results are similar for other numbers of predicted GSP
winners (not shown). The predicted number of GSP winners is estimated in treatment group schools
by regressing the actual number of scholarship winners in the school on various quantiles of the
baseline test score distribution (among students in that school); the predicted number of winners is
then assigned to both treatment and control schools. Thus the schools with few predicted GSP
winners tend to be of lower academic quality. Since both of these subgroups have relatively low
chances of actually winning a GSP award, the persistent human capital gains we document are not
likely to be driven by winning the scholarship per se.
Beyond test scores, several measures of schooling attainment were also greater for treatment
school girls: they were 8.6 percentage points (s.e. 4.1) more likely to have attended at least some
secondary school, a substantial increase of nearly a third on the rate of 30% in the comparison group.
GSP treatment school girls were also 7.8 percentage points more likely to be enrolled in school at the
time of the survey, or an increase of fifteen percent relative to the control group, where 52% were
enrolled in school. Since more than half the sample is still in school, the schooling attainment data is
quite severely censored. Perhaps in part as a result, in our current data the program is estimated to
have a positive but not statistically significant impact on educational attainment.
4. Impact on Autonomy within the Household
As noted in the introduction, many argue that girls’ education, and particularly the education of
adolescent girls (Lloyd 2009), will empower young women to address broader gender inequalities.
Others, however, have argued that in most societies, women face relatively less disadvantage in
education than in other spheres, and that efforts to reduce gender imbalances would be more
productive elsewhere (World Economic Forum 2010). A modernization theory perspective would
imply that education should erode support for traditional gender roles.

18
We do not find any significant change in views regarding equal rights for women versus
traditional gender roles (Table 3). At the conceptual level, most of our young female respondents
already strongly support gender equality, with average support for traditional roles (namely, for the
statement that “Women have always been subject to traditional laws and customs and should remain
so”, as opposed to “Women should have equal rights and receive the same treatment as men do”) at
only 0.17 on a normalized zero to one scale. The point estimate suggests treatment reduces this by
about 0.01 but the effect is not close to statistically significant.
In contrast, treatment produces sharp changes in attitudes and behavior on two concrete
issues limiting female autonomy, which are likely to be personally relevant for many of our
respondents: domestic violence and arranged marriages. Again on a zero to one scale, treatment leads
to a sharp 0.067 reduction (s.e. 0.024) in respondents’ support for the claim that “Men can beat their
wives and children if they misbehave” as opposed to the statement that “No one has the right to use
physical violence against anyone else” (Table 3), a reduction of roughly one quarter on average
support of 0.25 in the control group.13
We next consider marriage patterns, and divide marriages into “arranged marriages”, where
parents played a role in spouse choice, and “elopements”, where parents did not play a role. Roughly
20% of respondents were married at the time of the follow-up survey, with roughly three quarters
being elopements in the control group, and one quarter, or 4.2%, arranged. However, this latter figure
falls by more than half, or 2.4 percentage points (s.e. 1.3) in the treatment group (Table 3), and this
effect is significant at 90% confidence. In contrast, we find no change in the likelihood of
13
It is illustrative to break down the normalized index into the underlying responses. The question on domestic
violence was asked with four possible responses, namely strongly agreeing with the first statement (which takes on a
value of 1 in the index), weakly agreeing with the first statement (which takes on a value of 2/3), weakly agreeing
with the second statement (1/3), to strongly agreeing with the second statement (a value of zero in the index). In
control schools, 18 percent strongly agreed with the first statement (that “Men can beat their wives and children if
they misbehave”), while in treatment schools this fell to 13 percent, a drop of 5 percentage points that is significant
at 90% confidence. In contrast, 71 percent of girls in treatment schools strongly agreed with the second statement
(“No one has the right to use physical violence against anyone else”), versus only 63 percent in the control schools,
an increase of 8 percentage points (significant at 99% confidence).

19
“elopement”, i.e., without family involvement in the choice of spouse, suggesting that the change in
marriages with family involvement does not reflect a broader trend in marriage rates but rather a shift
in power over marriage choice from parents to their daughters.
When we use a mean effects approach to look at a summary measure of autonomy combining
the two measures of support for traditional gender norms with the measure of arranged marriage we
find a statistically significant reduction of -0.203 standard deviations (s.e. 0.084) in this summary
measure of the lack of autonomy.
There are no significant GSP program impacts on fertility, or on knowledge of contraception,
age of marriage, or basic spouse characteristics (not shown) although statistical power was limited in
some of these cases given the limited proportion of married women in the sample.14
From a policy perspective, the results on young women’s greater control over marriage
patterns and stated opposition to domestic violence will be heartening to many proponents of girls’
education. From the point of the three leading theories described above, the findings are inconsistent
with the idea that education simply instills greater acceptance of authority, but are compatible with
both modernization theory and with the view that education can empower disadvantaged groups to
challenge existing authority.15 To distinguish between these two perspectives, we next consider the
impact of the GSP on political and social attitudes beyond autonomy within the household.
5. Impacts on Political and Social Attitudes
In subsection 5.1, we first examine several hypotheses derived from modernization theory regarding
the impact of education on ethnic attachments, secularization, and attitudes toward democracy,
14
These findings contrast to Baird et al. (2010), who find that a conditional cash transfer program in Malawi that
boosted school enrollment also reduced marriage and pregnancy, and improved subjective well-being. The larger
cash transfer amounts in Malawi, or possibly the shorter timeframe of their follow-up survey, may help explain
some of the differences between the two studies. 15
While these results are inconsistent with the simplest version of the theory that education is a tool for entrenching
existing power structures, note that they are arguably consistent with a more nuanced view, in which Kenya’s
education system is controlled not by traditional elites within villages, but rather by a state seeking to instill
“modern” values and eager to destroy lingering pre-capitalist “fetters” on labor.

20
finding little support for a direct impact of education in promoting “modern” values. Subsection 5.2
reports evidence that runs counter to the view that education simply instills acceptance of existing
authority, but is consistent with the notion that education promotes an awakening of political
consciousness that is arguably the first step to actual empowerment, specifically through changes in
media consumption, increased objective political knowledge, and increased dissatisfaction with
political authority. However, subsection 5.3 suggests that rather than translating into increased
participation in politics or community affairs or into greater social capital, these shifts generate
greater expressed willingness to accept the use of violence in politics.
5.1 Impact on “Modern” Attitudes
Impact on Ethnic and Religious Attitudes
From a theoretical perspective, the impact of schooling on feelings of ethnic and religious identity is
unclear. Modernization theory predicts education will reduce particularistic ethnic attachments and
promote secularism. Yet other scholars argue that in pre-colonial times the most important groups
were local “sub-ethnic” kinship groups, with ethnic boundaries fairly fluid16 and thus see
contemporary notions of tribal identity (among groups such as the Luhya in our sample) as
essentially modern. In this second view, education could potentially promote political mobilization
along ethnic lines, although recall from the background section that the Kenyan curriculum seeks to
promote nationalism. The standard Kenyan school curriculum also includes Christian and Islamic
religious education, and schools often sponsor religious youth groups, so education could also
potentially strengthen religious attachment.
We find no evidence that increased schooling weakened ethnic attachments, and if anything
the program may have strengthened these attachments. In general, respondents were very strongly
16
For a historical study of the fluidity of ethnic identity in 19th
century Kenya and Tanzania, see Shetler (2010).
Bates (1971) contains a discussion of the development of ethnic identity among mineworkers in Zambia.

21
attached to their own ethnic group, with only 11% of the comparison group not reporting ethnicity as
“very important” to them. Point estimates indicate that GSP treatment reduced this by 3.3 percentage
points, or approximately 30 percent, although the difference is not significant (Table 4, Panel A).
We next exploit the fact that ethnic identification is more salient closer to contested
democratic elections in sub-Saharan Africa, as shown recently by Eifert et al. (2010) using
AfroBarometer survey data, likely because ethnic appeals are widespread in the run up to elections.
We find that among the 43 respondents surveyed in early 2007 – a national election year in Kenya –
all but one stated that their ethnic affiliation was “very important” to them, far above the average
among those surveyed earlier; this “censoring” of responses at the highest level of ethnic
identification suggests that our survey instrument was insufficiently sensitive to finer distinctions in
the degree of ethnic feeling during election periods. We next estimate the GSP effect among the
subsample of respondents surveyed in 2005-2006, before the lead-up to the 2007 election, and find
treatment reduced the percentage who did not report ethnicity as “very important” by a statistically
significant 4.4 percentage points (s.e. 2.1, Table 4), a 40 percent drop. In other words, in non-election
years, the scholarship program, if anything, appears to heighten feelings of ethnic identification.
A related set of questions on ethnicity ask whether respondents trust members of their own
ethnic group (tribe) as well as members of other groups. Point estimates suggest treatment slightly
increased trust in co-ethnics and reduced trust in members of other ethnic groups, but the effects were
not statistically significant at traditional confidence levels (results not shown). We similarly find no
program impacts on migration out of the local area, which might have brought people into closer
contact with other ethnic groups thus leading to more inclusive ethnic attitudes, and which might
itself be taken as in part reflecting more inclusive attitudes (not shown).
We also find no evidence for the modernization theory hypothesis that education leads to
secularization as measured by changes in the reported importance of religion (Table 4, Panel A),
although strongly expressed religiosity is nearly universal in our survey sample, complicating

22
inference. There is considerably more variation in respondents’ participation in prayer groups, but
there, too, impacts are small and not significant.17
Impact on Democratic Attitudes
We do not find evidence that education promotes democratic attitudes. Respondents were asked
whether they agreed with a series of statements about the ideal organization of government and
society, where responses were given on a scale from 1 to 5, ranging from “strongly disagree” to
“strongly agree”, and these were then normalized to lie between zero and one, as above. To illustrate,
respondents were asked whether they agreed with the following statements: "We should choose our
leaders in this country through regular, open and honest elections”, and “Democracy is preferable to
any other kind of government”, among others.
There are no significant GSP program impacts on any of the seven measures of democratic
attitudes (Table 4, Panel B), and even combining all of these effects together in a single index, the
mean effect is small and not statistically significant, at 0.056 standard deviations (s.e. 0.088). These
results are particularly interesting in light of the positive cross-sectional correlations between
individual schooling and democratic attitudes documented in the existing literature, including several
African studies (Logan and Bratton 2006, Mattes and Bratton 2007). While some have argued that
investments in education may be an effective way to promote democracy and reduce political
extremism, our results suggest that, if there is any such causal relationship, it may not be a direct one.
Overall, we find no support for the hypothesis that education promotes “modern” attitudes
including weakening of ethnic attachments, secularization, or greater belief in democracy. These
findings on modernization partially alleviate concerns that more educated people are simply
providing the “right” survey answers due to social desirability bias. In particular, to the extent that
17
In contrast, using observational data, Glaeser and Sacerdote (2001) find that individual religious attendance in the
U.S. rises sharply with education.

23
support for democratic institutions is the politically correct response in Kenya, then we might have
expected to find a strongly positive relationship between human capital and support for democracy,
but we find no such relationship in our data.
We next examine the hypothesis that education promotes empowerment in the political
realm, consistent with the results on autonomy within the household.
5.2 Impact on Political Knowledge and Satisfaction
The first hint that the program may have affected political outcomes comes from its impact on media
consumption. Girls in GSP treatment schools report significantly less time listening to the radio –
which in Kenya has primarily music and other entertainment content – and report significantly more
days reading newspapers, which in Kenya report extensively and critically on national politics (Table
5, Panel A). Respondents were also much more likely to be able to identify a favorite newspaper,
with an increase of 9.5 percentage points (s.e. 3.7) on a base of 66.7% in the control group, and in
particular, there was a massive increase of 19.4 percentage points (s.e. 3.5) in the rate at which
respondents chose the Daily Nation, Kenya’s leading English language daily, from a base of 30.6%.
The increased affinity for the Daily Nation – which can be thought of as the New York Times of
Kenya in terms of its scope and influence – in the treatment group almost certainly in part reflects
their improved English language skills (Table 2, Panel A), but may also proxy for changing political
or ideological tastes, and will almost certainly affect the quality of political information consumed.
Indeed, the GSP program had a large positive impact on objective political knowledge.
Respondents were asked to name Kenya’s President, Vice President, Education Minister, and Health
Minister and Uganda’s President. The program increased the likelihood that the respondent knew the
names of the relevant officials for all questions except the President (where there is basically no
variation), and the impacts are statistically significant for naming the Health minister and the

24
President of Uganda (Table 5, Panel B). The mean effect across all five knowledge questions is
positive at 0.220 standard deviations and significant at 95% confidence.
Turning to measures of satisfaction with political authorities, GSP treatment group girls show
less deference to authority in the abstract and express less satisfaction with Kenya’s government,
economy, democracy, and current authorities (Table 5, Panel C). In particular, respondents were
significantly less likely to agree with the statement “We should show more respect for authority,”
and more likely to support the statement “As citizens, we should be more active in questioning the
actions of our leaders”, with a change of 0.076 in the normalized 0 to 1 index, relative to a mean in
the comparison group of 0.53. When asked whether Kenya’s quality of government and economy
were better than two years ago, treatment reduced respondents’ positive assessments by 5.4 and 6.1
percentage points, respectively, both of which are significant at 90% confidence.18 Among those in
control schools, satisfaction with Kenyan democracy was 0.74 (on a normalized index from zero to
one), and treatment decreased this by 0.048 (s.e. 0.017). Taken together, the mean effect indicates
that expressed satisfaction with authority is lower in the treatment group by 0.247 standard deviations
(significant at 99%). The sharply reduced satisfaction with political authority parallels the rejection
of male and parental authority in the household (Table 3).
There is no evidence that the program affected overall stated happiness, as captured by
agreement with the statement “taking everything together, the respondent is very happy” (Table 5,
Panel C). This suggests that the dissatisfaction with political authorities and the economy that we
document does not simply reflect a broader pattern of dissatisfaction among treatment group
individuals. Note that there is little consensus on the empirical relationship between education and
happiness in the existing literature using data from OECD countries, with studies documenting both
positive and negative correlations (see Frey and Stutzer 2002, Clark and Oswald 1996).
18
This despite the fact that Kenya’s economy and politics arguably performed relatively well in the study period
relative to historical benchmarks; annual real GDP growth was roughly 6% during in 2006 and 2007 and politics
was arguably more democratic than at any other time since the immediate post-independence period.

25
5.3 Empowered for What? Perceived Political Efficacy, Participation, and Violence
As discussed below, the increased knowledge and reduced satisfaction with authority generated by
the program does not seem to translate into greater perceived individual political efficacy or more
participation in democratic politics or community affairs. Instead, there is increased acceptance of the
use of violence in politics.
Impact on Perceived Political Efficacy
A large majority of respondents agreed with the statements that “Politics and government sometimes
seem so complicated that you can’t really understand what’s going on” and “This world is run by a
few people in power, and there is not much that someone like me can do about it”, and GSP
treatment does not lead to a significant change in responses from the low level of perceived political
efficacy found in the control group (Table 6, Panel A). Indeed, Kenyan politics at the time of follow-
up survey data collection (2005-2007) was characterized by byzantine backroom deal-making among
ethnically-based political leaders, many of whom were the sons of an earlier generation of political
leaders. While treatment made the young women in our sample less satisfied with the Kenyan
political situation (Table 5), it apparently did not lead to any illusions about their own ability to
directly change the situation.
Impact on Political and Community Participation
There is no indication that the GSP increased interest or participation in political or community
affairs. In particular, 26% of control group respondents reported being interested in public affairs,
compared to 23% among the treatment group, although this difference is not statistically significant
(Table 6, Panel A). Similarly, treatment respondents of voting age were slightly less likely to report

26
intending to vote in the next presidential election (coefficient estimate -2.6 percentage points, s.e. 4.5
percentage points), but the effect is and not significant.19
While some have argued that education can enhance civic participation (Glaeser, Laibson,
and Sacerdote 2002), we do not find evidence for this. The survey gathered information on individual
membership in ten common types of community groups (e.g., women’s groups, credit and savings
groups, etc.), with average membership in 1.41 groups in the control group. There is no effect of
treatment on community group membership (0.058, s.e., 0.105 in Table 6, Panel B). The program
also had no meaningful impact on self-expressed trust, namely in the standard question “Generally
speaking, would you say that most people can be trusted or that you need to be very careful in
dealing with people?”, which is often taken as a measure of social capital.
Attitudes Toward the Use of Violence in Politics
Although Kenya has never experienced a civil war, it has a long record of ethnic violence around
elections, going back to the first multi-party polls in 1992. As noted in the introduction, some
observers have argued that education will tend to reduce political violence (Kristof 2010), while
others see education as raising expectations and, if those expectations are not met, potentially
increasing individuals’ propensity towards violence (Davies, 1974).
We find that the GSP program led to greater expressed tolerance for political violence.
Treatment individuals are significantly more likely to think the use of violence is sometimes justified
in politics (point estimate 0.030, s.e. 0.012 in Table 6, panel C), off a base of 0.47 in the normalized
index in the control group.
19
One possible explanation for the divergence between these findings and previous studies, most of which have
found a link between education and voting behavior, is our reliance on reported voting intentions rather than self-
reported past voting behavior; this is necessary due to the relative youth of our sample and thus their ineligibility to
vote in earlier national elections. Wolfinger and Rosenstone (1980) point out that one mechanism through which
education may lead to increases in political participation is by decreasing the cost of bureaucratic hurdles that must
be overcome in order to vote. If this is indeed a significant factor, then by only considering intentions we may be
underestimating the true effect of education on future voting and political participation.

27
It seems plausible that education increases acceptance of violence because, as documented
earlier, it increases the political knowledge of respondents and makes them less satisfied with the
status quo, while apparently not simultaneously increasing their faith in their ability to achieve
change through democratic means. Since they are no more committed to democratic values as a
result of education and, if anything, more ethnically identified (the key dimension of social conflict
in Kenya), it may not be surprising that education increases support for political violence here.
From one perspective, there appears to be a tension between the estimated impacts of
education on views about the legitimacy of political violence, and the greater degree of stated
opposition to domestic violence in our sample of young women. However, both findings are
consistent with the view that education reduces the knee-jerk acceptance of existing authorities, both
at home and in the broader national political arena.
6. Understanding the Channels of Impact
One could entertain several hypotheses about the channels through which program impacts occurred.
While effects could certainly be due to a direct human capital effect, scholarship winners were also
honored in a public ceremony that could have affected their self-perception and confidence, and
winners also received a generous cash prize. To help distinguish between these effects, in this section
we test whether the subsample of girls who were very unlikely to win a scholarship also exhibited
effects similar to those documented above.
The main results are similar when we restrict attention to those individuals with baseline
2000 test scores below +2 standard deviations (Appendix Table A1), suggesting that the findings are
not being driven by scholarship winners. We focus on our main outcome measures in this table (and
for the rest of this section). The lack of autonomy mean effect result is almost identical in this
restricted subsample at -0.195 (s.e. 0.102). The satisfaction with authority mean effect is also
significantly negative at 90% confidence in the restricted sample (-0.158, s.e. 0.086), and we cannot

28
reject the hypothesis that it is equal to the full sample estimate. As in the full sample, there are no
statistically significant impacts on “modern” ethnic, religious or democratic attitudes, or on
individual’s perceived political efficacy or the participation in political affairs mean effect. The
estimate program impact on measures of newspaper reading, political knowledge, and attitudes
towards political violence remain positive but are somewhat smaller in magnitude and not
statistically significant in the restricted subsample. When we examine coefficient estimates across
the two samples (namely, the complete sample of those with baseline test scores, versus those with
baseline test scores less than +2 s.d.), in no case is the difference statistically significant at even 90%
confidence, and the differences between the two samples appear relatively minor.
While these results indicate that program impacts are mostly driven by human capital rather
than by winning a scholarship prize per se, note that it is impossible to fully decompose the human
capital effect itself into separate impacts driven by higher primary school attendance (Table 1),
greater secondary school enrollment, and more knowledge and skills as measured in test scores
(Table 2), since we lack separate instrumental variables for these various channels.
We also cannot completely rule out the hypothesis that the impacts are due in part to school-
wide changes in individual attitudes and self-perceptions associated with the mere presence of a
scholarship program, since the experience of observing other girls being publicly recognized for their
academic achievement could have changed attitudes, for example. However, it seems unlikely that
that the experience of having a program in one’s school, from which one did not personally benefit
through a scholarship, will have a major effect on attitudes four years later, certainly compared to
the direct impact of the additional human capital which students received. While one could perhaps
tell a story where having a program that provided scholarships to girls led to more progressive gender
attitudes (and thus could account for some of the autonomy findings in Table 3), it is harder to
imagine why this would generate some of our other findings in terms of expressed satisfaction with
political authority, newspaper reading, objective political knowledge, or violence in politics.

29
Moreover, it seems reasonable to conjecture that any school-wide effects of the program on
gender attitudes would depend on the number of girls who were publicly recognized for their
academic achievement. Because the scholarships were awarded to girls scoring in the top 15% in the
district and there is considerable school-to-school variation in test scores, 16 of the 34 treatment
schools had no winners in 2001, 14 had no winners in 2002, and 11 schools had no winners in either
year. As above, we create a measure of predicted GSP winners in both treatment and control
schools.20 We find few statistically significant differences in the magnitude of program impacts on
our main political and social attitude measures between schools predicted to have different numbers
of GSP winners (Appendix Table A2). In particular, the interaction terms between treatment and the
predicted number of winners are statistically significant for just two of our ten main outcome
variables (namely, the variables capturing the strength of ethnic identification and tolerance of
political violence, neither of which one would naturally think of as resulting from holding a public
awards ceremony for high-performing girls), while for the other eight variables, the t-statistic on the
interaction term is less than one. These generally small and not statistically significant interaction
estimates provide further evidence against the view that non-human capital channels are driving our
results, although limited statistical power on some of the interaction terms in this table means that we
admittedly cannot completely rule out this channel.
7. Experimental versus Non-Experimental Estimates and the Hypothesis that Education Instills
Greater Acceptance of Authority
In order to compare the experimental estimates in this paper to non-experimental estimates, we first
estimate experimental IV-2SLS estimates of the impact of human capital on our ten main outcome
measures (Table 7). We reproduce the reduced form GSP program impact estimates (from Tables 3
20
The predicted number of GSP winners is estimated in treatment group schools by regressing the actual number of
scholarship winners in the school on various quantiles of the baseline test score distribution for students in that
school; the predicted number of winners is then assigned to both treatment and control schools.

30
through 6) in column 1, then present experimental IV-2SLS estimates in column 2 and non-
experimental OLS estimates (for the control group alone) in column 3. The final column presents the
p-value on the Hausman test of equality of the IV-2SLS and OLS estimates (in columns 2 versus 3).
In terms of the lack of autonomy mean effect, the interpretation of the IV coefficient estimate
is that a one standard deviation increase in the normalized test score (from the 2005-2007 follow-up
survey) is associated with an decrease of 0.942 standard deviations (s.e. 0.516), a large effect
magnitude. To put this in context, a one standard deviation test score increase in this population is
more than the gain observed (in the cross-section) by advancing by one grade in primary school. This
contrasts with a decrease of just 0.321 in the non-experimental OLS estimate, and we reject equality
of the experimental and non-experimental estimates at 95% confidence (p-value=0.018).
There are no statistically significant differences in the IV versus OLS estimates on ethnic,
religious or democratic attitudes (with p-values of 0.107, 0.441, and 0.823, respectively), although it
is worth noting that the OLS relationship between human capital and democratic attitudes is
statistically significant at 99% confidence, consistent with many other observational studies
discussed in the introduction. The measures of newspaper reading and political knowledge are
positive and statistically significant in both the IV and OLS specifications although the IV estimates
are larger in magnitude, and the difference between IV and OLS is significant at 90% confidence for
the political knowledge mean effect (p-value 0.070).
The most striking difference between the IV and OLS estimates occurs for the satisfaction
with authority mean effect, where the IV estimate is very large and negative (-1.106, s.e. 0.460) and
significant at 95% confidence, while the OLS estimate is just -0.164, and the difference between the
two is significant at 99% confidence (p-value<0.001). This divergence mirrors the findings above for
the lack of autonomy mean effect. Both of these measures capture opposition to existing authorities,
one within the home and the other more broadly in the political arena.

31
One hypothesis that might explain the pattern of differences between the IV and OLS
estimates for both measures is that an individual’s ability to progress in school (and perhaps also to
do well in school) is closely tied to their willingness to accept authority, leading to omitted variable
bias towards zero in the OLS estimates. This seems particularly relevant in an authoritarian schooling
system like Kenya’s. Along the same lines, there is a statistically significant difference in IV and
OLS estimates of the impact of human capital on willingness to support political violence (p-
value=0.017), where once again the OLS estimates appear biased towards zero.
The perceived political efficacy mean effect and the participation in politics mean effect are
near zero and not statistically significant for either the IV or OLS specifications, and there are no
significant differences between them (with p-values of 0.332 and 0.539, respectively).
Taken together, we reject the hypothesis that the IV and OLS estimates are equal for four of
the ten dependent variables in Table 7 (at 90% confidence, with a fifth p-value equal to 0.107), far
more often than would be generated by chance alone under the null hypotheses that both were
measuring the same underlying parameters.
These large and statistically significant differences between the non-experimental and
experimental estimates suggest there is considerable value added in this paper’s experimental
research design for the literature on the impacts of education, and indicate that it is important to
carefully distinguish treatment versus selection effects in assessing the view that education instills
greater acceptance of authority.
8. Discussion and Conclusion
We examine the impact of an increase in human capital, driven by a merit scholarship program, on
political and social attitudes among a sample of young Kenyan women. Our experimental results
contribute to a large and mostly non-experimental literature on the relationship between education
and political and social attitudes, a relationship that is of particular interest in less developed societies

32
like Kenya that have experienced rapid educational gains in recent decades. The program leads
young women to reject the legitimacy of domestic violence and reduces their propensity to enter into
marriages arranged by their parents. Going against claims in modernization theory, the program does
not weaken ethnic attachment, promote secularization, or increase stated support for democracy.
Contrary to theories suggesting that education merely instills acceptance of existing
authority, but consistent with the view that education can empower, program participation leads to
greater objective political knowledge, perhaps in part due to its positive impact on newspaper
readership. Participants are less willing to defer to authority and express less satisfaction with
Kenya’s political and economic situation. However, we do not find evidence that the increase in
education created by the program led to either greater perceived political efficacy or higher rates of
voting or other forms of civic participation. This combination of heightened political awareness and
reduced acceptance of the legitimacy of existing political structures, together with no increase in the
perceived ability to effect change through Kenya’ nascent democratic institutions, may help explain
why the increase in education was also associated with greater acceptance of the legitimacy of
political violence. These findings are particularly striking in a context where education apparently
aims to instill acceptance of authority rather than individual autonomy or independent thinking.
One possible interpretation of these patterns is that education allowed young Kenyans to hold
more realistic views about their political system. Less than one year after our surveys were collected,
Kenya held a national presidential election in which independent observers argued that the main
opposition candidate (Raila Odinga) – who was supported by the vast majority of voters in our study
area in western Kenya – won more votes but the incumbent claimed victory after widespread vote
rigging (Gibson and Long 2009). It was only after months of violent protests over the election results
and bloody ethnic clashes that the incumbent settled on a power-sharing deal that gave Odinga some
modicum of power. As individuals in our study sample received more education, their declining

33
satisfaction with the status quo and growing acceptance of political violence may arguably reflect
their growing awareness on the nature of political power and change in Kenya.
We estimate similar program impacts among individuals who had little chance of winning the
scholarship (based on their baseline test score) and among those in schools with few program
winners, strongly suggesting that the effects are driven mainly by the human capital gains generated
by the program rather than the cash award or the prestige of winning the award, or some other change
caused by taking part in a scholarship competition. Regardless of the precise interpretation of the
channels of impact, these results also shed light on the impacts of a girls’ scholarship program that is
similar to many large-scale programs that have been introduced in other less developed countries.
Experimental estimates and non-experimental estimates of the impact of education on
acceptance of authority differ considerably, suggesting that observational studies of the cross-
sectional correlation are biased. To make sense of the differences between the experimental and non-
experimental estimates, we hypothesize that one’s ability to stay in school (and succeed
academically) is closely related to her willingness to accept authority, plausibly leading to omitted
variable bias in some non-experimental estimates that could potentially lead observers to conclude
that education instills acceptance of authority when in fact it promotes greater autonomy. Somewhat
ironically, it appears that only those individuals who are sufficiently willing to accept authority when
young (in order to succeed in the education system) actually have the opportunity to experience the
gains in autonomy that education often generates later on in life.
These causal effects of education on individual beliefs and behaviors associated with
democracy are, we believe, a meaningful step towards understanding the positive cross-country
empirical association between education and democracy. While interpretation of that relationship
remains controversial, our results suggest that if education does lead societies to be more democratic,
it is not necessarily through growing pro-democratic attitudes. Rather the presence of an educated,
well-informed and critical citizenry could lead democracies to function more successfully. Recent

34
research argues that, regardless of individuals’ support for democracy per se, a necessary foundation
for a successful democratic system is the existence of politically knowledgeable and engaged citizens
willing to actively participate in political life and challenge political authorities (Moehler 2008;
Glaeser et al. 2007). Alternatively, the higher levels of political dissatisfaction and tolerance of
political violence generated by rising education that we document in this paper could asymmetrically
hasten the replacement of existing non-democratic regimes.
As with all micro-studies conducted in a given context – here, among young females in one
Kenyan region – caution is requiring in generalizing the results to other populations, most notably for
males and older adults, for whom we lack data. The effects of education may change as individuals
age. To what extent should we expect our results to generalize? It is obviously impossible to know
for certain without further work, but a natural conjecture is that the education of disadvantaged social
groups – such as the young rural Luhya women in our sample – will induce greater awareness of
politics, increase the desire for autonomy, and reduce tendencies to simply accept their powerlessness
as a natural, immutable fact about the world. In the Kenyan context we examine, there is some
indication that this translates into increased ethnic attachment, and evidence that it leads to greater
acceptance of the use of violence in politics. Yet it is plausible that in other contexts where there is
greater scope for meaningful engagement in democratic politics, the heightened political
consciousness and reduced acceptance of authority might lead not to greater violence in politics but
rather to greater civic involvement, potentially contributing to a more vibrant democracy.

35
References
Acemoglu, Daron, Simon Johnson, James A Robinson, and Pierre Yared (2005), “From Education to
Democracy?” American Economic Review. Vol 95 (2,May), pages 44-49.
Acemoglu, Daron, Simon Johnson, James A Robinson, and Pierre Yared (2008), “Income and
Democracy” American Economic Review. Vol. 98(3), pages 808-42, June.
Alderman, Harold, Jere Behrman, Hans-Peter Kohler, John A. Maluccio and Susan Watkins (2001).
"Attrition in Longitudinal Household Survey Data." Demographic Research, Max Planck
Institute for Demographic Research, 5(4), 79-124.
Almond, Gabriel and Sidney Verba (1963), The Civic Culture: Political Attitudes and Democracy in
Five Nations, Sage Publications, London.
Baird, Sarah, Ephraim Chirwa, Jacobus de Hoop and Berk Ozler. (2010). “Girl Power: Cash
Transfers and Female Empowerment”, unpublished working paper.
Barro, Robert (1999), “Determinants of Democracy,” Journal of Political Economy 107(6): S158-83.
Barro, Robert and JW Lee (2001), “International Data on Educational Attainment: Updates and
Implications,” Oxford Economic Papers 53.
Basu, Ananya, and Elizabeth M. King. 2001. "Does Education Promote Growth and Democracy?
Some Evidence from East Asia and Latin America." Washington, D.C.: World Bank.
Bates, Robert. (1971) Unions, Parties, and Political Development: A Study of Mineworkers in
Zambia. New Haven: Yale University Press.
Berrebi, Claude (2003), “Evidence About the Link Between Education, Poverty, and Terrorism
among Palestinians,” Mimeo Princeton University.
Blaydes, Lisa (2006), “Who Votes in Authoritarian Elections and Why? Determinants of Voting in
Contemporary Egypt,” unpublished.
Boix, Carles (2009) "Development and Democratization", unpublished working paper.
Boix, Carles, and Susan Stokes (2003), “Endogenous Democratization,” World Politics 55.
Bowles, Samuel and Herbert Gintis. (1976). Schooling in Capitalist America: Educational Reform
and the Contradictions of Economic Life. Basic Books: New York.
Brusco, Valerino, Marcelo Nazereno, and Susan Carol Stokes (2004). “Vote Buying in Argentina,”
Latin American Research Review, 39(2).
Chaudhury, Nazmul and Parajuli, Dilip, (2006). “Conditional Cash Transfers and Female Schooling:
The Impact of the Female School Stipend Program on Public School Enrollments in Punjab,
Pakistan”. Impact Evaluation Series No. 9, Washington, DC: World Bank.
Clark, A.E., and A. J. Oswald. (1996). “Satisfaction and Comparison Income”, Journal of Public
Economics, 61.
Cooksey, Brian, David Court, and Ben Makau. (1994). “Education for Self-reliance and Harambee”,
in Beyond Capitalism versus Socialism in Kenya vs. Tanzania, ed. Joel D. Barkan, Lynne
Rienner.
Davies, James (1974), "The J-Curve and Power Struggle Theories of Collective Violence," American
Sociological Review, 39(4).
Dee, Thomas (2004), “Are there Civic Returns to Education?” Journal of Public Economics 88.
Duflo, Esther, Pascaline Dupas, Michael Kremer, Samuel Sinei (2006) “Education and HIV/AIDS
Prevention: Evidence from a Randomized Evaluation in Western Kenya”.
Eifert, Benn, Edward Miguel, Daniel Posner (2010) “Political Sources of Ethnic Identification in
Africa”, American Journal of Political Science.
Epstein, David, Robert Bates, Jack Goldstone, Ida Kirstensen, and Sharyn O’Halloran, (2006)
“Democratic Transitions” American Journal of Political Science, Vol. 50, No. 3, July 2006.
Evans, David, Michael Kremer, Muthoni Ngatia (2010) “The Impact of Distributing School
Uniforms on Children’s Education in Kenya”
Fanon, Frantz. (2005). The Wretched of the Earth. Grove Press: New York.

36
FIDA. (2008). Domestic Violence in Kenya. Federation of Women Lawyers of Kenya: Nairobi.
Filmer, Deon and Schady, Norbert. (2008). “Getting girls into school: Evidence from a scholarship
program in Cambodia.” Economic Development and Cultural Change, 56: 581-617.
Finan, Fred and Laura Schecter (2010). “Vote-buying and reciprocity,” Mimeo.
Freire, Paulo. (1972). Pedagogy of the Oppressed. Harmondsworth: Penguin.
Frey, B.S., and A. Stutzer. (2002). Happiness and Economics, Princeton University Press.
Fuwa, Nobuhiko. (2001). “The Net Impact of the Female Secondary School Stipend Program in
Bangladesh”, unpublished manuscript.
Galston, William A. (2001) “Political Knowledge, Political Engagement and Civic Education”
Annual Review of Political Science 4.
Gathigah, Miriam (2010) “Politics: Women Still a Parliamentary Minority in Kenya,” Inter Press
Service. December 21, 2010.
Gibson, Clark and James Long. (2009). “The 2007 Kenyan Election”, Electoral Studies, 28(3), 497-
502.
Glaeser, Edward L, and Bruce Sacerdote. (2001). “Education and Religion”, NBER Working Paper
#8080.
Glaeser, Edward L., David Laibson, and Bruce Sacerdote. (2002). “An Economic Approach to Social
Capital”, Economic Journal, 112(483), F437-F458.
Glaeser, Edward L., Giacomo Ponzetto, and Andrei Shleifer (2007) “Why Does Democracy Need
Education” Journal of Economic Growth.
Gramsci, Antonio. (1971). Selections from the Prison Notebooks, ed. G.N. Smith. International
Publishers Co.: New York.
Hausman, Jerry. (1978) “Specification Tests in Econometrics,” Econometrica.
Herz, Barbara, and Gene B. Sperling. (2004). What Works in Girls’ Education: Evidence and
Policies from the Developing World. Council on Foreign Relations: New York.
Hochschild, Adam. (1999). King Leopold’s Ghost: A Story of Greed, Terror and Heroism in
Colonial Africa. Mariner Books.
Human Rights Watch. (1999). Spare the Child: Corporal Punishment in Kenyan Schools. HRW:
New York.
Huntington, Samuel (1991), The Third Wave: Democratization in the Late Twentieth Century.
Norman and London: University of Oklahoma Press
India edunews.net. (2010). “West Bengal to give scholarships to girl students”.
http://www.indiaedunews.net/West_Bengal/West_Bengal_to_give_scholarships_to_girl_stud
ents_10382/. Accessed September 8, 2010.
Inglehart, Ronald, Miguel Basanez, and Alejandro Moreno. (1998). Human Values and Beliefs: A
Cross-Cultural Sourcebook: Political, Religious, Sexual, and Economic Norms in 43
Societies: Findings from the 1990-1993 World Values Survey. Ann Arbor: University of
Michigan Press.
Iqbal, F. and Riad, N. (2004), “Increasing Girls’ School Enrollment in the Arab Republic of Egypt’,
in Reducing Poverty, Sustaining Growth: What Works, What Doesn’t, and Why,
A Global Exchange for Scaling Up Success Scaling Up Poverty Reduction: A Global Learning
Process and Conference, Shanghai, May 25-27, 2004. Washington D. C.: World Bank.
Jakiela, Pamela, Edward Miguel, and Vera te Velde. (2010). “You’ve Earned It: Combining Field
and Lab Experiments to Estimate the Impact of Human Capital on Social Preferences”,
NBER Working Paper #16449.
Khandker, Shahidur; Pitt, Mark and Fuwa, Nobuhiko. (2003) “Subsidy to Promote Girls' Secondary
Education: The Female Stipend Program in Bangladesh”, unpublished manuscript.
Kling, Jeffrey, Jeffrey Liebman, and Lawrence Katz (2007), “Experimental Analysis of
Neighborhood Effects,” Econometrica.
37
Krueger, Alan, and Jitka Maleckova (2003), “Education, Poverty, and Terrorism: Is there a Causal
Connection?” Journal of Economic Perspectives 17.
Kremer, Michael, Edward Miguel, and Rebecca Thornton. (2009) “Incentives to Learn”, Review of
Economics and Statistics, 91.
Kremer Michael, Sarychev A. (2008). Why do governments operate schools? Working Paper,
London School Economics.
Levine, Ruth, Cynthia Lloyd, Margaret Greene, and Caren Grown, (2008) “Girls Count. A Global
Investment and Action Agenda”. Washington, D.C.: Center for Global Development
Levy, M. (1966). Modernization and the Structure of Society. Princeton University Press.
Lloyd, Cynthia. (2009). New Lessons: The Power of Educating Adolescent Girls. Population
Council: New York.
Lipset, Seymour Martin, (1959) “Some Social Requisites of Democracy: Economic Development
and Political Legitimacy,” American Political Science Review 53.
Lochner, Lance. (2011). “Non-production benefits of education: Crime, health, and good
citizenship”, NBER Working Paper #16722.
Logan, Carolyn and Michael Bratton (2006), “The Political Gender Gap in Africa: Similar Attitudes,
Different Behaviors,” Afrobarometer Working Paper No. 58.
Lott, Jr., John. (1999) “Public Schooling, Indoctrination and Totalitarianism,” Journal of Political
Economy, 107(6), 127-157.
Mason, T. David and Jerry Murtagh (1985), “Who Riots? An Empirical Examination of the New
Urban Black Versus the Social Marginality Hypothesis,” Political Behavior.
Mattes, Robert and Michael Bratton (2007), “Learning about Democracy in Africa: Awareness,
Performance, and Experience,” American Journal of Political Science, 51(1).
Miguel, Edward. (2004). “Tribe or Nation? Nation-building and Public Goods in Kenya versus
Tanzania”, World Politics, 56(3), 327-362.
Miller, Abraham, Louis Bolce, and Mark Halligan (1977), "The J-Curve Theory and Black Urban
Riots - An Empirical Test of Progressive Relative Deprivation Theory," American Political
Science Review, 71(3).
Milligan, Kevin, Enrico Moretti, and Philip Oreopoulous (2004), “Does Education Improve
Citizenship? Evidence from the US and the UK,” Journal of Public Economics 88.
Moehler, Devra. (2007) “Participation in Transition: Mobilizing Ugandans in Constitution Making.”
Studies in Comparative International Development, 42(2): 164-90.
Moehler, Devra. (2008) Distrusting Democrats: Outcomes of Participatory Constitution Making.
University of Michigan Press.
Nyerere, Julius. (1973). Freedom and Development, Government Printer, Dar-es-Salaam.
Oreopoulos, Philip and Kjell G. Salvanes. (2011). "Priceless: The Nonpecuniary Benefits of
Schooling", Journal of Economic Perspectives, 25(1), 159-184.
Papaioannou, Elias, and Gregorios Siourounis, (2008) “Economic and Social Factors Driving the
Third Wave of Democratization,” Comparative Economics.
Pritchett, Lant. (2003). "When Will They Ever Learn?: Why All Governments Produce Schooling.”
BREAD Working Paper #53.
Przeworski, Adam, and Fernando Limongi (1993), "Political Regimes and Economic
Growth"Journal of Economic Perspectives 7: 51-70.
Przeworski, Adam and Fernando Limongi (1997) “Modernization: Theories and Facts” World
Politics, Vol. 49, No. 2.
Rynor, Janet and Kate Wesson, (2006). "The Girl's Stipend Program in Bangladesh". Journal of
Education in International Development. Vol. 2, No. 2.
Saunders, Doug. (2011). “A self-taught democracy emerges from Tunisia’s classrooms”, The Globe
and Mail, February 28, 2011.

38
Save the Children. (2005). State of the World's Mothers Report: The Power and Promise of Girls'
Education.
Shetler, Jan Bender. (2010). "Historical memory as a foundation for peace: Network formation and
ethnic identity in North Mara, Tanzania", Journal of Peace Research, 47(5), 639-650.
Stokes, Susan Carol (2005). “Perverse Accountability: A Formal Model of Machine Politics with
Evidence from Argentina,” American Political Science Review, 99(3).
Thomas, Duncan, Elizabeth Frankenberg and James P. Smith (2001). "Lost But Not Forgotten:
Attrition and Followup in the Indonesia Family Life Survey." Journal of Human Resources
36(3), 556-592.
United Nations Development Program. (1993). Human Development Report 1993. New York.
United Nations Development Program. (2009). Human Development Report 2009. New York.
United Nations Development Program. (2010). Human Development Report 2010. New York.
United Nations Educational, Cultural, and Scientific Organization (UNESCO). 2000. Women and
Girls: Education, Not Discrimination. Paris: UNESCO.
Verba, S., Nie, N.H., 1972. Participation in America: Political Democracy and Social Equality.
Harper and Row, New York.
Weakliem, David (2002) “The Effects of Education on Political Opinions: An International Study,”
International Journal of Public Opinion Research 13.
Weber, Eugen. (1976). Peasants into Frenchmen: The Modernization of Rural France, 1870-1914.
Stanford University Press.
Wolfinger, R.E., Rosenstone, S.J., 1980. Who Votes? Yale Univ. Press, New Haven
Woodson, C.G. (1915). The Education of the Negro Prior to 1861: A History of the Education of the
Colored People of the United States from the Beginning of Slavery to the Civil War. New
York: G.P. Putnam's Sons.
World Bank. (2010). www.worldbank.org/education/girls. Accessed September 8, 2010.
World Economic Forum. (2010). The Arab World Competitiveness Review 2010. WEF: Geneva.

39
Figure 1: Schooling and democracy trends in Kenya
Panel A: Proportion of population completing primary schooling in Kenya,
by birth cohort and gender (1902-1980 birth cohorts, source: 1999 Kenya Census)
Panel B: Freedom House Political Rights Index in Kenya and sub-Saharan Africa (1973-2008),
where “1” denotes full democracy
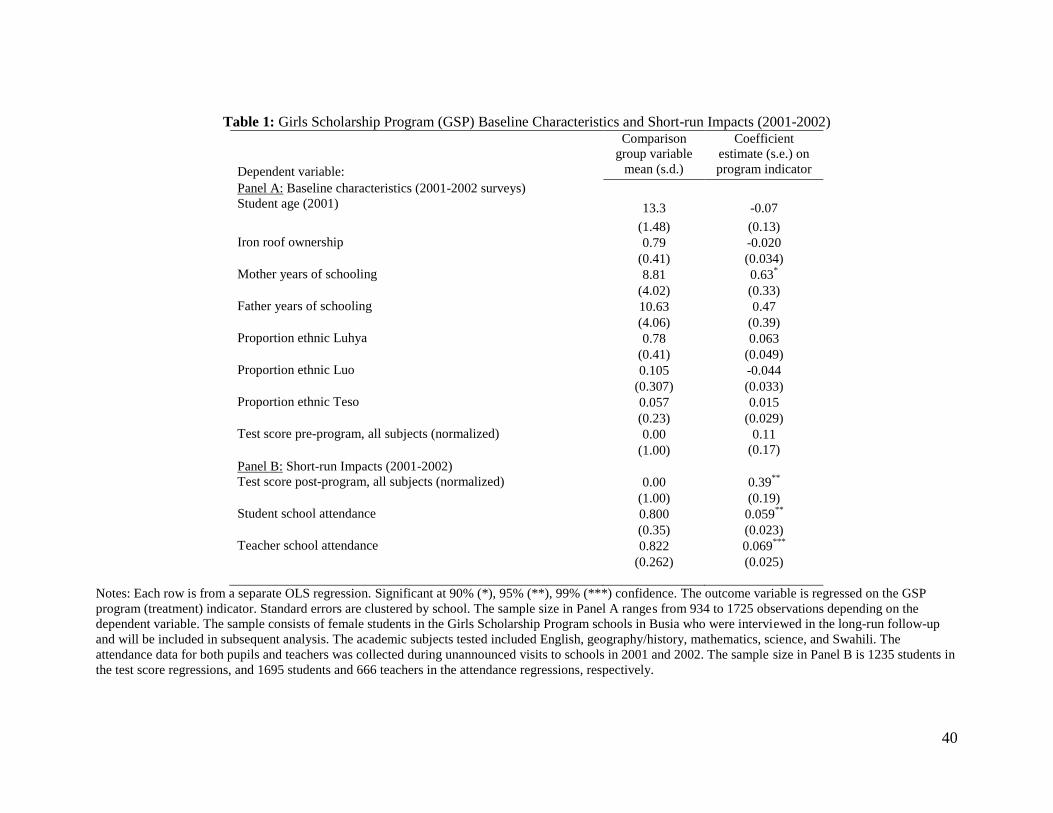
40
Table 1: Girls Scholarship Program (GSP) Baseline Characteristics and Short-run Impacts (2001-2002)
Dependent variable:
Comparison
group variable
mean (s.d.)
Coefficient
estimate (s.e.) on
program indicator
Panel A: Baseline characteristics (2001-2002 surveys)
Student age (2001) 13.3 -0.07
(1.48) (0.13)
Iron roof ownership 0.79 -0.020
(0.41) (0.034)
Mother years of schooling 8.81 0.63*
(4.02) (0.33)
Father years of schooling 10.63 0.47
(4.06) (0.39)
Proportion ethnic Luhya 0.78 0.063
(0.41) (0.049)
Proportion ethnic Luo 0.105 -0.044
(0.307) (0.033)
Proportion ethnic Teso 0.057 0.015
(0.23) (0.029)
Test score pre-program, all subjects (normalized) 0.00 0.11
(1.00) (0.17)
Panel B: Short-run Impacts (2001-2002)
Test score post-program, all subjects (normalized) 0.00 0.39**
(1.00) (0.19)
Student school attendance 0.800 0.059**
(0.35) (0.023)
Teacher school attendance 0.822 0.069***
(0.262) (0.025)
Notes: Each row is from a separate OLS regression. Significant at 90% (*), 95% (**), 99% (***) confidence. The outcome variable is regressed on the GSP
program (treatment) indicator. Standard errors are clustered by school. The sample size in Panel A ranges from 934 to 1725 observations depending on the
dependent variable. The sample consists of female students in the Girls Scholarship Program schools in Busia who were interviewed in the long-run follow-up
and will be included in subsequent analysis. The academic subjects tested included English, geography/history, mathematics, science, and Swahili. The
attendance data for both pupils and teachers was collected during unannounced visits to schools in 2001 and 2002. The sample size in Panel B is 1235 students in
the test score regressions, and 1695 students and 666 teachers in the attendance regressions, respectively.

41
Table 2: Educational Outcomes in Follow-up survey (2005-2007)
Dependent variable:
Comparison
group variable
mean (s.d.)
Coefficient
estimate (s.e.) on
program indicator
Panel A: Sample attrition
Surveyed in follow-up round (2005-2007) 0.794 -0.001
(0.404) (0.034)
Panel B: Test Scores
Arithmetic test (normalized) 0.00 0.136
(1.00) (0.104)
English vocabulary test (normalized) 0.00 0.166*
(1.00) (0.093)
Raven’s matrix test (normalized) 0.00 0.183**
(1.00) (0.077)
Reading test (normalized) 0.00 0.127*
(1.00) (0.072)
Swahili vocabulary test (normalized) 0.00 0.222**
(1.00) (0.089)
Test score mean effect 0.00 0.196**
(1.00) (0.089)
Test score mean effect, among those with baseline scores < +2 s.d. 0.06 0.154*
(0.97) (0.084)
Test score mean effect, among schools with 5 predicted GSP winners -0.06 0.180**
(1.01) (0.083)
Panel C: Schooling outcomes
Attended at least some secondary school (0-1) 0.30 0.086**
(0.46) (0.041)
Still in school, at time of survey (0-1) 0.52 0.078*
(0.50) (0.044)
Grades of school completed 7.8 0.086
(1.2) (0.103)
Notes: Each row is from a separate OLS regression. Significant at 90% (*), 95% (**), 99% (***) confidence. In Panels B-C the outcome variable is regressed on
the GSP program (treatment) indicator, an indicator for student cohort, student age at time of the survey, the mean pre-program (2000) school test score,
educational attainment of each parent, and timing of the follow-up survey (coefficient estimates not shown). There are no additional regression controls in Panel
A. Standard errors are clustered by school. The sample size is 1,385 observations in Panels B-C. Details on the mean effect analysis are in the text. The test score
mean effect in Panel B includes the arithmetic, English, Raven’s matrix, reading, and Swahili test results.

42
Table 3: Household Outcomes in Follow-up survey (2005-2007)
Dependent variable:
Comparison
group variable
mean (s.d.)
Coefficient
estimate (s.e.) on
program indicator
“Women have always been subject to traditional laws and customs and should remain so.” (0 to 1)
(vs. “Women should have equal rights and receive the same treatment as men do.”) [AFB]
0.17
(0.31)
-0.009
(0.022)
“Men can beat their wives and children if they misbehave.” (0 to 1)
(vs. “No one has the right to use physical violence against anyone else.”) [AFB]
0.25
(0.38)
-0.067***
(0.024)
Ever married (0-1) 0.21 -0.018
(0.40) (0.034)
Ever married, with family involvement in spouse choice (0-1) 0.042 -0.024*
(0.201) (0.013)
Ever married, without family involvement in spouse choice (0-1) 0.164 0.006
(0.371) (0.031)
Total fertility 0.397 -0.028
(0.760) (0.065)
Lack of autonomy mean effect 0.00 -0.203**
(1.00) (0.084)
Notes: Each row is from a separate OLS regression. Significant at 90% (*), 95% (**), 99% (***) confidence. The outcome variable is regressed on the GSP
program (treatment) indicator, an indicator for student cohort, student age at time of the survey, the mean pre-program (2000) school test score, educational
attainment of each parent, and timing of the follow-up survey (coefficient estimates not shown). Standard errors are clustered by school. The sample is N=1,385.
Details on the mean effect analysis are in the text. The autonomy mean effect includes the two attitude questions and the “Ever married, with family involvement
in spouse choice” variables.

43
Table 4: Attitudes with Respect to Ethnicity, Religion and Democracy in Follow-up survey (2005-2007)
Dependent variable:
Comparison
group variable
mean (s.d.)
Coefficient
estimate (s.e.) on
program indicator
Panel A: Ethnic and Religious Attitudes
Ethnic identity is not “very important” to respondent (0-1) 0.110 -0.033
(0.313) (0.020)
Ethnic identity is not “very important” to respondent (0-1), among those surveyed in 2005 and 2006 0.126
(0.332)
-0.044**
(0.021)
Migrated out of Busia and Teso districts 0.257 0.006
(0.438) (0.036)
Religious identity is not “very important” to respondent (0-1) 0.014 0.005
(0.117) (0.006)
Member of a prayer group (0-1) 0.371 0.018
(0.484) (0.034)
Panel B: Democratic attitudes
Agree with: "We should choose our leaders in this country through regular, open and honest elections." (0 to 1) 0.93
(0.19)
0.001
(0.014)
Agree with: “Democracy is preferable to any other kind of government” (0 to 1) [AFB, WVS] 0.69 -0.006
(0.46) (0.035)
Disagree with: “Only those who are sufficiently well educated should be allowed to choose our leaders.” (0 to 1) [AFB] 0.27
(0.38)
0.022
(0.030)
Disagree with: "Only one political party should be allowed to stand for election and hold office." (0 to 1) [AFB] 0.36
(0.40)
0.057
(0.037)
Disagree with: "All decisions should be made by a council of elders." (0 to 1) [AFB] 0.27 0.031
(0.36) (0.029)
Disagree with: "The military should come in to govern the country." (0 to 1) [AFB] 0.61 0.003
(0.41) (0.033)
Disagree with: "Elections and the Parliament should be abolished so that the president can decide everything." (0 to 1) [AFB] 0.64
(0.41)
-0.006
(0.032)
Democratic attitudes mean effect 0.00 0.056
(1.00) (0.088)
Notes: Each row is from a separate OLS regression. Significant at 90% (*), 95% (**), 99% (***) confidence. The outcome variable is regressed on the GSP
program (treatment) indicator, an indicator for student cohort, student age at time of the survey, the mean pre-program (2000) school test score, educational
attainment of each parent, and timing of the follow-up survey (coefficient estimates not shown). Standard errors are clustered by school. The sample is N=1,385,
except in the restricted sample for ethnic identity, where only those interviewed in 2005 and 2006 are included, in which case N=1,344. Details on the mean
effect analysis are in the text. The mean effect at the bottom of Panel B includes all variables in that panel.

44
Table 5: Media Consumption, Political Knowledge, and Satisfaction with Authority in Follow-up survey (2005-2007) Dependent variable: Comparison
group variable
mean (s.d.)
Coefficient
estimate (s.e.) on
program indicator
Panel A: Media Consumption
Days listened to the radio in last week (0 to 7) 0.757 -0.086**
(0.429) (0.035)
Days read a newspaper in last week (0 to 7) 0.44 0.135*
(1.01) (0.074)
Has a favorite newspaper 0.667 0.095**
(0.472) (0.037)
Favorite newspaper is the Daily Nation 0.306 0.194***
(0.461) (0.035)
Panel B: Political Knowledge
Knows Kenyan President’s name (0-1) 0.997 -0.000
(0.54) (0.002)
Knows Kenyan Vice President’s name (0-1) 0.84 0.048
(0.37) (0.030)
Knows Kenyan Education Minister's name (0-1) 0.33 0.042
(0.47) (0.037)
Knows Kenyan Health Minister's name (0-1) 0.51 0.095***
(0.50) (0.033)
Knows Ugandan President's name (0-1) 0.62 0.093*
(0.49) (0.047)
Political knowledge mean effect 0.00 0.220**
(1.00) (0.091)
Panel C: Satisfaction with Authority
“We should show more respect for authority.” (0 to 1)
(vs. “As citizens, we should be more active in questioning the actions of our leaders.”) [AFB]
0.53
(0.46)
-0.076***
(0.026)
Kenya’s quality of government is better than two years ago (0-1) 0.56 -0.054*
(0.50) (0.031)
Kenya’s economy is better than two years ago (0-1) 0.50 -0.060*
(0.50) (0.033)
Satisfaction with Kenyan democracy (0 to 1) [WVS] 0.74 -0.048***
(0.29) (0.017)
Satisfaction with authority mean effect 0.00 -0.247***
(1.00) (0.062)

45
Taking everything together, respondent is “very happy” (0-1) [WVS] 0.65 -0.027
(0.48) (0.039)
Notes: Each row is from a separate OLS regression. Significant at 90% (*), 95% (**), 99% (***) confidence. The outcome variable is regressed on the GSP
program (treatment) indicator, an indicator for student cohort, student age at time of the survey, the mean pre-program (2000) school test score, educational
attainment of each parent, and timing of the follow-up survey (coefficient estimates not shown). Standard errors are clustered by school. The sample is N=1,385.
Details on the mean effect analysis are in the text. The mean effect at the bottom of Panel B includes all variables in the panel; the mean effect in Panel C
includes the four variables listed above the mean effect row.

46
Table 6: Perceived political efficacy, participation in politics and civic affairs, and attitudes towards violence in politics
in Follow-up Survey (2005-2007)
Dependent variable:
Comparison
group variable
mean (s.d.)
Coefficient
estimate (s.e.) on
program indicator
Panel A: Perceived Political Efficacy
Disagree with: "Politics and government sometimes seem so complicated that you can’t really understand what’s going
on." (0 to 1) [AFB]
0.16
(0.29)
0.009
(0.020)
Disagree with: "This world is run by a few people in power, and there is not much that someone like me can do about it."
(0 to 1)
0.30
(0.37)
0.019
(0.027)
Perceived political efficacy mean effect 0.00
(1.00)
0.052
(0.064)
Panel B: Participation in Politics and Civic Affairs
Interested in public affairs (0-1) [AFB, WVS] 0.26 -0.029
(0.44) (0.028)
Respondent intends to vote in the next presidential election (0-1) 0.48 -0.026
(0.50) (0.045)
Community group memberships 1.41 0.058
(1.39) (0.105)
Participation in politics and civic affairs mean effect 0.00 -0.040
(1.00) (0.072)
“Generally speaking, would you say that most people can be trusted or that you need to be very careful in dealing with
people?” (0-1) [WVS]
0.187
(0.390)
-0.018
(0.025)
Panel C: Political Violence
“It is sometimes necessary to use violence in support of a just cause.” (0 to 1)
(vs. “The use of violence is never justified in politics.”) [AFB]
0.47
(0.18)
0.030**
(0.012)
Notes: Each row is from a separate OLS regression. Significant at 90% (*), 95% (**), 99% (***) confidence. The outcome variable is regressed on the GSP
program (treatment) indicator, an indicator for student cohort, student age at time of the survey, the mean pre-program (2000) school test score, educational
attainment of each parent, and timing of the follow-up survey (coefficient estimates not shown). Standard errors are clustered by school. The sample is N=1,385.
Details on the mean effect analysis are in the text are in the text. The mean effect at the bottom of Panel A includes all variables in that panel, and the mean effect
in Panel B includes all variables except for the trust question. The sample size for the “intends to vote in the next presidential election” analysis falls to 981
because the question was only asked of those respondents old enough to vote in the next election. The types of community groups include: women’s groups;
farmer/agricultural groups; youth groups; water groups/well committees, credit, saving, or insurance groups; prayer or bible study groups; burial committees;
school committees or clubs; sports teams; other community group.

47
Table 7: Comparing experimental and non-experimental estimates
Coefficient
estimate (s.e.) on
program indicator
OLS
Coefficient estimate
(s.e.) on normalized
test score (2005-07)
IV-2SLS
Coefficient estimate
(s.e.) on normalized
test score (2005-07)
OLS
Hausman test
p-value,
H0:ßIV=ßOLS
(columns 2, 3)
Dependent variable:
(1)
[Experimental]
(2)
[Non-experimental]
(3)
(4)
Lack of autonomy mean effect -0.203**
-0.942* -0.321
*** 0.018
**
(0.084) (0.516) (0.091)
Ethnic identity is not “very important” (0-1) -0.033 -0.154 0.001 0.107
(0.020) (0.102) (013)
Religious identity is not “very important” (0-1) 0.005 0.022 -0.001 0.441
(0.006) (0.030) (0.005)
Democratic attitudes mean effect 0.056 0.262 0.305***
0.823
(0.088) (0.338) (0.050)
Days read a newspaper in last week (0 to 7) 0.134*
0.622* 0.250
*** 0.261
(0.074) (0.352) (0.052)
Political knowledge mean effect 0.220**
1.020***
0.479***
0.070*
(0.091) (0.341) (0.046)
Satisfaction with authority mean effect -0.229***
-1.106**
-0.164***
0.001***
(0.059) (0.460) (0.049)
Perceived political efficacy mean effect 0.052 0.240 -0.031 0.332
(0.064) (0.322) (0.047)
Participation in politics and civic affairs mean effect -0.040 -0.185 0.014 0.539
(0.072) (0.348) (0.064)
“It is sometimes necessary to use violence in support of a just cause.”
(0 to 1) (vs. “The use of violence is never justified in politics.”)
0.030**
(0.012)
0.140
(0.095)
-0.008
(0.009)
0.017**
Notes: Each cell contains results from a separate regression. Significant at 90% (*), 95% (**), 99% (***) confidence. Details on the mean effect analysis are in
the text. Standard errors are clustered by school. The sample is N=1,385 for all dependent variables.
In column 1, the outcome variable is regressed on the GSP program (treatment) indicator, an indicator for student cohort, student age at time of the survey, the
mean pre-program (2000) school test score, educational attainment of each parent, and timing of the follow-up survey (coefficient estimates not shown). In
column 2, the outcome variable is regressed on the same explanatory variables except the GSP program indicator is replaced by the normalized test score (in
2005-2007) across all subjects, and the test score is instrumented by the GSP program indicator. In column 3, the normalized test score (in 2005-2007) across all
subjects is included as an explanatory variable but it is not instrumented, and the sample is restricted to the control group (N=662). Column 4 presents the
Hausman test results (p-value) on the hypothesis that the coefficient estimates are equal across columns 2 and 3 for each dependent variable.

48
Supplementary Figures and Tables (not intended for publication)
Appendix Figure A1: Girls Scholarship Program (GSP) Timeline (2000-2007)
January 2001: Schools invited to participate, lists of students enrolled in grades 5 and 6
in all program schools compiled (Nschools=69, Nstudents=3292)
March 2001: Randomization of schools into treatment and control groups
(using a computer random number generator)
Treatment
(Nschools=34, Nstudents=1640)
Control
(Nschools=35, Nstudents=1652)
March 2001: Announcement of scholarship
program in treatment schools;
September and October 2001: Reminder
meeting for parents
Ongoing student and teacher attendance checks
November 2002: Follow up achievement tests for cohort 2 (Nschools=69, Nstudents=892);
winners announced and scholarship awards distributed
2005-2007: Follow up individual surveys collected (Nstudents=1756, and 1385 with
complete data matched to 2001 and 2002 data)
November 2000: Baseline academic tests for cohorts 1 and 2 in Busia District taken
May-July 2002: Background individual surveys collected for students in both cohorts
November 2001: Follow-up achievement tests for cohort 1 (Nschools=69, Nstudents=1211);
winners announced and scholarship awards distributed

49
Appendix Table A1: Comparing estimates in the full sample vs. among those with “low” baseline test scores
Coefficient
estimate (s.e.) on
program indicator
OLS
Coefficient
estimate (s.e.) on
program indicator,
baseline test score
< +2 s.d.
Test of equality of
coefficient estimates
in columns 1, 2
(p-value)
Dependent variable: (1) (2) (3)
Lack of autonomy mean effect -0.214**
-0.195* 0.68
(0.070) (0.102)
Ethnic identity is not “very important” (0-1) -0.024 -0.027 0.86
(0.020) (0.025)
Religious identity is not “very important” (0-1) -0.007 -0.007 0.96
(0.008) (0.007)
Democratic attitudes mean effect -0.038 -0.048 0.84
(0.065) (0.096)
Days read a newspaper in last week (0 to 7) 0.109
0.099 0.18
(0.078) (0.102)
Political knowledge mean effect 0.117*
0.120 0.87
(0.062) (0.101)
Satisfaction with authority mean effect -0.173***
-0.158* 0.86
(0.066) (0.086)
Perceived political efficacy mean effect 0.079 0.078 0.96
(0.060) (0.077)
Participation in politics and civic affairs mean effect -0.146**
-0.147 0.92
(0.063) (0.096)
“It is sometimes necessary to use violence in support of a just cause.” (0 to 1)
(vs. “The use of violence is never justified in politics.”)
0.012
(0.011)
0.008
(0.012)
0.85
Notes: Each cell contains results from a separate regression. Significant at 90% (*), 95% (**), 99% (***) confidence. Details on the mean effect analysis are in
the text. Standard errors are clustered by school. The sample in column 1 consists of all individuals with baseline test score data (N=918). In column 2, the
sample is restricted to individuals with baseline normalized test scores less than +2 s.d. (N=899).
In columns 1 and 2, the outcome variable is regressed on the GSP program (treatment) indicator, an indicator for student cohort, student age at time of the survey,
the mean pre-program (2000) school test score, educational attainment of each parent, and timing of the follow-up survey (coefficient estimates not shown).
Column 3 presents the test results (p-value) on the hypothesis that the coefficient estimates are equal across columns 1 and 2 for each dependent variable. To
carry out this test, 1000 draws (with replacement) of sample size 899 were taken from the full baseline test score sample, and the regressions analogous to
column 2 were carried out. The p-values in column 3 correspond to the hypothesis that the coefficient estimates in column 2 are drawn from this distribution.

50
Appendix Table A2: Effects in schools with different numbers of predicted GSP winners
Coefficient
estimate (s.e.) on
program indicator
OLS
Coefficient estimate
(s.e.) on interaction
between the program
indicator and predicted
number of winners
Dependent variable: (1) (2)
Lack of autonomy mean effect -0.194**
0.005
(0.096) (0.001)
Ethnic identity is not “very important” (0-1) -0.039**
0.005**
(0.018) (0.002)
Religious identity is not “very important” (0-1) -0.003 -0.0004
(0.007) (0.0006)
Democratic attitudes mean effect 0.019 -0.004
(0.080) (0.010)
Days read a newspaper in last week (0 to 7) 0.114
-0.004
(0.077) (0.007)
Political knowledge mean effect 0.206**
0.006
(0.036) (0.009)
Satisfaction with authority mean effect -0.205***
-0.001
(0.063) (0.005)
Perceived political efficacy mean effect 0.068 0.002
(0.069) (0.008)
Participation in politics and civic affairs mean effect -0.024 -0.008
(0.074) (0.009)
“It is sometimes necessary to use violence in support of a just cause.” (0 to 1)
(vs. “The use of violence is never justified in politics.”)
0.021**
(0.010)
0.005***
(0.001)
Notes: Each row contains results from a separate regression. Significant at 90% (*), 95% (**), 99% (***) confidence. Details on the mean effect analysis are in
the text. Standard errors are clustered by school. The sample is N=1,385 for all dependent variables.
The outcome variable is regressed on the GSP program (treatment) indicator, the GSP indicator interacted with the predicted number of GSP winners, an
indicator for student cohort, student age at time of the survey, the mean pre-program (2000) school test score, educational attainment of each parent, and timing
of the follow-up survey (coefficient estimates not shown). The predicted number of GSP winners is estimated in treatment group schools by regressing the actual
number of scholarship winners in the school on various quantiles of the baseline test score distribution for students in that school; the predicted number of
winners is then assigned to both treatment and control schools.