Education and childcare - GOV.UK
15
1 Education and childcare Childcare provision Early Year Register (EYR) childminders and childcare providers provide childcare up to the age of 5 years (they may also provide childcare to older children). In August 2016 there were just over 8,000 EYR childcare settings in rural areas – 4,700 EYR childminders and over 3,300 EYR childcare providers - together offering over 152,000 child care places. Childcare places are not the maximum number of children that could be enrolled at a setting, but the maximum number of children that can be cared for at any one time. Between March and August 2016 there had been a 7 per cent fall in the combined number of EYR childminders and childcare providers in rural areas, compared with a 2 per cent fall in urban areas. In August 2016 15 per cent of EYR childminders and 18 per cent of EYR childcare providers in rural areas (17 per cent overall) had received an ‘outstanding’ rating in their most recent inspection. A further 77 per cent of both EYR childminders and childcare providers had received a ‘good’ rating. Overall between March and August 2016 the percentage of EYR childminders and childcare providers in rural areas that had received a ‘good’ or ‘outstanding’ rating in their most recent inspection increased from 88 per cent to 93 per cent. For urban areas there had been an increase from 86 per cent to 91 per cent. Childminders, childcare providers and childcare places Percentage of Early Year Registered childcare settings and childcare places, with most recent inspection outcome by rural urban classification, August 2016, England
Transcript of Education and childcare - GOV.UK

1
Education and childcare
Childcare provision
Early Year Register (EYR) childminders and childcare providers provide childcare up to the age
of 5 years (they may also provide childcare to older children).
In August 2016 there were just over 8,000 EYR childcare settings in rural areas – 4,700 EYR
childminders and over 3,300 EYR childcare providers - together offering over 152,000 child care
places. Childcare places are not the maximum number of children that could be enrolled at a
setting, but the maximum number of children that can be cared for at any one time.
Between March and August 2016 there had been a 7 per cent fall in the combined number of
EYR childminders and childcare providers in rural areas, compared with a 2 per cent fall in urban
areas.
In August 2016 15 per cent of EYR childminders and 18 per cent of EYR childcare providers in
rural areas (17 per cent overall) had received an ‘outstanding’ rating in their most recent
inspection. A further 77 per cent of both EYR childminders and childcare providers had received
a ‘good’ rating.
Overall between March and August 2016 the percentage of EYR childminders and childcare
providers in rural areas that had received a ‘good’ or ‘outstanding’ rating in their most recent
inspection increased from 88 per cent to 93 per cent. For urban areas there had been an
increase from 86 per cent to 91 per cent.
Childminders, childcare providers and childcare places
Percentage of Early Year Registered childcare settings and childcare places, with most recent inspection
outcome by rural urban classification, August 2016, England

2
Number and percentage of Early Year Registered childcare settings and most recent inspection outcome by rural urban classification, March and
August 2016, England
Number of childcare settings Percentage of childcare settings
Childminders Childcare providers Total settings Childminders Childcare providers Total settings March August March August March August March August March August March August Rural
All Early Year Registered 4,910 4,708 3,782 3,342 8,692 8,050 Inspection outcome known 3,983 3,810 3,290 2,857 7,273 6,667 100 100 100 100 100 100
Outstanding 584 580 600 525 1,184 1,105 15 15 18 18 16 17 Good 2,834 2,919 2,404 2,205 5,238 5,124 71 77 73 77 72 77
Requires improvement 538 283 243 107 781 390 14 7 7 4 11 6
Inadequate 27 28 43 20 70 48 1 1 1 1 1 1 Inspection outcome not available 927 898 492 485 1,419 1,383
Urban
All Early Year Registered 39,323 37,852 21,083 21,339 60,406 59,191 Inspection outcome known 31,433 30,572 17,740 18,041 49,173 48,613 100 100 100 100 100 100
Outstanding 4,049 3,916 2,996 3,096 7,045 7,012 13 13 17 17 14 14 Good 22,005 23,087 13,013 13,967 35,018 37,054 70 76 73 77 71 76
Requires improvement 5,074 3,252 1,496 795 6,570 4,047 16 11 8 4 13 8 Inadequate 305 317 235 183 540 500 1 1 1 1 1 1
Inspection outcome not available 7,890 7,280 3,343 3,298 11,233 10,578
England All Early Year Registered 44,234 42,563 24,882 24,691 69,116 67,254
Inspection outcome known 35,416 34,382 21,045 20,908 56,461 55,290 100 100 100 100 100 100 Outstanding 4,633 4,496 3,600 3,625 8,233 8,121 13 13 17 17 15 15
Good 24,839 26,006 15,426 16,177 40,265 42,183 70 76 73 77 71 76 Requires improvement 5,612 3,535 1,741 903 7,353 4,438 16 10 8 4 13 8
Inadequate 332 345 278 203 610 548 1 1 1 1 1 1 Inspection outcome not available 8,818 8,181 3,837 3,783 12,655 11,964
3
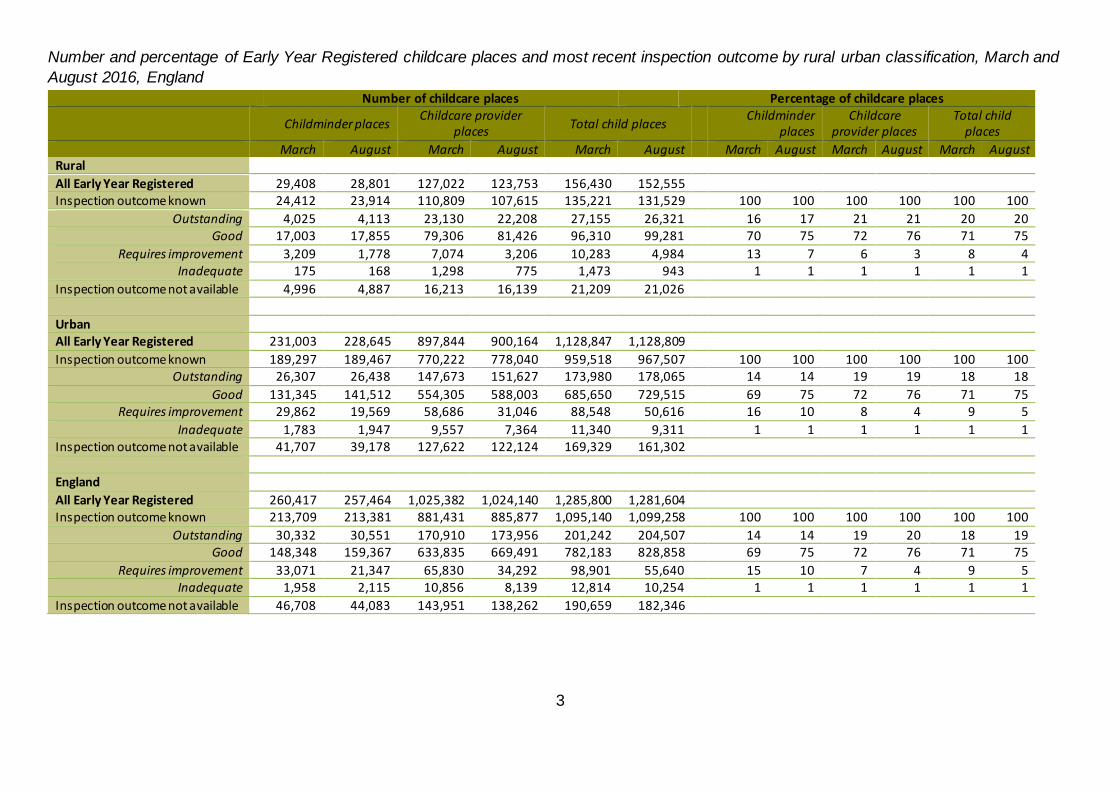
Number and percentage of Early Year Registered childcare places and most recent inspection outcome by rural urban classification, March and
August 2016, England
Number of childcare places Percentage of childcare places
Childminder places Childcare provider
places Total child places
Childminder places
Childcare provider places
Total child places
March August March August March August March August March August March August Rural
All Early Year Registered 29,408 28,801 127,022 123,753 156,430 152,555 Inspection outcome known 24,412 23,914 110,809 107,615 135,221 131,529 100 100 100 100 100 100
Outstanding 4,025 4,113 23,130 22,208 27,155 26,321 16 17 21 21 20 20 Good 17,003 17,855 79,306 81,426 96,310 99,281 70 75 72 76 71 75
Requires improvement 3,209 1,778 7,074 3,206 10,283 4,984 13 7 6 3 8 4 Inadequate 175 168 1,298 775 1,473 943 1 1 1 1 1 1
Inspection outcome not available 4,996 4,887 16,213 16,139 21,209 21,026
Urban All Early Year Registered 231,003 228,645 897,844 900,164 1,128,847 1,128,809
Inspection outcome known 189,297 189,467 770,222 778,040 959,518 967,507 100 100 100 100 100 100 Outstanding 26,307 26,438 147,673 151,627 173,980 178,065 14 14 19 19 18 18
Good 131,345 141,512 554,305 588,003 685,650 729,515 69 75 72 76 71 75 Requires improvement 29,862 19,569 58,686 31,046 88,548 50,616 16 10 8 4 9 5
Inadequate 1,783 1,947 9,557 7,364 11,340 9,311 1 1 1 1 1 1 Inspection outcome not available 41,707 39,178 127,622 122,124 169,329 161,302
England
All Early Year Registered 260,417 257,464 1,025,382 1,024,140 1,285,800 1,281,604 Inspection outcome known 213,709 213,381 881,431 885,877 1,095,140 1,099,258 100 100 100 100 100 100
Outstanding 30,332 30,551 170,910 173,956 201,242 204,507 14 14 19 20 18 19 Good 148,348 159,367 633,835 669,491 782,183 828,858 69 75 72 76 71 75
Requires improvement 33,071 21,347 65,830 34,292 98,901 55,640 15 10 7 4 9 5 Inadequate 1,958 2,115 10,856 8,139 12,814 10,254 1 1 1 1 1 1
Inspection outcome not available 46,708 44,083 143,951 138,262 190,659 182,346

4
Notes: A rural urban classification has been applied using the postcode district of each setting as the full postcode has been
redacted in published data for a large number of childminders and childcare providers. A rural urban classification for
postcode districts has been devised especially to analyse these data. The postcode district is the first part of a postcode.
There are 2,320 postcode districts in England covering 2.1 million postcodes. Analysis at postcode district level is l ikely to
under-estimate the number of settings in rural areas and over estimate the number in urban areas compared with the
outcome had it been possible to use a classification based on the full postcode.
The totals for England may not correspond with the sum of rural and urban settings as the totals for England include a small
number of settings for which it was not possible to match postcode districts to determine a rural urban classification. Totals
for England correspond with published Ofsted totals. Excluded from the rural or urban totals as a result are for March 1
childminder (6 child care places) and 17 childcare providers (517 childcare places) and for August 3 childminders (18
childcare places) and 10 childcare providers (222 childcare places).
In August 2016 there were an additional 2,123 childminders and 1,481 childcare providers in rural areas not on the EYR but
on other childcare registers (not shown).
Includes Ofsted estimates where the number of childcare places is not reported. The number of childcare places reported
by some childminders may be a default standard of 6 places.
For more information see www.gov.uk/government/publications/childcare-providers-and-inspections-as-at-31-august-
2016/childcare-providers-and-inspections-key-findings-as-at-31-august-2016
Source: Ofsted Freedom of Information early years dataset and Defra analysis
www.gov.uk/government/statistical-data-sets/foi-early-years-dataset-as-at-31-march-2016
www.gov.uk/government/publications/foi-early-years-dataset-as-at-31-august-2016
5
Secondary education
In the 2017/18 academic year, 69.5 per cent of pupils living in rural areas left school with English
and Maths GCSEs at A* to C grade or equivalent. This was higher than for urban areas (63.5
per cent) and England overall (64.5 per cent ).
In 2017/18 the proportion of pupils attending schools in rural areas who left school with English
and Maths GCSEs at grades A* to C or equivalent was also higher than in urban areas.
For a given level of deprivation, the attainment levels of pupils living in rural areas were lower
than for pupils living in urban areas with a similar level of deprivation.
There is a wide variation in the English and Maths GCSE attainment results for Local Authority
District (LAD) areas.
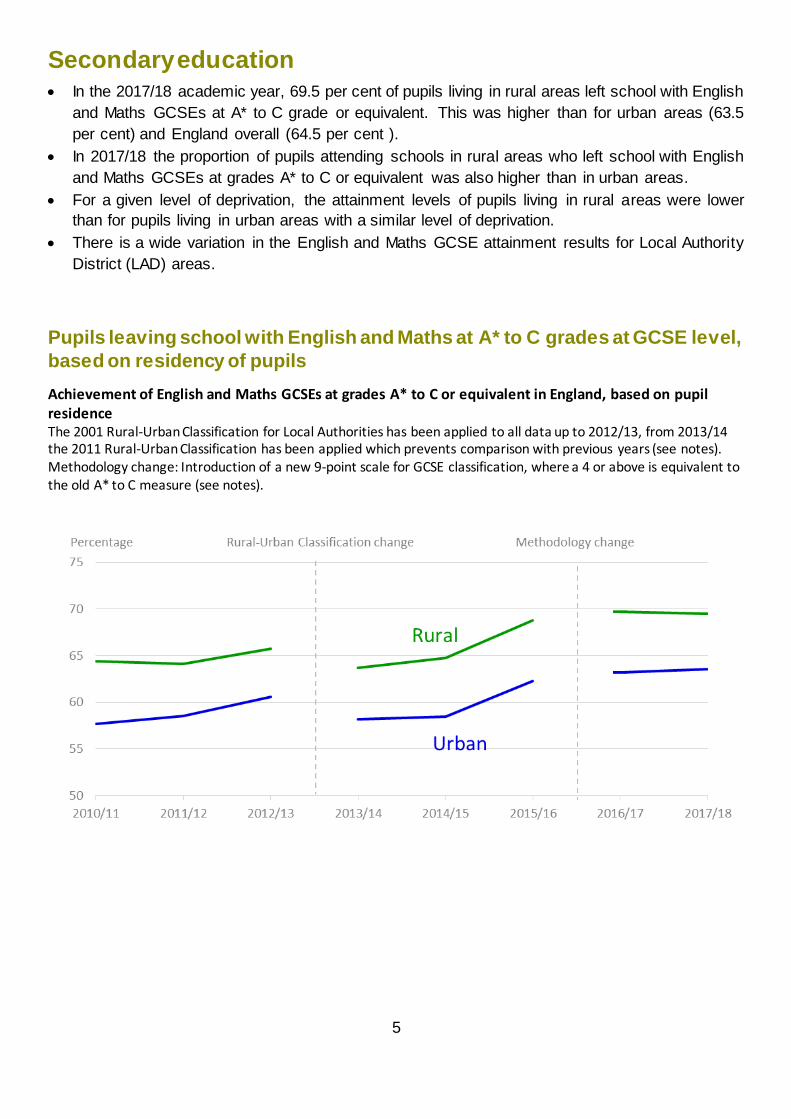
Pupils leaving school with English and Maths at A* to C grades at GCSE level,
based on residency of pupils
Achievement of English and Maths GCSEs at grades A* to C or equivalent in England, based on pupil residence The 2001 Rural-Urban Classification for Local Authorities has been applied to all data up to 2012/13, from 2013/14 the 2011 Rural-Urban Classification has been applied which prevents comparison with previous years (see notes). Methodology change: Introduction of a new 9-point scale for GCSE classification, where a 4 or above is equivalent to the old A* to C measure (see notes).

6
Percentage of pupils leaving school with English and Maths GCSEs at grades A* to C or equivalent, based on residency of pupils in England
2010//11 2011/12 2012/13 2013/14 2014/15 2015/16 2016/17 2017/18
Rural areas 64.4 64.1 65.7 63.7 64.7 68.8 69.7 69.5
Rural hamlet & isolated dwellings 68.2 67.6 69 67.1 68.2 72.6 72.8 72.9 Rural village 66.5 65.8 67.3 65.8 67.3 70.7 72.4 71.4 Rural town & fringe 61.7 61.8 63.6 61.5 62.2 66.5 67.2 67.4
Urban areas 57.7 58.5 60.6 58.2 58.4 62.3 63.2 63.5 City and town 57.3 58.1 61.8 62.7 63.2 Minor conurbation 54.3 54.9 59.8 59.6 60.1 Major conurbation 59.7 59.2 63.1 64.1 64.3
England 59.0 59.5 61.6 59.1 59.5 63.4 64.3 64.5 The first vertical l ine indicates the introduction of the 2011 Rural-Urban Classification from 2013/14 that prevents comparison with previous years (see notes). The second vertical l ine indicates the introduction of the new 9-point scale for GCSE classification where a 4 or above is equivalent to the old A* to C measure (see notes).
Pupils leaving school with English and Maths A* to C grades or equivalent at
GCSE level, based on Income Deprivation Affecting Children Indices (IDACI)
decile and residency of pupils
Achievement of English and Maths GCSEs at a 9 to 4 pass (equivalent to A* to C) in England, based on IDACI decile and residency of pupil (2017/18)
Most deprived Least deprived
IDAI Decile 0-10 10-20 20-30 30-40 40-50 50-60 60-70 70-80 80-90 90-100
England 49.1 53.1 57.1 61.1 64.1 67.6 70.8 73.7 76.7 81.9 Urban areas 49.1 53.2 57.4 61.2 64.3 68 71.2 74.4 77.2 82.4 Rural areas 46.6 50.8 53.4 59.6 62.8 66.1 69.9 72.3 75.5 80.1
Number of eligible pupils in: Urban areas 61,318 57,497 53,152 46,360 42,675 37,028 34,732 32,425 32,847 34,736 Rural areas 1,122 1,778 3,505 5,799 7,764 11,289 13,497 14,915 14,904 11,754
Achievement of English and Maths GCSEs at a 9 to 4 pass in England, based on Income Deprivation
Affecting Children Indices (IDACI) decile and residency of pupil (2017/18)
Most deprived Least deprived
Percent

7
The introduction of a new secondary school accountability system in 2016 has changed how
GCSE performance is measured. A 9 to 1 point measure was introduced to replace the A* to
G system, where a 9 to 4 score is equivalent to the previous A* to C measure. Data from
2016/17 presents the new 9 to 4 measure, whereas data prior to 2016/17 presents the
previous A* to C measure.
The proportion of pupils achieving English and Maths A* to C grades or equivalent in their
GCSEs at the end of Key Stage 4 (end of secondary-level education), based on residency of
pupil:
o increased between 2010/11 and 2017/18 for both rural and urban areas
o was 6.0 percentage points higher in rural than urban areas in 2017/18
o was lower for all rural areas for each level of deprivation (IDACI decile group)
compared with urban areas
When the data are considered at an aggregated rural level then the rural English and Maths
attainment results are on average better than the urban ones.
However, results by the level of deprivation in the area where the pupil lives (using the Income
Deprivation Affecting Children Index (IDACI) adds context to the results by taking into account
the circumstances of children outside the influence of the school. When comparing results
using deprivation level (IDACI decile bands), rural areas had lower achievement levels in
English and Maths for all levels of deprivation compared with urban areas.
The differing outcome at the aggregated rural level (rural areas seeing higher levels of
attainment) and individual deprivation levels is explained by the different proportions of
deprivation within rural and urban areas overall. In rural areas in 2017/18, 23 per cent of
pupils were in areas with the highest levels of deprivation (decile bands 0 to 50) compared
with 60 per cent of pupils in urban areas. Those pupils in these more deprived areas
generally had lower achievement levels compared with those in less deprived areas (decile
bands 50 to 100) where there are proportionately more pupils in rural areas. This factor
results in a higher attainment average overall for rural pupils and the converse for urban
pupils.
It is also useful to consider geographical differences by comparing the results at Local
Authority District level and region.
8
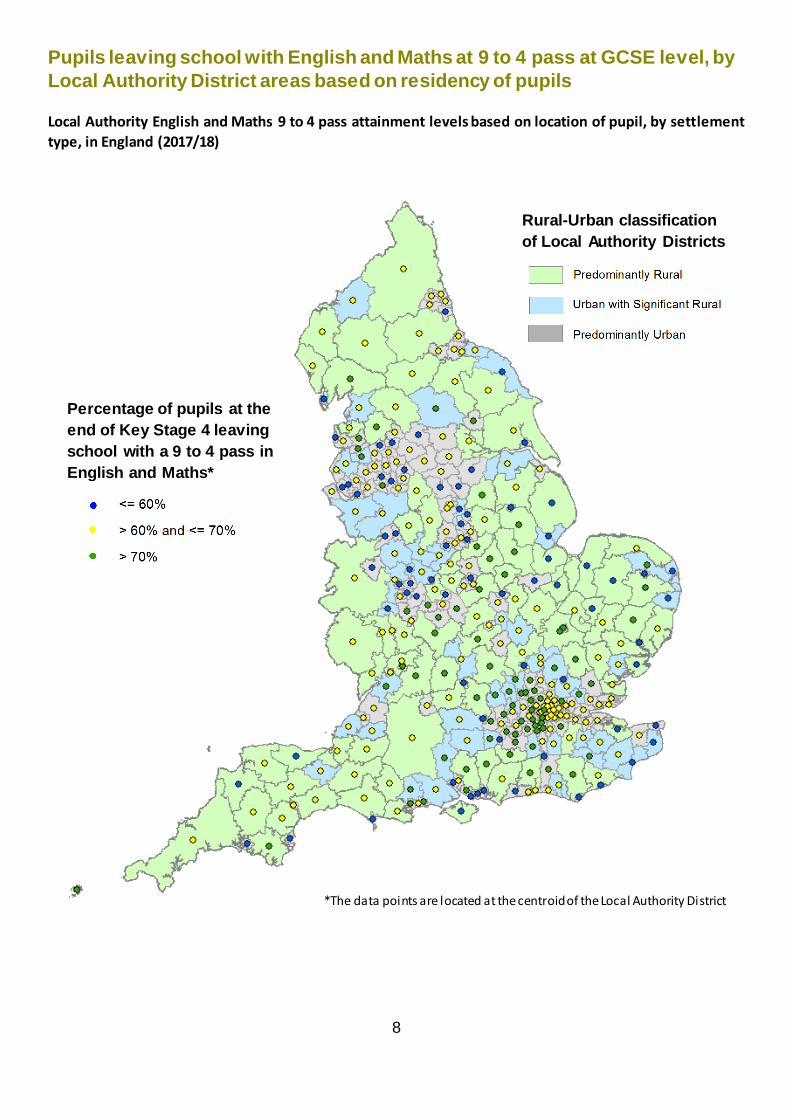
Pupils leaving school with English and Maths at 9 to 4 pass at GCSE level, by
Local Authority District areas based on residency of pupils
Local Authority English and Maths 9 to 4 pass attainment levels based on location of pupil, by settlement
type, in England (2017/18)
Rural-Urban classification
of Local Authority Districts
Percentage of pupils at the
end of Key Stage 4 leaving
school with a 9 to 4 pass in
English and Maths*
*The data points are located at the centroid of the Local Authority District
9
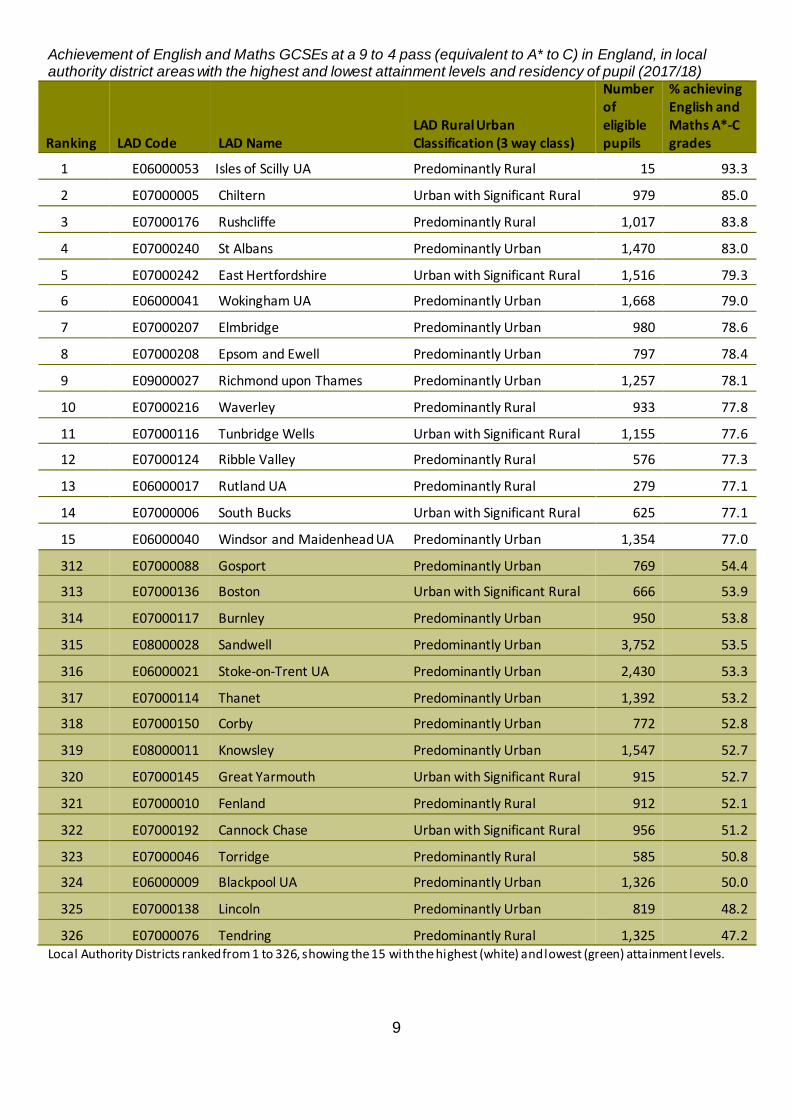
Achievement of English and Maths GCSEs at a 9 to 4 pass (equivalent to A* to C) in England, in local authority district areas with the highest and lowest attainment levels and residency of pupil (2017/18)
Ranking LAD Code LAD Name LAD Rural Urban Classification (3 way class)
Number of eligible pupils
% achieving English and Maths A*-C grades
1 E06000053 Isles of Scilly UA Predominantly Rural 15 93.3
2 E07000005 Chiltern Urban with Significant Rural 979 85.0
3 E07000176 Rushcliffe Predominantly Rural 1,017 83.8
4 E07000240 St Albans Predominantly Urban 1,470 83.0
5 E07000242 East Hertfordshire Urban with Significant Rural 1,516 79.3
6 E06000041 Wokingham UA Predominantly Urban 1,668 79.0
7 E07000207 Elmbridge Predominantly Urban 980 78.6
8 E07000208 Epsom and Ewell Predominantly Urban 797 78.4
9 E09000027 Richmond upon Thames Predominantly Urban 1,257 78.1
10 E07000216 Waverley Predominantly Rural 933 77.8
11 E07000116 Tunbridge Wells Urban with Significant Rural 1,155 77.6
12 E07000124 Ribble Valley Predominantly Rural 576 77.3
13 E06000017 Rutland UA Predominantly Rural 279 77.1
14 E07000006 South Bucks Urban with Significant Rural 625 77.1
15 E06000040 Windsor and Maidenhead UA Predominantly Urban 1,354 77.0
312 E07000088 Gosport Predominantly Urban 769 54.4
313 E07000136 Boston Urban with Significant Rural 666 53.9
314 E07000117 Burnley Predominantly Urban 950 53.8
315 E08000028 Sandwell Predominantly Urban 3,752 53.5
316 E06000021 Stoke-on-Trent UA Predominantly Urban 2,430 53.3
317 E07000114 Thanet Predominantly Urban 1,392 53.2
318 E07000150 Corby Predominantly Urban 772 52.8
319 E08000011 Knowsley Predominantly Urban 1,547 52.7
320 E07000145 Great Yarmouth Urban with Significant Rural 915 52.7
321 E07000010 Fenland Predominantly Rural 912 52.1
322 E07000192 Cannock Chase Urban with Significant Rural 956 51.2
323 E07000046 Torridge Predominantly Rural 585 50.8
324 E06000009 Blackpool UA Predominantly Urban 1,326 50.0
325 E07000138 Lincoln Predominantly Urban 819 48.2
326 E07000076 Tendring Predominantly Rural 1,325 47.2 Local Authority Districts ranked from 1 to 326, showing the 15 with the highest (white) and lowest (green) attainment levels.
10
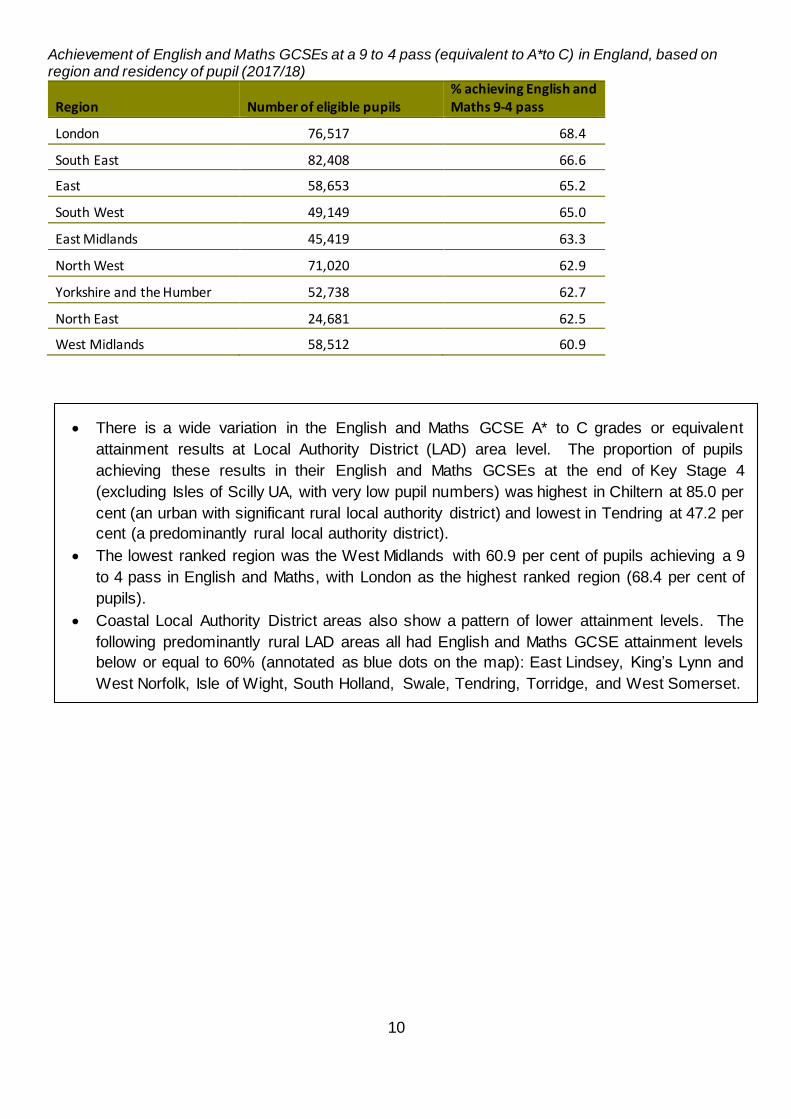
Achievement of English and Maths GCSEs at a 9 to 4 pass (equivalent to A*to C) in England, based on region and residency of pupil (2017/18)
Region Number of eligible pupils % achieving English and Maths 9-4 pass
London 76,517 68.4
South East 82,408 66.6
East 58,653 65.2
South West 49,149 65.0
East Midlands 45,419 63.3
North West 71,020 62.9
Yorkshire and the Humber 52,738 62.7
North East 24,681 62.5
West Midlands 58,512 60.9
There is a wide variation in the English and Maths GCSE A* to C grades or equivalent
attainment results at Local Authority District (LAD) area level. The proportion of pupils
achieving these results in their English and Maths GCSEs at the end of Key Stage 4
(excluding Isles of Scilly UA, with very low pupil numbers) was highest in Chiltern at 85.0 per
cent (an urban with significant rural local authority district) and lowest in Tendring at 47.2 per
cent (a predominantly rural local authority district).
The lowest ranked region was the West Midlands with 60.9 per cent of pupils achieving a 9
to 4 pass in English and Maths, with London as the highest ranked region (68.4 per cent of
pupils).
Coastal Local Authority District areas also show a pattern of lower attainment levels. The
following predominantly rural LAD areas all had English and Maths GCSE attainment levels
below or equal to 60% (annotated as blue dots on the map): East Lindsey, King’s Lynn and
West Norfolk, Isle of Wight, South Holland, Swale, Tendring, Torridge, and West Somerset.

11
Pupils leaving school with English and Maths A* to C grades or equivalent at
GCSE level, based on school location
Achievement of English and Maths GCSEs at grades A* to C or equivalent in England, based on school
location The 2001 Rural-Urban Classification for Local Authorities has been applied to all data up to 2012/13, from 2013/14 the 2011 Rural-Urban Classification has been applied which prevents comparison with previous years (see notes). Methodology change: Introduction of a new 9-point scale for GCSE classification in 2016/17, where a 4 or above is equivalent to the old A* to C measure (see notes).
Percentage of pupils leaving school with English and Maths GCSEs at grades A* to C or equivalent , based
on location of schools in England
2010/11 2011/12 2012/13 2013/14 2014/15 2015/16 2016/17 2017/18
Rural areas 61.9 61.6 63.5 60.9 62.0 66.5 67.6 67.3 Rural hamlet & isolated dwellings 60.9 60.5 61.4 60.3 61.8 65.5 66.8 65.0 Rural village 62.8 61.6 63.9 61.6 62.8 67.9 67.1 68.3 Rural town & fringe 61.8 61.8 63.9 60.9 61.9 66.4 67.8 67.4
Urban areas 58.4 59.2 61.2 58.8 59.2 62.8 63.7 64.0 City and town 58.5 59.4 62.9 63.7 64.2 Minor conurbation 54.6 55.0 59.7 60.0 60.4 Major conurbation 59.8 59.3 63.0 64.0 64.2
England 58.9 59.5 61.5 59.1 59.5 63.3 64.2 64.4 The first vertical line indicates the introduction of the 2011 Rural-Urban Classification from 2013/14 that prevents comparison with previous years (see notes). The second vertical l ine indicates the introduction of the new 9-point scale for GCSE classification where a 4 or above is equivalent to the old A* to C measure (see notes).
The proportion of pupils achieving English and Maths A* to C grades or equivalent in their
GCSEs at the end of Key Stage 4 (end of secondary level education) based on school
location:
o was 3.2 percentage points higher in rural than urban areas in 2017/18.
The percentage of pupils achieving English and Maths GCSEs at grades A* to C or
equivalent was higher for pupils who went to school in rural areas than for those who went
to school in urban areas each year between 2010/11 and 2017/18.
There will be differences between pupil residency and location of school as pupils living
in rural areas may travel to schools in urban areas and vice versa.

12
School inspection outcomes, based on school location
Percentage of secondary schools with most recent school inspection outcome, as at 31 March 2019, based on rural urban classification of school location, England
Percentage of secondary schools with most recent school inspection outcome, as at March 2019, based on rural urban classification of school location, England
Percentage of schools Number of schools
Outstanding
Good Requires
improvement Inadequate
Total inspected
Inspected Not yet
inspected
Rural areas 18 63 14 6 100 484 8 Rural hamlet & isolated dwellings 17 63 17 2 100 52 3 Rural village 19 61 14 6 100 669 2 Rural town & fringe 18 63 13 6 100 363 3
Urban areas 22 52 18 8 100 2,824 73
City and town 19 55 19 8 100 1,558 26 Minor conurbation 17 51 19 14 100 108 3 Major conurbation 27 48 17 8 100 1,158 44
England 22 54 17 8 100 3,308 81
As at 31 March 2019, 18 per cent of secondary schools in rural areas had received
‘Outstanding’ as the most recent inspection outcome, compared with 22 per cent of
secondary schools in urban areas.
A further 63 per cent of secondary schools in rural areas had received a ‘Good’ inspection
outcome.
Overall 81 per cent of secondary schools in rural areas had received ‘Outstanding’ or
‘Good’ inspection outcomes, compared with 74 per cent of secondary schools in urban
areas.
13
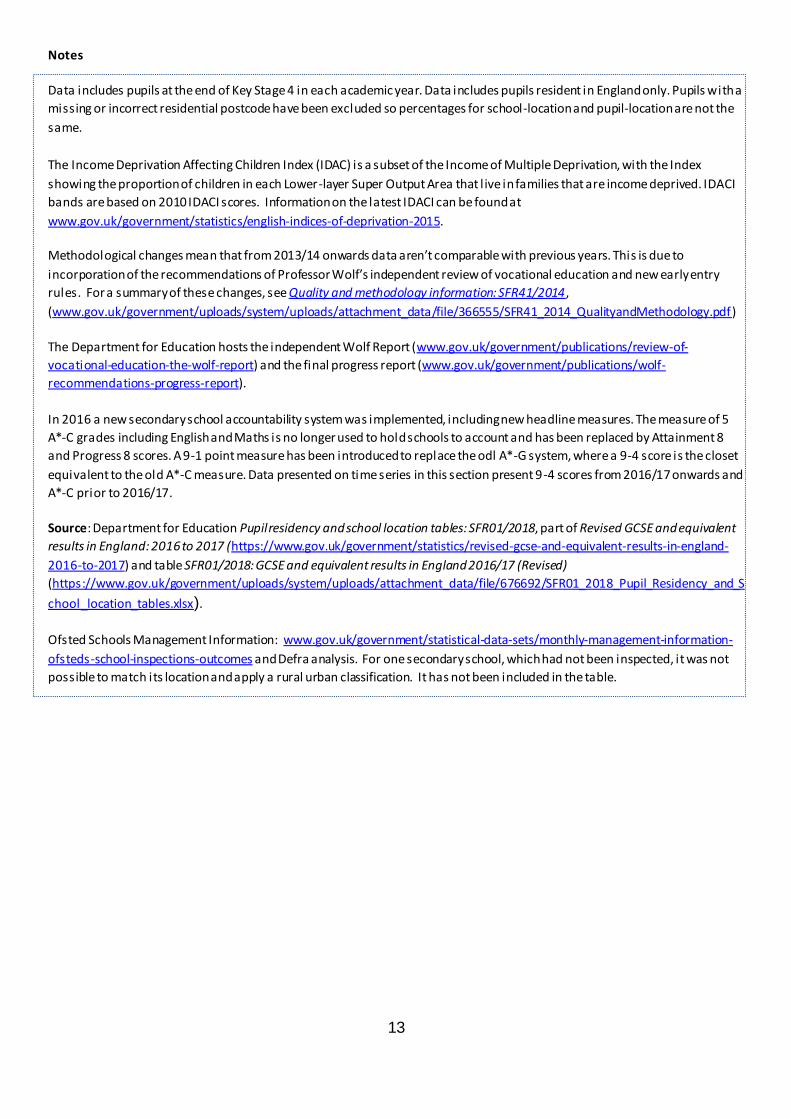
Notes
Data includes pupils at the end of Key Stage 4 in each academic year. Data includes pupils resident in England only. Pupils with a
missing or incorrect residential postcode have been excluded so percentages for school-location and pupil-location are not the
same.
The Income Deprivation Affecting Children Index (IDAC) is a subset of the Income of Multiple Deprivation, with the Index
showing the proportion of children in each Lower-layer Super Output Area that l ive in families that are income deprived. IDACI
bands are based on 2010 IDACI scores. Information on the latest IDACI can be found at
www.gov.uk/government/statistics/english-indices-of-deprivation-2015.
Methodological changes mean that from 2013/14 onwards data aren’t comparable with previous years. This is due to
incorporation of the recommendations of Professor Wolf’s independent review of vocational education and new early entry
rules. For a summary of these changes, see Quality and methodology information: SFR41/2014,
(www.gov.uk/government/uploads/system/uploads/attachment_data/file/366555/SFR41_2014_QualityandMethodology.pdf)
The Department for Education hosts the independent Wolf Report (www.gov.uk/government/publications/review-of-
vocational-education-the-wolf-report) and the final progress report (www.gov.uk/government/publications/wolf-
recommendations-progress-report).
In 2016 a new secondary school accountability system was implemented, including new headline measures. The measure of 5
A*-C grades including English and Maths is no longer used to hold schools to account and has been replaced by Attainment 8
and Progress 8 scores. A 9-1 point measure has been introduced to replace the odl A*-G system, where a 9-4 score is the closet
equivalent to the old A*-C measure. Data presented on time series in this section present 9-4 scores from 2016/17 onwards and
A*-C prior to 2016/17.
Source: Department for Education Pupil residency and school location tables: SFR01/2018, part of Revised GCSE and equivalent
results in England: 2016 to 2017 (https://www.gov.uk/government/statistics/revised-gcse-and-equivalent-results-in-england-
2016-to-2017) and table SFR01/2018: GCSE and equivalent results in England 2016/17 (Revised)
(https://www.gov.uk/government/uploads/system/uploads/attachment_data/file/676692/SFR01_2018_Pupil_Residency_and_S
chool_location_tables.xlsx).
Ofsted Schools Management Information: www.gov.uk/government/statistical-data-sets/monthly-management-information-
ofsteds-school-inspections-outcomes and Defra analysis. For one secondary school, which had not been inspected, it was not
possible to match its location and apply a rural urban classification. It has not been included in the table.
https://www.gov.uk/government/statistics/revised-gcse-and-equivalent-results-in-england-2016-to-2017

14
Higher education
The rate of full-time entry to higher education institutions by 18 to 20 year olds in 2015/16 was
slightly lower in Predominantly rural areas than in Predominantly urban areas (138 compared
with 142 entrants per 1,000 18 to 20 year olds respectively).
For part-time entry the ratio was higher in Predominantly rural areas (5 per 1,000) than in
Predominantly urban areas (3 per 1,000).
Rates of entry to part-time higher education have been falling since around 2009/10.
The rates for entrants to higher education institutions are based on where the students are
living prior to commencing higher education and does not reflect the location of the higher
education institutions.
Full time entrants to higher education
Full-time entrants to higher education per 1,000 people aged 18 to 20 in England
There has been an increase in the rate of enrolment for full-time courses at higher education
institutions in England between 2012/13 and 2015/16. This followed a decrease in the previous
year that coincided with changes to tuition fee arrangements.
The rate of entry to higher education by 18 to 20 year olds prior to 2014/15 had tended to be
higher for those living in Predominantly rural areas than Predominantly urban areas, but the
rate for Predominantly urban areas rose above Predominantly rural areas in 2014/15.
Full-time entrants to higher education per 1,000 population of 18 to 20 year olds in England
2009/10
2010/11
2011/12
2012/13
2013/14
2014/15 2015/16
Predominantly rural 131 131 143 118 133 135 138
Urban with significant rural 143 142 152 129 142 145 149
Predominantly urban 126 123 130 116 130 136 142
England 130 128 137 119 133 138 143
90
100
110
120
130
140
150
2009/10 2010/11 2011/12 2012/13 2013/14 2014/15 2015/16
Predominantly rural
Predominantly urban
Entrants per 1,000
15
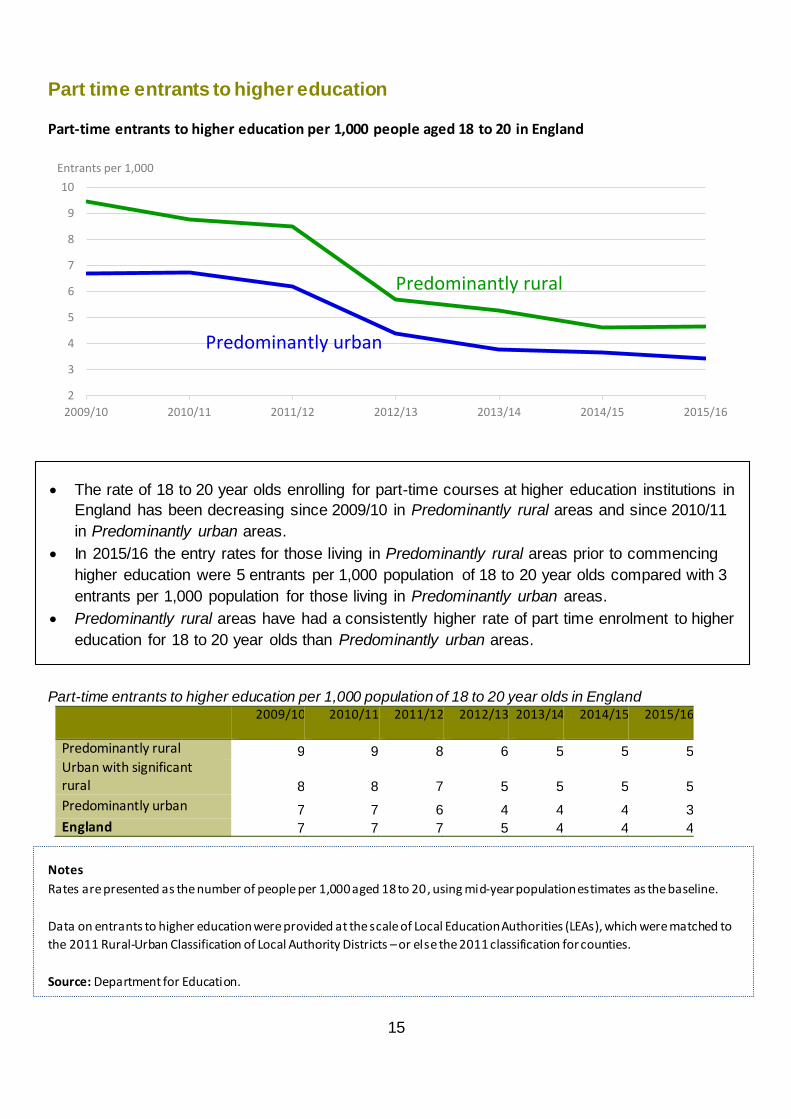
Part time entrants to higher education
Part-time entrants to higher education per 1,000 people aged 18 to 20 in England
The rate of 18 to 20 year olds enrolling for part-time courses at higher education institutions in
England has been decreasing since 2009/10 in Predominantly rural areas and since 2010/11
in Predominantly urban areas.
In 2015/16 the entry rates for those living in Predominantly rural areas prior to commencing
higher education were 5 entrants per 1,000 population of 18 to 20 year olds compared with 3
entrants per 1,000 population for those living in Predominantly urban areas.
Predominantly rural areas have had a consistently higher rate of part time enrolment to higher
education for 18 to 20 year olds than Predominantly urban areas.
Part-time entrants to higher education per 1,000 population of 18 to 20 year olds in England
2009/10
2010/11
2011/12
2012/13
2013/14
2014/15 2015/16
Predominantly rural 9 9 8 6 5 5 5 Urban with significant rural 8 8 7 5 5 5 5
Predominantly urban 7 7 6 4 4 4 3
England 7 7 7 5 4 4 4
Notes
Rates are presented as the number of people per 1,000 aged 18 to 20, using mid-year population estimates as the baseline.
Data on entrants to higher education were provided at the scale of Local Education Authorities (LEAs), which were matched to
the 2011 Rural-Urban Classification of Local Authority Districts – or else the 2011 classification for counties.
Source: Department for Education.
2
3
4
5
6
7
8
9
10
2009/10 2010/11 2011/12 2012/13 2013/14 2014/15 2015/16
Predominantly rural
Predominantly urban
Entrants per 1,000