Education & Achievement for Manitowoc County. Manitowoc City Educational Attainment.
20
Education & Achievement for Manitowoc County
-
Upload
eileen-neal -
Category
Documents
-
view
225 -
download
1
Transcript of Education & Achievement for Manitowoc County. Manitowoc City Educational Attainment.

Education & Achievement for Manitowoc County

Manitowoc City Educational Attainment
Less than high school diploma
High school graduate, GED, or alternative
Some college or associate's degree
Bachelor's degree or higher
0500
1,0001,5002,0002,5003,0003,5004,0004,5005,000
Manitowoc City Educational Attainment, Total Males 25 Years and Older
Less than high school diploma
High school graduate, GED, or alternative
Some college or associate's degree
Bachelor's degree or higher
0500
1,0001,5002,0002,5003,0003,5004,0004,5005,000
Manitowoc City Educational Attainment, Total Females 25 Years and Older
Less than high school diploma
High school graduate, GED, or alternative
Some college or associate's degree
Bachelor's degree or higher
0500
1,0001,5002,0002,5003,0003,5004,0004,500
Manitowoc City Educational Attainment, White Males 25 Years and Over
Less than high school diploma
High school graduate, GED, or alternative
Some college or associate's degree
Bachelor's degree or higher
0500
1,0001,5002,0002,5003,0003,5004,0004,5005,000
Manitowoc City Educational Attainment, White Females 25 Years and Over

Manitowoc City Educational Attainment, Continued
05
10152025
Manitowoc City Educational Attainment, Black Males 25 Years and Over
010203040
Manitowoc City Educational Attainment, Black Females 25 Years and Over
05
10152025
Manitowoc City Educational Attainment, Amer-ican Indian and Alaska Native Males 25 Years
and Over
0102030
Manitowoc City Educational Attainment, Amer-ican Indian and Alaska Native Females 25 Years
and Over
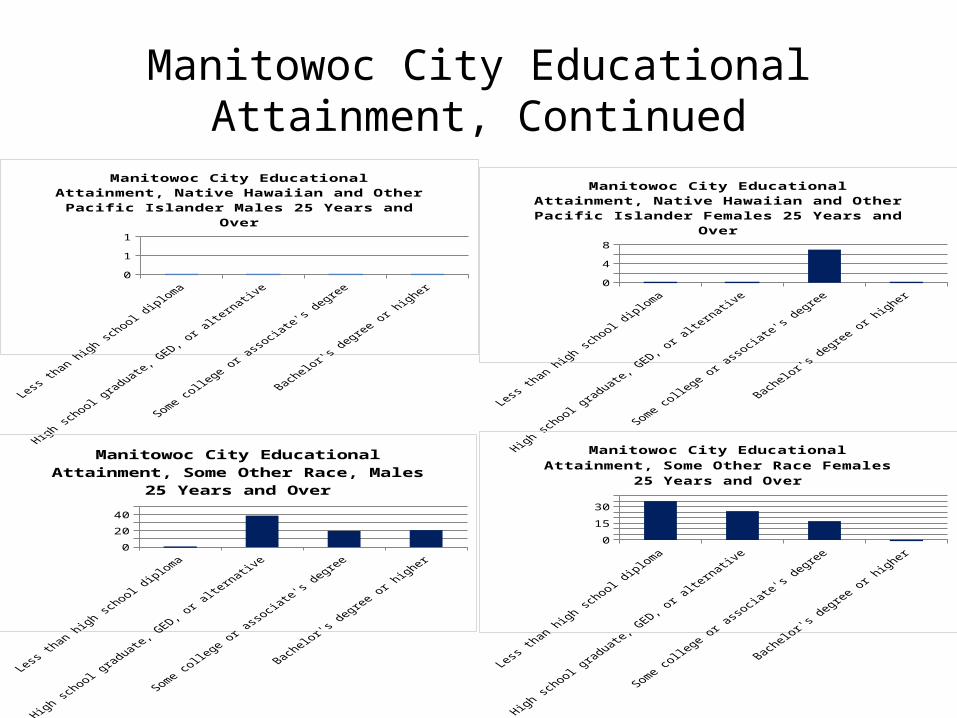
Manitowoc City Educational Attainment, Continued
0
1
1
Manitowoc City Educational Attainment, Native Hawai-ian and Other Pacific Islander Males 25 Years and Over
02468
Manitowoc City Educational Attainment, Native Hawai-ian and Other Pacific Islander Females 25 Years and
Over
010203040
Manitowoc City Educational Attainment, Some Other Race, Males 25 Years and Over
010203040
Manitowoc City Educational Attainment, Some Other Race Females 25 Years and Over

Manitowoc City Educational Attainment, Continued
0
10
20
30
Manitowoc City Educational Attainment, Two or More Races Males 25 Years and Over
010203040
Manitowoc City Educational Attainment, Two or More Races Females 25 Years and Over
04080
120160200
Manitowoc City Educational Attainment, Hispanic or Latino (any race) Males 25 Years and Over
04080
120160
Manitowoc Educational Attainment, Hispanic or Latino (any race) Females 25 Years or Over

High School Completion Rate
Manitowoc % Two Rivers % Kiel % Valders % Reedsville % Mishicot % WI %0
10
20
30
40
50
60
70
80
90
100
High School Completion Rate
4-Year Rate (2014 Cohort)5-Year Rate (2013 Cohort)6-Year Rate (2012 Cohort)

Grade Performance: Wisconsin Student Assessment System: Reading
Franklin Elementary
Jackson Elementary
Jefferson Elementary
Madison Elementary
Monroe Elementary
Stangel Elementary
WI A
verage
0102030405060708090
100
WSAS Performance 2014, MPSD
Grade 3 Reading %Grade 4 Reading %
Grade 3 Reading % Grade 4 Reading %0
102030405060708090
100
WSAS Performance 2014, Valders
Valders Elementary SchoolWI Average
Koenig Elementary Magee Elementary WI Average0
102030405060708090
100
WSAS Performance 2014, Two Rivers
Grade 3 Reading %Grade 4 Reading %
Grade 3 Reading % Grade 4 Reading %0
102030405060708090
100
WSAS Performance 2014, Reedsville
Reedsville ElementaryWI Average

Grade Performance: Wisconsin Student Assessment System: Reading
Grade 3 Reading % Grade 4 Reading %0
102030405060708090
100
WSAS Performance 2014, Kiel
Zielanis ElementaryWI Average
Grade 3 Reading % Grade 4 Reading %0
102030405060708090
100
WSAS Performance 2014, Mishicot
Schultz ElementaryWI Average

Grade Performance: Math (2014)
Clarke Middle School WI Average0
102030405060708090
100
Grade 8 Math %, Two Rivers
Grade 8 Math %
Kiel Middle School WI Average0
102030405060708090
100
Grade 8 Math %, Kiel
Grade 8 Math %
Valders Middle School WI Average0
102030405060708090
100
Grade 8 Math %, Valders
Grade 8 Math %
Washington Junior High
Wilson Junior High WI Average0
102030405060708090
100
Grade 8 Math % Manitowoc
Grade 8 Math %

Grade Performance: Math (2014)
Reedsville Middle School WI Average0
102030405060708090
100
Grade 8 Math % Reedsville
Grade 8 Math %
Mishicot Middle School WI Average0
102030405060708090
100
Grade 8 Math % Mishicot
Grade 8 Math %

Wisconsin Student Assessment Survey
Manitowoc % Two Rivers % Kiel % Valders % Reedsville % Mishicot % WI %0%
10%
20%
30%
40%
50%
60%
70%
80%
90%
100%
5 6.3 4.2 3.8 2.7 37.5
15.7 12.99.1 12.8
9.8 11.2
13.4
50.450.4
51.353.8
39.3
54.445.7
28.3 30.435.5
29.5
48.2
31.4 32.6
WSAS (Science) 2014-2015 Performance
AdvancedProficientBasicMinimal PerformanceNo WSAS

Wisconsin Student Assessment Survey, Science, 2014-2015 Total
Advanced
Proficie
ntBasi
c
Minimal
Perform
ance
No WSA
S0
102030405060
28.3
50.4
15.75 0.6
WSAS Science 2014-2015 Total for Manitowoc Public School District
Total
Advanced
Proficie
ntBasi
c
Minimal
Perform
ance
No WSA
S0
10
20
30
40
50
60
WSAS Science 2014-2015 Total for MPSDc
Econ. DisadvantagedNot Econ. Disadvantaged
Advanced
Proficie
ntBasi
c
Minimal
Perform
ance
No WSA
S0
10203040506070
WSAS Science 2014-2015 Total for Manitowoc
MaleFemale
Amer. In
dianAsia
nBlac
k
Hispan
ic
Pacific Is
leW
hite
Two or M
ore0
10
20
30
40
50
60
70
WSAS Science 2014-2015 Total for Manitowoc
AdvancedProficientBasicMinimal PerformanceNo WSAS

Wisconsin Student Assessment Survey Science 2014-2015 Grade 4
Advanced
Proficie
ntBasi
c
Minimal
Perform
ance
No WSA
S0
10203040506070
WSAS Science 2014-2015 Grade 4 for Man-itowoc
Total
Advanced
Proficie
ntBasi
c
Minimal
Perform
ance
No WSA
S0
10203040506070
WSAS Science 2014-2015 Grade 4 for Man-itowoc
Econ. DisadvantagedNot Econ. Disadvantaged
Advanced
Proficie
ntBasi
c
Minimal
Perform
ance
No WSA
S0
10203040506070
WSAS Science 2014-2015 Grade 4 for Man-itowoc
MaleFemale
Amer. Indian
Asian Black Hispanic Pacific Isle
White0
10
20
30
40
50
60
70
80
WSAS Science 2014-2015 Grade 4 for Man-itowoc
AdvancedProficientBasicMinimal PerformanceNo WSAS

Wisconsin Student Assessment Survey Science 2014-2015 Grade 8
Advanced
Proficie
ntBasi
c
Minimal
Perform
ance
No WSA
S0
102030405060
WSAS Science 2014-2015 Grade 8 for Man-itowoc
Total
Advanced
Proficie
ntBasi
c
Minimal
Perform
ance
No WSA
S0
10203040506070
WSAS Science 2014-2015 Grade 8 for Man-itowoc
Econ. DisadvantagedNot Econ. Disadvantaged
Advanced
Proficie
ntBasi
c
Minimal
Perform
ance
No WSA
S0
10203040506070
WSAS Science 2014-2015 Grade 8 for Man-itowoc
MaleFemale
Amer. In
dianAsia
nBlac
k
Hispan
ic
Pacific Is
leW
hite
Two or M
ore0
10
20
30
40
50
60
70
WSAS Science 2014-2015 Grade 8 for Manitowoc
AdvancedProficientBasicMinimal PerformanceNo WSAS
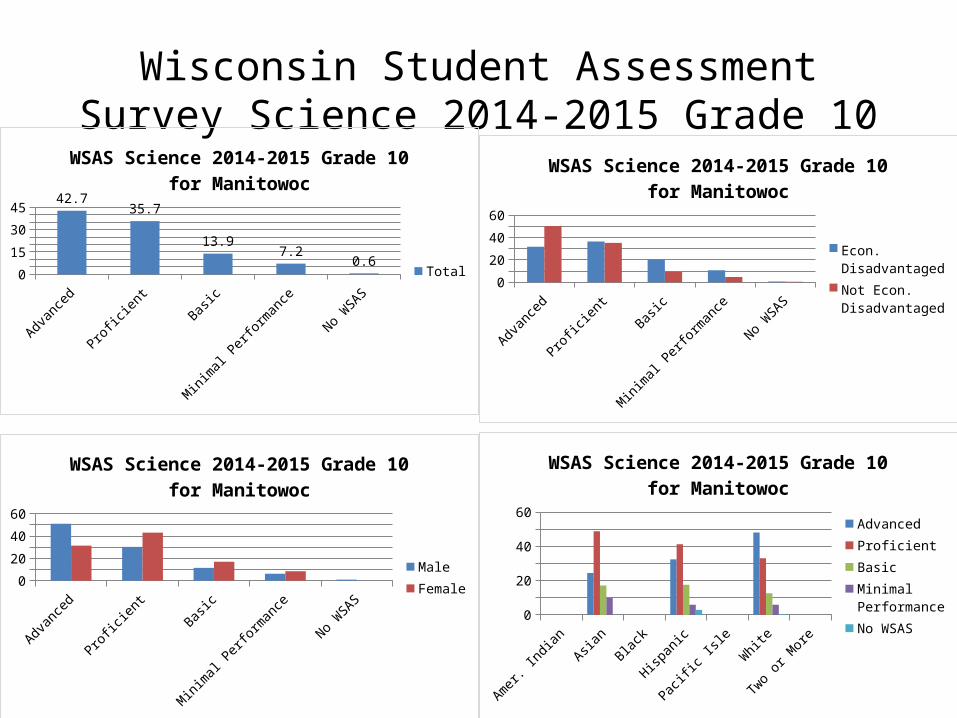
Wisconsin Student Assessment Survey Science 2014-2015 Grade 10
Advanced
Proficie
ntBasi
c
Minimal
Perform
ance
No WSA
S0
10
20
30
4042.7
35.7
13.97.2
0.6
WSAS Science 2014-2015 Grade 10 for Man-itowoc
Total
Advanced
Proficie
ntBasi
c
Minimal
Perform
ance
No WSA
S0
102030405060
WSAS Science 2014-2015 Grade 10 for Man-itowoc
Econ. DisadvantagedNot Econ. Disadvantaged
Advanced
Proficie
ntBasi
c
Minimal
Perform
ance
No WSA
S0
102030405060
WSAS Science 2014-2015 Grade 10 for Man-itowoc
MaleFemale
Amer. In
dianAsia
nBlac
k
Hispan
ic
Pacific Is
leW
hite
Two or M
ore0
10
20
30
40
50
60
WSAS Science 2014-2015 Grade 10 for Man-itowoc
AdvancedProficientBasicMinimal PerformanceNo WSAS

Wisconsin State Assessment Survey Science 2013-2014
Advanced
Proficie
ntBasi
c
Minimal
Perform
ance
No WSA
S05
1015202530354045 42.7
35.7
13.97.2
0.6
WSAS Science 2013-2014 Total for Manitowoc
Total
Advanced
Proficie
ntBasi
c
Minimal
Perform
ance
No WSA
S0
10
20
30
40
50
60
WSAS Science 2013-2014 Total for Manitowoc
Econ. DisadvantagedNot Econ. Disadvantaged
Advanced
Proficie
ntBasi
c
Minimal
Perform
ance
No WSA
S0
10
20
30
40
50
60
WSAS Science 2013-2014 Total for Manitowoc
MaleFemale
Amer. In
dianAsia
nBlac
k
Hispan
ic
Pacific Is
leW
hite
Two or M
ore0
10
20
30
40
50
60
WSAS Science 2013-2014 Total for Manitowoc
AdvancedProficientBasicMinimal PerformanceNo WSAS

Wisconsin State Assessment Survey Science 2013-2014 Grade 4
Advanced
Proficie
ntBasi
c
Minimal
Perform
ance
No WSA
S0
102030405060
19
54.7
21.8
4.5
WSAS Science 2013-2014 Grade 4 for Man-itowoc
Total
Advanced
Proficie
ntBasi
c
Minimal
Perform
ance
No WSA
S0
10203040506070
WSAS Science 2013-2014 Grade 4 for Man-itowoc
Econ. DisadvantagedNot Econ. Disadvantaged
Advanced
Proficie
ntBasi
c
Minimal
Perform
ance
No WSA
S0
102030405060
WSAS Science 2013-2014 Grade 4 for Man-itowoc
MaleFemale
Amer. In
dianAsia
nBlac
k
Hispan
ic
Pacific Is
leW
hite
Two or M
ore0
10203040506070
WSAS Science 2013-2014 Grade 4 for Man-itowoc
AdvancedProficientBasicMinimal PerformanceNo WSAS

Wisconsin State Assessment Survey Science 2013-2014 Grade 8
Advanced
Proficie
ntBasi
c
Minimal
Perform
ance
No WSA
S0
102030405060
27.6
55
12.35.1
WSAS Science 2013-2014 Grade 8 for Man-itowoc
Total
Advanced
Proficie
ntBasi
c
Minimal
Perform
ance
No WSA
S0
10203040506070
WSAS Science 2013-2014 Grade 8 for Man-itowoc
Econ. DisadvantagedNot Econ. Disadvantaged
Advanced
Proficie
ntBasi
c
Minimal
Perform
ance
No WSA
S0
1020304050607080
WSAS Science 2013-2014 Grade 8 for Man-itowoc
MaleFemale
Amer. In
dianAsia
nBlac
k
Hispan
ic
Pacific Is
leW
hite
Two or M
ore0
10203040506070
WSAS Science 2013-2014 Grade 8 for Man-itowoc
AdvancedProficientBasicMinimal PerformanceNo WSAS

Wisconsin Student Assessment Survey Science 2013-2014 Grade 10
Advanced
Proficie
ntBasi
c
Minimal
Perform
ance
No WSA
S0
10
20
30
40 36.1 39.2
12.2 11.7
0.8
WSAS Science 2013-2014 Grade 10 for Man-itowoc
Total
Advanced
Proficie
ntBasi
c
Minimal
Perform
ance
No WSA
S0
102030405060
WSAS Science 2013-2014 Grade 10 for Man-itowoc
Econ. DisadvantagedNot Econ. Disadvantaged
Advanced
Proficie
ntBasi
c
Minimal
Perform
ance
No WSA
S0
10
20
30
40
50
WSAS Science 2013-2014 Grade 10 for Man-itowoc
MaleFemale
Amer. In
dianAsia
nBlac
k
Hispan
ic
Pacific Is
leW
hite
Two or M
ore0
10
20
30
40
50
60
WSAS Science 2013-2014 Grade 10 for Man-itowoc
AdvancedProficientBasicMinimal PerformanceNo WSAS

ACT Performance
Manito
woc %
Two Rive
rs %
Kiel %
Valders
%
Reedsvi
lle %
Mishico
t % WI %-4
1
6
11
16
21
26
31
36
21.4 22.2 23.2 22.8 22.2 22.5 22.1
Average ACT Score
Average ACT Score
Manito
woc %
Two Rive
rs %
Kiel %
Valders
%
Reedsvi
lle %
Mishico
t % WI %
0102030405060708090
100
55.5
39.2
67.3 64.151.7
71.963.5
ACT Participation Rate
ACT Participation Rate
Manito
woc %
Two Rive
rs %
Kiel %
Valders
%
Reedsvi
lle %
Mishico
t % WI %
0
5
10
15
20
25
30
ACT Scores By Economic Status
Not Economically Dis-advantagedEconomically Disadvan-tagedUnknown