EDUCATION 4 INDICATORS INFOCUS - OECD.org · education data education evidence education policy...
4
education data education evidence education policy education analysis education statistics 4 IN 2012/04 (April) 1 Education Indicators in Focus – 2012/04 (April) © OECD 2012 EDUCATION INDICATORS FOCUS How pronounced is income inequality around the world – and how can education help reduce it? Income inequality has risen in most OECD countries in recent years. High inequality may limit the income prospects of future generations. Income inequality isn’t just a concern for today: it may also affect individuals’ income prospects in the future. OECD research shows that the level of income inequality in a country is associated with the level of earnings mobility between generations. Regardless of whether income inequality is high or low, an individual’s skills and abilities are a key factor in determining whether they can get a good job and move up the income ladder. Yet in countries with higher income inequality – such as Italy, the United Kingdom, and the United States – a child’s future economic standing is often closely related to the income level of his or her parents. This suggests that socio-economic background plays a strong role in the development of children’s skills and abilities in these countries. By contrast, in countries with lower income inequality – like Denmark, Finland, and Norway – a child’s future income as an adult is not as strongly related to his or her family’s income status, suggesting that socio-economic factors have a weaker influence on the development of children’s skills and abilities. This implies that policies In recent years, the economic crisis and the transformation of the global labour market have put the issue of income inequality on center stage – and with good reason. Across most OECD countries, the income gap between the rich and the poor has widened over the past three decades. Before the onset of the crisis, the income of the wealthiest 10% of the population was about nine times that of the poorest 10%, on average among OECD nations. Even in countries like Denmark, Germany and Sweden, where historically income inequality has been less pronounced, the earnings ratio of the richest compared to the poorest increased from 5 to 1 in the 1980s to more than 6 to 1 today. This ratio is 10 to 1 in Italy, Japan, Korea and the United Kingdom, 14 to 1 in Israel, Turkey and the United States, and more than 25 to 1 in Chile and Mexico, although income inequality has recently fallen in these last two countries. Across OECD countries, the average income of the richest 10% of the population was about nine times that of the poorest 10% before the onset of the global economic crisis. High levels of income inequality are associated with low levels of earnings mobility between generations in a number of countries. Education policies that promote equity and support disadvantaged students in achieving better academic outcomes may help reduce income inequality in the future. Four top performers on the 2009 PISA assessment – Canada, Finland, Japan, and Korea – put a strong focus on equity in their education systems.
Transcript of EDUCATION 4 INDICATORS INFOCUS - OECD.org · education data education evidence education policy...
education data education evidence education policy education analysis education statistics
4 IN2012/04 (April)
1Education Indicators in Focus – 2012/04 (April) © OECD 2012
EDUCATION INDICATORS FOCUS
How pronounced is income inequality around the world – and how can education help reduce it?
Income inequality has risen in most OECD countries in recent years.
High inequality may limit the income prospects of future generations.Income inequality isn’t just a concern for today: it may also affect individuals’ income prospects in the future. OECD research shows that the level of income inequality in a country is associated with the level of earnings mobility between generations.
Regardless of whether income inequality is high or low, an individual’s skills and abilities are a key factor in determining whether they can get a good job and move up the income ladder. Yet in countries with higher income inequality – such as Italy, the United Kingdom, and the United States – a child’s future economic standing is often closely related to the income level of his or her parents. This suggests that socio-economic background plays a strong role in the development of children’s skills and abilities in these countries.
By contrast, in countries with lower income inequality – like Denmark, Finland, and Norway – a child’s future income as an adult is not as strongly related to his or her family’s income status, suggesting that socio-economic factors have a weaker influence on the development of children’s skills and abilities. This implies that policies
In recent years, the economic crisis and the transformation of the global labour market have put the issue of income inequality on center stage – and with good reason. Across most OECD countries, the income
gap between the rich and the poor has widened over the past three decades.
Before the onset of the crisis, the income of the wealthiest 10% of the population was about nine times that of the poorest 10%, on average among OECD nations. Even in countries like Denmark, Germany and Sweden, where historically income inequality has been less pronounced, the earnings ratio of the richest compared to the poorest increased from 5 to 1 in the 1980s to more than 6 to 1
today. This ratio is 10 to 1 in Italy, Japan, Korea and the United Kingdom, 14 to 1 in Israel, Turkey and the United States, and more than 25 to 1 in Chile and Mexico, although income inequality has recently
fallen in these last two countries.
Across OECD countries, the average income of the richest 10% of the population was about nine times that of the poorest 10% before the onset of the global economic crisis.
High levels of income inequality are associated with low levels of earnings mobility between generations in a number of countries.
Education policies that promote equity and support disadvantaged students in achieving better academic outcomes may help reduce income inequality in the future.
Four top performers on the 2009 PISA assessment – Canada, Finland, Japan, and Korea – put a strong focus on equity in their education systems.
education data education evidence education policy education analysis education statistics
© OECD 2012 Education Indicators in Focus – 2012/04 (April) 2
EducAtion indicAtors IN focus
Equity-based education policies can be a key tool for reducing income inequality in the future.
Some countries are already seeing the promise of equity-based policies.
Income inequality is a complex problem that demands multifaceted policy solutions. However, education policies – particularly those that concentrate on equity – may be among the most powerful levers countries have to reduce it in the future. OECD research has shown that a more equitable distribution of educational opportunities typically results in a more equitable distribution of labour income in countries. It’s also clear that people with higher levels of education have a large competitive advantage in the labour market, both in good and bad economic periods. Therefore, education policies that emphasise equity – and help both disadvantaged and advantaged students achieve strong academic outcomes, continue on to higher levels of education, and eventually secure good jobs – could foster greater intergenerational earnings mobility and reduce income inequality over time.
Indeed, the results of the OECD’s PISA assessment show the potential of such an approach. On the 2009 reading assessment, for instance, Canada, Finland, Japan and Korea were all top performers. They all had large proportions of students performing at the highest proficiency levels, and relatively few students at the lower proficiency levels.
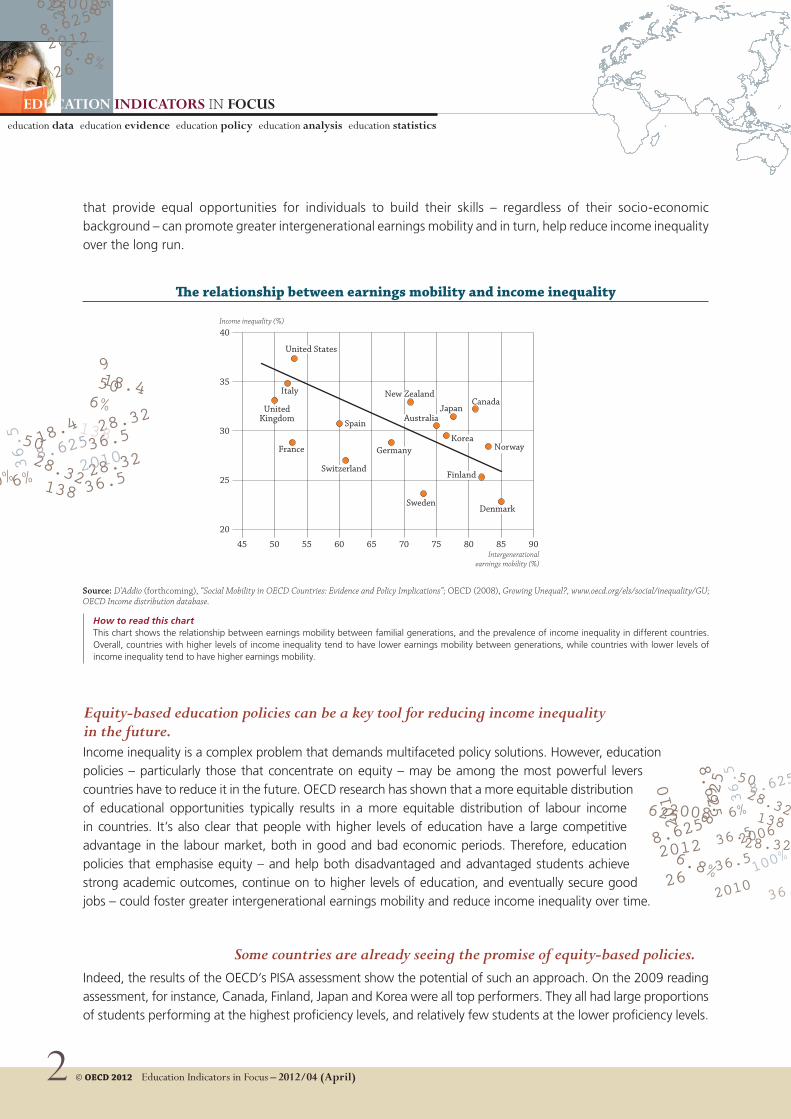
How to read this chartThis chart shows the relationship between earnings mobility between familial generations, and the prevalence of income inequality in different countries. Overall, countries with higher levels of income inequality tend to have lower earnings mobility between generations, while countries with lower levels of income inequality tend to have higher earnings mobility.
that provide equal opportunities for individuals to build their skills – regardless of their socio-economic background – can promote greater intergenerational earnings mobility and in turn, help reduce income inequality over the long run.
40
35
30
25
20
45 50 55 60 65 70 75 80 85 90
Income inequality (%)
Intergenerationalearnings mobility (%)
�e relationship between earnings mobility and income inequality
Source: D'Addio (forthcoming), “Social Mobility in OECD Countries: Evidence and Policy Implications”; OECD (2008), Growing Unequal?, www.oecd.org/els/social/inequality/GU; OECD Income distribution database.
Canada Japan
Sweden
Spain
France
Italy
Norway
Finland
Australia
Korea
Denmark
Switzerland
UnitedKingdom
United States
New Zealand
Germany
education data education evidence education policy education analysis education statistics
3
EducAtion indicAtors IN focus
Education Indicators in Focus – 2012/04 (April) © OECD 2012
60
50
40
30
20
10
0
Percentage of resilient students
Kor
ea
Finl
and
Japa
n
Turk
ey
Cana
da
Port
ugal
Pola
nd
New
Zea
land
Spai
n
Esto
nia
Net
herla
nds
Ital
y
Switz
erla
nd
Aust
ralia
Fran
ce
Belg
ium
Irel
and
Icel
and
Mex
ico
Uni
ted
Stat
es
Gre
ece
Nor
way
Hun
gary
Swed
en
Slov
enia
Den
mar
k
Chile
Uni
ted
Kin
gdom
Isra
el
Ger
man
y
Czec
h Re
publ
ic
Slov
ak R
epub
lic
Luxe
mbo
urg
Aust
ria
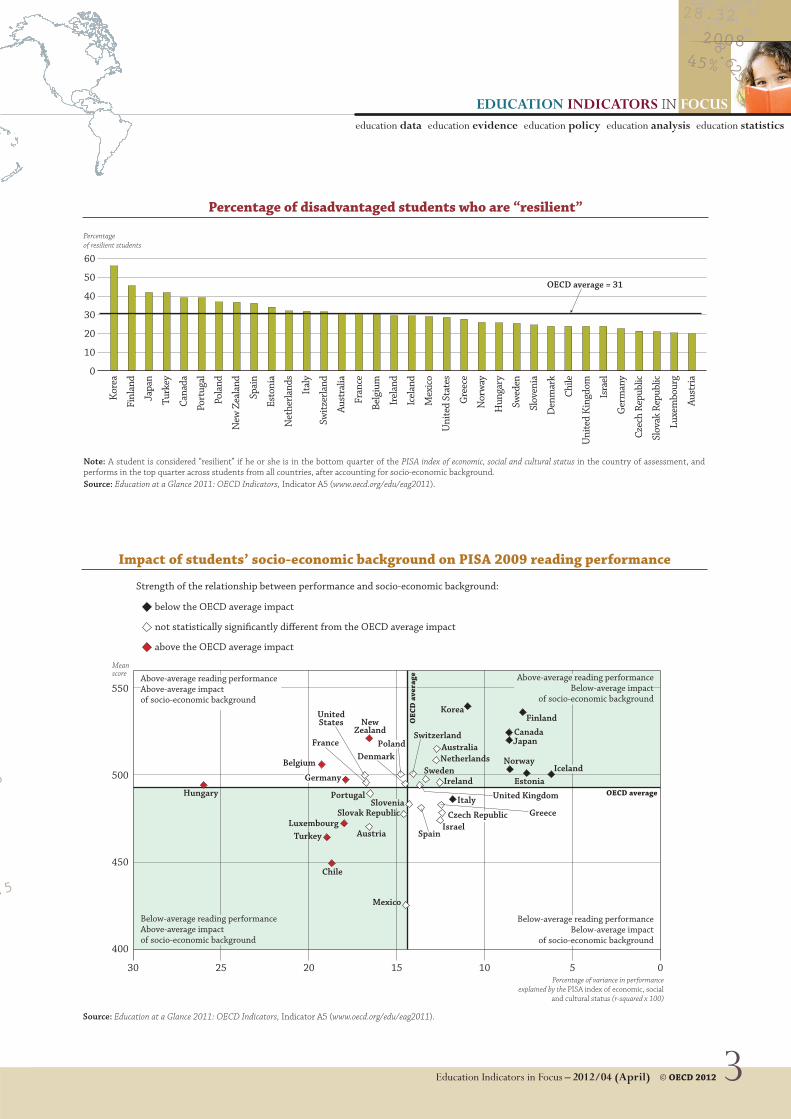
Percentage of disadvantaged students who are “resilient”
Note: A student is considered “resilient” if he or she is in the bottom quarter of the PISA index of economic, social and cultural status in the country of assessment, and performs in the top quarter across students from all countries, after accounting for socio-economic background.Source: Education at a Glance 2011: OECD Indicators, Indicator A5 (www.oecd.org/edu/eag2011).
OECD average = 31
550
500
450
400
Mean score
Percentage of variance in performanceexplained by the PISA index of economic, social
and cultural status (r-squared x 100)
Impact of students’ socio-economic background on PISA 2009 reading performance
30 25 20 15 10 5 0
Iceland
OECD average
OEC
D a
vera
ge
Source: Education at a Glance 2011: OECD Indicators, Indicator A5 (www.oecd.org/edu/eag2011).
Strength of the relationship between performance and socio-economic background:
below the OECD average impact
not statistically signi�cantly di�erent from the OECD average impact
above the OECD average impact
Belgium
Luxembourg Turkey
Hungary
Chile
New Zealand
Netherlands
Switzerland
United Kingdom
Denmark
Sweden
Israel Austria
Portugal
Spain
Mexico
Greece Slovak Republic
Ireland
United States
France Australia Japan
Italy
Norway
Finland Canada
Korea
Estonia
Above-average reading performanceAbove-average impact of socio-economic background
Below-average reading performanceAbove-average impact of socio-economic background
Above-average reading performanceBelow-average impact
of socio-economic background
Below-average reading performanceBelow-average impact
of socio-economic background
Slovenia
Germany
Poland
Czech Republic
© OECD 2012 Education Indicators in Focus – 2012/04 (April)4
EducAtion indicAtors IN focuseducation data education evidence education policy education analysis education statistics
Coming next month:How is the global talent pool changing?
For more information, contact:Ji Eun Chung ([email protected])
See:Education at a Glance 2011: OECD IndicatorsDivided We Stand: Why Inequality Keeps RisingEquity and Quality in Education
Visit:www.oecd.org/edu
the bottom line
These countries also have something else in common: education systems that put a strong focus on equity. From a policy perspective, they strive to provide high-quality education to all students and to minimise
large variations in school performance through an equitable distribution of resources and opportunities. In Japan and Korea, for example, teachers and principals are often reassigned to different schools in
order to foster more equal distribution of the most capable teachers and school leaders. In Finland, the teaching profession is a highly selective occupation, with highly-skilled, well-trained teachers spread throughout the country. Finnish schools also assign specially-trained teachers to support struggling students who are at risk of dropping out. In Canada, equal or greater educational resources – such as supplementary classes – are provided to immigrant students, compared to non-immigrant students. This is believed to have boosted immigrant students’ performance.
Towards a Skills Strategy…While promoting strong and equitable education outcomes is likely an important long-term strategy
for tackling inequality, individuals also need help now to acquire the skills they need to succeed in the globally competitive, knowledge-based economy. Countries also need sound approaches to
bridge the skills gap, deal with ageing societies and declining skills pools, prioritise investment of scarce resources, and deal with both the supply and demand side of skills needs. The OECD is supporting
countries’ efforts to address these issues – and more – with the launch of the OECD Skills Strategy in May 2012.
Furthermore, they had higher-than-average proportions of “resilient” students – that is, students who performed better than would be predicted from their socio-economic backgrounds. In each country, the strength of the relationship between students’ performance and their socio-economic background was below the OECD average.
Photo credit: © Ghislain & Marie David de Lossy/Cultura /Getty Images
in an era of growing inequality, education policies that focus on equity may be an effective way to increase income mobility between generations and reduce income disparities in the future.