EDRS VICE HC-$6.97 PLUS POSTAGE - files.eric.ed.gov · test scores, it would be valuable ......
135
;.DOCUMENT RESUME ED 106 316 TN 004 427 AUTHOR Wyman, W.C.; Wright, E.N. TITLE Exploring the T.R.Q. An Assessment of the Effectiveisss of the Teachers' Rating Questionnaire. Paper No. 123. INSTITUTION Toronto Board of Education (Ontario). Research Dept. PUB DATE May 74 NOTE 136p.; For related documents, see TN 004 421-427 EDRS VICE HF-$0.76 HC-$6.97 PLUS POSTAGE DESCRIPTORS Academic Achievement; Correlation; Elementary Education; Predictive Ability (Testing); Predictor Variables; *Questiofinaires; *Rating Scales; *Student Evaluation; Test Construction; Testing Problems; *Test Reliability; *Test Validity IDENTIFIERS Canada; *Teachers Rating, Questionnaire ABSTRACT This report assesses the validity, reliability, and efficiency of the Teachers' Rating Questionnaire (TRQ), a pupils' school success measure developed in connection with a 1961 longitudinal Study of Achievement. TRQ ratings on nearly 14,000 pupils, gathered in the Study of Achievement and a New Canadian Report, constituted the data source. Questionnaire performance was determined in a variety of ways: comparison of teachers' ratings and student promotions estimation of TRQ total score, section and question reliability; grade independence; and relationships between TRQ sections. In addition to a theoretical discussion of item effectiveness and correlations among items a detailed statistical analysis was undertaken of the ratings for a sample of students who had been assessed on all forms in the longitudinal study. While validity of TRQ adjustment and creative-expression sections was not directly demonstrated, a reasonable degree of correlation with other measures of academic success (standardized achievement test, I.Q., promotios) was found reflecting the overall validity of the TRQ, especially the performance section. A large part of the differences between any two sets of TRQ ratings were found due to differences in teacher interpretation and their perceptions of pupils. (Author/BJG)
Transcript of EDRS VICE HC-$6.97 PLUS POSTAGE - files.eric.ed.gov · test scores, it would be valuable ......

;.DOCUMENT RESUME
ED 106 316 TN 004 427
AUTHOR Wyman, W.C.; Wright, E.N.TITLE Exploring the T.R.Q. An Assessment of the
Effectiveisss of the Teachers' Rating Questionnaire.Paper No. 123.
INSTITUTION Toronto Board of Education (Ontario). ResearchDept.
PUB DATE May 74NOTE 136p.; For related documents, see TN 004 421-427
EDRS VICE HF-$0.76 HC-$6.97 PLUS POSTAGEDESCRIPTORS Academic Achievement; Correlation; Elementary
Education; Predictive Ability (Testing); PredictorVariables; *Questiofinaires; *Rating Scales; *StudentEvaluation; Test Construction; Testing Problems;*Test Reliability; *Test Validity
IDENTIFIERS Canada; *Teachers Rating, Questionnaire
ABSTRACTThis report assesses the validity, reliability, and
efficiency of the Teachers' Rating Questionnaire (TRQ), a pupils'school success measure developed in connection with a 1961longitudinal Study of Achievement. TRQ ratings on nearly 14,000pupils, gathered in the Study of Achievement and a New CanadianReport, constituted the data source. Questionnaire performance wasdetermined in a variety of ways: comparison of teachers' ratings andstudent promotions estimation of TRQ total score, section andquestion reliability; grade independence; and relationships betweenTRQ sections. In addition to a theoretical discussion of itemeffectiveness and correlations among items a detailed statisticalanalysis was undertaken of the ratings for a sample of students whohad been assessed on all forms in the longitudinal study. Whilevalidity of TRQ adjustment and creative-expression sections was notdirectly demonstrated, a reasonable degree of correlation with othermeasures of academic success (standardized achievement test, I.Q.,promotios) was found reflecting the overall validity of the TRQ,especially the performance section. A large part of the differencesbetween any two sets of TRQ ratings were found due to differences inteacher interpretation and their perceptions of pupils.(Author/BJG)

U.S DEPARTMENT OF HEALTH.EDUCATIONS WELFARENATIONAL INSTITUTE OF
EDUCATIONTHIS DOCUMENT HAS SEEN REPRODUCE° EXACTLY AS RECEIVED FROMTHE PERSON OR ORGANIZATION ORIGINATING IT POINTS OF VIEW OR OPINIONSSTATED DO NOT NECESSARILY REPRESENT OFFICIAL NATIONAL INSTITUTE OFEOUCATION POSITION OR POLICY
JAN. 1 7 1975
SCOPE OF INTEREST NOTICE
The ERIC Facility has assignedthis document rto:
In our Judgement, this docun*ntis also of interest to the clearing-houses noted to the right. Index.mg should reflect their specialpoints of view.
EXPLORING THE T.R.Q.
An Assessment of the Effectiveness of theTeachers' Rating auestionnaire
#123
W. C. WymanE. N. Wright
May IT
RFSEARCH SERVICissued by the
Research Department
THE BOARD OF EDUCATION FOR THE C OF TORONTO
0 0 4) 1) 2

TABLE OF CONTENTS
Page No..
PREFACE
INTRODUCTION 1
PART I - BACKGROUND 4
History of the Teachers' RatingLQuestionnaire 4
Organization of the Teachers' Rating Questionnaire 5
How is the Test Scored? 7
How Do We Know If the Test is Any Good? 10
A Previous Assessment of the 3+ Questionnaire 13
Purpose of This Study 16
Origin of the Data for This Study 17
PART II - PERFORMANCE OF THE QUESTIONNAIRE 19
Teachers' Ratings and Promotions (A Validity Study) 19
EstimiSec)reRe 23
Estimation of Reliability (TRQ 3+ Sections, andQuestions) 34
Grade Independence of the Grade 3+ Version 40Relationship Between the TRQ Sections 41
PART III - HOW CAN THE TEACHERS' RATING QUESTIONNAIREBE IMPROVED? 47
Effectiveness of the Individual Questions - Theory 47
Effectiveness of the Individual 'uest!ors - Data 59
Contributions of the Individual Questions 69
Correlations Between Questions - Thtom 71
Correlations Between Questions - Data 81
Proposed New Sections 94Reliability and Predictive Ability of the New SectIms 99
PART IV - CONCLUSIONS AND SUMMARY 108
Conclusions 108
Summary 113
REFERENCES 117
APPENDIX A 118
APPENDIX B 121
APPENDIX C 123

- i -
PREFACE
This report is designed for both teachers and educational
researchers who intend totse the Teachers' Rating Questionnaire. It
focuses exclusively on the questionnaire itself as an instrument for
measuring pupils' school success. Although advanced statistical
procedures have been used in analyzing the data for this report, no
prior experience with statistical concepts on the part of the reader
has been assumed. The few statistical concepts which are required
are described completely in the Appendix. With this help the reader"
who has no special mathematical or statistical abilities should be
able to read anc understand the entire report, although some sections,
especially in Part Three, may be rather heavy going. Readers who
wish to examine the particular mathematical and statistical procedures
used in generating the data are referred to the Technical Supplement
to this report which will be published separately.
00005t
.1,, .0

INTRODUCTION
In 1961 the Research Department of the Toronto Board of
Education undertook a longitudinal Study of Achievement, in which a
sample of over 8,000 pupils then in senior kindergarten were to be
followed through subsequent school grades. (Those who attended junior
kindergarten were identified the previous year.) Since the study was
to focus broadly on many aspects of achievement, it was felt that in
addition to the usual measures such as grades, I.Q., and standardized
test scores, it would be valuable to collect information on the
teachers' perceptions of their pupils' performance and achievement.
A questionnaire was designed in which teachers were asked
to rate their pupils in a series of behavioural situations relating
to five important aspects of the kindergarten programme. Analysis
of the results of these ratings by kindergarten teachers showed that
teachers' perceptions of their students' success did fit, in an
interesting manner, into the general achievement pattern. Additional
Teachers' Rating Questionnaires wc,re designed for subsequent years of
the Study of Achievement, and use of this instrument has been extended
to other studies conducted by the Research Department.
It is our opinion that the Teachers' Rating Questionnaire
can be a useful measuring instrument for both teachers and educational
researchers. It is an unobtrurive measure (Webb, et al., 1966 ) in
that it measures pupils' school success without interfering with the
pupils' activities. Pupils need not be aware that they are being rated.
This method of measurement is particularly useful in a longitudinal
study such as the Study of Achievement where repeated direct testing
0 0 0 0 0

2
of the children could itself affect their acridemi,-; attitudes and achieve-
ments. At a time when increasing public concern is being expressed
concerning the use of standardized tests, the Teachers' Rating Question-
naire presents a viable alternative. Thus, we believe that educational
researchers could well find this method of measuring pupil achievement
to be a useful one.
This questionnaire is of even more potential value as-an
instrument for measuring the differences in teachers' perceptions of
their pupils. Russell Grieger (1971) in a review of studies about perceptions
of pupils by teachers, concludes that teachers are influenced by the
child's socio-economic class, sex and style of dress and speech,
as well as by his actual abilities, in their evaluations of the child.
The Teachers' Rating Questionnaire has been carefully developed to
measure teachers' perceptions of the most important aspects of the child's
achievement.
The questionnaire is not :estricted in usefulness to educational
research. Teachers may find it useful in providing a framework in which
to evaluate their pupils. With decreasing emphasis being placed on
report card grades, many teachers feel lost in attempting to arrive at
a global assessment of their students. The specific questions on the
Teachers' Rating Questionnaire have been designed to cover the important
areas of pupil development, so the questionnaire could well serve as
a check list for teachers who wish to balance all aspects of the child's
development in their evaluation. The Kindergarten Department has already
made the questionnaire available to their teache=s for this purpose.
In accordance with its belief in the usefulness of the Teachers'
Rating Questionnaire, the Research Department has undertaker a series
000,07

3
of evaluatie studies of the instrument, the results of which are contained
in this report. The report is organized as a handbook for users of the
questionnaire. It is arranged in such a way that casual users of the
questionnaire can read just the first few sections of the report to
gain sufficient information to usefully employ the questionnaire. More
serious users will want to read all of Parts One and Two of the report
to gain information on the limits of the effectivenss of the question-
naire, while serious research users who wish to design their own
Teachers' Rating Questionnaire or who wish to adapt our questionnaire
to their own use will find information on evaluating the individual
questions and sections of the test in Part Three of the report. Part
Three also includes many specific suggestions for future improvement of
our current version of the questionnaire.
tiVOOL.,

- 4
PART I - BACKGROUND
History of the Teachers' Rating Questionnaire
The Teachers' Rating Questionnaire was originally developed
in connection with a longitudinal Study of Achievement (1964). Teachers'
ratings were sought because it was believed that the teachers' judge-
ment of his/her pupils was an important aspect of achievement, and
because obtaining ratings of pupils from their teachers reduced the
intervention of the researchers in the normal school experience of the
pupils.
For the initial kindergarten year of the study, and for each
subsequent year, the Research Department developed a questionnaire which
asked teachers to rate their pupils in behavioural situations typical
of children of their particular grade level. When it came time to
revise the rating scale for the grade three stage of the study, it was
decided to change it so that it referred to general, rather than specific
behavioural situations. This change in strategy resulted in a question-
naire which was both shorter than the previous questionnaire, and was
applicable over a wide range of grade levels. Consequently, there
now exist four basic versions of the Teachers' Rating Questionnaire;
there are specific versions for senior kindergarten, grade one, and
grade two, and there is a general version suitable for application to
grades three to nine.
Over the years, these basic versions of the questionnaire have
been used, with slight modifications, for other purposes. A form similar
to the kindergarten questionnaire was designed for the use of kindergarten
teachers in the Fall, so that pupils' ratings could be compared to the

5
regular kindergarten questionnaire (also slightly revised) to be
administered in the Spring. These questionnaires, called respectively
the Fall and June Questionnaires, are available to kindergarten teachers
thiough the Kindergarten Department.
A reduced form of the grade-three-plus version of the Teachers'
Rating Questionnaire was used in an extensive study comparing Canadian-
*born with New Canadian students in grades five, seven and nine . Since,
in some classes, the ratings were r de by the students' English teachers,
three of the questions (e.g.,the one on mathematical ability) were
thought inappropriate and were removed for purposes of the study.
Organization of the Teachers' Rating Questionnaire
As we have seen, there are four basic versions of the Teachers'
Rating Questionnaire. These are abbreviated as follows:
TRQ-SK -- for senior kindergarten teachers
TRQ-1 -- for grade one teachers
TRQ-2 -- for grade two teachers
TRQ-3+ -- for teachers of grades three to nine.
For simplicity, these abbreviations will be used throughL.ut this report.
Since the organization of the SK, 1 and 2 versions of the
TRQ differ slightly from the 3+ version, they will be described first.
Versions SK, 1 and 2 each consist of five sections concerned
with five different aspects of the child's school success. Each section
consists of a number of questions describing related specific behavioural
situations on which the child is to be rated. The five sections entitled,
"Language," "Mental," "Social," "Emotional," and "Physical" are illustrated
below by a representative question drawn from each section of the grade
one questionnaire.
* For Research Department reports dealing with this study, see Wright,
1970.
0(010 10

Language:
Mental:
Social:
Emotional:
Physical:
6
"[Does the child] frequently speak freelyand fluently in compound or complex
sentences?"
"[Does the child] with a minimum of teacherhelp, frequently follow the current topicin a discussion or reading period?"
"[Does the child] take responsibility for,and carry out, simple classroom tasks witha minimum of teacher help?"
"[Does the child] have sufficient emotionalstability to accept teacher guidance, andseek help, when it is really needed?"
"[Can the child] work with a ball includingbouncing, catching, rolling and throwingwith some accuracy?"
Many of these questions refer to specific behaviours, or
levels of development, which are appropriate for only one grade level,
Thus, in only a few instances does a question appear on two question-
naire versions without a considerable degree of recording. Although
the wording of questions differs considerably across questionnaire
versions, a distinct effort was made to choose similar behavioural
situations for each of the three versions. Differences that do occur
between the questionnaire versions are the result of redefining the
behavioural situations so that they would be applicable to children
at the higher grade level. The following three questions illustrate
this upgrading procedure. Each question is concerned with the child's
arithmetic ability and is included in the "mental" section of the test.
The specific behaviours differ considerably between the three grades
reflecting the rapid development of this ability in the early grade
levels.
0 0 Olt

7
Senior Kindergarten: "[Can the child] count up to fiveobjects, or people, or things ina picture?"
Grade one: "[Does the child] have sufficicntmaturity to do some productivework (review lessons, new lessonsand seatwork, etc.) at thecurrent classroom level in
arithmetic?"
Grade two: "[Does the child] have the abilityto explore and understandmathematical concepts, with aminimum of help from the teacher?"
The 3+ versions of the questionnaire is also arranged in
sections, but these sections are entitled "Performance," "Adjustment,"
"Creativity" and "Prediction (of future school success)." Also, the
questions on the 3+ version refer to general rather than specific
behavioural situations. The following are representative questions:
Performance:
Adjustment:
Prediction:
"[Does the child] read with comprehensionand fluency; (and) convey meaning tolisteners?"
"[Does the child] show an urge to exploreand create; is [he or she] intuitive?"
"Provide your estimate of this child'sability; try to predict how far you thinkhe will go'[in school]?"
How is the Test Scored?
For each of the questions on each of the TRQ versions the
same basic rating procedure is used. The teacher has a choice of five
ratings he can give the pupil. These are "0," "2," "4," "6," and "8";
the odd valued numbers are not used. The ratings are assigned to the
pupils to indicate their ability relative to their peers. A rating of:
"0" indicates "much inferior,""2" indicates "somewhat inferior,""4" indicates "about average,""6" indicates "somewhat superior," and"8" indicates "much superior."
0'0011 12

- 8
The questionnaire includes examples for each of the five
ratings for every question. The following example comes from the
"Physical" section of the grade one questionnaire:
"[Can the child] gallop, hop on one foot andskip in a forward direction?
Rate 0 -- cannot hop on one foot, gallopand skip
Rate 2 -- attempts some or all of theseactivities and can do one or two(e.g., can gallop but cannot skip)
Rate 4 -- performs as described in the question
Rate 6 -- consistently performs these activitieswith ease and coordination
Rate 8 -- can also hop and skip backwards, andcan gallop sideways and backwards.
A pupil's score on each section of the test is computed
by adding up the scores for the questions in that section. And the
total of all the questions (which is the same as the total of all the
sections) is the pupil's score on the test. For example, since there
are 40 questions on the senior kindergarten questionnaire, a pupil can
score anywhere between 0 and 320 on that test.
Although the above method of scoring is very easy, there are
some problems that users should be aware of. Each section on each of
the versions contains a different number of questions, as is shown in
Table 1. Because of this, some of the sections make a larger contribution
to the total TRQ score than do others. Also, the relative contributions
of the various sections differ from one questionnaire version to another.
Users of the test may wish to standardize the amounts that the various
sections contribute to the total score. Suppose that it was decided that
each of the five sections of the gr:le one questionnaire should contribute
equally to the total. The first step is to calculate the student's
average score for each section. Then these average scores are summed to
give a total score which is thus contributed to equally by all five sections.
-rQ4k13 13

9
TABLE 1
NUMBER OF QUESTIONS IN EACH SECTION FOR EACHVERSION OF THE TEACHERS' RATING QUESTIONNAIRE (TRQ)
Section SIC 1 2 Section 3+
Language 9 9 9 Performance 5
Mental 15 9 6 Adjustment 4
Social 5 5 4 Creativity 2
Emotional 6 7 5 Prediction 1
Physical 5 3 3
TOTAL 40 33 27 TOTAL 12
The user may choose to go one step further and specify
unequal weights for the five test sections. Suppose that it is decided
to compute a test total score which is contributed to by each of the
sections in the following manner: 25% Language, 25% Mental, 20% Social,
20% Emotional, and 10% Physical. Again, we first calculate the average
rating given the pupil for each section. A weighted total can be
easily computed by:
Total = (25 x language average) + (25 x mental average) +
(20 x social average) + (20 x e.aotional average) +
(10 x physical average).
In this case, the "total" is independent of the number of questions in
the sections of the test. Use of a weighted average method similar to
this could make the total scores of the SK, 1 and 2 versions more
comparable.
In this report a statistical technique which is slightly more
sophisticated than the above has been used to compare scores between
sections of the TRQ and between questionnaire versions. This method is
..*.(40.14 14

- 10 -
called "standardizing" the scores. It is described and illustrated
in Appendix A. Serious readers who have no statistical background
will likely find that an understanding of the material in Appendix A
is helpful in understanding later parts of this report.
With this basic description of the TRQ we can turn to some
other necessary background information.
How Do We Know If the Test is Anv Good?
Teachers and researchers who are considering using one (or
several) of the versions of the TRQ will want to know "How good is the
test?". There are two criteria which any test must meet in order to
be considered "good." A test should be reliable and it should be valid.
A reliable test is one which always gives a similar score
when it measures the same thing. Thus, the TRQ is a reliable measure
if it consistently gives the same (or almost the same) score to a
particular pupil. This means that the score assigned to a pupil by the
teacher should not vary from day to day with changes in mood or the
weather, or at least should not vary very much. One way to measure
reliability is to see if two teachers, independently rating the same
pupil at approximately the same time, assign the pupil scores which
are roughly the same. Of course, if the ratings are made at different
times (say a year or more apart), it is quite possible that the pupil's
actual level of school success will have changed. Consequently, in
checking the reliability of the TRQ it will be important to compare
scores which were assigned by two or more different teachers as close
as possible together in time.
0 WO 5 15

The second criterion for a "good" test, its validity, requires
that the test actually measure what it is supposed to. Since the TRQ,
is "supposed to" measure a pupil's school success, we would expect that
the test should be sensitive to such factors as the pupil's abilities,
his attitudes towards school, his emotional maturity, and his skills
in reading, writing and arithmetic. We would expect that the test
should not be sensitive to such factors as the pupil's right or left
handedness, his attitudes towards church, his sexual maturity or his
skill in charming his teacher*.
Unfortunately, every teacher and every researcher is likely
to have his own opinion as to what factors should be included in the
concept "school success," so that a test which is valid according to
one definition may be invalid according to another. Some users of the
TRQ may wish to alter the questionnaire or the method in which it is
scored so that the overall score more accurately reflects their definition
of "school success." The detailed examination of the individual
questionnaire items and scales, presented later in this paper, should
be of considerable help in this regard.
Some indication of validity can be gained by comparing scores
on the TRQ with other generally accepted indicators of school success,
such as promotions and scores on achievement tests, or intelligence
tests. If the TRQ bore little or not relationship to these other
measures of (past, present or future) school success, we could hardly
argue that it was a valid measure of school success.
* Of course, any or all of these "unwanted" factors could indirectlyaffect the pupil's school success. The point is, though, that these
are not normally considered as being part of school success itself,
while factors such as intelligence and emotional maturity are. Besidesthose factors which could affect school success only indirectly, we alsowant to avoid those factors, such as student's "charm" that might biasthe teacher's rating.
46'048 16
- 12 -
Although the above two criteria, relability and validity,
are ti theory all that need be met in order for a test to be considered
"good," there is still the practical question ":s Lhe test efficient?".
A test like the TRQ might be perfectly reliable and valid, and at the
same time be difficult to use because it is too long or because the
teachers require extensive training in order to use it. If a test
can be made shorter or easier to use without making it less reliable
or less valid, then that test is inefficient.
Suppose that included in the TRQ are a number of questions
that have nothing to do with school success (although, on the surface,
they might appear as if they do). Although these irrelevant questions
don't measure school success, they certainly will be measures of some-
thing, and thus may be decreasing the validity of the TRQ by contaminating
the test total with irrelevant factors. Even when the irrelevant
questions tend to cancel each other out so that the overall validity of
the test is not affected, they still are a waste of time and should be
eliminated for that reason.
Another way in which the test can be inefficient has to do
with the wording of the individual questions. Each question should
be phrased so that the teacher will be able to use all five rating
scores (i.e. 0, 2, 4, 6, 8) for pupils in his/her class. If the question
is worded so that one or more of the poEsible rating scores is seldom
used by the teachers, then the question is providing less information
than it could about the situation.
Although the criteria of reliability, validity and efficiency
have been discussed above with reference to the TRQ total score, all
three of these criteria apply equally well to the sections of the TRQ.
tOt017 17

- 13 -
Each of the sections on each of the questionnaire versions is essentially
a small independent test which should be good enough to provide useful
information all by itself.
A Previous Assessment of the 3+ Questionnaire
A previous Research Department report (Schroder & Crawford,
1970) contains some information relevant to this discussion. Their
most interesting findings (from our present point of view) relate to
the validity of the TRQ, but there are indicators of its reliability
and efficiency as well.
The purpose of the Schroder and Crawford report was to
demonstrate the relationship between teachers' ratings of school achieve-
ment and the results of standardized tests. They compared grade three
teachers' ratings with the scores obtained by the same students on the
Metropolitan Achievement Test and the Otis Quick-Scoring Mental Ability
Test (an I.Q. test). Results of this analysis are presented in Table 2,
which gives the correlations of the TRQ and its various sections with
the I.Q. and M.A.T. scores.
TABLE 2
CORRELATION OF THE GRADE 3 TRQ AND ITS SECTIONS WITH M.A.T. AND I.Q. SCORES
TRQ Sections M.A.T.1
I.Q.2
Performance .69 .40
Adjustment .50 .25
Creativity .50 .37
Prediction .67 .48
TOTAL .66 .41
1 Metropolitan Achievement Test administered in the Spring of Grade 3 -
score based on total of sub-test scores.
2. Otis Quick-Scoring Mental Ability Test administered in the Fall ofGrade 2. t
00018 18

- 14 -
A correlation coefficient can be converted into a rough
measure of the percentage accuracy with which a pupil's score on one
measure will predict his score on the other. The procedure for doing
this is described in Appendix B. Persons unfamiliar with this statistical
measure are advised to study Appendix B, since much of the data in
this report are presented in terms of correlation coefficients.
The M.A.T. is a standardized achievement test, and as such,
is a measure of the child's current level of performance in school.
Consequently, we would expect a pupil's performance score on the TRQ
to be a good predictor of the score he would get on the M.A.T. In fact,
the performance section of the TRQ is a better predictor of the M.A.T.
score than any of the other TRQ sections or the TRQ total score.
The Otis I.Q. Test can be viewed as a test of school ability.
Intelligence tests were originally developed as predictors of a child's
future school success. Since the Prediction section on the TRQ specifically
asks the teacher to rate how far she thinks the child will go in school,
we would also expect this section to be the most closely related to the child's
I.Q. score. This also is confirmed by the figures from the Schroder
and Crawford report.
Although our ability to predict M.A.T. scores and I.Q. scores
from the respective TRQ sections is rather low, we can still conclude
that the TRQ does measure the same sort of thing as the other two tests.
Schroder and Crawford found that the score and the M.A.T. score had a
correlation coefficient with each other of .54 and we normally think of these
two tests as measuring similar things. So teachers' ratings are related to
I.Q. and M.A.T. about as closely as I.Q. and M.A.T. are related to each
other. This constitutes a considerable weight of evidence for the
validity of the TRQ.
W.>
016 1 9 *9)

- 15 -
How well do ratings by one teacher of a child predict the
ratings given by another teacher of the same child? This question is
similar to asking how reliable the test is. Schroder and Crawford
compared the ratings of grade three and grade six teachers of the same
children. The correlations between the two sets of ratings are given
in Table 3. These figures are again rather low; the grade three total
score is only 36 per cent accurate (correlation = .60) in predicting
the grade six total.
TABLE 3
CORRELATIONS BETWEEN RATINGS GIVEN IN GRAL: 3 AND GRADE 6 ON THE TRQ
TRQ Sections Correlations
Performance
Adjustment
Creativity
Prediction
TOTAL
.57
.54
.41
.53
.60
What we cannot tell from these figures is how much of this lark of
accuracy is due to differences between teachers in their methods of
rating students, and how much is due to actual changes in the wpil's
abilities relative to his peers. Only differences due to the first
of the above causes should affect the reliability score. So we can
conclude that the reliability coefficient of the TRQ is at least .60,
but how much better it really is, we can't say.
6 6 o

- 16 -
One final piece of relevant information from the Schroder
and Crawford report relates to the efficiency of the test. They showed
that over all the questions on the 3+ questionnaire, teachers do make
use of the range of rating categories available. They show that the
total score is not badly skewed to either high or low ratings, but
this by no means eliminates the possibility that individual questions
have rating categories that are never used.
The Schroder and Crawford study has provided us with some
evidence that the TRQ is valid and somewhat reliable. We thus have
grounds for optimism in undertaking a more detailed study.
Purpose of This Study
Although the Schroder and Crawford study was not intended
as a defence of the TRQ, it has provided some general indicators of
the usefulness of the test. The present study is intended to provide
a more thorough examination of the reliability and efficiency of the TRQ
and to provide some further indication of its validity.
Thus, the first major purpose of this study is to provide a
more solid answer to the question "How good is the TRQ?". This is done
in Part II of this report.
The second purpose is to look into the question "How can
the TRQ be made better?" There are a number of things which might be
done to improve the test. The individual questions could be examined
to see if they have been designed in the most effective manner. The
questions could be examined to see how well they relate to their sections
and to the overall TRQ. And the method of grouping of questions into
'OVA 21 21

- 17 -
sections could be examined to see if there is a more effective way
of dividing the TRQ into sections. All of these will be done in
Part III of this report.
Origin of the Data for This Study
Data for this study are those collected during the Study
of Achievement for which the TRQ was originally designed. In the first
year of the study, data were collected on all 8,695 students in senior
kindergarten. In subsequent years, up to and including grade four,
data were only collected on those students who remained from the original
kindergarten sample. No teachers' ratings were obtained in grade five.
In grade six, the final year of the study, a sample of 594 pupils was
chosen from those that remained, and data were once more collected on them.
Unfortunately, the data were stored on computer cards in
less than appropriate conditions, and some of the original cards from
the senior kindergarten and the grade three tests have been lost. The
number of students remaining from the original senior kindergarten sample
and the number of students on whom we had ratings are shown in Table 4.
More detailed information on the attrition of pupils from the Study
of Achievement can be found in the Research Department report by
R. S. Rogers (1969).
Another source of data for this report was a study of New
Canadian pupils (see Ramsey & Wright, 1969; Ramsey & Wright, 1970:
Wright & Ramsey, 1970), in which teachers in grades five, seven and nine
rated their students using a reduced form of the TRQ version 3+. There
were a total of 5,237 students in the study; their distribution over the
three grades and in the New Canadian versus Canadian-born groups is
shown in Table 5.
04022 22

- 18 -
TABLE 4
COMPARISON OF ORIGINAL POPULATION AND AVAILABLE DATA RECORDS
Year PopulationData Records
(TRQ)
Senior Kindergarten 8,695 2,033
Grade One 7,083 5,987
Grade Two 6,394 5,381
Grade Three 5,668 2,207
Grade Four 5,340 4,991
Grade Six 4,779 594
NOTE: For each year of the Study of Achievement, the number ofstudents from the original sample who are estimated to beremaining are shown in the "population" column, and thenumber of subjects in the present study are shown in the"Data Records" column.
TABLES
NUMBER OF NEW CANADIANS, AND CANADIAN-BORN STUDENTS INGRADES 5, 7 AND 9 FOR THE NEW CANADIAN STUDY DATA
Grade New Canadian Canadian-Born Total
Grade 5 466 1,448 1,914
Grade 7 343 1,179 1,522
Grade 9 529 1,266 1,795
TOTAL 1,344 3,893 5,237
0023- 23

- 19 -
PART II - PERFORMANCE OF THE QUESTIONNAIRE
The five sections in this part of the report describe a
series of studies designed to answer the question "How good is the TRQ?".
The first section adds to the evidence for the questionnaire's validity
by showing that the TRQ can predict the future promotion of the students
being rated. Sections two and three develop estimates for the test's
reliability and for the reliabilities of the sections and the individual
questions of the test. Finally, two short sections are included
which examine the relationships between the sections of the TRQ
and the value of the individual sections as predictors of later TRQ
ratings.
Teachers' Ratings and Promotions (A Validity Study)
We have seen some evidence for the validity of the TRQ in its
relationship to the Metropolitan Achievement Test and to the Otis I.Q.
Test. The data from the Study of Achievement that were available for
the present study permitted another test of the questionnaire's validity.
Since the TRQ is designed as a measure of the pupil's school
success, the best test of its validity would be a comparison of the TRQ.
scores with an actual measure of school success. And what better measure
could there be than the promotion record of the students? The decision
to hold a child back or to have him skip a grade is one that is given
very careful consideration by the child's teacher and his principal. It
is only a fraction consisting of the best and poorest students that do
not receive regular promotion. Consequently, if the TRQ does indeed
measure school success, it should be a good indicator of whether the child
:00024 24

-20-
will repeat his year, or pass it, or skip two grades ahead (including
taking three grades in two years).
Data were available on promotions for kindergarten, and
grades one, two and three. In kindergarten and grade one, however,
not enough children either failed or skipped a grade to allow a meaning-
ful analysis. It was decided to look at grade two figures because the
validity of the 3+ questionnaire had already been looked at with regard
to the I.Q. and the M.A.T. The "grade three" records were divided into
three groups based on the placement of students at the end of grade two:
(1) those who had to repeat grade two; (2) those who passed normally
into grade three; (3) those who went to grade four.
Of the total of 1,195 students, for whom complete data were
available, 1,135 were promoted normally to grade three, 32 had to repeat
grade two, and 28 entered grade four.
We would expect that the ratings given by the grade two teachers
would be very low for the failing students and very high for the accelerated
students. This is what we found to be the case for every one of the 27
questions on the grade two questionnaire. Rather than show the results
of each question separately, the average ratings for each section of the
questionnaire are shown in Figure 1. Figure 1 shows that pupils who fail
are rated lower in all areas than those who are promoted normally. Figure 1
also makes it clear that it is the language and mental areas that are most
important in determining whether or not a pupil fails, since these areas
have scores which are depressed below the others. No such differences
appear in the ratings of students who skip ahead to grade four*
.
* The physical scale ratings are slightly higher on the average thanthe others, but a statistical test (t-test) shows that this differencecould well be due to chance.
R01025 25

6
2
s I
- 21 -
I
Language-- LMental-- MSocial-- SEmotional -- EPhysical -- P
Failures(Repeat Gr. 2)
Fig. 1. Averagefor studentsgrade three,
Normal Promotions(Go to Gr. 3)
Double Promotions(Go to Gr. 4)
ratings by grade two teachers on the five TRQ sectionswho subsequently failed grade two, passed normally toor skipped a grade to grade four.
How would we expect students in the three groups to be rated
by their next year's teachers? The students in the first and third
groups were failed or accelerated in order to place them with children
of similar abilities. Since the TRQ asks teachers to rate students in
comparison to others in his class, both the students who failed and the
students who were moved ahead shuuld now be with others who are closer
to their own ability. Thus the children who remained in grade two should

-22-
not be rated so low as they were the year before, while the children in
grade four should not be rated so high.
Average ratings on each of the sections of the 3+ questionnaire
for each of the three groups are shown in Figure 2. As expected, the ratings
of the grade two students and grade four students are much closer to the
average than they were on the previous year. Overall ratings for the grade
four children are about the same as those who progressed normally to grade
three. Those who repeated grade two are still rated below the others on
all sections, but the difference between the repeaters' ratings and those of
the normally promoted students has been much reduced.
6
2
Performance -- PAdjustment -- ACreativity -- CPrediction -- SA
Failures(Repeat Gr. 2)
Fig. 2. Averagestudents whoor skipped a
Normal Promotions Double Promotions(Go to Gr. 3) (C0 to Gr. 4)
ratings by teachers one year after grade two, forrepeated grade two, passed normally to grade three,
grade to grade four.
,401017 27

-23-
Looking briefly at the scores on the individual sections
we see that the students who repeat or skip a grade are rated slightly
lower on the adjustment section. It might well be expected that child-
ren who have a completely different group of classmates, and who
appear exceptional to these classmates (because of their promotion or
lack of it) might have some adjustment problems. The other point to
note is that relative to the other scales, the school ability scale is
the one which still favours the grade four children most and discriminates
most against those repeating grade two. This is to be expected since
the teachers' assessment of the child's school ability will be affected
by the promotion record, which is also a reflection of ability.
There is now a considerable weight of evidence to show that
the TRQ is a valid measure of a pupil's school success. Scores on the
TRQ are related to achievement test scores, to I.Q. and to the student's
prospects fJr promotion.
In contrast, we do not have an estimate of the questionnaire's
reliability. Let us now consider this second important criterion for
evaluating our test.
Estimation of Reliability (TRQ Total Score)
The Teachers' Rating Questionnaire is different from most
measuring instruments used in educational research in that it is not
applied directly to the object being measured. Although we are actually
interested in measuring the pupil's school success, we give the question-
naire to his teacher. The advantages of this indirect approach have
been pointed out in the introduction of this report. One of the major
disadvantages in this method is that it relies on the impressions
090 #2 828

- 24 -
of the child's teacher. Since each teacher will form his own opinion
of the child's abilities, the ratings a child received on the test
will depend on who his teacher is as well as on his own actual abilities..
Suppose that a child was rated with the TRQ by his grade two
teacher, and was rated again, a year later, by his teacher in grade
three. It is almost certain that he will be rated differently by the
two teachers. What reasons are there for these differences?
(1) Differences due to elapsed time: Because the two
ratings were made a year apart, ue can expect
that the child will, on the occasion of his
second rating, be ,doing somewhat better in some
ways and somewhat worse in others. That is,
his relative level of school success will have
changed. Also, the TRQ requires the teacher to
rate the child relative to the abilities of his
classmates; so he may come to warrant a higher
(or lower) rating simply because he has less
(or more) successful classmates.
(2) Differences in TRQ versions: When different
versions of the TR() are used there will be
differences in the ratings of the children
due to the fact that different questions are
asked of the teachers on the two versions.
(J) Differences in perception between teachers:
Each of the child's teachers, being a
different person, will see the child's abilities
in a different way. For instance, a child
who is always "clowning" might be seen as a
discipline problem by one teacher and.as
inventive and creative by another.
(4) Teachers' inconsistencies: No person can be totally
consistent in his judgements. Some of the differ-
ences in the teachers' ratings will be due to simple
29

- 25 -
random things like deciding between two equally
appropriate ratings, or small mistakes in marking
the answer sheet, etc. These differences could
exist even if the same teacher were rating the
same student twice with, say, only a few days
between ratings.
Since we are interested in the TRQ as a measure of the
pupil's school ability, we would like the test score to accurately
reflect differences -of the first type. That is, when a child's actual
level of school ability changes relative to his classmates, we would
like his score on the TRQ to reflect this change. On the other hand,
we would prefer it if differences of the second and third types were
not present.
Differences due to having two versions of the TRQ decrease the
reliability of the measure. Although we want each version to be an
independent measure of the same thing -- school ability -- it is not
possible for this to be exactly true since the two versions do not have
identical items. Similarily, differences among teachers in their per-
ceptions of a-child are unavoidable. And because they cause inconsist-
encies in our measure of the pupil's actual school success, they are
likely a major source of unreliability.
The other factor affecting the reliability of the question-
naire is the inconsistency in the rating methods of the individual
teachers. In some circumstances these inconsistences could be con-
siderable; for instance: (1) if the questionnaire were administered
too early in the year, before the teachers had properly gotten to
know their pupils; (2) if the instructions on the questionnaire were
confusing; or (3) if the teacher was too hurried or didn't care enough
to consider the questions carefully. In such cases teachers might
'0 013030

-26-
answer some questions more or less at random, and the reliability of
the resulting scores would be considerably reduced. However, if the
questionnaire is carefully administered, these problems should not be too
severe; and we would expect the adverse effects of the teacher
inconsistency factor to be small in comparison to the effect of differ-
ences in teachers' perceptions.
Now that we have some framework in which to consider the
reliability question, let's see if the data from the Study of Achieve-
ment can't be treated in a way that will produce a good estimate of
the TRQ's reliability. The ideal situation would be one which enables
us to separate the four factors contributing to differences in the
TRQ ratings and tell us just how important each factor is in reducing
reliability. This would require a controlled experiment in which three
of the factors were held constant while the other was varied. For
instance, to determine the reduction in reliability due to time, it
would be necessary to have the same teacher rate the same children
using the same version of the test at different times over a period
of years. To determine the effect due to teachers' perceptions, two
or more different teachers should rate the child at the same point in
time using the same TRQ version.
Since the data available to us have not been collected for
the purpose of determining the test's reliability, they are not in
this ide-al form. What we do have are a series of ratings on the same
set of children made by their kindergarten, grade one, two, three, four
and six teachers. We would expect that the longer the time between two
ratings, the more the students' TRQ scores will have changed. That is,
the grade two and three TRQ scores for a student will likely be more
0 04 3)1j, 31

-27-
similar than the grade two and six scores, since there has been more
time in the latter case for there to be an actual change in the students'
school ability. We would also expect that when the same version of
the TRQ was used on two successive ratings (as with grades four and six)
the scores would be more simialr than when two different versions were
used (as with kindergarten and grade two).
In order to reduce the number of computations involved, data
from only four grades were used for the major part of the analysis (kinder-
garten and grades two, three and six). For each pair of these grades
(i.e. kindergarten and grade three) a correlation coefficient was computed.
In addition, correlations were computed between grades three and four,
and between grades four and six. These eight correlation coefficients
are shown in Figure 3, where they are plotted in terms of the number of
years between ratings.
Let us first check the two predictions we made regarding
the degree of similarity between the various ratings. We expected to
find that ratings made close together in time would be more similar
than those made farther apart. Since the time between ratings increases
as we move from right to left across Figure 3, we would expect the
similarLry to decrease all the while. This indeed is the case. The
highest correlation (0.68) is between grades three and four (just one
year between ratings) while the lowest correlation (C.35) is between
kindergarten and grade six (six years difference).
Now, what about our other prediction, that when the same TPQ
version was used for both ratings the similarity would be greater thin
two different tests w-re used? The three cases where the same (grade 1+1
version was used are represented in Figure 3 byDwith the two grad,,,
compared labelled in the box. These are clearly higher on the average (han
320 Alt

- 28 -
where different forms are compared (represented by ), but they are
also near the left.of the graph. It is not clear just how much these
higher correlations are due cimply to the relatively short times
between ratings. Figure 3 as it stands is not adequate to answer our
questions. What we need is a way of estimating from the data in Figure 3
just how much correlation is lost per year and just how much is lost when
the second TRQ rating is made with a different version of the test.\ A
method for doing this is known to statisticians and is called analysis
of covariance. What this method does is calculate two lines (to be
placed on the graph) representing the average correlation which would
be expected for a given time difference.
Figure 4 shows these two lines. The upper line represents the
correlations between repeated ratings using the same TRQ versions and
the lower line represents such correlations when two different TRQ versions
were used. Thus we would predict from this graph that if two different
versions of the TRQ were given six years apart their correlation coefficient
would be 0.41.
It is important to remember that any predictions based on the
lines in Figure 4 can only be very approximate. In order to calculate
these lines in the first place it was necessary to make a number of
specific assumptions. These assumptions, and the statistical calculations
involved in computing the lines in Figure 4, require considerable under-
standing of mathematical and statistical procedures. Readers wishing
a complete explanation are referred to the technical supplement to this
report. Only a "common sense" explanation will be provided here.
0 OtOtat3
33

I0
.3
.1
.1
.6
.3
2
0
- 2q -
0 CORRELATION BETWEEN TWO ADMINISTRATIONSOF THE SAME TR 0 VERSION
0 CORRELATION BETWEEN TWO ADMINISTRATIONSOF DIFFERENT T R 0 VERSIONS
m
e
0t
m
8
ca
8
1
a
a
i2 3 4 5
YEARS BETWEEN RATINGS
a
F I GURE 3 CORRELATION COEFFICIENT FOR REPEATED ADMINISTRATIONS OF THE
TR 0 PLOTTED AGAINST TIME BETWEEN RATINGS.
1.' t
...
:-:;0=0104.,4.
34

1.0
.9
.8
.7
.6
.5
.2
.1
.0
- 30 -CORRELATION. BETWEEN TWO ADMINISTRATIONSOF THE SAME TRO VERSION
OCORRELATION BETWEEN TWO ADMINISTRATIONSOF DIFFERENT TRO VERSIONS
SAME VERSION
DIFFERENT VERSIONKS
0 2 3 0 6
YEARS BETWEEN RATINGS
FIGURE 4 ESTIMATED CORRELATION FOR REPEATED ADMINISTRATIONS OF TRO.UPPER LINE REPRESENTS ESTIMATED CORRELATION FOR REPEATED ADMINISTRATION OFTHE SAME TRO VERSION. LOWER LINE REPRESENTS ESTIMATED CORRELATION FORREPEATED ADMINISTRATIONS USING TWO DIFFERENT TRO VERSIONS.
(1;4003 535

-31 -
Looking carefully at Figure 4 one will see that the lines are
slightly curved upward. This implies that a greater loss in correlation
occurs in the first few years after a rating than occurs later on. In
fact, it is a constant percentage of the correlation (7.7%) that is
assumed to be lost in any given year. This means that the expected
correlation will get ever smaller as time goes on but will never
reach zero. This is just what one would expect. Children will
continue to grow and change over the years. The predictive ability
of early teachers' ratings will decrease sharply at first, then will
decrease more slowly, and will slowly approach but never quite equal
zero.
The lines we have calculated in Figure 4 are only very
approximate. But bearing this in mind, we are now in a position to
make an estimate of the reliability of the TRQ. Recall that we identified
four factors contributing to loss in correlation between repeated TRQ
ratings of the same students. These were:
(1) Differences in time betweenadministrations;
(2) Differences in TRQ versions;
(3) Differences in perception betweenteachers;
(4) Teachers' inconsistencies.
Only the last two of these factors affect die reliability of
the TRQ when the same version is used for both ratings.at the same point
in time. A direct mcasure of the reliability in this case could be
obtained if two or more different teachers, who had had the same experiences
with the class, were to rate the same children with the same TRQ version ar.
the same point in time (i.e. with no elapsed time between ratings). The
correlation between these ratings is called the reliability coefficient. We
36
'',41/03 6
-32-
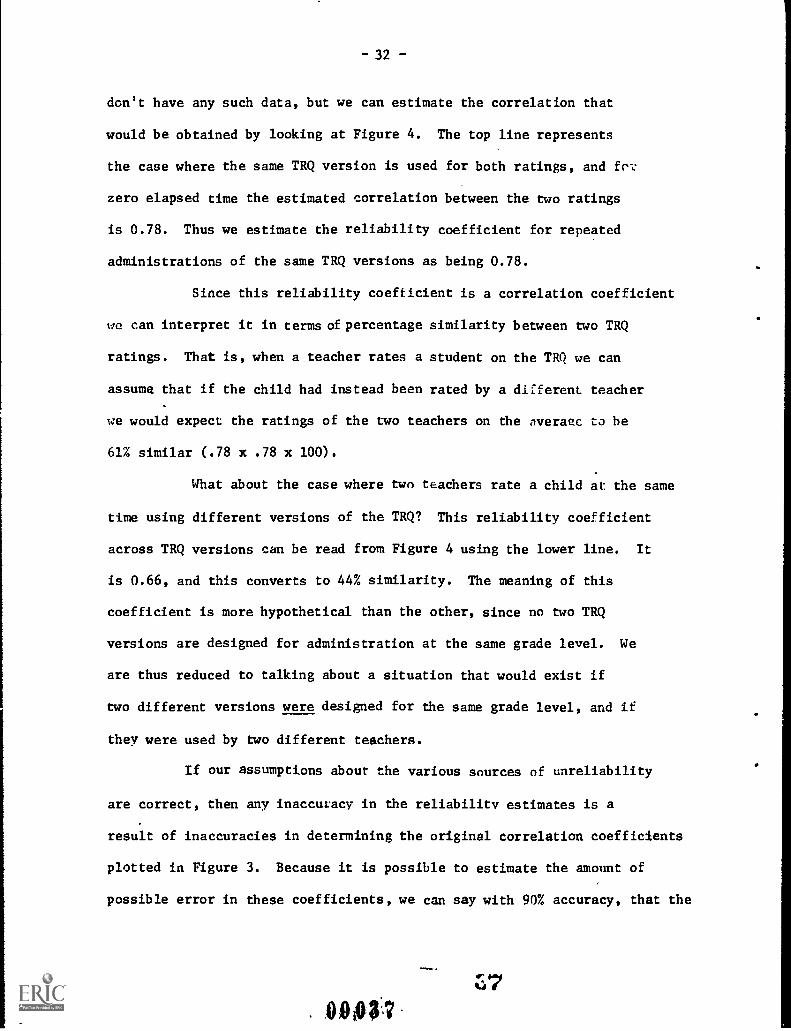
don't have any such data, but we can estimate the correlation that
would be obtained by looking at Figure 4. The top line represents
the case where the same TRQ version is used for both ratings, and fol7
zero elapsed time the estimated correlation between the two ratings
is 0.78. Thus we estimate the reliability coefficient for repeated
administrations of the same TRQ versions as being 0.78.
Since this reliability coefficient is a correlation coefficient
we can interpret it in terms of percentage similarity between two TRQ
ratings. That is, when a teacher rates a student on the TRQ we can
assume that if the child had instead been rated by a different teacher
we would expect the ratings of the two teachers on the nveraec to be
61% similar (.78 x .78 x 100).
What about the case where two teachers rate a child at the same
time using different versions of the TRQ? This reliability coefficient
across TRQ versions can be read from Figure 4 using the lower line. It
is 0.66, and this converts to 44% similarity. The meaning of this
coefficient is more hypothetical than the other, since no two TRQ
versions are designed for administration at the same grade level. We
are thus reduced to talking about a situation that would exist if
two different versions were designed for the same grade level, and if
they were used by two different teachers.
If our assumptions about the various sources of unreliability
are correct, then any inaccuracy in the reliability estimates is a
result of inaccuracies in determining the original correlation coefficients
plotted in Figure 3. Because it is possible to estimate the amount of
possible error in these coefficients, we can say with 90% accuracy, that the
00#3,7

-33-
reliability coefficient for repeated applications of the same version of
the TRQ iE at least 0.69 and that the reliability coefficient between
two versions of the TRQ is at least 0.56.
The loss in correlation when two different TRQ versions
are used (instead of one) we can consider to be due to the lack of
correspondence in the aspects of school success that are covered by
the questions on the test. For instance, TRQ versions SK, 1 and 2
include a section on physical ability while version 3+ does not.
Consequently; we would expect that a pupil of exceptional physical
ability would receive a higher TRQ score in grade two than in grade
three. This is a rather big difference between questionnaire versions,
but there are many small differences between the two versions which
would have similar effects. It is the total of all these small
differences that accounts for the additional loss in correlation when
the two teachers rate the pupils using different TRQ versions rather
that both using the same version. These non-correspondences between
the questionnaire versions wilLbe examined in more detail later in
this report.
We have now estimated reliability coefficients for the TRQ
as a measure of a pupil's school ability. We have not yet considered
the situation where a researcher may wish to use the questionnaire to
measure not the pupil's school ability, but rather the teacher's
perception of the child's abilities. Were the questionnaire to be
used for this purpose, the differences between teachers' ratings,
rather than being an unavoidable bother, would be the very focus of
the study. Used in this way, the only thing that would affect the
reliability of the ratings would be teachers' inconsistencies. These,
as we have discussed earlier, should be relatively small. Just how
3800008

34
small, we can't say, because the data available at the moment don't allow
us to distinguish between the effects of teacher inconsistency and
differences in perception.
In order to disentangle the contributInnA of these two
factors, it would be necessary to have,each teacher rate their
pupils at least twice so that we could estimate the level of teacher
inconsistency. It would also be a good idea to do a proper reliability
study, where two or more teachers rate the same pupils at the same
point in time. Remember that the reliability coefficients derived
in this study can be no more than approximations and they have been
arrived at by rather unorthodox methods.
Estimation of Reliability(TRQ 3+ Sections, and Questions)
We have now made an estimate of the overall reliability
of the TRQ, and this will be very helpful to us when we wish to measure
school ability as a global concept. However, we will often wish to
distinguish between the various aspects of school success represented
by the sections of the TRQ. When we find the adjustment or creativity
scores of students, should we assume that these have the same reliability
as the overall TRQ score? There are two reasons why we should not
First, there are fewer questions in a section than in the total TRQ,
meaning that the section score is based on less information than the
TRQ score. One might well expect that the score based on less informa
tion will be less reliable. Secondly, the questions in some sections
are likely to be easier for the teacher to answer than others. The
teachers will likely be fairly certain in their ratings on the performance
,90'03939

section and the teacher would likely agree with each other in these
ratings, while ratings on the creativity section may very much depend
on what the questions mean to the teachers. For these reasons we
shall now attempt to make separate estimates for the individual TRQ
sections.
We would like to use again the same procedure that we used
to estimate the total TRQ score reliability. But the problem here
is that different sections were used on the TRQ 3+ questionnaire than
were used on the other versions. Thus, we have a choice of working
with either the SK, 1 and 2 versions, or with the 3+ version using
the grades three, four and six repeat ratings. Working with the 3+
version has the advantage that we can also look at the reliability of
the individual questions since these questions don't change over the
three years. So let's look first at the sections on the 3+ version.
Since there are only three correlations (i.e. grades three
and four, four and six, three and six) for each section, it is not
advisable to calculate a line using three data points alone. In order
to get more data points it is necessary to pool the correlations on
all four scales. This way we have twelve points on which to do our
calculations. The price for being able to pool the data is the necessity
of assuming that the losses in correlation over time are the same for
all sections. We can now calculate the four parallel curves using the
analysis o f covariance method as we did in the previous section. These
lines are shown in Figure 5.
It is clear from a quick glance at Figure 5 that the four
sections can be ranked in order of reliability with performance being
the most reliable measure and creativity being the least. This ordering
is about what one would expect in terms of how the specificity with which
the questions are defined for the teachers.
oon'an40

I.0
A
.7
A
.s
- 36 -
0 PERFORMANCE
0 ADJUSTMENT
0 CREATIVITY
8 PREDICTION
.2
.1
A I i i
PERFORMANCE
PREDICTION
ADJUSTMENT
CREATIVITY
1 2
YEARS BETWEEN RATINGS3
FIGURE 5 ESTIMATED. CORRELATIONS FOR THE FOUR SECTIONS OF THE 3 VERSIONOF THE TRQ. THE OBSERVED CORRELATIONS ARE PLOTTED IN SMALL CIRCLES.
0004141

- 37 -
From Figure 5 we can read the reliability coefficients for
the sections as: performance = .70; prediction = .64; adjustment = .59;
and creativity = .53. As with the test total, these are very, approximate
figures.
As we predicted, the reliability coefficients for the TRQ
sections are considerably lower than the .78 coefficient we found for
the total score.
Before leaving the reliability question, let's look at the
reliabilities of the individual questions on the 3+ version. The
individual questions should, on the average, have lower reliabilities
than the sections or the total questionnaire. The same method is
used with the questions as was used for the sections. The resulting
reliability estimates are shown in Figure 6, along with the estimates
for the sections and for the total questionnaire. As we would expect,
there is an even wider range in the reliability coefficients for the
questions than there was for the test sections. Two questions, school
ability and reading, are as good as an entire test section. In fact,
the school ability question is the entire "prediction" section.
The differences in reliability between the various test
sections can be explained by the superior reliability of one or two
questions in the section. For instance, the performance section
includes the reading, the mathematics ability, and the general per-
formance level questions.
0004242

PERFORMANCE ---SECTION
PREDICTION ---0SECTION
ADJUSTMENT ----0SECTION
CREATIVITY -.SECTION
''......5101P.%
- 38 -
78 4.-4 TEST TOTAL ( SAME VERSION) 1
76
74
72
70
68
)6
64
62
60
58
56
54
52
SO
48
46
44
42
*----1 TEST TOTAL ( DIFFERENT VERSIONS ) 1
4-- READING
4---- SCHOOL ABILITY
*--- GENERAL PERFORMANCE LEVEL
4.---MATHMATH
IP LIABILITYL I
4--- USE OF OUT OF SCHOOL EXPERIENCES IN CLASS
*---- LANGUAGE4-- ABILITY TO GET ALONGis- ACCEPTANCE OF GOALS
*--- GENERAL ADJUSTMENT EVALUATION
4.--- IMAGINATION, INVENTIVENESSCREATIVITY
FIGURE 6 RELIABILITY COEFFICIENTS FOR VERSION 3i. SECTIONS ANDINDIVIDUAL QUESTIONS
4300043

- 39 -
What is it that makes some of the questions so much more
re.Liable than the others? There seems to me to be one common factor
possessed by the five "superior" questions, and by none of the'others.
That is, the teacher has likely rated her pupils on these questions
before she ever saw the TRQ. This is obviously true of reading and
math ability since these ratings are required for report card purposes,
and the very nature of discipline problems requires that the teacher
be very much aware of which students are trouble makers and which ones
aren't.
And finally, the school ability and general performance
level questions arc so central to the teachers' work that he/she will
almost certainly have a general impression of the overall abilities
of each child which will be used in answering these questions.
In contrast, the remaining questions deal with specific
traits and abilities which are not normally rated for report card
purposes. A question like Acceptance of Goals probably appears as
quite naw to the teacher and requires looking at the pupils from
a different perspective.
If we are correct in assuming that the more reliable
questions simply reflect the teachers' prior judgement, there is little
that can be done to improve the questions on the test. We don't want
to eliminate the questions which make the teachers think. If we were
to include only questions which dealt with abilities teachers had
already rated for report card purposes, then we would just be creating
another form of report card.
4400044
u

- 40 -
Grade Independence of the Grade 3+ Version
The grade 3+ version of the TRQ has been designed with
general questions so that it would be applicable over a number of
grades. Since the teachers were asked to rate the pupils in
comparison with their classmates, we would expect that average TRQ
ratings would not be anv higher in one grade than in another. Data
from the large New Canadian Study (Ramsey & Wright, 1969, 1970a,
and 1970b) allow us to compare average ratings on the TRQ 3+ version
by t1'1chers of grades five, seven and nine. The average value of the
teachers' ratings on the nine questions was computed for each of the
three grades. Suppose that TRQ 3+ did not perform as claimed, and
that grade five teachers generally rated all pupils lower and grade
nine teachers rated all pupils higher in comparison. Then the average
ratings for the three grades would differ considerably. Looking at
Figure 7, It is clear that the line connecting the three grades is
essentially flat, indicating no differences among them. Thus teachers'
ratings on the TRQ 3+ version are truly independent of grade level.
8
6
4
2
0Grade Grade Grade
5 7 9
Fig. / Average rating for three grades of New Canadian study usingTRQ 3+. Readers will observe that there is little differ-
ence in these values across the three gradAs.
M145

-41 -
Relationship Between the TRQ Sections
We have seen that each of the versions of the TRQ is
divided into four or five sections, each of which is supposed to
measure some aspect of school ability. It has been suggested that
each of these sections could be treated as an independent question-
naire. This is well and good, but what we don't yet know is should
we attend to each section separately and treat it as providing some
unique information. In other words, if we know only a child's
total TRQ score without knowing his adjustment score, his performance
score, etc., how much information are we missing? It will be necessary
to answer this question once for versions SK, 1 and 2 of the TRQ and
then again for version 3+, since different sections are employed in
the two cases.
We answer our question by first calculating the correlation
coefficients between the various TRQ sections for each version of the
TRQ. But instead of reporting correlation coefficients here, it is
more useful to report the percentages of similarity between the
sections, which readers will recall are calculated by "squaring" the
correlation coefficients and multiplying by 100. Because the figures
for the SK, 1 and 2 versions are quite similar, the correlations for
these three versions were averaged and the results (as percentages)
are shown in Table 6, Part A.
Looking at Table 6A, it seems that each of the sections,
except for the physical section, has at least 70 per cent in common
with the total TRQ score. For the physical section (100 - 43) 57 per
cent of its information is unique to itself, while the other sections
have less than 30 per cent of their information unique to themselves.
I conclude that the physical section should be considered separately
from the other sections. 46

42
TABLE 6
PERCENTAGE SIMILARITY AMONG SECTIONS OF THE TRQ
Part A: Averages for Versions SK, 1 and 2
TotalLanguage Mental Social Emotional Physical
Language 100 75 60 46 25 86
Mental 75 100 66 59 34 93
Social 60 66 100 53 22 76
Emotional 46 59 53 100 26 70
Physical 25 34 22 26 100 43
TOTAL 86 93 76 70 43 100
Part B: Averages for Version 3+
Performance School Ability Adjustment Creativity Total
Performance 100 67 58 53 92
School Ability 67 100 38 50 71
Adjustment 5d 38 100 35 76
Creativity 53 50 35 100 68
TOTAL 92 71 76 68 100
Looking within the main part of the table we see the percentage
in common that each section has with each other. Except for the physical
section, each section shares 50 per cent or more of its information with
each other section. If we do treat the sections uniquely, we cannot
consider them as representing totally different aspects of school
success, since between any two sections there is much in common.
The sections of version 3+, as seen in Table 6, Part B,
relate in about the same way. There is no physical section, and all of
47
WA 7

743-
the sections share nearly 70 per cent or more with the total. Again
we can conclude that the sections are distinct enough that they provide
some extra information when a detailed analysis is required, but that
not too much information is lost when only the score from the total test
is used. Later in this report we will see if the sections on the TRQ
can be redefined in such a way that they provide more unique informa-
tion.
In the section of this report on reliability of section scores,
we examined the ability of the score on one of the TRQ sections to predict
scores on the same section a year or two later. In the light of the
high degree of relationship that we have seen to exist between sections
of the TRQ, and the total score, we might expect that the total TRQ score
would be almost as good a predictor of the later section scores as the section
scores themselves. To answer this question we constructed two tables
similar to Table 6. The numbers in these tables are the percentage
similarity between a test section or total on one year and another test
section or total at a later date. Table 7, Part A shows how well the
senior kindergarten TRQ sections predict the grade two TRQ sections.
In every case the total TRQ score from senior kindergarten is a better
predictor of the grade two section score than are the senior kindergarten
scores in that section. For instance, the kindergarten language section
is only 23 per cent accurate in predicting the grade two language section
score, but the kindergarten total is 35 per cent accurate in predicting
that score. It also appears that the senior kindergarten mental section
and the senior kindergarten total are just about equal in their predictive
ability for every section of the grade two questionnaire. That is, the
grade two language section score is predicted better by the mental section
than by the language section of the kindergarten questionnaire! Something
appears to be wrong'. 48

- 44 -
TABLE 7
ABILITY OF TRQ SECTIONS TO PREDICT SECTIONSCORES AT A LATER ADMINISTRATION OF THE TRQ
Part A: Percentage Accuracy of TRQ - SK SectionsTRQ-SK in Predicting TRQ - 2 Section ScoresSections
Language Mental Social Emotional Physical Total
Language 23 16 12 17 12 20
Mental 36 29 17 27 16 32
Social 18 18 8 13 10 17
Emotional 18 18 12 16 10 18
Physical 14 10 10 10 9 13
TOTAL 35 28 18 26 17 31
First
Rat t n g
Part B: Percentage Accuracy of TRQ_- 3+ SectionsScores on a Later Administration
SchooPerformance Adjustment Creativity TotalAbili
1
Ability
Performance 44 32 28 21 42
School Ability 35 36 18 22 34
Adjustment 31 25 31 11 32
Creativity 34 26 20 24 29
TOTAL 44 38 31 23 44
How can the test total be a better predictor of the language
score than is the language section itself? The answer lies in two facts.
First, the inaccuracies in measurement (i.e. teacher perceptions and
inconsistencies) affect the test sections more than the test total,
because the test total contains more questions over which these errors
can cancel each other out. Secondly, there is a certain non-
correspondence between questions in the sections of the same name from
different TRQ versions. That is, a question on the kindergarten language
4900:049

_45 -
section may tap an aspect of language development that is not covered
by any of the questions on the grade two language section. Here is
still another reason for seeing if we can redefine the TRQ sections
so that there is a better correspondence of the sections between
versions.
Table 7, Part B summarizes the results for the sections of the
3+ version. Results were similar for the correlations between the various
grades (three with four, three with six, and four with six) and, so, correla-
tions were averaged over grades. Since the same questionnaire version was
used for both measurements, the correlations in this table are somewhat
higher than in Table 7, Part A. The 3+ version sections also do relatively
better in predicting later ratings on t'ie same section. Here the sections
are as good as the test total itself in predicting later ratings.
The division of the TRQ into sections is certainly useful in
focusing the attention of teachers and researchers on different aspects
of the pupils' achievement, and as a method for organizing the many
indicators of achievement into useful categories. The sections do
measure different aspects of achievement, but these different aspects
are interrelated, not independent. That is, a pupil who scores high on
one TRQ section is also likely to score high on the others. These
relationships between the sections occur over time as well; a student's
adjustment in grade three could well affect his performance or creativity
in grade four. It is these causal effects together with the differences
in teachers' perceptions and the minor ambiguities of the questions that
reduce the ability of the sections to pre .ct over time. We have seen
that the test total is as good or bette at predicting future.section
scores than are the sections themselves.
50
00050

-46-
In the next part of this report, we will be making a
detailed examination of the individual questions in the TRQ and will
attempt to improve the distinctions among the TRQ sections.
000151

_ 47 _
PART III - HOW CAN THE TEACHERS' RATING QUESTIONNAIRE BE IMPROVED?
We have now come to the most detailed and technical part of
the report. To gain a clear perception of the inner workings of the
TRQ it is necessary to examine closely the individual questions and
their interrelationships with the aid of some powerful statistical
tools. Any serious user of the TRQ will find his understanding of the
instrument considerably increased by the careful study of the data
presented in this part of the report.
There are two major purposes of Part III: to provide data
which will assist researchers in improving the TRQ and modifying it
to their own needs; and, to provide the tools for testing the effect-
iveness of these modifications. The tools developed and described
in this part of the report should be usable by all interested researchers
regardless of their level of statistical sophistication. It will require
some effort, on the part of a reader who has no background in statistics,
but if the reader intends to work extensively with the TRQ he would
likely find the effort worthwhile.
Effectiveness of the Individual Questions - Theory
Teachers frequently told the researchers that the TRQ
was too long. As a result, each subsequent version of the question-
naire was made shorter than previous ones. Future users of the TRQ
may well be interested in eliminating certain of the questions on the
early forms to reduce their length. Or convers ly, researchers may wish to
rewrite some of the poorer questions to improve the overall effectiveness
of the test.
52
00052

48
This section of the report develops a specific and easy to
use criterion for testing the value of the individual questions.
It is not easy to say specifically just what makes a good
question, but perhaps the following general statement will help.
A question should provide the maximum possible information
about the objects measured, and this information should be easy to use.
In our case we are measuring students' abilities. We not only want to
measure students' achievement, but we also want to detect differences
among the students.
The information we have about the students is provided by
the teachers' ratings. If teachers fail to use one or more of the
five rating categories for a question, then clearly we end up with
less information about the students than if all five categories were
used. In fact, the maximum information about the students is obtained
when all five rating categories are used equally often by the teachers.
We are also looking for information about the degree of difference
among the students. We want to know not just that Jimmy is better at reading than
Jackie, but how much better. Suppose Jimmy, Jackie and Jonny were
rated 0, 4 & 8 on reading ability. Can we conclude that Jonny is
as far ahead of Jackie as Jackie is ahead of Jimmy? The answer to this
question is, hopefully, "Yes." Can we conclude that Jonny is twice as good as
Jackie and that Jimn5i (rated zero) can't even read his own name? The
answer is this question is definitely "No " ?' The TRQ questions were
not designed in this way. A zero rating always indicates the lowest
level of ability, but it seldom indicates zero ability. So we would
like to be able to use the differences between the levels of ability being
rated, but the actual numbers used don't necessarily mean anything. In
researchers' jargon, the ratings should fall on an interval scale..
530 0051

- 49
This stipulation is necessary if the information provided by
the TRQ questton is to be easy to use. We should make sure that the
ratings are on an interval scale before we perform any mathematical
operations on them. Even the simple process of adding the ratings to
get a section score or total TRQ score, assumes that each question
is on an interval scale. When the question does not measure
on an interval scale we have a choice of ignoring this fact or of
trying to correct for it. If we ignore this failing we are adding
additional error into our measurements and further decreasing the
reliability of the test. If we try to correct the problem we have
to apply a mathematical transformation. In both cases the results
are far from ideal. It is a much better policy to correct the
wording of the question so that it will measure properly in the first
place.
How can we tell if a question is measuring on an interval
scale? Quite simply: the distribution of teachers' ratings must have
the same shape as the distribution of the actual ability being measured.
At least this is quite simple if we know the actual distribution of
the ability.
On most of the abilities measured by TRQ questions we would
expect that many of the students will be near the overall student
average in their abilities, while a few will be exceptionally good
and a few, exceptionally poor. That is, we would expect the distribution
of abilities to be in the form of the familar bell shaped curve. Also,
teachers are specifically instructed to rate students in comparison to
their peers with a rating of "four" being the average. So we can con-
clude that the distribution of teachers' ratings should be "bell shaped"
with an average rating of four. To the extent that it differs from
540005A

-50-
this shape, we can conclude that the rating scale differs from the
assumptions of interval maaauxgment.
There is also another reason why the distribution of ratings
should be bell shaped. Many of the commonly used statistical tests
have been designed for application only to such bell shaped distributions.
Of course, it is the total TRQ score and the total section scores to
which the statistical tests will be applied, and consequently, it is
these total scores and not necessarily the individual question scores
which must have a bell shaped distribution. However, since the total
score is composed of the individual question scores, the distribution of
total scores is determined by the distributions of the individual
questions. The following factors affect this relationship:
1. The more bell-shaped the distribution of the individualquestions, the more bell-shaped will be the distributionof the total.
2. The larger the number of questions in a section, the morebell-shaped will be the distribution of the section total.
3. The lower the correlations between the questions, themore bell-shaped will be the distribution of the total.
Any one of these stipulations can be violated if the other two are met, and
the total will still have a bell-shaped distribution. Thus, questions can
have (say) a rectangular distribution, if there are quite a few questions in
the section, and if the correlations between questions are low. In such a
case the section total will still have a bell-shaped distribution as required.
We have now come to two quite different conclusions about the form
the distribution of teachers' ratings should take. To obtain maximum differ-
entiation of students into different levels of ability, an equal number of
students should be rated at each of the five categories (rectangular dis-
tribution). To avoid violating statistical assumptions, the ratings should
have a "bell-shaped" distribution similar to Figure 8B, with most students
5500055

- 51 -
rated in the middle categories. Since the second of these criteria is the
more important to most test users, the following compromise is probably best.
The distribution of teachers' ratings should be bell-shaped, but it should
deviate from the perfect bell shape in the direction of the reaangular shape
as far as is possible without significantly affecting the requirements of
interval measurement and statistical tests.
,t how far can the distribution of teachers' rating deviate
from the ideal bell shape? With this question in mind, a number of
theoretical distributions of teachers' ratings have been generated as shown
in Figur- 9 teach of these has bean generated with the assumption that the
actual distribution of the measured ability is bell shaped. This "acti.,12%"
distribution is shown by the continuous bell shaped line. A second assumption
underlying these theoretical distributions is that each of the questions was
designed to measure on an interval scale. Thus, the category widths for each
of the five possible ratings are the same. The two possible ways in which
errors could be made were:
(1) categories could be too wide or too narrow; --'
(2) the rating category cf "four" could fail to correspond
with the actual average ability of the students.
From each of these theoretical distributions, three indicators of
the effectiveness of the question were calculated. The first of these
indicators, per cent covered, is a measure of the degree to which the
assumption of an interval scale is met. It is assumed that any student
where level of ability is either above or below the range of the question
categories, will be "forced" by the teacher into the nearest category -
either zero (for poor students) or eight (for superior students). The
inclusion of these extra students in the extreme categories causes a dis-
tortion of the scale away from the assumption of equal intervals and the
"per cent covered" indicator is a measure of this distortion.
?
0 0 0 5 8
56

20
10
40
30
20
10
- 52 -
DISTRIBUTION PROVIDING .
MAXIMUM DIFFERENTIATIONAMONG STUDENTS
r rr/01 fe
0 2 4 6RATIN G
8
0 2 4 6R A T I N G
DISTRIBUTION . HAVINGIDEAL STATISTICALPROPERTIES
F.IGUR E 8 TWO IDEAL DISTRIBUTIONS OF TEACHERS RATINGS
0005757
l

53
A El
PERCENT COVERED s 92 PERCENT COVERED 100PERCENT NORMAL 90 PERCENT NORMAL s 9 8PERCENT INFO a 98 PERCCNT INFO a 74
C
PERCENTPERCENTPERCENT
COVERED = 68NORMAL = 67INFO = 97
O 2 4 6
0
0
2 4 s s
PERCENT COVERED a 85PERCENT NORMAL = 8 2PERCENT INFO = es
O 2 4 $ $
Fl GU R E 9 THEORETIC AL DISTRIBUTIONS OF TEACHERS RATINGS BASED ON
ASSUMPTIONS OF NORMALITY AND EQUAL INTERVALS
58Ott 5S

- 54 -
F E
PERCENT COVERED * 64 PERCENT COVERED * 97PERCENT NORMAL a 68 PERCENT NORMAL * 96PERCENT INFO a 92 PERCENT INFO a 9 7
0
G
a 4 4 6
PERCENT COVERED a 99PERCENT NORM AL a 98PERCENT INFO = 89
FIGURE 9
0 0 0;10,
0 2 4
59
6 4

-55-
The second indicator, per cent normal, is a measure of how
close the distribution of teachers' ratings is to the ideal bell shape
required for statistical purposes.* And the third indicator, per cent
information, is a measure of how much the ratings discriminate among
students.
The best of the theoretical distributions on all these
indicators is Figure 9A. It should be noted that Figure 9A is a
cross between the rectangular, and bell shaped distributions. The
bell shaped distribution represented by Figure 9G is weaker than A
on the informationindicator,but is very good on the other two.
Both distributions, A and G, would be considered good for questions
in a section '-f the TRQ consisting of several other questions.
However, if there were only one or two questions in the TRQ section,
the distributions of these questions should look more like G (for
reasons discussed above).
If the rating categories are too broadly defined (a3 in
Figure 9B), there are almost no pupils rated with zero or eight,
and the information content of the ratings is considerably reduced.
If the rating categories are too narrowly defined (as in Figure 9C),
there are many students who do not fit on the scale and must be "forced"
into categories zero and eight, making the distribution quite different
from the optimal ,911 shape. Figures 9D, 9E and 9F show what happens
when the actual pupil average ability does not properly correspond with
a rating of four. The "actual" distributions are the same as for
Figures 9A, 9G and 9C respectively, but the actual average ability
* The exact method by which these were computed is given in theTechnical Supplement to this report.
60'0 Olitk01.

-56
corresponds with a rating of six for D and F and with a rating between
four and six (i.e. five) for E. In all cases this misalignment causes
the distributions to look quite different from what they would if
they were properly aligned, and in every case the values of all three
indicators are decreased. Clearly, it is important to design questions
so that a rating of four does indeed correspond to the actual average
ability of the students.
We have now a standard against which to judge each of the
questions on the TRQ. We could plot distributions of the responses
teachers eive to each of the questions, and compare these distributions
with the theoretical ones in Figure 9. We could even compute two of
the indicators (per cent information, and per cent normal) for each
question. This would be a lot of work. And fortunately there is
a ouch quicker method which produces very satisfactory results.
We have noted two ways in which the distributions of
teachers' ratings can fail to be good, the rating categories can be
too broadly (or too narrowly defined), and the rating category "four"
can fail to match the actual average ability of the students. An
examination of the question average ratings and standard deviations
for the theoretical distributions in Figure 9 will reveal that these
two statistics are excellent indicators of these two types of errors
in question design. If the rating categories have been too broadly
defined (as in distribution B) the standard deviation of the distri-
bution is small-- say, less than 1.75. Similarily, if the rating
categories have been too narrowly defined (as in distributions C
and F) the standard deviation of the distribution is large say,
greater than 2.65. And, as might be expected, when the actual student
average ability does not fall into category four, the average of the
61

-57-
teachers' ratings is displaced in the direction of the actual student
average. Distributions D, E and F all show displacements of more than
0.8 in their averages.
It then seems reasonable that we can use the values of the
average ratings and standard deviations for each question to decide
how good or bad it is.
Figure 10 is a plot of the averages and standard deviations
of each of our theoretical distributions. Each point represents one of
the distributions. The numbers indicating the "per cent covered" and
"per cent informatiorrare shown below each point. Three mirror image points
marked -D, -E and -F have been plotted to the left of the mid -line of
the graph; these represent distributions which are the same as D, E, F,
but for which ratings zero and eight are interchanged and ratings two
and six are interchanged. Such a reversal affects only values of the
averages; all other statistics are unaltered.
We have concluded that any distribution similar to A or G
should be considered good if it is part of a TRQ section containing a
number of other questions. We have also concluded that all the other
theoretical distributions represent less than good questions. With
this (and other factors) in mind, the large circle encompassing both
points A and G was drawn on Figure 10. Any TRQ question having an
average rating and standard deviation which, when plotted, falls
within this circle, can be considered as reasonably well designed. The
closer to the centre of the circle the question comes, the better it
is. Questions which are plotted outside the circle should be examined
with an eye to improving them. The place where a question is plotted
with respect to the circle tells us what sort of things to look for.
62

z0I
cC 0"
in <I
>taaOcccc
OzI-qn
3
2.9
1.9
t5
a
05 S
S
a6492
0OS
97
MA
X.
INF
OR
MA
TIO
N
In64
92
0100
SU
GG
ES
TE
DB
OU
ND
AR
YF
OR
ITE
MR
EJE
CT
ION
FR
OM
AS
EC
TIO
N
05 S
S
'SU
GG
ES
TE
DB
OU
ND
AR
YF
OR
ITE
MR
EJE
CT
ION
IFIT
IS T
OB
E T
RE
AT
ED
IND
EP
EN
DE
NT
LY
II
It
34
A V
E R
A G
ER
AT
IN G
0.1
FG
UR
E 10
PL O
T.
OF
TH
EO
RE
TIC
AL
DIS
TR
IBU
TIO
NS
FR
OM
FIG
UR
ES
9A T
O 9G
AC
CO
RD
ING
TO
TH
EIR
AV
ER
AG
EV
ALU
ES
AN
D S
TA
ND
AR
DD
EV
IAT
ION
S.
PE
RC
EN
TA
GE
*CO
VE
RE
DA
ND
PE
RC
EN
TA
GE
INF
OR
MA
TIO
NR
EC
OR
DE
DB
ELO
WE
AC
HP
OIN
T.

-59-
For instance, questions falling below the circle in the region of
theoretical distribution B, have rating categories which are too broad,
with the result that ratings of zero and eight are almost never made.
Questions which are plotted above and to the right of the circle have
categories which are too narrow and a tendency for teachers to rate
their pupils with sixes and eights.
When there are only one or two questions in a section, we
have concluded that the distribution of ratings should closely match
theoretical distribution G, the bell shaped distribution. For such
questions the smaller circle applies in the same way that the large
circle does to all other questions. Questions plotted inside the small
circle should be considered good, while all others should be considered
capable of improvement.
This rather lengthly section describes development of a very
quick and easy method for assessing the question distributions. Average
ratings and standard deviations are produced as a part of almost all
statistical analysis computer programs. Consequently, we now have an
accurate method for judging the question rating scales without the need
for any additional computations.
Effectiveness of the Individual Questions - Data
We have seen in the previous section of this report that "in
theory" the average rating and standard deviation for a question should
be good indicators of the shape of the distribution of ratings. T%
show that this is true in practice, a few distributions are plotted
for some actual questions on the TRQ. Figure 11 shows distributions for
four representative questions: TRQ-SK #39, TRQ-1 #24, TRQ-3+ #1 and
TRQ-3+ #10. By referring to Figures 9 and 10, we-can confirm that these
questions have distributions almost exactly like those that would be
predicted by our theory.
0;006464
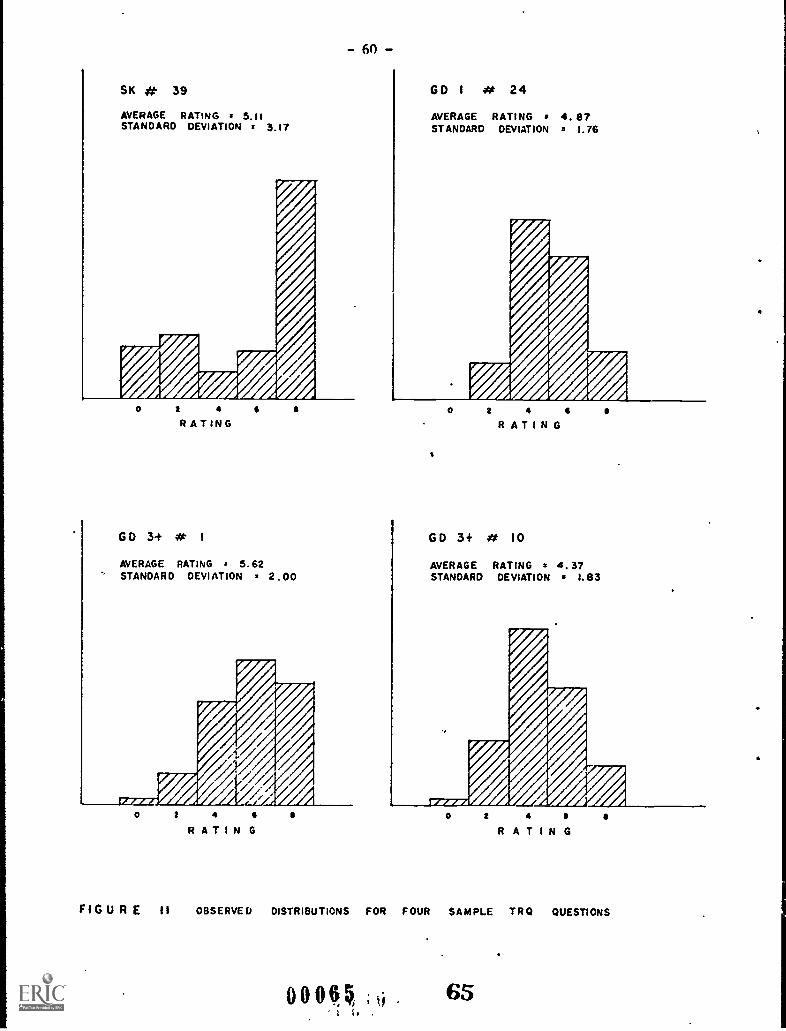
- 60 -
SK # 39AVERAGE RATING 2 5.11STANDARD DEVIATION 2 3.17
O 2 4
RATING
GO 3+ # I
AVERAGE RATING 3 5.62' STANDARD DEVIATION 2 2.00
GO I # 24AVERAGE RATING a 4.87STANDARD DEVIATION 2 1.76
O 2 4
RATING
a
GO 3+ # 10
AVERAGE RATING a 4.37STANDARD DEVIATION 1.83
O 2 4
R AT1N G
FIG U R E II OBSERVED DISTRIBUTIONS FOR FOUR SAMPLE T R Q QUESTIONS
0006 ki 65
- 61 -
For instance question SK #39 would be plotted on Figure 10 just above
theoretical distribution F. Thus, if we knew only the average rating
and standard deviation for th4s question, we would conclude from referring
to Figure 10 that the distribution for this question would look much
like theoretical distribution F, but a bit more extreme. This is
exactly what the observed distribution for question SK #39 looks like!
We find an equally good correspondence between theoretical and observed
distributions for the other sample questions in Figure 11. We can thus
conclude that the average rating and standard deviation are sufficient
to describe the distribution of ratings for a question in practice,
as well as in theory.
Now, we can look at the data! Average ratings and standard
deviations for every question on all four versions of the TRQ are
plotted in Figures 12, 13, 14 and 15. The theoretical distribution
points and the circle defining good questions from Figure 10 are
superimposed on each of these figures for easy reference. A quick
glance at Figures 12 to 14 gives the impression that overall, about
half of the TRQ questions fall in the region we define as being "good",
and that each of the questionnaire versions seems to reflect a distinctive
style in the type of distributions of teachers' ratings obtained.
The questions on the kindergarten version seem to cover all
types of distributions, while questions on the other versions all
seem to be quite similar to each other in the shape of their distributions.
The senior kindergarten questionnaire was the first of the TRQ versions
to be developed. It begins with a set of general instructions to
the teacher, describing the rating scale and defining the categories
as: 0 for poor, 4 for average and 8 for superior.
)
66

2
3
o-N
®
- m
t1
Ittt
II
I
2
-o
aI 1r-
0
41-1
II
II
0
1 __I _11_1_1_11
S
E
os
1 2 . 5
AN
I IIIIIt L_L. III
II ! Ill It It III It
Is
AV
ER
AG
ER
AT
1NG
S
FIG
U R
E12
AV
ER
AG
ER
AT
ING
SA
ND
ST
AN
DA
RD
CE
VI A
TIO
NS
FO
RK
IND
ER
GA
RT
EN
QU
ES
TIC
NN
AIR
E .
QU
ES
TIO
NN
UM
BE
RS
INC
IRC
LES
,T
HE
OR
ET
ICA
LD
IST
RIB
UT
ION
SIN
SQ
UA
RE
S.
2

OaOccO 44
5.0
2.3
2.0I.5t.0
L
I3
4a
11
11
11
T- 1
11
11 -
11
11 -
11
ii
li
il
lf
11
lI
Ii
Il
11- 1
1 usti f t11111
tI
I1
II
18
AV
ER
AG
EP
A T
I N
llla
rI
G U
R E
13A
VE
RA
GE
RA
T IN
ri SA
ND
ST
AN
DA
RD
DE
VIA
TIO
NS
FO
RG
RA
DE
ON
EQ
UE
ST
ION
NA
IRE
.
QU
ES
TIO
NN
UM
BE
RS
INC
IRC
LES
.
m.1
awl
ON
O
*al 3.0
2.5
2.0
1.0

3.0
z04
2.5
w00cc4z2.0
4
1.5
tt4
5111 11111111i
34
AV
ER
A G
ER
AT
ING
11
11
11
11
1
!fill!!!5
FI
G U
R E
14A
VE
RA
GE
RA
TIN
GS
AN
DS
TA
ND
AR
DD
EV
IAT
ION
SF
OR
GR
AD
ET
WO
OU
ST
ION
NA
IRE
.Q
UE
ST
ION
NU
MB
ER
SIN
CIR
CLE
S

z0I--
4>Wo0It4az4i-t()
3.0
2 . 5
2.0I. 3
tS
11
11
17
1T
TT
II
I T T
T-111-11111111-1711-T
-11-11-I El
1-111[111111
Q0
0
00
tI
I 1111
1 11111 Itt
I1 III
IIt II 11111 1
I t11111IIIII2
34
A V
E R
A G
ER
A T
I N G
5
i..L-1
I
414mob
awl
t
FI
G U
RE
I5A
VE
RA
GE
RA
TIN
GS
AN
DS
TA
ND
AR
DC
E V
I AT
ION
SF
RO
MG
RA
DE
- TH
RE
E - P
LUS
QU
ES
TIO
NN
AIR
E,
GR
AC
ES
IXA
DM
INIS
TR
AT
ION
.Q
UE
ST
ION
NU
MB
ER
SIN
CIR
CLE
S

-66-
The actual questions on the questionnaire contain specific
instru, ions for some of the rating cagegories, but not for others.
This tend to make certain of the rating categories more prominent
in the teachers' minds and could lead to rather odd shaped distributions.
This appears to be what happened in the case of question 39 which reads
as follows:
"[Is the child] able to come to school alone or with anyother child on time?
- If the child is dependent on mother to bring him toschool on time, rate 0.
- If the child is dependent on one certain child to bringhim to school on time, rate 2.
- If the child comes to school alone, but is often late,
rate 0.
- If the child is consistently able to come to school
alone and on time, rate 8."
The question specifically refers to ratings of 0,2 and 8; the two
ratings (4 ai'd 6) which are not mentioned are the two which are used least.
These early problems with question design were largely overcome
on the grade one version of the TRQ. Here, the policy of mentioning each
of the five possible ratings for each question was begun. The rating category
"four" was carefully tied to "normal" pupil behaviour for each question. That
this was done successfully, can be easily seen in Figure 13; the average ratings
cluster around 4 quite closely. The one consistent problem with the grade
one questions is their small standard deviations. Readers will recall from our
theoretical discussion that a omen standard deviation results from too broad
a definition of the rating categories and results in a severe under-utiliza-
tion of rating categories zz.ro and eight. Theoretical distribution B in Figure 9
represents a typical distribution from the grade one=version.
010 0, 7171

-67-
The grade two questionnaire did not specifically tie rating
category four to the pupil average for every question, and it slightly
narrowed its rating categories. Unfortunately, there was a tendency on
the part of the designers to underestimate the pupils' abilities, or
perhaps it was a tendency for teachers to overestimate the pupils'
abilities. In any case, there is a slight bias towards rating the
pupils high on all of the grade two questions.
The grade three plus questionnaire is the best of the four.
Only four of its questions are outside the "good" region, and the
question on school ability, which is the only question in the prediction
section, is as close as could be to the ideal theoretical distribution G.
3ecause of the small number of questions in the sections of the 3+
questionnaire, the small, inner circle is a more appropriate criterion,
and even here, only five of the questions fail to qualify as "good".
On the whole, however, there is considerable scope for improve-
ment of the TRQ questions. In all cases it should be possible to achieve
the desired improvement through a careful rewording of the instructions
for assigning particular ratings to a question. Let us look briefly
at the sample questions from Figure 11 to see what types of rewording
would be suggested.
Question SK 439 has been quoted above. The distribution of
this question shows that more than half the ratings fall into category
8, indicating that "the child is consistently able to come to school
alone on time". If we are to achieve a good distribution of ratings
for this question, we will have to think of some behaviour that is even
better. Recall that the teacher was to rate "two" if the child relied
on one other child to bring him on time. How should we rate the child
who takes responsibility in seeing that some classmate arrives at
school on time? At the moment, we can give him a scorelthigher than eight.w1
-00072

-68-
By creating a new category for children who caa not only bring them-
selves but others as well to school on time and by pooling two of
the old categories (say 4 and 6) we will be well on the way to creating
a more balanced rating scale.
Question 24 from the grade one questionnaire reads as follows:
"[Can the child] gallop, hop on one foot and skip in aforward direction?
Rate 0 - cannot hop on one foot, gallop and skip.
Rate 2 - attempts some or all of these activities and cando one or two (e.g. - can gallop, but cannot skip).
Rate 4 - performs as described in the question.
Rate 6 - consistently performs these activities with easeand good coordination.
Rate 8 - can also hop and skip backwards, and can gallopsideways and backwards."
The distribution for this question in Figure 11 shows that there were
essentially no ratings of zero. Thus, we could drop this category all
together. Also, the over-used categories (4 and 6) should be redefined
to consist of three new categories. For instance:
Rate 0 - if child still cannot perform one or more of theseactivites.
Rate 2 - if child can do all these, but with some lack ofcoordination.
Rate 4 - can do all these well.
Rate 6 - also attempts hopping and skipping backwards orgalloping sideways and backwards with some success.
Rate 8 - can also hop and skip backwards and gallop sidewaysand backwards with some success.
Most of the questions on the grade one questionnaire could be improved
by narrowing the categories in a similar manner.
7300073

-69-
Question seven on the 3+ questionnaire could be improved by
narrowing the categories in a similar manner.
Question one on the 3+ questionnaire seems to have an appropriate
category width, but it is not properly centered. Category zero could
be dropped, and each of the other categories moved down one place, and
a new category defined for pupils whose performance is superior to the
present category eight.
These have just been a few examples of the sort of rewording
which might improve the distributions of ratings for some of the questions.
Users of the questionnaire will have to be very careful in rewording questions
to avoid making matters worse than they now are. In all cases where new word-
ing is being used, a pre-testing of the questionnaire and an analysis of the
results would be necessary to see that the changes are having the desired effects.
Of course, any user who is serious enough to undertake a re-
vision of the wording of the questions will probably also wish to discard
certain questions and to create new ones. There is reason to think
that some of the questions might best be discarded because they do not
properly relate to the other questions on the test. Our next task will
be to examine the relationships between the individual questions and
the contributions of the questions to the TRQ total score.
Contributions of the Individual Questions
A question which produces a perfect distribution of teachers'
ratings can still be useless if it does not measure some aspect of school
success. In this section we will examine each of the TRQ questions to see
how much they contribute to our overall measure of school success. We
are assuming, for this purpose, that there is some single dimension
called school success, on which it is possible to rank students in a
meaningful way. We also ausume that the TRQ total score is a valid general
74'4,0101074

-70-
measure of school success. We can thus estimate the extent to which
a question measures this general school success factor by looking at
the correlations between the individual questions and the test total.
Questions which have low correlations with the TRQ total will be
questions which contribute only a small amount to the overall school
success measure, while questions having a high correlation with the
TRQ total will be questions which are, in themselves, good measures
of school success.11,
From these correlation coefficients, it is possible to
calculate the percentage contribution of the individual questions
to the TRQ total (see appendix B). Any question which contributes
less than 50 per cent of its information to the total TRQ score is
contributing more "noise" than "signal" to the overall measure of
school success. However, since the "noise" contributed by one question
will as likely as not cancel out the "noise" contributed by another
question, it is probably worthwhile to retain questions which contri-
bute as little as 25 per cent of their information. But, even if a
question contributes less than 25 per cent to the total TRQ score, it
may be a valuable part of one of the sections of the test. Thus, the
user of the TRQ should carefully examine all aspects of a question's
performance before deciding to eliminate it.
Looking at the information presented in this section in a somewhat
more Positive light, there could well be a circumstance when a user of the
TRQ would like to develop a quick measure of the type of school success
covered by the TRQ sections. A short form could be manufactured from any one
of the TRQ versions which consists of only one "general school success"
section. This could be composed from the (say) ten questions on that version
of the TRQ contributing most to the total score. Constructing a short
7500075

- 71 -
questionnaire in this way would ensure collecting the information about the
general school success factor in the most efficient way.
Looking now at the actual data, tables 8A and 8D show the
correlations and per cent contributions for each question on the four
TRQ versions. There are four questions which contributed less than 25
per cent to the TRQ total; these have been marked with asterisks;
all four are in the kindergarten TRQ. All four of these (30,31,37,39)
also showed quite poorly in our analysis of the questions' distributions.
Two of these four "poor" questions are in the physical section.
In fact, none of the questions in the physical sections of versions SK
1 or 2, makes a contribution of more than 50 per cent. This finding
fits in with our previous observation that the physical section total
score correlated little with the other sections or the TRQ total score.
The only other fact of general interest to be gleaned from
these figures is that the correlations for the vast majority of these
questions fall between .70 and .90. This fact will help us to greatly
simplify our representation of the correlations between questions in
the following sections.
Correlations Between Questions - Theory
Looking at the relationships between the individual questions
will help us decide if questions which have been grouped together in one
section of the TRQ actually belong to such a grouping. It is necessary
for us to look at these correlations if we are to determine if the
questions can be grouped into sections in a more effective way. Unfortu-
nately, this task is more difficult than it at first seems. The problem
is the number of pairs of questions; on the kindergarten questionnaire
which has 40 questions, there are 780 pairs.
()pore 76

-72-
TABLE 8A
CORRELATIONS OF QUESTIONS ON KINDERGARTEN TRQ WITH TEST TOTAL
Question No.and Section Correlation Contribution
Question No.and Section Correlation Contribution
Language Mental cont'd.
1 .78 61 21 .77 59
2 .78 61 22 .75 56
3 .77 59 23 .78 61
4 .81 66 24 .81 66
5 .84 71 25 .61 37
6 .82 67 26 .74 55
7 .70 50 27 .73 53
8 .53 28 28 .75 56
9 .73 53 20 .73 53
Social Physical
10 .51 26 30* .40 16
11 .63 40 31* .41 17
12 .76 58 32 .51 26
13 .82 67 33 .64 41
14 .58 34 34 .59 35
Mental Emotional
15 .61 37 35 .71 50
16 .77 59 36 .59 35
17 .75 56 37* .49 24
18 .73 53 38 .60 36
19 .65 42 39* .32 10
20 .84 71 40 .69 48
* Contributes less than 25% to the total TRQ. 7
00077
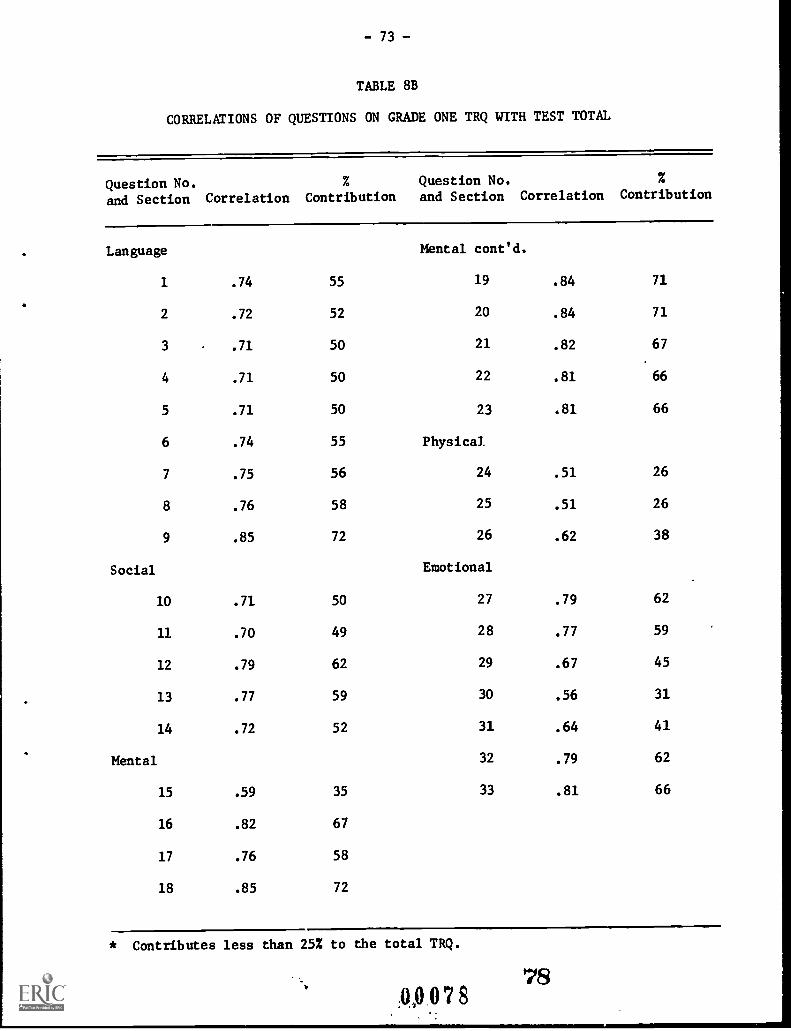
- 73 -
TABLE 8B
CORRELATIONS OF QUESTIONS ON GRADE ONE TRQ WITH TEST TOTAL
Question No.
and Section Correlation Contribution
Question No.and Section Correlation Contribution
Language Mental coned.
1 .74 55 19 .84 71
2 .72 52 20 .84 71
3 .71 50 21 .82 67
4 .71 50 22 .81 66
5 .71 50 23 .81 66
6 .74 55 Physical
7 .75 56 24 .51 26
8 .76 58 25 .51 26
9 .85 72 26 .62 38
Social Emotional
10 .71 50 27 .79 62
11 .70 49 28 .77 59
12 .79 62 29 .67 45
13 .77 59 30 .56 31
14 .72 52 31 .64 41
Mental 32 .79 62
15 .59 35 33 .81 66
16 .82 67
17 .76 58
18 .85 72
* Contributes less than 25% to the total TRQ.
opo7878

- 74 -
TABLE 8C
CORRELATIONS OF QUESTIONS ON GRADE TWO TRQ WITH TEST TOTAL
Question No. Question No.and Section Correlation Contribution and Section Correlation Contribution
Language Emotional
1 .87 76 20 .83 69
2 .75 56 21 .59 35
3 .74 55 22 .60 36
4 .79 62 23 .78 61
5 .81 66 24 .84 71
6 .81 66 Physical
7 .80 64 25 .58 34
8 .79 62 26 .63 40
9 .82 67 27 .52 27
Social
10 .79 62
11 .81 66
12 .75 56
13 .80 64
Mental
14 .75 56
15 .77 59
16 .84 71
17 .86 74
18 .83 69
19 .85 72
* Contributes less than 25% to the total TRQ.9
00079

-75-
TABLE 8D
CORRELATIONS OF QUESTIONS ON GRADE THREE-PLUS TRQ WITH TEST TOTAL
Question No.
and Section Correlations Contribution
Adjustment
1 .50 25
2 .70 49
3 .80 64
4 .73 53
Performance
5 .80 64
6 .77 59
7 .72 52
8 .75 56
9 .85 72
Creativity
10 .75 56
11 .73 53
Prediction
12 .83 69
* Contributes less than 25% to the total TRQ.
0 0 0 8 0
3IJ
80

-76-
Because statisticians are often faced with problems of this type,
a number of methods have been developed for simplifying the process of
examining correlations. The procedure to be used here is called the
"principal components method for reducing, a correlation matrix." Although
the statistical procedures involved are quite complex, an intuitive under-
standing of the results of this method is quite possible.
Let us take the 3+ version of the TRQ as an example because it has
the smallest number of questions, and the smallest number of principal
components. It takes as many components as there are questions to completely
account for, or describe, all the relationships among the questions.
Although the 12 questions can be paired to provide 66 correlations,
it obviously takes only 12 components to explain all the combinations because
we only have 12 pieces of information to start with. Each question deals
with one specific aspect of school success and we are trying to combine these
so that we can talk about only one or two (or three) more general aspects of
school success.
These principal components allow us to combine the correlations among
the questions. We can choose a few principal components to build a simple
model that represents most of the correlations, but one which lacks detail,
or we can choose more principal components and build a more complete and
detailed model. There is no problem in deciding which of the principal
components to choose because they are arranged for us in order from the most
general to the most specific, and we always choose beginning with the first
one. The first principal component contains information on the most salient
relationships between the questions, the second principal component includes
the next most salient relationships, and so on. If we should build a model
based on all of the principal components, we will have completely described
all of the relationships between all of the questions.
81068.1

- 77 -
The first principal component we have already met in the guise of
the test total. Each of the questions is represented in this component by
the correlation of the question with the test total. Since we have examined
these figures in the previous section, let's move right on and consider the
two component model. This model for the 3+ questionnaire is shown in Figure 16.
The two principal components are represented by the horizontal and vertical
axes, and the questions are plotted according to their correlations with the
two principal components. Thus, question one correlates .50 with the first
principal component, and -.73 with the second principal component.
Recall that the second principal component includes the most salient
relationships between the questions that were not covered by the first component.
That is, the second principal component covers the most salient deviations
from TRQ total. Since question one had least in common with the test total,
it is not surprising to see that it has a great deal in common with the
second principal component.
Theoretically, the questions could be plotted anywhere inside the
circle in Figure 16. The fact that they are all grouped together on the right
side of the circle is a result of the high correlations of all of the questions
with the test total. The closer the plot of a question is to the edge of the
circle, the better the model accounts for the data of that question. Thus,
question one is accounted for quite well by the two component model, even though
the one component model (the test total) accounted for it rather poorly.
Now let us see how the model helps us interpret correlations. Imagine
that for each of the questions plotted in Figure 16, a line was drawn from the
point representing the question to the middle of the circle, asis illustrated
with questions 2 and 4 in Figure 16. Then the angle between these lines for
any two questions represents the correlation between the two questions. The
smaller the angle, the larger the correlation. (Actually, the correlation
820 041051
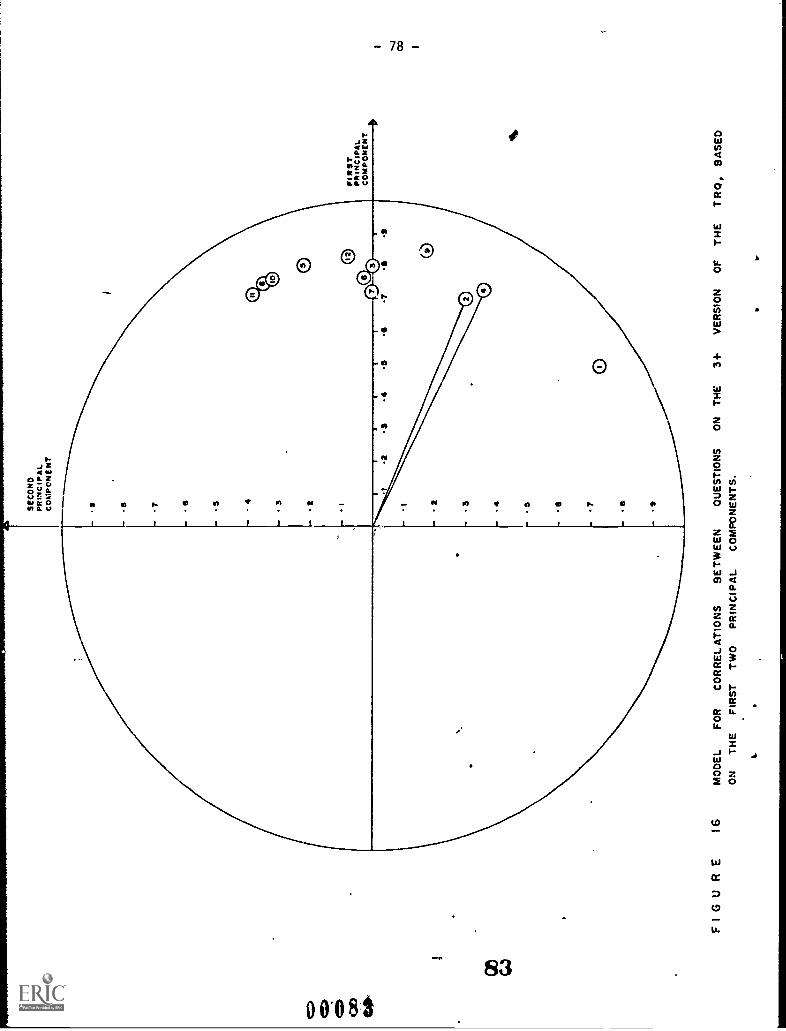
SE
CO
ND
PR
INC
IPA
L.C
OM
PO
NE
NT
1
PI R
ST
PR
INC
IPA
L.C
OM
PO
NE
NT 11
.
F I
G U
RE
16M
OD
EL
FO
RC
OR
RE
LAT
ION
SB
ET
WE
EN
QU
ES
TIO
NS
ON
TH
E3+
VE
RS
ION
OF
TH
ET
RQ
,B
AS
ED
ON
TH
EF
IRS
TT
WO
PR
INC
IPA
LC
OM
PO
NE
NT
S.

-79-
between the two questions is represented by the cosine of the angle of the
two lines). Thus, according to the model, questions 2 a.id 4 are highly
correlated, while questions 1 and 11 will have almost no correlation.
Now we can note that these angles between the points represent-
ing the questions are closely related to the distances between the points
and hence, to the difference between the correlations of the questions on
the second principal component. That is, the greater the vertical distance
between two questions in the model, the smaller the correlation between
them. With some additional loss in accuracy of our model, we can in this
way reduce our two component model to a one dimensional model.
In a similar manner, we can reduce L. three component motel to
two dimensions. The third principal .---poneitr contains the most significant
deviations from the test total that vve not picked up by the second vincipal
component. The three corponent model is three dimensional and is thus contained
within a sphere rather than a circle, as is illustrated in Figure 17. The first
principal component is shown in Figure 17 as the vertical axis of the sphere.
Thus, the plotted points representing the questions will all be in a region
near chT top of the sphere. Because most of the questions have correlations
', 1
of atom). .7LwIll the first principal component (TRQ total), most of the
A
pointl reftesencing tae questions will fall near to a plane which is
parallel to the second and third principal components' axes and cuts the
first p cipal component's axis at .70. In fact, an observer looking down
on the model from above would see the question points almost as if they
were on this plane. By plotting the question points in terms of their
correlations with the second and third principal components, we are
generating the view that is seen by looking down on the three component
model from above.
00084

MOST OF POINTSREPRESCNTINGTHE QUESTIONSFALL. IN THIS REGION
- 80 -
0
4_tt, POINT OF VIEW FOR
COMPONENTS TWO ANDTHREE ( FIGURES 18 - 21 )
PLANE ON WHICH THEQUESTION POINTS AREASSUMED TO FALL
.-...-47..... .-___..--10- POINT OF VIEW
FOR COMPONENTSONE AND TWO( FIGURE 16 )
THIRDPRINCIPALCOMPONENT
FIRSTPRINCIPALCOMPONENT
SECOND PRINCIPALCOMPONENT
F I G U R E 17 ILLUSTRATION OF THE THREE DIMENSIONAL PRINCIPALCOMPONENTS t MODEL
85
00 :8.5'
1 1t
I

On a plot of the questions on the second and third principal
components, the greater the distance between the points, the smaller
will be the correlation between the questions. This follows by the
same line of reasoning that we used in reducing the two component model.
In the three component model, the angle between the questions
at the centre of the sphere is related to the correlation between the
questions. Tae larger the angle, the smaller the correlation, and
the larger the distance between the points.
We have now developed a way of representing the large number
of correlations on a single graph. This representation is only approxi-
mate, but it is good enough to be quite useful. However, because it
is approximate, we must be careful to cross-check any conclusions we
reach. This can be done by looking at the actual correlations and by
looking at the higher order principal components. But for the moment,
let's just look at the simplified model, based on the second and third
components.
Correlations Between Questions - Data
We can now use the method discussed in the previous section to
get an idea of the correlations between the individual questions. We
will first examine each of the TRQ versions to see if the questions
which have been placed together in sections have high correlations
with each other as they should. If the division of the TRQ into sections
is a good one, we would expect to find questions from one section being
close together (high correlation) and questions from different sections
being far apart.
Data for the four TRQ versions have been plotted separately
in Figures 18 to 21. Questions from the different sections have been
plotted with different symbols. Glancing over Figures 18 to 21, it
0008686

-82-
quickly becomes clear that some of the sections (like the kindergarten
language section) are highly homogeneous, while other sections (like
the kindergarten mental section) have questions which are widely scattered.
The grade one questionnaire and the grade three-plus question-
naire, seem to meet the criterion of homogeneity of sections fairly
well. In grade one (Figure 19), the language section, except for question
nine, appears quite separate to the right of the graph, and the mental
section questions are by themselves at the top of the graph. The
physical, social and emotional questions overlap somewhat in the lower
left of the graph, but all of the questions within one section are
reasonably well correlated, In order to determine if the physical,
social and emotional sections are distinct from one another, it is
necessary to look at higher order principal components. Data for
these are presented in the Technical Supplement to this report. The
fourth principal component clearly shows the physical section to be
separate from the others and the sixth principal component shows the
social and emotional sections to be somewhat separated, although still
more closely related than any other two sections. It seems, then,
with the exception of question nine, that the sections of the grade
one questionnaire have been very well constructed.
The other TRQ version which appears to be well constructed
is the grade three-plus version. The homogeneity of the sections is
not so pronounced as it was in the grade one questionnaire, but each
of the sections does have its own exclusive region of the graph, except
for the one-item prediction section which is right in the middle of
the mental section. Consequently, it appears that the mental and
prediction sections could be combined.
00087
Q
87

Col
CO
0
itOU
s
-
O
1
..8t
O- 9
LAN
GU
AG
E
O 10
14 SO
CIA
L
1529 M
EN
TA
LV
30- 34 PH
YS
ICA
L35 40 E
MO
TIO
NA
L
It
V
ri3IL
......wrs.....w
ir-.
V
r13
SE
CO
ND
CO
M!1O
NE
NT
F I G
UE
.18
SE
CO
ND
AN
DT
HIR
DP
RIN
CIP
AL
CO
MP
ON
EN
T S
FO
RK
IND
ER
GA
RT
EN
QU
ES
TIO
NN
AIR
E
O00 oo
S

.
O1
tLA
NG
UA
GE
A 10 - 14
SO
CIA
L.
19 - 23 ME
NT
AL
V 24
26 PH
YS
ICA
L
0 2733 E
MO
TIO
NA
L
A
(")
co
4
IE
may
-
'
41.
"^""
.1-""-.
I©
eI
rir41- "4. z zzz
O
O
..4--a
0-I.- ....,...
'tS
EC
ON
0C
OM
PO
NE
M .1`...
r
FIG
UR
E19
SE
CO
ND
AN
DT
HIR
DP
RIN
CIP
AL
CO
MP
ON
EA
TS
FO
RG
RA
DE
ON
EQ
UE
ST
ION
NA
IRE
.0

O I- 9
LAN
GU
AG
E
LSI 0 - 13
SO
CIA
L
ME
NT
AL
EM
OT
ION
AL
PH
YS
ICA
L
I 4-,
I 9
020
- 24
V25
- 27
a)
a
v
st7
it
We.
err, 4.31i...
ID
0
AIIIII
-J.. 0
e0
0G
IL
if4
r
-.5-.5
- 1-
Io
SE
C 0 N
DC
OM
PO
NE
NT
11
ii
FIG
UR
E20
SE
CO
ND
AN
DT
HIR
DP
RIN
CIP
AL
CO
MP
ON
EN
TS
FO
RG
RA
DE
TW
OQ
UE
ST
ION
NA
IRE
.
- 5
3
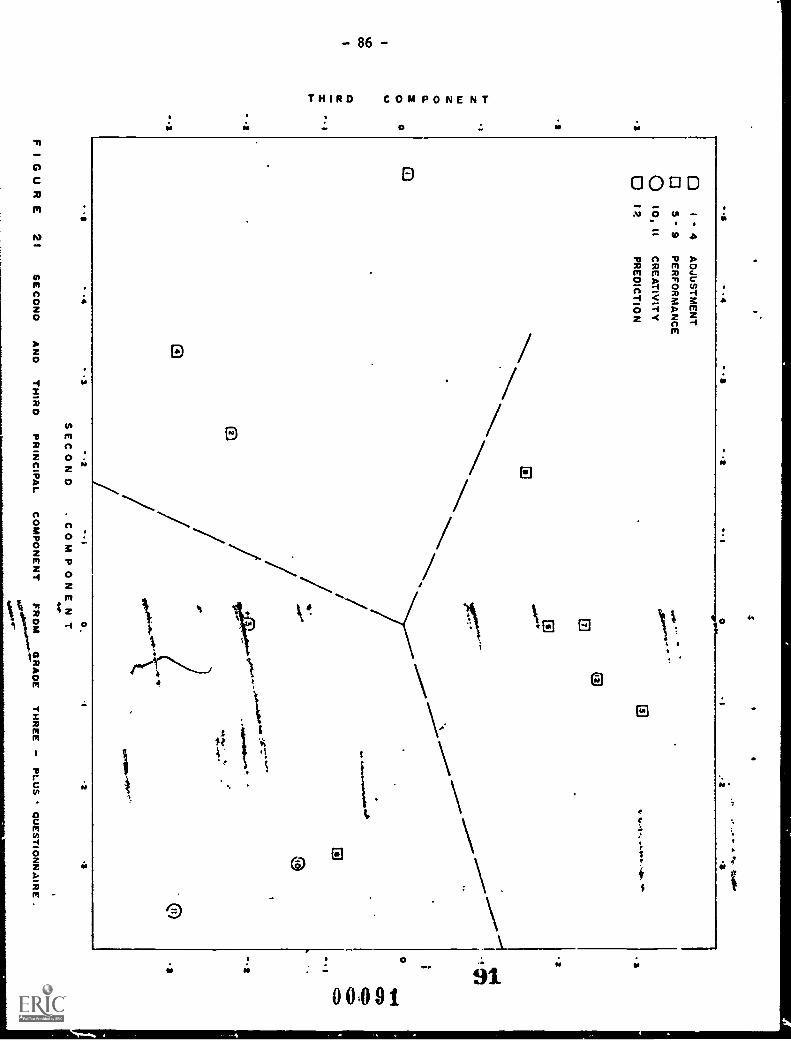
O1'4
AD
JUS
TM
EN
T
3 ' 9P
ER
FO
RM
AN
CE
010, II
CR
EA
TIV
ITY
0I P
.P
RE
DIC
TIO
N
O
-I
0
a
a3
0
.00....
:-.0.r-w
IllorOrV
te'
SE
CO
N D
-oa
. CO
M P
ON
E N
T
F I G
U R
E21
SE
CO
ND
AN
DT
HIR
DP
RIN
CIP
AL
CO
MP
ON
EN
TF
RO
MG
RA
DE
TH
RE
EP
LUS
QU
ES
TIO
NN
AIR
E .
air.sloo
-87-
Now let's look at the two more difficult appearing TRQ
versions. Two of the scales on the kindergarten questionnaire appear
to be reasonably homogeneous. The language section, with the
exception of question nine, and the emotional section, with the
exception of question 39, are both reasonably well contained in their
own areas on Figure 18. But the other three sections, and especially
the mental section, have questions which are plotted at considerable
distances from each other. Looking at the higher order principal
components doesn't help much either; it does show the physical questions
to be quite different from the other questions, but it also confirms the
two clusters of physical questions which appear in Figure 18. We must
conclude then, that the division of the kindergarten TRQ questions into
sections is not very good.
The remaining TRQ version is the one for grade two, and like
the kindergarten version, its sections have not been too well defined.
A glance at Figure 20 shows that with the exception of the physical
section, none of the sections are homogeneous. This impression is
confirmed by looking at the higher order principal components; the
physical section is quite separate from the rest of the questions,
but all of the others are quite thoroughly mixed up. It appears as if
we will have to give some consideration to redefining the sections of
the kindergarten and grade two questionnaires
1.
gut, before ye tackle the problem cm, rLarranging the sections,
let'sI
look more closely at the individual TRQ O,uestions to see how
well they fit in with the other questions on the test,, To do this,
we begin by examining how well the questions fit into our three com-
ponent model. Those.questions which fit poorly into the model will
likely be those which bear little relationship to the majority of
9200092

-88-
the questions on the test. These suspected "non-conforming" questions can
then be examined more closely by looking at their correlations with other
questions and with the, higher order principal components.
In order to see how well the questions fit into the three component
model, we calculate for each question a statistic called a communality. This
number can be considered to be the square of the correlation coefficient
between the actual question and the question as represented in the model. Thus,
if we multiply these communalities by 100, we get a percentage which describes
how well that question is described within the model. Table 9(A,B,C & D) gives
these figures for all of the TRQ questions on all of the four versions. We will
take a figure of filt:35 than 50 per cent in common with the model as a signal
of a possible "non-conforming" question. There are 15 such questions; ten
of them on the kindergarten questionnaire. After a careful examination of
each of these questions in their relationships to the other questions on
the TRQ, I have identified six questions which I recommend be either dropped
from the questionnaire or carefully modified. In doing so, I have considered
the distributions of ratings and the relationship Of the questions to the
TRQ total in addition to the relationships between questions.
Six of these questions are on the physical sections of the TRQ;
these will 1,e discussed separately below. Of the remaining nine questions,
/ two of them, SK #10 and SK #39, are so poorly correlated to the other
;!: questions, that they cannot be thought of as belonging in a section with any
of the other questions. The other seven correlate somewhat with
some of the other questions; usually there are about five correlations
around .50. These questions I consider to be borderline, and recommend them
for removal from the questionnaire, only if their distributions are also
quite poor. Questions 8, 14 and 15 on the kindergarten TRQ and question 15
on the grade one TRQ have this combination of bad indicators and might thus
be removed. 0009393

- 89 -
TABLE 9A
PER CENT ACCURACY OF FIT OF KINDERGARTEN QUESTIONSINTO THE THREE COMPONENT MODEL
Question No.
and Section
PerCent
Question No.
and Section
PerCent
Language
1
2
72
69
Mental
15*
16
42
62
3 70 17 66
4 78 18 67
5 80 19* 48
6 78 20 76
7 65 21 64
8* 38 22 66
9 60 23 68
Social 24 70
10* 28 25 55
11 53 26 66
12 63 27 1 61 t
13 76 28 4; 64I,
14* 46 29 65 1
Question No.
and Section
PerCent
Physical
30 54
31* 44
32 59
33* 47
34* 43
Emotional
35 69
36 68
37* 47
38 50
39* 16
40 57
1
* The asterisk identifies questions with a poor fit A vakue of lnss th .
50% in common with the model is a signal of a possible "nonconforming"
question.
O 9494

- 90 -
TABLE 9B
PER CENT ACCURACY OF FIT OF GRADE ONE QUESTIONSINTO THE THREE COMPONENT MODEL
a .li.,,
Question No.and Section
Per
CentQuestion No. Perand Section Cent
Language
1
2
3
4
5
6
7
8
9
Social
10
I11 i t 4
12 :'
72
66
65
74
73
63
67
67
73
61
60
1674 \
.
t
Social coned.
13 71
14 72
Mental
15* 44
16 80
17 70
18 83
19 72
20 74
21 75
.1 22 '73.N 41
23 /6. ,..
i
Question No. Perand Section Cent
Physical
24* 29
25* 29
26 50
Emotional
27 66
28 60
29 69
30 54
31* 48
32 73
32 731
ak
* The asterisk idena,fies quelltions with a'poor fit. A value of lessthan 50% in common .rith the 'iode1 is a signal of a possible "non-conforming" question.
9500095

- 91 -
TABLE 9C
PER CENT ACCURACY OF FIT OF GRADE TWO QUESTIONSINTO THE THREE COMPONENT MODEL
Question No. Perand Section Cent
Question Nu. Per Question No. Per
and Section Cent and Section Cent
Language Social coned. Emotional
1 77 11 68 20 70
2 64 12 66 21 60
3. 76 13 68 22 58
4 73 Mental 23 70
5 82 14 62 24 71
6 81 15 66 Physical
7 76 16 73 25 50
8 72 17 79 26 60
9 71 18 79 27* 37
Socia;:: 19 74
''74
Ali
* The asterisk ideritifies questions with a poor fit. A value of less
than 50% in common with the model ip a signal of a possible "non-
conforming'question.
9604090

- 92 -
TABLE 9D
PER CENT ACCURACY OF THE FIT OF THE GRADE THREE-PLUSINTO THE THREE COMPONENT MODEL
Question Number and Section Per Cent
Adjustment
Performance
Creativity
Prediction
1
2
3
4
5
6
7
8
9
10
79
70
71
78
77
66
67
71
79
71
79
12 77
* The asterisk identifies questions with a poor fit.A value of less than 50% in common with the modelis a signal of a possible "nonconforming" question.

- 93 -
When we look individually at the questions in the physical
section, we discover that they correlate somewhat with each other, and
hardly at all with the other TRQ questions. Thus, the physical section
is quite loosely knit, and the questions hang together only because
they correlate so little with any of the other TRQ questions. The kinder-
garten physical section is most dispersed; we have seen that it consists
of two relatively independent clusters of questions, which ale distinct
enough that they could be treated as individual sections.
We have now identified a number of individual questions, which
are isolated from the others on the questionnaire. An examination of
the higher order principal components and the correlations yield a
number of interesting clusters in the data, which are not visible in
Figures 18 - 21. As with the kindergarten physical section, these
clusters of questions are almost distinct enough to be treated as
separate sections. One such cluster is questions 26, 27, 28 and 29
on the kindergarten questionnaire. These four questions are very closely
correlated with each other and considerably less correlated with near-
by questions (such as 9, 15 and 25) than appears in Figure 18. A
cluster of two similar questions, 7 and 8, on the grade one questionnaire
is quite distinct from other nearby questions.
On the grade two questionnaire, the two questions about mathe-
matical ability, 14 and 15, form a separate cluster as do questions 21
and 22 in the emotional section.
For the user of the TRQ who is interested in reducing the
number of questions, these clusters of highly related questions provide
him with the opportunity to select one representative question and drop
the rest, or to reword the questions to form one general question covering
all the questions in the cluster.
00 0 9 8
98
-94-
At this point, we have mined the correlations between questions
and the principal components for about as much information as we can get.
We are now in a position to use this information to try and re-organize
the questions into sections, so that all questions within a section will
be as closely as possible interrelated.
Proposed New Sections
Throughout the report we have noted that various problems
with the questionnaire might be improved by a reorganization of the
way in which the questions on the TRQ are grouped into sections. In
our discussion of the reliability of the TRQ sections, we noted that
a failure of sections on two different TRQ versions to overlap each
other exactly, could decrease the reliability. The fact that completely
different sections were used in the three-plus questionnaire makes
it impossible to predict specific aspects of school ability across
the grade two - three boundry. If the questions could be arranged so
th t the same sections were used on all versions of the TRQ, we will
have simplified the questionnaire considerably and will have greatly
increased the usefulness of the TRQ sections. Most recently, we have
noted that there is considerable scope for reorganizing the questions
into sections, especially on the kind,:,rgarten and grade two versions,
where questions do not always correlate too closely within the sections,
as they are presently defined. In attempting to improve the definition
of the TRQ sections, we will try to: improve the matching of sections
across versions; define the same sections for all four TRQ versions;
and place together, in a section, only questions which correlate veil
with each other.
99
0669'9

-95-
Before we go further, however, we must resolve a conflict
between two of these criteria. The one major difference between the
grade three-plus version and the earlier versions, is the absence
on the former, of any questions concerning physical development, It
is simply impossible to match the physical scale questions with
anything on the three-plus questionnaire. Because of this, and because
we found the physical sections on all three early TRQ versions to be
quite distinct from the other questions, we will keep the physical
scale the way it is, and only look at the remaining questions. With
this provision we car, now go ahead and ask how many sections do we
want?
The question of "How many sections are appropriate?" can
be made easier with the help of a series of statistics called
"eigenvalues". For each TRQ version, a set of these eigenvalues
can be computed from the correlations between questions by a complicated
method. The eigenvalues are associated with the principal components
and are used to tell us how much more information we get by using that
component instead of a single (average) question.
Table 10 shows the eigenvalues associated with the first
six principal components for the four versions. The first principal
compol.ent of the kindergarten questionnaire, for instance, provides
about 19 times more information than the average question on the
kindergarten questionnaire. In the kindergarten questionnaire, the
first five components each contribute more information than the
average question. This means that we can summarize the kindergarten
questionnaire with up to five independent components, gaining more
than if we took the questions individually.
1000 0 10 0

- 96 -
TABLE 10
EIGENVALUES FOR THE FIRST SIX PRINCIPAL COMPONENTSOF THE FOUR TRQ VERSIONS
QuestionnaireVersion 1
Principal Components
2 3 4 5 6
Senior Kindergarten 18 94 2.83 1.88 1.30 1.21 0.95
Grade one 18.02 2.07 1.27 1.21 0.83 0.21
Grade two 15.96 1.56 1.14 0.97 0.79 0.69
Grade three 6.76 1.21 0.89 0.54
In this sense, five is the optimal number of components with which to
describe the kindergarten questionnaire data. Similarily. the grade one
questionnaire is optimally summarized by foul- components, the grade two
questionnaire by three components and the three-plus questionnaire by
two.
Now, our requirement that the TRO sections consist of questions
which correlate well with each other, and little with questions in other
sections, means that the TRQ sections should represent independent
components of the questionnaire data. Thus, the optimal number of TRQ
sections should be five for kindergarten, four for grade one, three
for grade two, and two for grade three-plus. It appears that we can most
closely approximate this optimal arrangement by defining four sections
for the senior kindergarten to grade two versions and three sections
for the grade three-plus version. We will then have just under the
.ntimal number of sections on the kindergarten questionnaire, and just
J:er the optimal number on the grade two.and grade three-plus questionnaire.
101
V0101

-97-
Since we have already defined one of the sections (i.e. the
physical section) on 0,0 three early questionnaire versions, we are
ooking for an arrangement of the remaining questions on all four
versions into three sections. We would like these sections to be as
similar as possible across the four versions.
Now is the time to look at the representations of the data
for the four TRQ versions in Figures 18-21, to see if any way of
dividing the questions into three sections suggest itself. When we
exclude the physical section items from each of these figures, it
is apparent that the questions in each of these figures occupy a
roughly triangular area. In each of these figures, broken lines have
been drawn to divide these triangular areas, so that each of the three
sections contains one of the "points of the triangle."
Is this a good way to divide the questions into sections?
It does meet the criterion that the most similar questions be grouped
into the same section, and the most dissimilar questions be contained in
different sections. Since dissimilarity is roughly equivalent to
distance in Figures 18-21, the most dissimilar questions will be
those in the "points" of the triangle. Thus, it is reasonable to
build the three sections around the three points of the triangle.
The question of where to draw the broken lines separating the three
sections is more difficult. The questions which appear to be about
half way between the points are examined for their correlations with
the most extreme questions in each section and are included with the
section where they correlate most. For example, in the kindergarten
data (Figure 18), question 16 correlates more with question 7, than
with question 36, and thus, is included in the section with question 7.
In this way we have optimized the division of the questions into
sections on the basis of similarity.100102 102

-98-
Have we defined the same three sections in each of the four
TRQ versions? We can decide this by looking at the questions included
in the sections. A careful study of Figures 18-21 reveals that there
Is indeed a close correspondence in these sections across the four
versions. The sections to the top and right of the figures contain
questions about basic mental and verbal skills. The questions in the
lower right section concern verbal expressiveness, creativity and
sucial expressiveness. The section to the left contains questions on
social, emotional and intellectual adjustment. In fact, the section
names used on the three-plus questionnaire seem to be quite appropriate
to these newly defined sections. Thus, we can call the sections,
"Performance", "Creativity" and "Adjustment". I would suggest, however,
that the second section should have the term "expressive" added to
its title to make it the "Creative-expressive" section.
The remaining question is, how exactly do the new sections
correspond from one year to the next? This question can he answered
by looking at certain questions from two or more versions, which have
approximately the same meaning. For instance, the three early TR1
versions have a question which I have labelled "Controls Temper",
and the three-plus version has a question labelled "Discipline".
All of these questions appear near the extreme of the new adjustment
section. By this method we see that some borderline questions jump
from one section to another, between TRQ versions The question
labelled "Solvee awn problems," is included in the grade one performance
section and in the kindergarten and the grade two adjustment sections.
Questions concerning use of words for time, space, quantity and order
are included in the performance section for senior kindergarten and
in the creative-expressive section for grade one. The fact that these
10300103

-99-
questions actually correlate more closely with "le other old language
section questions in grade one, is likely due to the salience to the
teachers of the linguistic aspects of the question, due to its inclusion
in the language section. Thus, if these questions were moved to the
performance section in grade one, they would probably correlate less
with the creative-expressive questions.
Because there is no direct correspondence of questions between
the grade two and three-plus questionnaires, a special analysis has been
done to compare these two versions. This was a principal component
analysis of the questions from grade two and grade three, as if they
were on a single questionnaire. The results given in Figure 22 show
the overlap to be remarkably good.*
Now that we have established a new division of the TRQ
questions into sections, let's re-evaluate these sections in terms of
their reliability and their predictive ability to see if we have
achieved any improvement in these areas.
Reliability and Predictive Ability of the New Sections
One advantage of defining the same sections on all four TRQ
versions, is that, it is possible to obtain better estimates of the
reliability and predictive ability of the TRQ sections. We can correlate.
TRQ scores from the full range of the years of the Study of Achievement,
and lse a method similar to that used in estimating the overall TRQ
reliability. Figures 23-25 show the observed and estimated correlations
* In this analysis the second principal component accounted for differencesin ratings due to time and use of different teachers, etc.; thus, theprincipal deviations from the TRQ total are contained in the third andfourth components, rather than the second and third. See the TechnicSAMS1Ament for further details.
40104 104

54
31
33
0 GR
AD
E2
QU
ES
TIO
NS
GR
AD
E3+
QU
ES
TIO
NS
lajQ
UE
ST
ION
SO
NG
RA
DE
3B
UT
NO
T O
NG
RA
DE
3+Q
UE
ST
ION
NA
IRE
e
-.5
N\0
-NN
N®
N0
r.,N
vi8
N
-.3
a
El
0
CD
0
0
-.3- t
TH
IRD
CO
MP
ON
EN
T
CE
r I G U
R E
22O
VE
RLA
PO
F.
QU
ES
TIO
NS
FR
OM
GR
AD
ET
WC
AN
DG
RA
DE
TH
RE
EQ
UE
ST
ION
NA
IRE
S

- 101 -
for each of the three new TRQ sections. Once again, readers are
reminded that the estimated correlations are only very approximate. This
is evidenced by the implausibility of the result for the adjustment
section, where use of two different TRQ versions apparently yields
a higher correlatioa than repeated administration of the same TRQ version.
Nevertheless, these estimates do provide some indication of the reliability
of the sections and their performance over time.
The reliability coefficients calm:" ted for the new sections
are considerably higher than those calculated previously for the old
sections. There are two reasons for this. First, the estimated loss
in correlation with time is considerably greater than that estimated
previously (because of the larger amount of data on which the current
analysis is based, the present estimates should be more accurate).
Secondly, the sections are actually somewhat more reliable; comparing
the correlations of the new 3+ sections over time with the same correla-
tions for the old sections, we find an increase of about .03 on the
average.
Looking now, at the relationships between the new sectio:s
(Table 11) we see that the performance, adjustment and creativity
sections have 85, 74 and 86 per cent in common with the TRQ total,
on the average. Thus, no one section is nearly identical in results
to the TRQ total, as were the old mental and performance sections.
Also there are no two sections which are as similar to each other as
the old language and mental sections, which had 75 per cent in common
with each other. Generally, the new sections seem to represent the
different deviations from overall achievment, or the different aspects
of achievement, in a more even fashion.
01 a 00106106
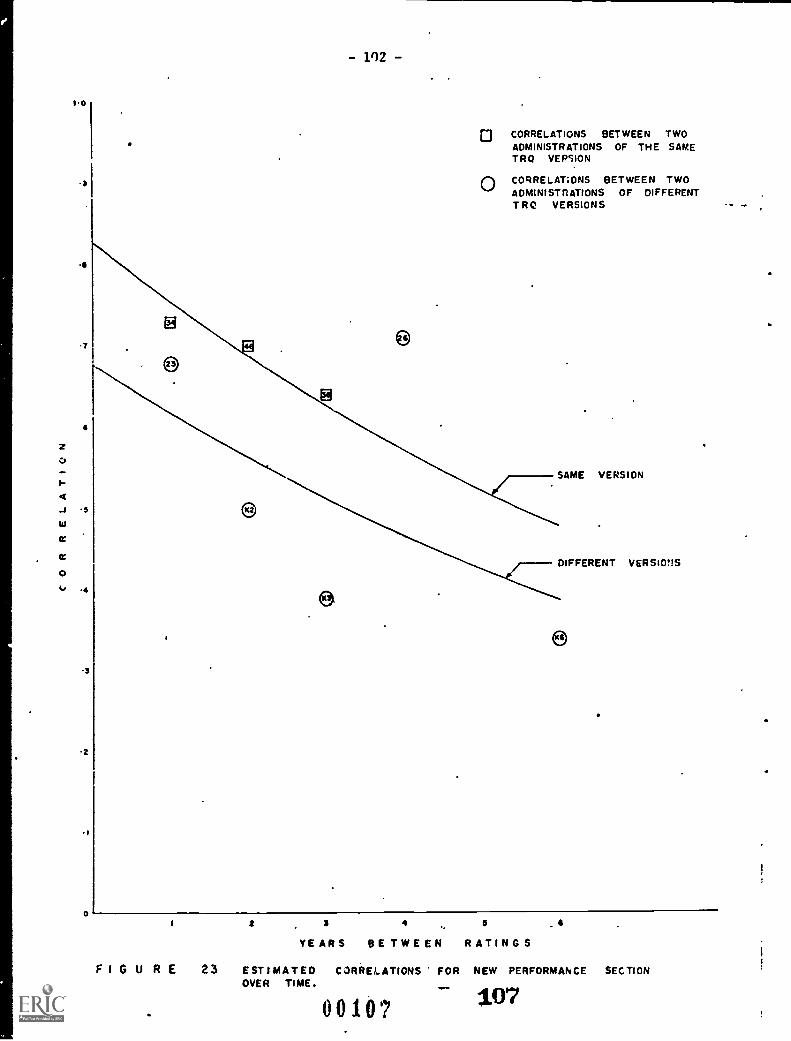
102I 0
a
.5
.3
2
0
8
a
e
El CORRELATIONS BETWEEN TWOADMINISTRATIONS OF THE SAMETRQ VERSION
O CORRELATIONS BETWEEN TWOADMLNISTnATIONS OF DIFFERENTTRQ VERSIONS
SAME VERSION
DIFFERENT VERS10!IS
4
I a 3 4 a a..
YEARS BETWEEN RATINGS
F I G U RE 23 ESTIMATED CORRELATIONS FOR NEW PERFORMANCE SECTIONOVER TIME.
10'7. 0017 :

0
T
z
0
.J .5
CC
0U .
3
2
.1
- 31)3 -
DIFFERENT VERSION
SAME VERSION
YEARS BETWEEN RA TINGS
FIGURE 24 ESTIMATED CORRELATIONS FOR NEW ADJUSTMENT SECTION
108'OVER. TIME.
00108

I . 0
.7
z0
t-.
4J 5
10
C
CC
0o 4
3
2
.1
104
SAME VERSION
DIFFERENT VERSIONS
0 I t 3 4 5 a 7
YEARS BETWEEN RATINGS
FIGURE 25 ESTIMATED CORRELATION FOR NEW CREATIVITY SECTIONOVER TIME
0010)109
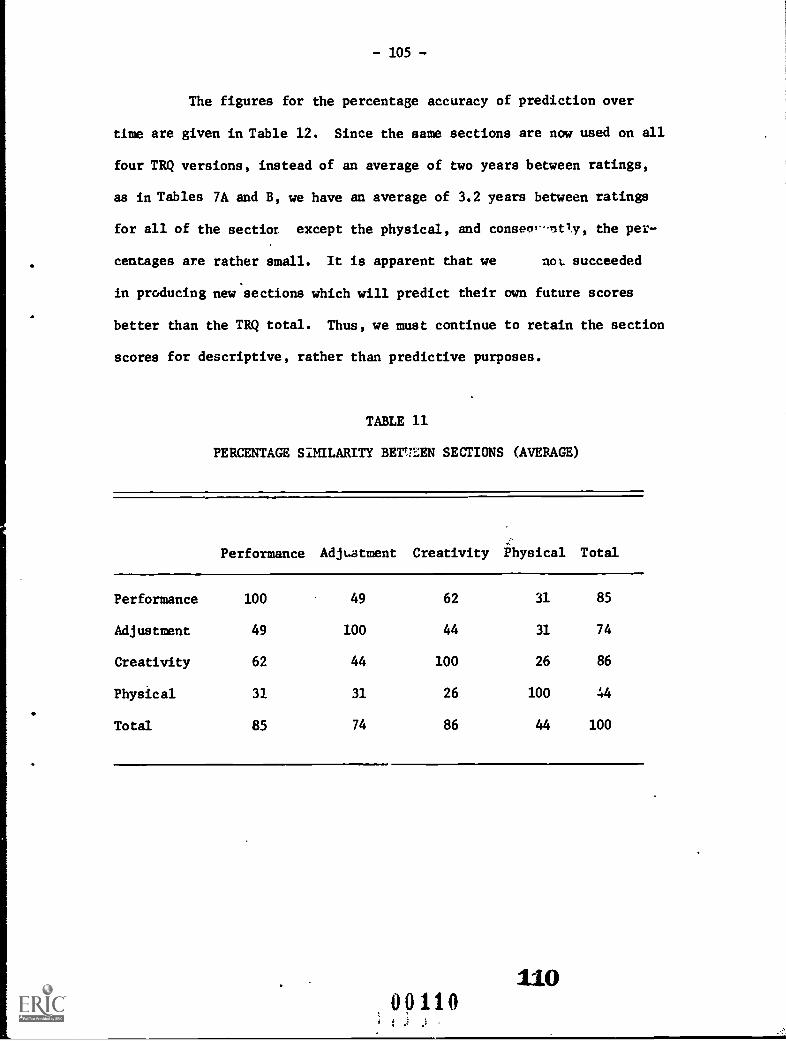
- 105 -
The figures for the percentage accuracy of prediction over
time are given in Table 12. Since the same sections are now used on all
four TRQ versions, instead of an average of two years between ratings,
as in Tables 7A and B, we have an average of 3.2 years between ratings
for all of the section except the physical, and conseo,--ntl.v, the per-
centages are rather small. It is apparent that we not succeeded
in producing new sections which will predict their own future scores
better than the TRQ total. Thus, we must continue to retain the section
scores for descriptive, rather than predictive purposes.
TABLE 11
PERCENTAGE SIMILARITY BET'flEN SECTIONS (AVERAGE)
Performance AdjLatment Creativity Physical Total
Performance 100 49 62 31 85
Adjustment 49 100 44 31 74
Creativity 62 44 100 26 86
Physical 31 31 26 100 44
Total 85 74 86 44 100
1100 0 11 0
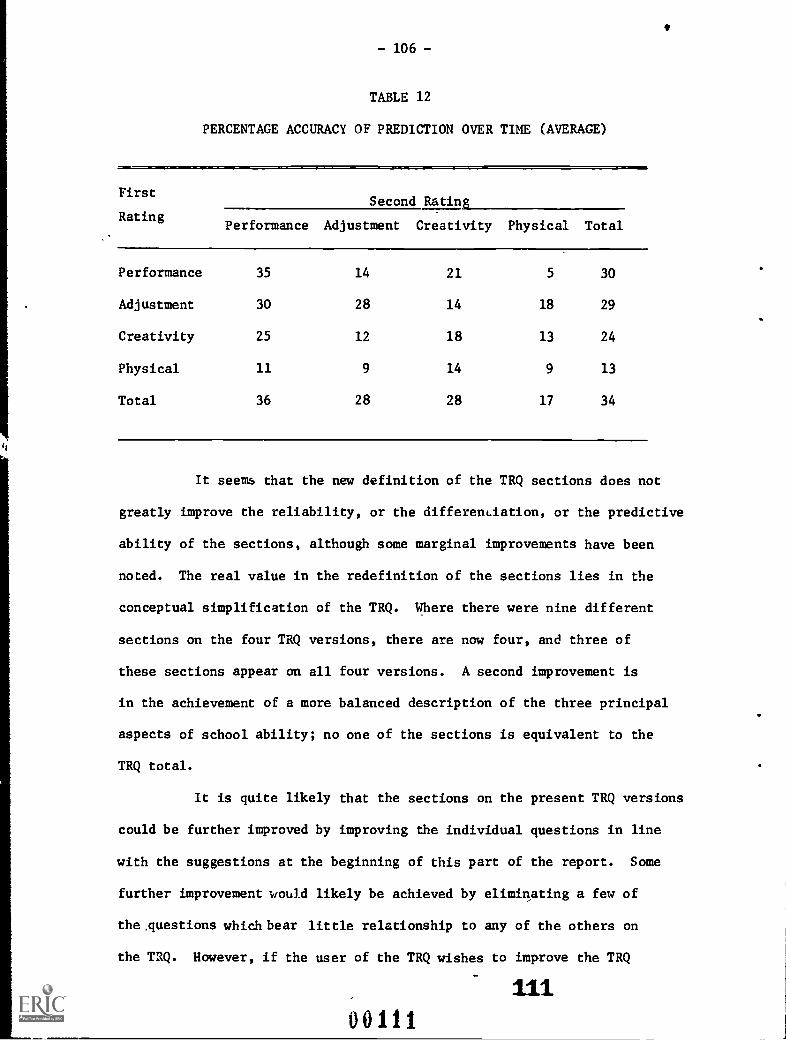
- 106 -
TABLE 12
PERCENTAGE ACCURACY OF PREDICTION OVER TIME (AVERAGE)
First
RatingSecond Rating
Physical TotalPerformance Adjustment Creativity
Performance 35 14 21 5 30
Adjustment 30 28 14 18 29
Creativity 25 12 18 13 24
Physical 11 9 14 9 13
Total 36 28 28 17 34
It seems that the new definition of the TRQ sections does not
greatly improve the reliability, or the differentiation, or the predictive
ability of the sections, although some marginal improvements have been
noted. The real value in the redefinition of the sections lies in the
conceptual simplification of the TRQ. Where there were nine different
sections on the four TRQ versions, there are now four, and three of
these sections appear on all four versions. A second improvement is
in the achievement of a more balanced description of the three principal
aspects of school ability; no one of the sections is equivalent to the
TRQ total.
It is quite likely that the sections on the present TRQ versions
could be further improved by improving the individual questions in line
with the suggestions at the beginning of this part of the report. Some
further improvement would likely be achieved by eliminating a few of
the.questions which bear little relationship to any of the others on
the TRQ. However, if the user of the TRQ wishes to improve the TRQ
0 0 111

-107-
sections to the status of independent tests, having good predictive
ability, he will have to add more questions to the sections, to achieve
more stability in the section total scores.
0 0 112i LI
112

- 108 -
PART IV - CONCLUSIONS AND SUMMARY
Conclusions
How good is the Teachers' Rating Questionnaire? We have
gone to some lengths to assess the validity and reliability of the
questionnaire, and to uncover any weaknesses in the question design
and the structure of the sections. We have demonstrated a reasonable
degree of correlation with other measures of academic success (standardized
achievement test, I.Q., promotions) and these reflect the overall
validity of the test, and especially of the performance section.
The validity of the adjustment section and the creative-expressive
section have not been directly demonstrated. Our faith in these sections
must rest on the reasonable way in ;filch similarily worded questions
cluster together. Needless to say, a study of the correlations between
these TRQ section scores and other measures of adjustment and creativity
would add to the credibility of these sections.
The method developed to estimate reliability for this report
is of interest, but to provide an accurate estimate of reliability, it
requires more correlation data than were used here. The reliability
estimates we have obtained for the TRQ total and the new sections are
shown in Table 13; also shown are the 90 per cent confidence minimum
values for these coefficients derived by statistical methods. A large
part of the differences between any two sets of TRQ ratings must be
due to differences between teachers in their interpretations of the
questions and their perceptions of the pupils. Considerable effort
has been made to produce clear and unambiguous instructions to the
teachers, but beyond ells, little can be done to reduce the between
teacher differences. The teachers are employed-as ident judges
1001133
.1

- 109 -
of the students, and the only way to increase the correspondence of their
ratings would be to specifically instruct them in a series of training
sessions. But, a training session for teachers, in addition to being
costly to the researchers and inconvenient for the teachers, would tend
to destroy the relative nature of the TRQ measurement. Teachers receiving
such a "training" would be using the training situation as a standard
rather than their class average, (we have shown that they do use the
class average). It appears that a certain lack of reliability is a
necessary feature of the indirect method of measurement employed by the
TRQ.
TABLE 13
ESTIMATED RELIABILITY COEFFICIENTS AND MINIMUM VALUEAT 90% CONFIDENCE LEVEL FOR TRQ TOTAL AND NEW SECTIONS
Form Estimate Minimum
TRQ total Same .78 .69
Different .66 .56
Performance Same .83 .74
Different .68 .57
Adjustment Same .67 .60
Different .69 .58
Creative-Expressive
Same .65 .57
Different .49 .40
r001.14 114

-110-
Of course, if we are actually interested in measuring the differences
between teachers' perceptions, the values calculated for test reliability of the
TRQ could be used for such a study, but this is beyond the report's scope.
It has been, unfortunately, necessary to conclude that the
individual TRQ sections, both old and new, are not sufficiently well
defined to serve as 'independent predictors. This is because of the
relatively high correlations with the TRQ total, the relatively small
number of questions in each section, and the fact that different questions
are employed on each TRQ version. It is not surprising, perhaps, that
the TRQ sections lack the predictive accuracy of independent measures,
since they were not designed that way. In order to upgrade one or all
sections, to the status of an independent teat, one should add questions,
especially questions which have high correlation with other questions
in the section, but a low correlation with the TRQ total.
Another possible method of increasing the predictive accuracy
of the TRQ sections would be the extension downwards of the 3+ version.
We have seen that this version of the TRQ applies well to all grades
from three to nine. Could it not also be applied to grade two, and
perhaps, grade one?
We have already seen that the pattern of relationships explicitly
stated in the 3+ questionnaire (as the three sections), can be found
implicit in the correlations between the questions on the three earlier
versions. This persistent pattern was the basis of our redefinition of
the TRQ sections. That the pattern should emerge explicitly in the 3+
version is gratifying; each successive TRQ version was designed with
careful reference to the results from previous versions and to the
comments of the teachers. In deciding to redefine the sections as
performance, adjustment and creativity, the designers of the 3+ question-
naire show that they intuitively perceived relationsturch the present
4 ,Hits
investigator could only see with the assistance of some powerful
statistical tools.
The analysis reported in part three of this paper, serves
two major functions: it points out weaknesses and inefficiencies in the
questions and the sections, and it suggests methods of improving them.
Some of these improvements could be achieved with no more effort than
reprinting the questionnaire. Others, however, would require considerable
effort in rewording and retesting the questions. In the first category
of improvements, is included the reorganization of the TRQ sections
and the removal of the completely unrelated questions and those which
are redundant. In our analysis of the new TRQ sections, all of the
original 112 questions were retained. Some further small improvement
in reliability and predictive ability could likely be achieved simply
by removing the two most poorly related questions (SK #10 and SK #12).
And a further reduction in questionnaire size without any appreciable
drop in information could be obtained by removing redundant questions
from some of the tight clusters (like SK #26, 27, 28, 29; GD1 #7, 8;
and GD2 #14, 15).
The major focus for a more concentrated improvement of the
TRQ, is the rewording of those questions which have less than optimal
distributions. These questions can be easily identified in Figures 12-15,
and the type of rewording required is also indicated by the position of
the questions in these figures. A second kind of rewording is indicated
for some questions (like SK #8) which correlate only poorly with other
questions in their section. Here the initial statement of the question,
rather than just the labels for the rating categories, must he changed.
The wording must be altered to bring the question more in line with
the central theme of the other questions in the section. Finally, researchers
may wish to augment certain TRQ sections with totally new questions.
A 0,11' 116

-112-
This last consideration brings us to another source of difficulty
with the TRQ. This is the variation in the number of questions in the
different TRQ sections. There are ways to compensate mathematically
for the varying proportions of question in the sections of the TRQ
versions (this was discussed in part I of this report). However, no
mathematical weighing of scores can compensate for the lack of information
obtained from a section having disproportionately small number of questions.
We have already remarked on the advantages of the new sections being more
balanced with respect to their deviations from the TRQ total. By having
the same proportions of questions in the sections of each of the four
TRQ versions, a further balancing of sections would be achieved with a
resulting (possible) improvement in the overall reliability between
versions.
These proposed changes, in sum, would have the effect of making
the four TRQ versions more equivalent. The one major difference that would
remain is the jump from specific behavioural situations rated on the SK, 1
and 2 versions to the general situations rated on the 3+ version. If this '.
difference, in fact, makes a difference, it has not been detecte&in the analysis
done for this report. The:pattern of correlations between items for the 3+ version
is very similar to that of the other three versions. The only difference
detected in.the 3+ version was the one it was designed to produce; that is, the
grade 3+ version is grade Independent; the questions are not tied to behaviours
which are appropriate for any specific grade level.
The rather extensive analysis in this report has shown that
the TRQ is a reasonably valid and reliable measure of school success.
We have shown a number of ways in which the questionnaire might be
improved, including the reorganization of the sections to be more homo-
geneous, and the rewording of questions to achieve a more appropriate
117`0'011?

- 113 -
distribution of teacher's ratings, or the closer correlation of the
questions with others on the TRQ. We have also developed a method for
estimating test reliability from delayed retest data, and a method for
optimizing the distributions on a five point rating scale with reference
only to the average rating and standard deviation. Both these methods
should prove useful to researchers who do future work with the TRQ,
and may prove to be even more generally applicable.
It is hoped that this report will enhance the usefulness of the
TRQ as a viable alternative to standardized testing, and that it will
lead to further research and improvement of this instrument.
Summary
The Teachers' Rating Questionnaire was developed in connection
with a longitudinal Study of Achievement, as a means of assessing pupils'
progress with a minimum of interference with the pupils themselves.
Four different versions of the questionnaire were created:
TRQ -SK
TRQ - 1
TRQ - 2
TRQ - 3+
for senior kindergarten
for grade one
for grade two
for grades three to nine.
Questions on the three early TRQ versions reflect specific behavioural
situations and are arranged in five sections entitled "Language",
"Mental", "Socal", "Emotional" and "Physical ". The 3+ version contains
fewer questions of a more general nature, which are arranged into
"Performance", "Adjustment", "Creativity" and "School Ability" sections.
Teachers' ratings are made on a five point Likert-type scale, using
the even valued integers (0, 2, 4, 6, 8); zero is used to indicate lowest
ability and eight for highest.
118
A'0118

- 114 -
The analysis of the TRQ has been divided into two parts; the
first part attempts to answer the question, "How good is the TRQ?", and
the second part looks at, "How can the TRQ be improved?". The value
of the TRQ is assessed in terms of its validity, reliability and
efficiency (these terms are defined in text). Validity studies have
shown that the Metropolitan Achievement Test correlates with the TRQ
(particularly with the performance section), about as well as it does
with the Otis I.Q. test, and the I.Q. test correlates highest with
the teachers' prediction of the childs' future school success. Those
students who move from grade two to grade four in one year, and those.
who, repeat grade two, have exceptionally high and exceptionally low
teachers' ratings, respectively, as would be expected from a measure
of achievment.
The reliability of the TRQ was estimated by an extrapolation.
procedure from the correlations between the yearly ratings by the
teachers of the Study of Achievement pupils. These estimates which are
only approximative, are .78 for repeated administration of the same TRQ
version, and .66 for use of different TRQ versions. In both cases, the
two ratings are assumed to be done by different teachers. The performance
section was the most reliable of those on the 3+ questionnaire version
and was followed by school ability, adjustment and creativity, in that
order. Individual questions on which the teachers were likely to have
made prior judgements of the pupils, appeared to have a higher reliability.
The grade three-plus questionnaire was designed to have average
ratings, which were independent of the grade level of the students; an
examination of the ratings of grade five, seven and nine students from
11900 11 9
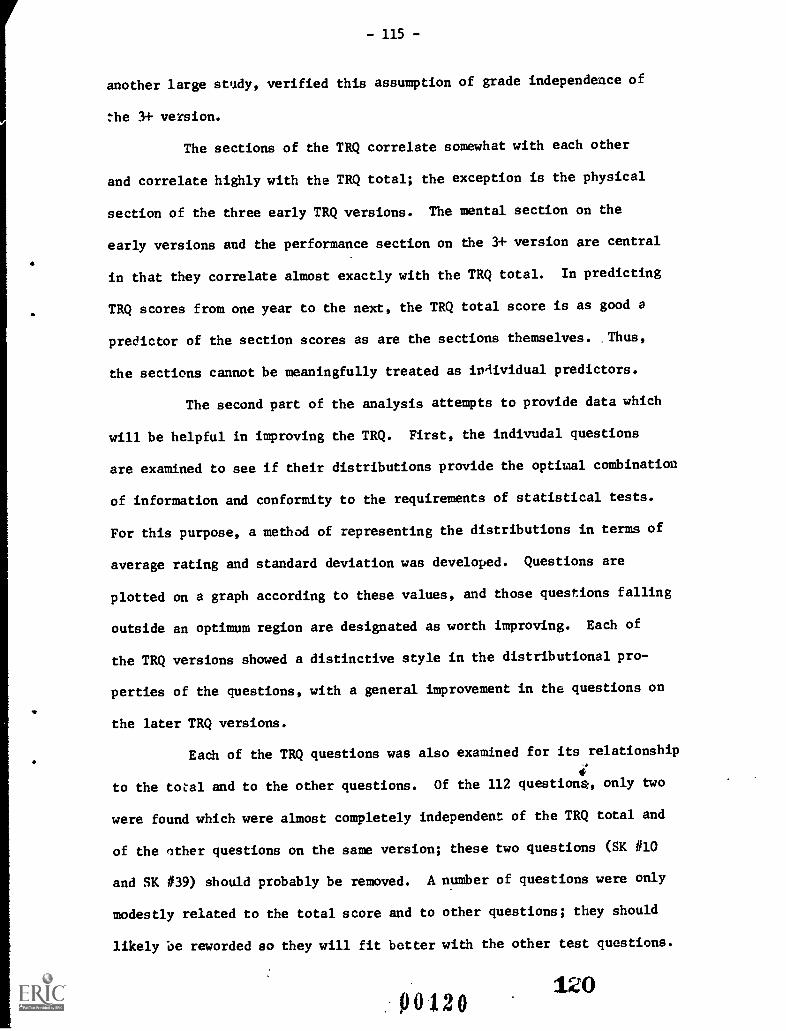
- 115 -
another large study, verified this assumption of grade independence of
the 3+ version.
The sections of the TRQ correlate somewhat with each other
and correlate highly with the TRQ total; the exception is the physical
section of the three early TRQ versions. The mental section on the
early versions and the performance section on the 3+ version are central
in that they correlate almost exactly with the TRQ total. In predicting
TRQ scores from one year to the next, the TRQ total score is as good a
predictor of the section scores as are the sections themselves. _Thus,
the sections cannot be meaningfully treated as iniividual predictors.
The second part of the analysis attempts to provide data which
will be helpful in improving the TRQ. First, the indivudal questions
are examined to see if their distributions provide the optiwal combination
of information and conformity to the requirements of statistical tests.
For this purpose, a method of representing the distributions in terms of
average rating and standard deviation was developed. Questions are
plotted on a graph according to these values, and those questions falling
outside an optimum region are designated as worth improving. Each of
the TRQ versions showed a distinctive style in the distributional pro-
perties of the questions, with a general improvement in the questions on
the later TRQ versions.
Each of the TRQ questions was also examined for its relationship
4to the total and to the other questions. Of the 112 questions., only two
were found which were almost completely independent of the TRQ total and
of the other questions on the same version; these two questions (SK #10
and SK #39) should probably be removed. A number of questions were only
modestly related to the total score and to other questions; they should
likely be reworded so they will fit better with the other test questions.
12000120

- 116 -
A major difficulty with the TRQ as it is currently defined,
is the change in the sections between the grade two and the grade three-
plus versions. With the aid of principal components analysis, a
similarity in the pattern of correlations was found among the four TRQ
versions. On the basis of this similarity, a regrouping of the TRQ
questions on all four versions into three sections (entitled "Performance",
"Adjustment", and "creative-expressive") was suggested. The physical
section is retained, unaltered, on the three early TRQ versions. A sub-
sequent analysis showed that the proposed regrouping did not detract
from the reliability, or predictive ability of the TRQ sections; in
fact, a marginal improvement was noted. The new sections also represented
the various deviations from (or aspects of) the overall school success
measure, in a more balanced manner than did the old sections.
121
00121
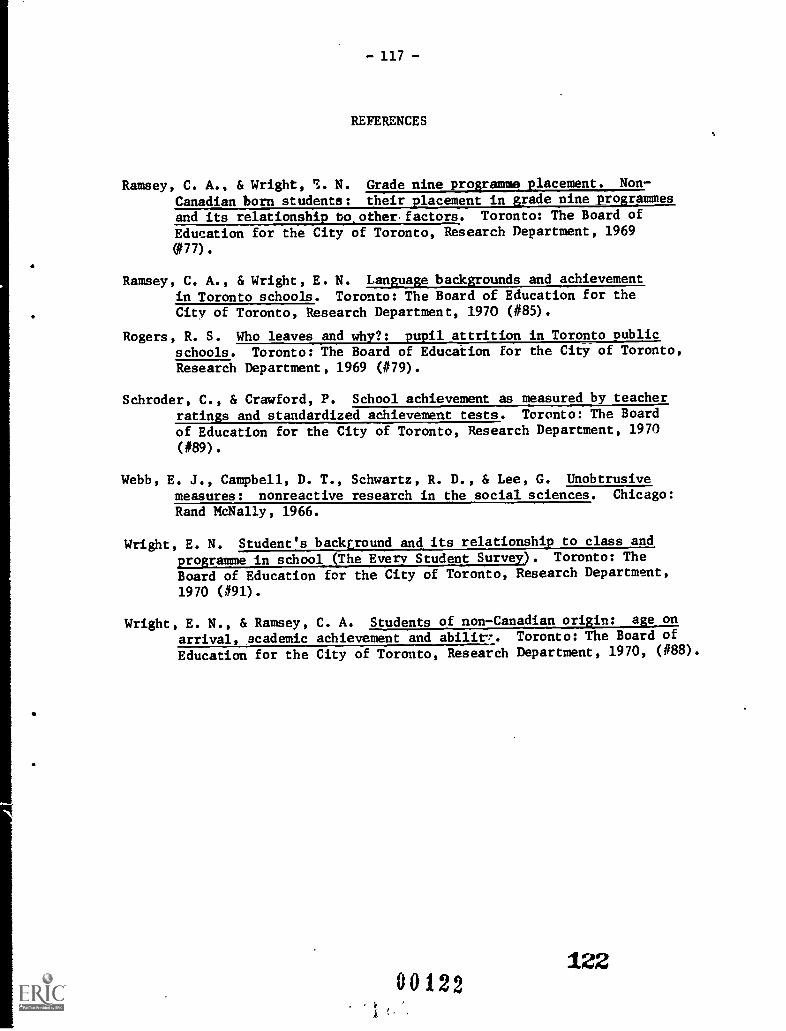
- 117 -
REFERENCES
Ramsey, C. A., & Wright, '3. N. Grade nine programme placement. Non-
Canadian born students: their placement in grade nine programmes
and its relationship to,other.factors. Toronto: The Board of
Education for the City of Toronto, Research Department, 1969(77).
Ramsey, C. A., & Wright, E. N. Language backgrounds and achievement
in Toronto schools. Toronto: The Board of Education for theCity of Toronto, Research Department, 1970 ( #85).
Rogers, R. S. Who leaves and why?: pupil attrition in Toronto nubileschools. Toronto: The Board of Education for the City of Toronto,Research Department, 1969 (#79).
Schroder, C., & Crawford, P. School achievement as measured by teacher
ratings and standardized achievement tests. Toronto: The Board
of Education for the City of Toronto, Research Department, 1970
(#89).
Webb, E. J., Campbell, D. T., Schwartz, R. D., & Lee, G. Unobtrusive
measures: nonreactive research in the social sciences. Chicago:
Rand McNally, 1966.
Wright, E. N. Student's backLround and its relationship to class and
programme in school (The Every Student Survey). Toronto: The
Board of Education for the City of Toronto, Research Department,
1970 (#91).
Wright, E. N., & Ramsey, C. A. Students of non-Canadian origin: age on
arrivalscademic achievement and Toronto: The Board of
Education for the City of Toronto, Research Department, 1970, (4488).
12200122

- 118 -
APPENDIX A
Calculating a Standard Score
The basic scoring of the TRQ is very easy. But things get more
difficult when we want to compare scores between two sections or between
two versions of the questionnaire. There are 40 questions on the kinder-
garten TRQ, and only 33 questions on the grade one version. How-do we
compare scores between the two?
The simplest answer is to express each score as a percentage
of the highest possible score on the test (for grade one scores this
would be obtained scoreX 100).
This method leaves a lot to
33 x 8
be desired since it fails to take account of whether one of the tests
is "easier" than the other. If the average rating for questions on one
of the tests is low, then most of the children would "appear" to do
better on it even if they were just the same.
A more precise method cc comparing scores is used in this
paper. It takes into account not only the average score for each test,
but also the "spread" of these scores. The method used is know to
researchers as standardizing the test results. The following example
is an illustration of how it is done: suppose a class consists of five
students with scores of 52, 40, 32, 48, 38 on a test (it could be any test,
e.g., the Language section of the kindergarten TRQ). It doesn't matter
what the highest or lowest possible marks are; all that matters is that
we know the students' scores and that we know that higher scores are better
than lower ones.
Now let's work through the steps in computing the standard
score using these five scores as an example:
12300123

-119 -
1. Calculate the class average,
e.g., (52 + 40 + 32 + 48 + 38) 4. 5-= 42
2. For each student, calculate a deviation scoresuch that deviation score = actual score - class average,
e.g., 52 - 42 = 10
40 - 42 = -2
32 - 40 = -10
48 - 42 = 6
38 - 42 = -4.
3. Square each of the deviation scores (i.e. multiplythem by themselves),
e.g., 10 x 10 = 100
(-2) x (-2) = 4
(-10) x (-10) = 100
6 x 6 = 36
4 x 4 = 16
4. Add up these squared deviation values,
e.g., 100 + 4 + 100 + 36 + 16 = 256
5. Divide this sumthan the number
.e.g., there
256 4
of squared deviations by one lessof students,
are five students, so we divide by 4:4 = 64
6. Take the square root of this "average squared deviation,"
e.g., 64 = 8
This quantity is called the standard deviation. It is
a kind of average of the deviation scores.
7. For each student calculate a standaru score by dividinghis deviaiton score (from step 2) by the class standarddeviation (from step 6).
e.g., 10 4. 8 = 1.25
-2 + 8 = -.25
-10 4 8 = -1.76
6 + 8 = .75
-4 + 8 = -.50
For research purposes these standard scores are quitesufficient for comparing scores from two TRQ versions
. or for comparing different sections of the TRQ. However,
most teachers (and other non-researchers) will likelyfind it more useful to complete the next step of the
calculation.
Of112A
124

-120
8. To convert to . standard score that resemblestraditional marks, multiply the standard score by10 and then add 70,
e.g., 1.25 x 10 + 70 = 82.5
-.25 x 10 + 70 = 67.5
-1.25 x 10 + 70 = 57.5
.75 x 10 + 70 = 77.5
-.50 x 10 + 70 = 65.0
Whatever the original scores were, the above process provides an average
of 70 and a standard deviation (or "average" deviation score of 10.
Regardless of the values of the original scores or the ntmber of such
scores, we will expect those standard scores to have a similar distribution:
Percentage of StudentsObtaining Scores
less than 40 2.28%
50 to 60 13.59%
60 - 70 34.13%
70 - 80 34.13%
80 - 90 13.58%
90 - 100 2.28%
Range of Scores
12500125

- 121 -
APPENDIX B
Correlation Coefficients and Percentage Similarity
A correlation coefficient is a measure of the degree of
association between two sets of measurements. A correlation coefficient
of zero means that there is no elationshiD at all between the two sets
of numbers. A correlation of 1.0 means that there is a perfect relation-
ship between the two sets.
Suppose we knew that scores for two versions of the TRQ had a
correlation coefficient of 1.0; this would mean that if we knew a student's
score on one of the TRQ versions, we could use this to predict his score
on the other TRQ version with "10') per cent accuracy." This does not
mean that the student receives the same numerical score on both versions
of the TRQ. What it does mean is that he received the same "standard
score" (see Appendix A) on both versions. However, if we know the
average score on both tests, and the standard deviation (see. Appendix A)
of the scores on both tests, then we can predict the exact score on the
second test from knowledge of the student's score on the first.
(Score on\ (Score on\ x(S.D. on 1st Test\ (Average on\ (Average on
`2nd Test) k1st Test/ S.D. on 2nd Test/ k 1st Test / k 2nd Test j
When the correlation coefficient is greater than zero and
less than one, we can predict one test score from the other with some
accuracy but the prediction will be less than perfect. The closer the
correlation is to one, the more accurately we can predict, and the more
similar is the pattern of results of the two tests. The percentage of
similarity between the patterns of results can be measured by
multiplying the correlation coefficient by itself and multiplying
12600128

-122 -
the results by 100. If we conclude that two tests are 80 per cent similar,
this does not mean that 80 per cent of the students received exactly the
same score on the two tests, or even that 80 per cent received the same
rank. It does mean that 80 per cent of the variability of the grades
on the second test can be predicted by assuming that a student's standard
score on the second test is the same as that on the first. This leaves
20 per cent which is the percentage error in predicting scores on one test
from scores on the other. Thus, 100 times the square of the correlation
coefficient can be interpreted as either the percentage similarity
between two tests or as the percentage accuracy in predicting scores
on one test from scores on another.
Occasionally, a situation arises where a high score on one
measure is associated with a low score on another. In such cases the
correlation coefficient is given a negative sign to indicate that the
scales for the two measures run in opposite directions.
12700127

APPENDIX C
This appendix contains a summary of the questions
on the four questionnaire versions. Complete
copies of the questionnaires are available, on
special request, from the Research Department of
the Board of Education for the City of Toronto. As -
these would have to be specially Xeroxed, there
would be a charge and a delay in filling these
special requests.
Senior Kindergarten Questionnaire Page 124
Grade One Questionnaire Page 126
Grade Two Questionnaire Page 129
Grade 3+ Questionnaire Page
00128128

-124 -
SENIOR KINDERGARTEN QUESTIONNAIRE
English Language
1. Speaks in simple sentences.
2. Talks freely and fluently.
3. Carries on conversations with other children during an ActivityPeriod.
4. Tells stories about pictures or incidents.
5. Relates incidents about "real" happenings in a logical way.
6. Expresses own ideas either to the teacher, in organized activitiesor at play.
7. "Makes up" a story (about anything).
8. "Makes up" a song (about anything).
9. Pronounces words well enough to be understood.
Social
10. Participates in dramatic play in the doll centre.
11. Gets along with the other children during the Activity Period withlittle help from the teacher.
12. Works and combines effort with other children during the ActivityPeriod on a project ("making" or "building" something) with littlehelp from the teacher in the matter of self-control and leadershipability.
13. Contributes ideas during teacher-guided group activities -- dis-cussions, games, musical activities or in the planning of trips, etc.
14. Takes care of toilet needs without reminding by thd teacher.
Mental
15. Names and identifies the following colours: red, yellow, blue,green.
16. Decides on own initiative what to do in the Activity Period.
17. Remains interested in a self-chosen activity for 30 minutes.
18. Remains interested in teacher-guided group activities for 15 minutes.
19. Carries over a colouring, painting or pasting project for one day.
20. Follows one line of thought in a discussion period.
21. Solves own problems with toys, puzzles, handwork, rules, etc.
22. Differs in a well-balanced manner from opinions of others in dis-
cussion times or at play.
00129129

-125 -
23. Follows directions in games or routine situations.
24. Thinks in a logical way. -- The child has the ability to makedeductions or inferences from pictures, about things, about
rules, etc.
25. Counts up to five objects, or people or things in a picture.
26. Uses words related to number, size or quantity -- big, little,
first, long, many, etc.
27. Uses words related to quality -- thick, thin, sharp, flat, etc.
28. Uses words related to time -- day, month, hour, week, etc.
29. Uses words related to space -- near, far, on top, around, etc.
Physical
30. Comes downstairs using alternate feet on each step.
31. Skips.
32. Dresses self, except for tying shoes, doing up small buttons
and difficult fastenings.
33. Paints recognizable symbols for persons or things.
34. Uses scissors.
Emotional
35. Playing something or doing something in an Activity Period.
36. Shows dependable and cooperative attitude towards rules and routines --
toilet, rest, lunch, tidying up, etc.
37. Ability to control temper.
38. Ability to react to situations with appropriate emotions -- cryingwhen really afraid or hurt as opposed to severe upsets by unexpectedvisits of doctor, nurse, etc.
39. Being able to come to school alone or with any other child on time.
40. Can be attentive in listening to stories.
00130 130

- 126 -
GRADE ONE QUESTIONNAIRE
English Lanjuage Section
1. Frequently speaks freely and fluently in compound or complex sentences.
2. Has the ability to tell a simple story about a picture (e.g., largepictures used for picture study, pictures in readers, own creativepaintings).
3. Uses simple adjectives to describe emotions and feelings illustratedin ?ictures, stories, music and poetry (e.g., happy, surprised,curious, etc.).
4. Coherently tells about incidents, or news, or out-of-school activitiesor experiences.
5. Frequently expresses own ideas voluntarily to the teacher and class-mates. (To the teacher during discussions, games, musical activities,physical education, planning of classroom trips or projects; toclassmates during dramatic play or at work centres.)
6. Creates stories, songs or poems around any idea.
7. Vocabulary contains words that signify some understanding of theconcepts of order and quantity (e.g., many, few, first, last, thicker,thinner, more, less, bigger, smaller).
8. Vocabulary contains words that signify some understanding of theconcepts of time and space (e.g., near, far, up, down, hcur, month,week, around, 'ender, over, on, backwards, below, above).
9. Shows evidence of good ability to listen and absorb content in thedaily programme (e.g., by remembering facts about stories and poemsread by the teacher, by learning songs).
Social Section
10. Interacts with most of classmates by daily social participation (eithervoluntary or upon invitation) in many of the children-directed activities(e.g., dramatic play, puppets, activities at library or science centre,games and play).
11. Takes responsihiitv for, and carries out, simple classrooms tasks witha minimum of teacher help (e.g., watering plants, feeding pets, tidy-ing work centres, cleaning brushes, ctc.)
12. Is responsive towards and indicates a desire to make positive contributionstowards many teacher-directed activities (e.g., sings in singing periods,talks in discussion periods, responds in music periods, moves in physicaleducation periods,takes part in dramatizations, etc.).
13. With or without teacher help, meets many of the demands connected withgeneral social behaviour in most of the daily activities (e.g., listensto others, appreciates the efforts of others, appreciates the opinions
of others, handles equipment with reasonable care).
13100131

_ 127 _
14. With or without teacher help, meets many of the demands connectedwith specific social behaviour in most of the daily routines (e.g.,lines, toilet, seatwork, lockers, getting materials, tidying up, etc.)
Mental Section
15. Names and identifies most standard colours, and can read the colour
names -- "red," "blue," "green," and "yellow."
16. Has sufficient mental maturity to do some productive work (reviewlessons, new lessons and seatwork, etc.) at the current classroomlevel in reading.
17. Has sufficient mental maturity to do some productive work (reviewlessons, new lessons and seatwork, etc.) at the current classroomlevel in arithmetic.
18. With a minimum of teacher help, frequently follows the current topicin a discussion, story or reading period.
19. With a minimum of teacher help, can set and follow some relevantpurposes for reading each story and for planning each group or class-
room activity.
20. Frequently attempts to solve own problems in connection with mostseatwork, directions, rules, routines and classroom equipment.
21. Shows evidence of auditory skills in most of the following areas:
- - listening and identifying instruments;- - listening, identifying and reproducing music, rhythms, "What belongs," etc.;
- - listening and retelling (e.g., stories, songs, poems);
- - identifying rhyming words;- - identifying initial consonants;- - identifying final consonants.
22. Shows evidence of visual skills in most of the following areas:
- - can discriminate among geometric forms (e.g., oblong, square,circle, triange, etc.);
- - can identify similarities in word beginnings and endings;-- can identify letters in middle position;- - reads in left to right progression;-- can copy words for seatwork.
23. When reading (orally or silently) can group words in meaningful phrasesand sentences and can carry thought over when sentences are split by lines.
Physical Section
24. Can gallop, hop on one foot and skip in a forward direction.
25. Can work with a ball including bouncing, catching, rolling and throw-ing with some accuracy.
26. Can print with pencil between the required lines, and make reasonablywell-constructed, uniform letters.
,'a A4 00132 132

-128 -
Emotional Section
27. Shows willingness and confidence in independently attempting mostnew challenges and tasks at own level (e.g., seatwork based onreading or using any art medium to illustrate own ideas).
28. Has sufficient emotional stability to accept teacher guidance, andto seek help, when it is really. needed.
29. Has sufficient emotional stability to accept and carry out most rulesand routines independently (e.g., assembling, dismissing, washroom,keeping desk tidy, sharpening pencils, activity centres, etc.).
30. Shows ability to control temper in most situations.
31. Can usually express self in, and react to, most situations withoutsigns of nervous mannerisms or extreme tension (e.g., agitated;high-pitched, shaky voice, twisting of clothes or face; stutteringor stammering).
32. With a minimum of teacher help during work periods (at desks or workcentres), can maintain attention span for a sufficient period oftime to achieve some productive effort.
33. With a minimum of teacher help, has the ability to change focus ofattention from one lesson or activity to another, and hold the attentionspan for a sufficient period of time to achieve some productive effort.
00133 133
a
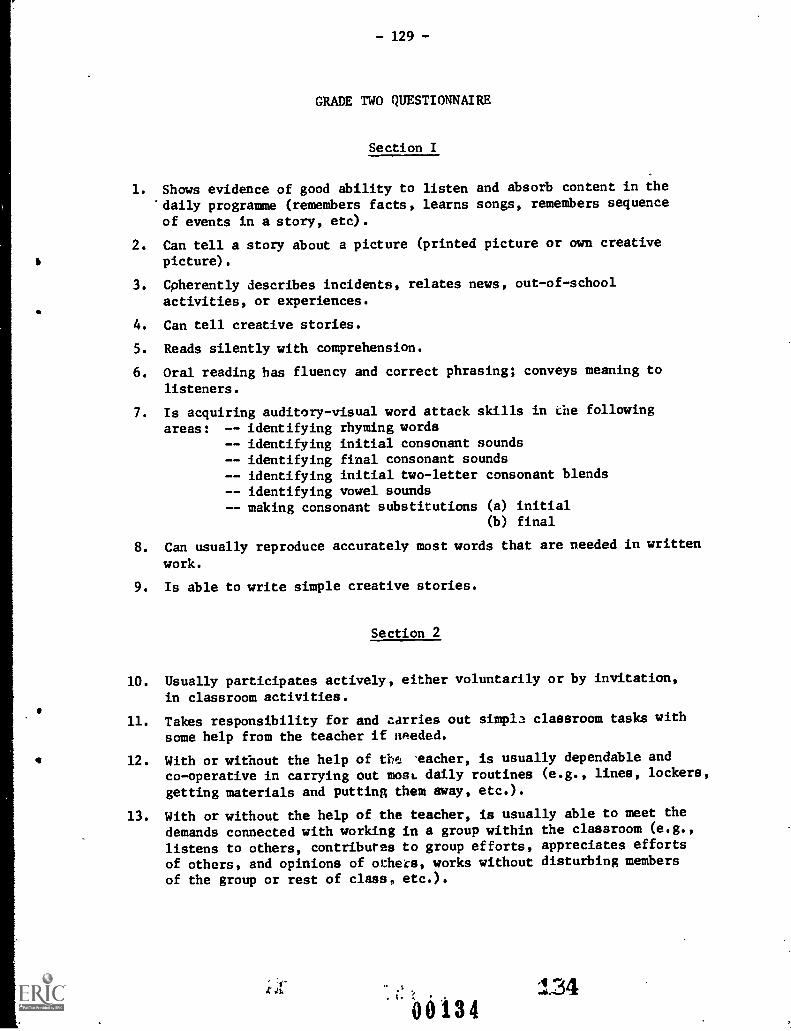
-129-
GRADE TWO QUESTIONNAIRE
Section I
1. Shows evidence of good ability todaily programme (remembers facts,of events in a story, etc).
2. Can tell a story about a picturepicture).
listen and absorb content in thelearns songs, remembers sequence
(printed picture or own creative
3. Coherently describes incidents, relates news, out-of-school
activities, or experiences.
4. Can tell creative stories.
5. Reads silently with comprehension.
6. Oral reading has fluency and correct phrasing; conveys meaning to
listeners.
7. Is acquiring auditory-visual word attack skills in the following
areas: -- identifying rhyming words- - identifying initial consonant sounds- - identifying final consonant sounds
- - identifying initial two-letter consonant blends
- - identifying vowel sounds-- making consonant substitutions (a) initial
(b) final
8. Can usually reproduce accurately most words that are needed in written
work.
9. Is able to write simple creative stories.
Section 2
10. Usually participates actively, either voluntarily or by invitation,
in classroom activities.
11. Takes responsibility for and carries out simply classroom tasks with
some help from the teacher if needed.
12. With or without the help of tht .eacher, is usually dependable and
co-operative in carrying out most daily routines (e.g., lines, lockers,
getting materials and putting them away, etc.).
13. With or without the help of the teacher, is usually able to meet the
demands connected with working in a group within the classroom (e.g.,
listens to others, contributes to group efforts, appreciates efforts
of others, and opinions of others, works without disturbing membersof the group or rest of class, etc.).
x 1z
0013413 41.34

- 130 -
Section 3
14. Has good ability to explore and understand mathematical concepts,with a minimum of help from the teacher.
15. Has good ability to solve mathematical problems and make up hisown problems with a minimum of help from the teacher.
16. Frequently attempts to solve his own problems in connection withseatwork, directions, rules, routines, and classroom equipment, etc.
17. Frequently participates in making and carrying out plans with littlenr no help from the teacher.
18. With a minimum of help from the teacher, is usually able to contributerelevant comments in discussions.
19. Has a good attention span.
Section 4
20. Ustally seeks and accepts help when it is really needed.
21. Usually shows ability to control temper and avoids showing irritabilityin most situations.
22. Usually reacts to situations wit'iout mannerisms or tensions.
23. Has sufficient emotional security to express own ideas to the teacherand/or classmates in same situations.
24. Usually shows willingness to attempt new challenges and tasks independently.
25. Can usually print with pencil between the required lines, and can makereasonably well-constructed uniform letter.
26. Can usually move about the classroom and perform most physical tasksin a well-coordinated manner (e.g., doesn't trip over desks and chairs,own feet, etc.; can handle books, etc., without dropping them; doesn'tspill paints, etc.; not awkward when sitting down on the floor orrising from the floor, etc.).
27. Can usually show a degree of accuracy when throwing, rolling, orbouncing a ball to someone or in catching a ball when someone is throw-ing, rolling, or bouncing a ball to him.
00135 71 135

- 131 -
GRADE 3+ QUESTIONNAIRE
Adjustment Section
1. Discipline: Displays behaviour that you, the teacher, consider
appropriate, for your classroom.
2. Ability to Get Along: Interacts with most of his classmates in a
satisfactory manner.
3. Acceptance of Goals: .Contributes to classroom activities, i.e. answersquestions readily, talks during discussion, makes active contribution
to class projects.
4. General Adjustment Evaluation: Considering all aspects of the child's
adjustment to the classroom environment, evaluate his position.
Performance
5. Reading: Reads with comprehension and fluency; conveys meaning to
listeners.
6. Mathematical Ability: Shows understanding of mathematical concepts
and operations; can solve problems.
7 Language: Extent of vocabulary; correct grammatical usage of English;ability to expressself clearly (both oral and written).
8. Use of Out-of-School Experiences in Class: Draws on background
experiences, reading.
9. General Performance Level: The quality of work; diligence in perform-
ing it.
Creative Thinking
10. ImagInatior and Inventiveness: Regardless of academic achievement, he
may be considered imaginative and inventive.
11. Creativity: Shows an urge to explore and create; is intuitive.
Academic Prediction
12. School Ability: To provide your estimate of this child's ability, try
to predict how far you think he will go (ignore financial ability of
parents).
.0.0136, 136