Editor in Chief Editorial Board Associate Editor in Chief ...


EDITORIAL BOARD
CHIEF EDITOR MANAGING EDITOR
DR. PAVAN MISHRA DR.SONIYA RAJPOOT Professor ,Department of Commerce
Barkatullah University,Bhopal INDIA
Ph.D(Management) , M.Phil (Management) Ex. MBA
(HRM), MBA(Finance),B.Com.(Computer), F.I.C.E.R..
EDITORIAL BOARD
DR.SAMEER SHARMA DR.KAMRAN SULTAN
Director Former Director
People's Institute of Management & Research,
Bhopal, INDIA
Pt. Jawaharlal Institute of Management
Vikram University, Ujjain, INDIA
DR. MANORAMA SAINI ADRIAN FARLEY
Reader& Head, Humanities Department Managing Director
Smart Ashok Technological Institute, Vidisha,
INDIA
Farley & Associates Ltd (UK Immigration Specialists)
LONDON
SAMEER ELWIN BHAGIRATHI MAHIMA AGOCHIYA
735 Queen Street East Toronto, Ontario
CANADA
Business Development, Advisor at McMaster University
Toronto, Ontario, CANADA
PUBLICITY AND PUBLICATION BOARD
DR. RAJESH KUMAR SHARMA, Faculty of Management, VNS Group of Institutions, Bhopal (MP)
Dr. Bhagwan Singh, LNCT-MBA, Bhopal(M.P.)
ADVISORY BOARD
DR. ARUN K.TRIVEDI DR. P.K. MISHRA
Managing Director Professor
Global Business Development Consultant C.R.I.M., Barkatullah University, Bhopal
At Vorse Solutions (UK) Limited, LONDON Ex-Vice Chancellor (DAVV. Indore)INDIA
DR. NAGESHWAR RAO DR. JAVAID AKHTAR
Pro Vice Chancellors Professor
Indira Gandhi National Open University (IGNOU) Ex- Former Chairmen & Dean
Ex-Vice Chancellor(Open University Allahabad)
INDIA
Department Business Administration, Aligarh Muslim
University, Aligarh , INDIA
DR. RAJ KUMAR DR. Y.S.THAKUR
Professor Head & Professor
Faculty of Management Studies Faculty of Management Studies
Banaras Hindu University, Varanasi INDIA Dr. Harisingh Gour University, Sagar, INDIA
DR. VIVEK SHARMA DR. P.K. CHOPRA
Director Director
CRIM Barkatullah University, Bhopal, INDIA Oriental College of Management, Bhopal INDIA
DR. K.K. SAXENA DR. L.P. PATERIYA
Head & Professor Head & Professor
Deptt. of Humanities &Social Science Deptt. of Management Studies
IIT Kanpur INDIA Guru Ghasidas University, Bilaspur, INDIA

ONLINE SHOPPING BEHAVIOUR OF CONSUMERS IN BHOPAL CITY-
A STUDY
By
Dr. Bhagwan Singh
Asst. Prof., LNCT-MBA, Bhopal
E-mail: [email protected]
ABSTRACT
This paper studies the behaviour of consumers in Bhopal city with respect to online shopping.
The variables included are familiarty with online shopping, familiarty with specific websites
engaged in e-retailing, purchased products from these websites etc. Data is collected directly
by interviewing the respondents according to a self-constructed schedule. Random sampling
technique is applied for gathering the data. Data analysis and statistical testing is performed
with the help of SPSS 16.0 and MS-Excel 2007 softwares. Results answer the questions like,
how consumers are aware of online shopping method?, how they use to purchase?, what
online shopping websites are chosen?, what kind of products are purchased? etc.
Keywords: Online shopping, consumer behaviour, online shopping websites, Bhopal city.
INTRODUCTION:
Online shopping is pioneered by Micheal Aldrich in 1980s. In India, it has been
successfully started by Indian Railway Catering and Tourism Corporation (IRCTC) by
opening online ticketing for public around 2002. Now-a-days, it is very popular for
purchasing various assortments, bill payments, ticket booking, mobile recharging etc. Most of
the companies maintain their well-developed websites to entertain online purchasing and
services. Various websites exclusively dealing with online-retailing are also prevalent in
common parlance these days. In present scenario many products and services are available on
virtual world i.e., internet. There are so many words that are synonymously used such as,
online shopping, electronic shopping, e-commerce etc. for the same concept and retailing is
the another aspect of the same environment. Whether brick & mortar or online retailing;
customer is the king everywhere. That is why most of the studies and researches at market
place are customer centric, so the current study too. Here in this research, consumer behavior
which is the study of groups, individuals or organizations relating to their purchase and
selection of products or services is studied with regard to online shopping. The study of

available literature on the topic is essential for full understanding, so the same is mentioned
further:
LITERATURE REVIEW:
Various literatures are studied for this purpose and important ones are mentioned
below with their conclusions:
Sonwalkar, Jayant and Nema, Geeta (2008) concluded that brand persona is the
most effective factor that affects the brand preference. The same deals with the personality
aspects or the external attributes of a brand. Thus, it can be said that the customer prefer any
brand by looking at the external attributes of a brand. . Gupta and Hiremath (2011) found
that there was a significant difference between the selected retail formats with respect to
merchandise, and services offered. Malls and discount store attracted many customers but
there was no difference found in quality, variety, style, brand, service and prices offered
among the outlets. Even the service factors like ambience, parking space, personal
assistance, sitting lounge, loyalty program and home delivery were not differed within the
outlets. It is also expressed that there was a need for better pricing, availability of more
brands and enhanced apparel service like the appointment of trained personnel. Sharma,
Himani (2008) concluded in her study that the technology helps in improving sophistication
that can develop ways to differentiate themselves and cultivate distinctive capabilities that
help achieve high performance. Dawn, Suman Kumar and Kar, Uttiya (2011) suggested
that the convenience in using internet websites and technologies should be emphasized by
the retailers. Online customers are more aware, more sensitive and therefore more difficult
to retain. The industry should ensure that customers must feel safe and secure while
transacting online. Goswami, Shubham and Mathur, Meera (2011) expected in their
studies that India would have an exponential growth in online retail industry due some
favorable driving forces like- demographics, economy, changing lifestyle, exposure to new
ideas etc. Shukre, Anagha (2011) concluded that the websites must be accessible and
operate efficiently. The retailers are suggested to join up the two retailing methods i.e.,
traditional and online. Vasanth, Kiran et. al. (2013) concluded that the internet savvy
generation is using social networking sites that can easily be used as promotional and selling
purposes. Technologies like- “Google Wallets” and other virtual wallets, customers need not
to carry cash and physical wallets. Hence it is expected that online sales in India is a
promising sector in coming future. Ghosh, Debasis (2014) suggested in this research study

that online vendors should design e-commerce portals with more interactivity options,
feelings, emotions and sense of enjoyments along with the detailed information about their
offerings, transparent business terms and conditions with special focus on privacy and
security aspects of customers’ information with the help of advanced technologies will
definitely help in growing the online consumers trust on those portals. Some issues of
concern are durability, delivery quickness, special offers, discounts, after sales service etc.
Poonia, Rashmi Siag ( 2015) studied on emerging online-retail market in India and found
that online retailing gives growth opportunities to many industries such as air cargo services,
warehousing industries, transportation industries, packaging, IT sector, telecom sector etc. It
is also helpful in generating employment opportunities.
OBJECTIVES OF THE STUDY:
To analyze the research problem, smaller objectives are defined that are given below:
i) To find out the behavior of consumers of Bhopal city, with regard to online shopping.
ii) To identify the popular shopping websites among the consumers of Bhopal city.
iii) To identify the kind of assortments being purchased from these websites by the
consumers of Bhopal city.
HYPOTHESES FORMULATED:
H01: There is no significant difference between age of the customers and naming the online
shopping websites.
H02: Familiarity with online shopping is independent of age of the customers.
H03: There is no significant difference between the sex of the consumers and the overall
satisfaction with regard to online shopping websites.
RESEARCH METHODOLOGY:
The research is conducted in Bhopal city. It is a survey based description type of
research study based on primary data. The data is gathered using random sampling technique
with the help of a schedule. The data is collected by conducting face to face interviews with
respondents. A total number of 200 samples were collected but only 196 samples were found
suitable for analysis as rest of them were not complete. Data so collected were tabled in MS-
Excel 2007 worksheet containing all the questions and variables. Later this datasheet was
exported to SPSS 16.0 and proper coding and labeling were done to get the output with

proper headings. The result outputs are drawn with the help of SPSS 16.0 software. For
validation of hypotheses constructed, Chi-Square and ANOVA are applied.
HYPOTHESES TESTING:
The hypotheses testing is performed as here under:
H01: There is no significant difference between age of the customers and identifying the
online shopping websites.
There are two variables in this hypothesis; age of the customers is the independent
one while identifying the online shopping websites is the dependent one. To validate the
hypothesis, one-way ANOVA is conducted. The output of ANOVA analysis is given in the
table 1. In this table, f-Value is 1.422 with degrees of freedom of 4 and 191. The p-Value is
0.228 which is greater than 0.05 hence the null hypothesis is statistically failed to reject at 5%
of significance level. It means that there is no statistically significant difference between the
age of the consumers and the identifying the online shopping websites.
Table 1: ANOVA test for identifying the online shopping websites
Sum of
Squares df
Mean
Square F Sig.
Between
Groups 52.362 4 13.091 1.422 0.228
Within Groups 1757.775 191 9.203
Total 1810.138 195
H02: Familiarity with online shopping is independent of age of the consumers.
Here, the independence of consumers’ familiarity with online shopping and their age
is tested. For this purpose, Chi- Square test of independence is conducted to find the
relationship between the two variances. The output of Chi- Square test is displayed in the
table 2 given further:

Table 2: Chi-Square tests
Value df
Asymp. Sig. (2-
sided)
Pearson Chi-Square 0.964 1 0.326
Likelihood Ratio 0.936 1 0.333
Linear-by-Linear
Association 0.959 1 0.327
N of Valid Cases 196
a. 0 cells (.0%) have expected count less than 5. The minimum
expected count is 11.48.
The Chi-Square table shows that the Pearson Chi-Square value is 0.964 with a degree
of freedom of 1 and p-Value is 0.326. The p-Value is greater than 0.05 hence the null
hypothesis is statistically failed to reject at a significance level of 5%. It means that the
familiarity with online shopping is independent of age of the consumers. In other words it can
be said that there is no significant relationship between the familiarity with online shopping
and age of the consumers.
H03: There is no significant difference between sex of the consumers and the
overall satisfaction with regard to online shopping websites.
There are two variables in this hypothesis; sex of the customers is the independent one
while identifying the online shopping websites is the dependent one. To validate the
hypothesis, one-way ANOVA is conducted. The output of ANOVA analysis is given in the
table 3.
Table 3: ANOVA test for overall satisfaction of the consumers with
online shopping websites
Overall satisfaction with
the online websites
Sum of
Squares df
Mean
Square F Sig.
Between Groups 5.621 1 5.621 5.920 0.016

Within Groups 184.195 194 0.949
Total= 189.816 195
It can be observed in the table 4 that the f-Value is 5.920 with degrees of freedom of 1
and 194. The p-Value is 0.016 which is less than than 0.05 hence the null hypothesis is
statistically rejected at 5% of significance level. It means that there is statistically a
significant difference between the sex of the consumers and the overall satisfaction with
online shopping websites.
RESULTS AND DISCUSSIONS:
1. Data gathered with regard to the variable termed as familiarity with online shopping is
undergone for frequency distribution. It is found in the analysis that the consumer
respondents of Bhopal city are aware of online shopping in majority, responded with the
option as yes.
2. It is found in the study that majority of consumers are familiar with the online
shopping website amazon.com. The next website which is popularly known is flipkart.com
followed by snapdeal.com. These websites are very popular and active in the online retail
industry in India which is supported with various studies. These websites also use strong
promotional strategies and supply chain system in cities like Bhopal.
3. It is also found that majority of consumers used to purchase electrical & electronics
items from online shopping websites. Next product category that is used to be purchased is
footwear followed by cloths & apparels. The electronics & electrical items include mobiles,
laptops, tablets, gadgets, electronic savers, computer accessories, and cameras etc. which are
favorite of young population. These products are offered on lesser prices as compared to
brick & mortar retail outlets. So due to lucrative discounts on branded products, customers
are attracted to shop from online stores.
4. It is found in testing the satisfaction level of the consumers with regard to online
shopping websites on Likert Scale that majority of the respondents were satisfied. Second
majority was identified for the response named as highly satisfied and the third for the
response neither satisfied nor dissatisfied that shows the neutrality of the consumers.
5. By performing one way ANOVA, it is validated that there is no statistically
significant difference between the age of the consumers and the identifying the online

shopping websites. In other words, it can be said that consumers’ knowledge about online
shopping websites is same irrespective of their age.
6. Chi-Square test has verified that the familiarity with online shopping is independent
of age of the consumers. It means that there is no significant relationship between the
familiarity with online shopping and age of the consumers. In simpler words, it can be said
that the knowledge of online shopping is not age specific of the consumers in Bhopal city.
7. One way ANOVA verifies that there is statistically a significant difference between
the sex of the consumers and the overall satisfaction with online shopping websites. So in
simpler words it can be said that the overall satisfaction with online shopping websites
differs with respect to the sex of the customer in Bhopal city.
CONCLUSION:
Finally, it can be concluded that the consumers of Bhopal city are familiar with online
shopping. The consumers are popularly known to online shopping websites such as,
amozone.com, flipkart.com, snapdeal.com etc. The satisfaction of the consumers is found
satisfied with regard to online shopping websites on five point Likert scale. One way
ANOVA testify that age is not a diterminant in respect of consumers’ knowledge about
online shopping websites. ANOVA also verifies that overall satisfaction of the consumers
with regard to online shopping websites differs with sex of the consumers. Chi-Square
validated that the knowledge of online shopping is not age specific of the consumers in
Bhopal city.
REFERENCES:
1. Dawn, Suman Kumar and Kar, Uttiya (2011) E-Tailing in India: Its Issues, Opportunities
and Effective Strategies for Growth and Development, International Journal of
Multidisciplinary Research, Vol.1 Issue 3. (Accessed on 08/01/2014 from
http://zenithresearch.org.in/images/stories/pdf/2011/July/9%20SUMAN%20E-
tailing_Paper.pdf)
2. Ghosh, Debasis (2014)/ Why Indian E-Retailing Market is Still a Partly Success and a
Partly Failure Story?, Journal of Accounting and Marketing, Volume 1, Issue 3.

(Accessed on 20/12/2014 from http://omicsgroup.org/journals/why-indian-eretailing-
market-is-still-a-partly-success-and-a-partly-failure-story-2168-9601.1000113.pdf)
3. Goswami, Shubham and Mathur, Meera (2011).Retail goes online- An Indian
Perspective, International Journal of Management and Tourism, Volume 19, Issue 2, pp
1-11. Accessed on 5/06/2014 from
http://ijmtpublication.com/files/IJMT_volume%2019_2_1.pdf
4. Gupta, Mathala Juliet and Hiremath, Chetan V. (2011). Apparel Retail Outlet Selection:
Influence Of Service Levels In Goa. Indian Journal of Marketing, Vol. 41, Issue 11: pp.
4-14.
5. Sharma, Himani (2008). Leveraging Technology: Retail Industry Gaining Competitive
Advantage. Journal of IMS Group, Vol. 5 No 2: pp 7-11.
6. Shukre, Anagha (2011) Youths’ Perception Towards Online Shopping: An Empirical
Study in Delhi/ NCR, Vishwakarma Business Review, Volume I, Issue 2, pp 9-19.
(Accessed on 15/08/2014 from
http://vbrjournal.net/index.php/vbr/article/view/52575/42204)
7. Sonwalkar, Jayant and Nema, Geeta (2008). A Study of the Factors Responsible for
Brand Preference in FMCG Products among College Students. Journal of IMS Group,
Volume 5, No. 1, pp 44-49.
8. Vasanth, Kiran and others (2013)/ Online Sales in India- Opportunities and challenges,
Global Journal of Commerce & Management Perspective, Vol. 2(2), pp 73-80. (Accessed
on 06/08/2014 from http://www.gifre.org/admin/papers/gjcmp/Online%20Sales.pdf).
9. http://shodhganga.inflibnet.ac.in/bitstream/10603/8374/4/04 accessed on 12-7-14
10. http://ripublication.com/ijmibs-spl/ijbmisv4n1spl_10.pdf (Fatima/ Flipkart-Myntra)
11. http://www.technopak.com/files/E-tailing_in_India.pdf (E-tailing in India: Unlocking the
Potential)
12. Kothari, C.R. (2002). Research Methodology: Methods & techniques, New Age
International, 2e.

13. Kotler, Phillip (2003). Marketing Management, Pearson Education, 11th ed., pg. 535.
Author:
Dr. Bhagwan Singh: The author is presently associated with Lakshmi Narain College of
Technology, Bhopal. He has multidisciplinary expertise with qualifications of Certificate in
French language, B.Ed., PGDCA, MLIS, MPhil. (LIS), MBA, and PhD (Mgmt). He has got
six research papers published in reviewed journals, books, and conference proceedings. He
has attanded one international and various national conferences. He has been participating
periodically in capacity building programmes. He is a life member of ISTE and ILA and
member of AIMA. His fields of interest are research methodology, retail management,
marketing management, computer applications etc.


ROLE OF EFFECTIVE COMMUNICATION IN ORGANIZATION
By
Dr. Dharmesh Jain
Head and Reader
Department of Management of Studies
S.A.T.I. Vidisha (M.P.)
ABSTRACT
Communication is one of the most important aspects of management. Without strong
communication, employees won't even understand what the manager wants them to
accomplish. Effective communication also helps employees to value their jobs more by
minimizing conflicts and letting each employee communication feel heard.
Key Words: Communication, Management, Employees, Effective
1. One way Communication Process
Communication may be defined as a process concerning exchange of facts or ideas between
persons holding different positions in an organisation to achieve mutual harmony. The
communication process is dynamic in nature rather than a static phenomenon.
Sender Encoding Message Channel Decoding Receiver

2. Two way Communication Process
Perceived Message &
Internal Response
A communication cycle and two-way communication cycle are in point of fact two majorly
different things. If we scrutinize closely the composition of communication – the actual
formation and parts – we will realize that a cycle of communication is not a two-way
communication in its whole. Meaning, two way communications is not as simple as one may
conclude. One can improve two-way or interpersonal communication by focusing on the eyes
of the person speaking, making eye contact, watching body language, responding
appropriately with comments, questions, and paraphrasing, and summarizing to authenticate
main points and an precise perceptive.
Two-way communication involves feedback from the receiver to the sender. This allows the
sender to know the message was received exactly by the receiver. Communication is also
negotiated which means that the sender and receiver listen to each other, the messages then
gathers information to respond. One person is the sender, which means they send a message
to another person via face to face, email, telephone, etc. The other person is the receiver,
which means they are the one getting the senders message. Once receiving the message, the
receiver sends a response back. For example, Person A sends an email to Person B --> Person
B responds with their own email back to Person A. The cycle then continues. This chart
demonstrates two-way communication and feedback
Encoder/ Sender
Encoding Ideas
(Verbal/Non Verbal)
Decoding of feedback
Decoder / Receiver
Decoding
Encoding of Response
Feedback
Message
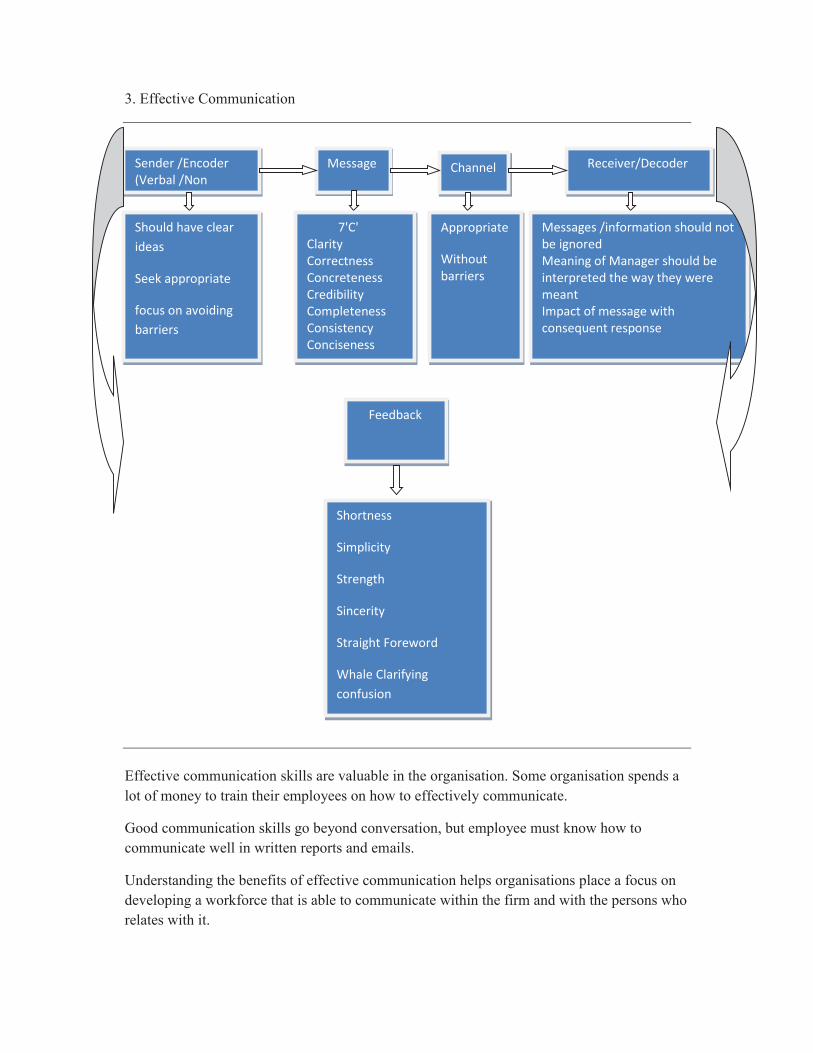
3. Effective Communication
Effective communication skills are valuable in the organisation. Some organisation spends a
lot of money to train their employees on how to effectively communicate.
Good communication skills go beyond conversation, but employee must know how to
communicate well in written reports and emails.
Understanding the benefits of effective communication helps organisations place a focus on
developing a workforce that is able to communicate within the firm and with the persons who
relates with it.
Sender /Encoder
(Verbal /Non
Message Receiver/Decoder Channel
Should have clear
ideas
Seek appropriate
focus on avoiding
barriers
7'C'
Clarity
Correctness
Concreteness
Credibility
Completeness
Consistency
Conciseness
Appropriate
Without
barriers
Messages /information should not
be ignored
Meaning of Manager should be
interpreted the way they were
meant
Impact of message with
consequent response
Feedback
Shortness
Simplicity
Strength
Sincerity
Straight Foreword
Whale Clarifying
confusion

Effective workplace communication is important in companies with workplace diversity.
Good communication skills help to reduce the barriers erected because of language and
cultural differences.
Message
1. Courtesy; Be polite and respectful for others, focus on 'YOU' attitude instead of 'I' attitude.
2. Clarity; Arrange appropriate words to have main ideas in the given sentence.
3. Correctness; Maintain proper grammar, punctuation and spelling with acceptable writing
mechanism.
4. Concreteness; Use specific facts, figure with image-building words.
5. Credibility; The sender should establish his credibility by building trust, sp the receiver
feel no problem in accepting the sender's statement.
6. Completeness & consistency; provide all necessary information with answering all
questions asked in desirable way.
7. Conciseness; Using the fewest possible words i.e., by keeping the message short and sweet
by avoiding unnecessary repetition to save the time of both sender and receiver.
Feedback
1. Sincerity; The geniuses & sincerity shown up in the tone communication and the language
that the sender writes.
2. Shortness; Brevity is the soul of wit i.e. the ability of sender to draft message in a crisp
simple style.
3. Simplicity; The ability to understand & explain even the most complex issue in a simple
way by using simple language and ideas.
4. Strength; The strength of any message comes from the fact that it convey the meaning
intended i.e. the message emanates from the credibility of the sender.
Conclusion
1. Communication is the process of transmitting information and common understanding
from one person to another by using elements of communication. the effective
communication can be retarded by number of barriers.
2. While giving feedback one should focus on avoiding criticism of particular person directly
by not highlighting the negative area too much and also look at area that can be improved
upon.
3. Effective communication is a two way process that requires efforts and skills by both
sender and receiver.
The success of business depends not only on what you communicate but also on how well
you communicate.
The individual employee and the organization together make success and failure by
communication with their internal & external customers.
The advantages of effective communication have better interpersonal relationship, better
information availability, better decision making, improved productivity, high employee
satisfaction.
Bibliography
Agee, W.K., R.H. Ault and E. Emery, eds, 1979, Introduction to Mass Communication, New
York: Harper and Row, Publishers.
Ahuja, B.N. and S.S. Chopra, 1989, Communication, New Delhi: Surjeet Publications.
Albrecht, T.L. and M.B. Adelman, eds, 1987a, Communicating social support, Newbury
Park, CA: Sage.
———, 1987, ‘Dilemmas of Supportive Communication’ in T.L. Albrecht, and M.B.
Adelman, eds, Communicating Social Support, Newbury Park, CA: Sage, pp. 240–254.
Allport, G.W., 1937, Personality: A Psychological Interpretation, New York: Holt.
Baxter, Leslie A., and Dawn O. Braithwaite, eds. 2008. Engaging theories in interpersonal
communication: Multiple perspectives. Thousand Oaks, CA: SAGE.
Canary, Daniel J., Michael J. Cody, and Valerie L. Manusov. 2008. Interpersonal
communication: A goals-based approach. 4th ed. Boston: Bedford/St. Martin’s.
DeVito, John A. 2009. The interpersonal communication book. 12th ed. Boston: Allyn &
Bacon.
“CORPORATE GOVERNANCE AND SEBI”
By
Dr. Anil Kothari
Professor and Coordinator (MBA Integrated)
RGPV Bhopal (M.P)
E-mail – [email protected]
ABSTRACT
Aims and Objectives:
The aim of this paper is to highlight the role of SEBI in Corporate Governance in
India and the impact caused by it. Corporate governance is the management of the rights of
shareholders as the true owners of the corporation on behalf of the shareholders. SEBI’s
regulatory framework will strengthen existing governance practices and also provide a strong
incentive to avoid corporate failures. Companies that do not employ meaningful governance
procedures will have to pay a significant risk premium when competing for scarce capital in
today’s public markets.
Materials and Methods:
This retrospective study was done using data collected from various sources like
books, newspapers, magazines and websites. Gathered data was further sorted, analysed and
converted into useful information through evaluation.
Conclusion:
With the recent increase in corporate scandals a plethora of corporate governance norms and
standards have sprouted around the country. Development of norms and guidelines should be
first step in a serious effort to improve corporate governance. The bigger challenge in India is
proper implementation of the rules at the ground level. It appears that outside agencies like
analysts and stock markets have the most influence on the actions of managers in the leading
companies of the country. Nevertheless, with industry organizations and SEBI themselves
pushing for an improved corporate governance system, the future of corporate governance in
India promises to be distinctly better than the past.
Key Words: Corporate Governance, SEBI, Scandals, Committees
INTRODUCTION
Investment is done by keeping faith in the ability of a corporation’s management.
Investor expects the board and the management for the safety of the capital and also earns a
rate of return that is higher than the cost of capital. Corporate governance is the management
of the rights of shareholders as the true owners of the corporation on behalf of the
shareholders. “The corporate governance systems should be in place to avoid corporate
misconduct and ensure discipline”1The Securities and Exchange Board of India (“SEBI”)
believes that corporate governance standards in India must improve. This is because these
standards themselves were evolving in keeping with market dynamics. Accordingly, the
Committee on Corporate Governance was constituted by SEBI, to evaluate the adequacy of
existing corporate governance practices and further improve these practices. The Committee
comprised members from various fields of public and professional life. This includes captains
of industry, academicians, public accountants and people from financial press and from
industry forums. The issues discussed by the Committee primarily related to audit
committees, audit reports, independent directors, related parties, risk management,
directorships and director compensation, codes of conduct and financial disclosures. The
Committee’s recommendations in the final report were selected based on parameters
including their relative importance, fairness, and accountability, and transparency, ease of
implementation, verifiability and enforceability. Some recommendations focus on
strengthening the responsibilities of audit committees; improving the quality of financial
disclosures, including those related to related party transactions and proceeds from initial
public offerings; requiring corporate executive boards to assess and disclose business risks in
the annual reports of companies; introducing responsibilities on boards to adopt formal codes
of conduct; the position of nominee directors; and stock holder approval and improved
disclosures relating to compensation paid to non-executive directors. Non-mandatory
recommendations include moving to a regime where corporate financial statements are not
qualified; instituting a system of training of board members; and the evaluation of
performance of board members. The Committee believes that these recommendations will
result in governance into specific requirements. SEBI’s regulatory framework will strengthen
existing governance practices and also provide a strong incentive to avoid corporate failures.
Companies that do not employ meaningful governance procedures will have to pay a
significant risk premium when competing for scarce capital in today’s public markets.
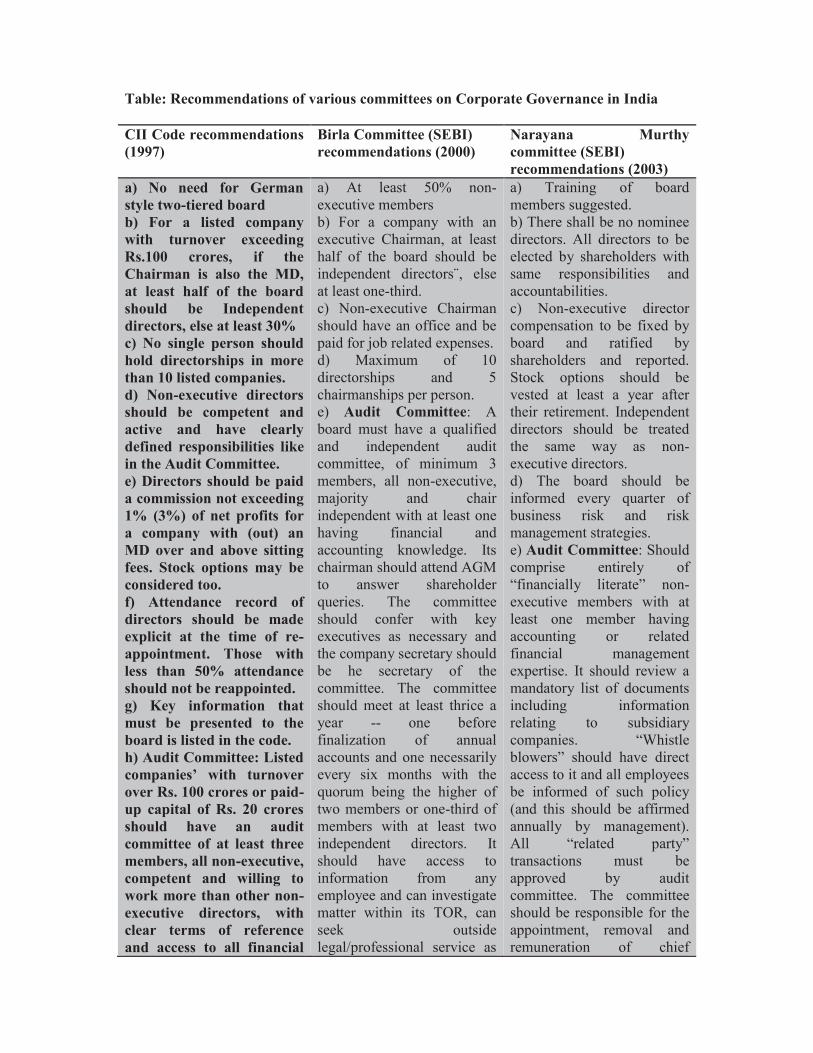
Table: Recommendations of various committees on Corporate Governance in India
CII Code recommendations
(1997)
Birla Committee (SEBI)
recommendations (2000)
Narayana Murthy
committee (SEBI)
recommendations (2003)
a) No need for German
style two-tiered board
b) For a listed company
with turnover exceeding
Rs.100 crores, if the
Chairman is also the MD,
at least half of the board
should be Independent
directors, else at least 30%
c) No single person should
hold directorships in more
than 10 listed companies.
d) Non-executive directors
should be competent and
active and have clearly
defined responsibilities like
in the Audit Committee.
e) Directors should be paid
a commission not exceeding
1% (3%) of net profits for
a company with (out) an
MD over and above sitting
fees. Stock options may be
considered too.
f) Attendance record of
directors should be made
explicit at the time of re-
appointment. Those with
less than 50% attendance
should not be reappointed.
g) Key information that
must be presented to the
board is listed in the code.
h) Audit Committee: Listed
companies’ with turnover
over Rs. 100 crores or paid-
up capital of Rs. 20 crores
should have an audit
committee of at least three
members, all non-executive,
competent and willing to
work more than other non-
executive directors, with
clear terms of reference
and access to all financial
a) At least 50% non-
executive members
b) For a company with an
executive Chairman, at least
half of the board should be
independent directors¨, else
at least one-third.
c) Non-executive Chairman
should have an office and be
paid for job related expenses.
d) Maximum of 10
directorships and 5
chairmanships per person.
e) Audit Committee: A
board must have a qualified
and independent audit
committee, of minimum 3
members, all non-executive,
majority and chair
independent with at least one
having financial and
accounting knowledge. Its
chairman should attend AGM
to answer shareholder
queries. The committee
should confer with key
executives as necessary and
the company secretary should
be he secretary of the
committee. The committee
should meet at least thrice a
year -- one before
finalization of annual
accounts and one necessarily
every six months with the
quorum being the higher of
two members or one-third of
members with at least two
independent directors. It
should have access to
information from any
employee and can investigate
matter within its TOR, can
seek outside
legal/professional service as
a) Training of board
members suggested.
b) There shall be no nominee
directors. All directors to be
elected by shareholders with
same responsibilities and
accountabilities.
c) Non-executive director
compensation to be fixed by
board and ratified by
shareholders and reported.
Stock options should be
vested at least a year after
their retirement. Independent
directors should be treated
the same way as non-
executive directors.
d) The board should be
informed every quarter of
business risk and risk
management strategies.
e) Audit Committee: Should
comprise entirely of
“financially literate” non-
executive members with at
least one member having
accounting or related
financial management
expertise. It should review a
mandatory list of documents
including information
relating to subsidiary
companies. “Whistle blowers” should have direct access to it and all employees
be informed of such policy
(and this should be affirmed
annually by management).
All “related party” transactions must be
approved by audit
committee. The committee
should be responsible for the
appointment, removal and
remuneration of chief

information in the company
and should periodically
interact with statutory
auditors and internal
auditors and assist the
board in corporate
accounting and reporting.
i) Reduction in number of
nominee directors. FIs
should withdraw nominee
directors from companies
with individual FI
shareholding below 5% or
total FI holding below 10%.
well as secure attendance of
outside experts in meetings.
It should act as the bridge
between the board, statutory
auditors and internal auditors
with far ranging powers and
responsibilities.
f) Remuneration
Committee: The
Remuneration committee
should decide remuneration
packages for executive
directors. It should have at
least 3 directors, all non
executive and be chaired by
an independent director.
g) The board should decide
on the remuneration of non-
executive directors and all
remuneration information
should be disclosed in annual
report
h) At least 4 board meetings
a year with a maximum gap
of 4 months between any 2
meetings. Minimum
information available to
boards stipulated.
internal auditor.
f) Boards of subsidiaries
should follow similar
composition rules as that of
parent and should have at
least one independent
director s of the parent
company.
g) The Board report of a
parent company should have
access to minutes of board
meeting in subsidiaries and
should affirm reviewing its
affairs.
h) Performance evaluation of
non-executive directors by all
his fellow Board members
should inform a re-
appointment decision.
i) While independent and
non-executive directors
should enjoy some protection
from civil and criminal
litigation, they may be held
responsible of the legal
compliance in the company’s affairs.
j) Code of conduct for Board
members and senior
management and annual
affirmation of compliance to
it.
Source: http://unpan1.un.org/intradoc/groups/public/documents/APCITY/UNPAN023826.pdf
A comparison of the three sets of recommendations in above Table reveals the progress in the
corporate governance in India over the years. An outline provided by the CII supported the
Birla Committee report of SEBI. SEBI implemented the recommendations of the Birla
Committee through the enactment of Clause 49 of the Listing Agreements. “They were
applied to companies in the BSE 200 and S&P C&X Nifty indices, and all newly listed
companies, on March 31, 2001; to companies with a paid up capital of Rs. 10 crore or with a
net worth of Rs. 25 crore at any time in the past five years, as of March 31, 2002; to other
listed companies with a paid up capital of over Rs. 3 crore on March 31, 2003.”2 The
Narayana Murthy committee worked on further refining the rules. The recommendations also
show that much of the thrust in Indian corporate governance reform has been on the role and

composition of the board of directors and the disclosure laws. The Birla Committee paid
much-needed attention to the subject of share transfers. In the area of corporate governance,
the spirit of the laws and principles is much more important. Developing a positive culture
and atmosphere of corporate governance is essential. Corporate governance norms should not
become just another legal item to be checked off by managers at the time of filing regulatory
papers.
CHANGES SINCE LIBERALIZATION
Liberalization has witnessed wide-ranging changes in both laws and regulations driving
corporate governance as well as general consciousness about it. “In the aftermath of
economic liberalisation corporate heavyweights have started mulling over the buzz phase of
corporate governance.”3
1. Most important development in the field of corporate governance and investor
protection in India has been the establishment of the Securities and Exchange Board
of India (SEBI) in 1992 and its gradual empowerment since then. It has played a
crucial role in establishing the basic minimum ground rules of corporate conduct in
the country. Concerns about corporate governance in India were started in the early
90’s – the Harshad Mehta stock market scam of 1992 followed by incidents of
companies allotting preferential shares to their promoters at deeply discounted prices
as well as those of companies simply disappearing with investors’ money.
2. These concerns about corporate governance stemming from the corporate scandals as
well as opening up to the forces of competition and globalization gave rise to several
investigations into the ways to fix the corporate governance situation in India. One of
the first among such endeavours was the CII Code for Desirable Corporate
Governance developed by a committee chaired by Rahul Bajaj. The committee was
formed in 1996 and submitted its code in April 1998.
3. SEBI constituted two committees to look into the issue of corporate governance. The
first chaired by Kumar Mangalam Birla that submitted its report in early 2000 and the
second by Narayana Murthy three years later.
4. The SEBI committee recommendations have had the maximum impact on changing
the corporate governance situation in India. The Advisory Group on Corporate
Governance of RBI’s Standing Committee on International Financial Standards and
Codes also submitted its own recommendations in 2001.
CORPORATE GOVERNANCE SCAMS
1. Vyapam scam
It is an admission & recruitment scam involving politicians, senior officials and businessmen
in the Indian state of Madhya Pradesh. Vyapam is a self-financed and autonomous body
incorporated by the State government responsible for conducting several entrance tests in the
state. These entrance exams are held for recruitment in government jobs and admissions in
educational institutes of the state. The scam involved a admission of undeserving candidates,
who bribed politicians and MPPEB officials through middlemen, to get high ranks in these
entrance tests. The scam also led to between 23 and 40 'unnatural' deaths of involved
individuals.
The scam involved 13 different exams conducted by Vyapam, for selection of medical
students and state government employees (including food inspectors, transport constables,
police personnel, school teachers, dairy supply officers and forest guards). The exams were
taken by around 3.2 million students.
2. Satyam Scam
The biggest corporate scam in India has come from one of the most respected businessmen.
Satyam founder Ramalinga Raju had to resign as chairman after admitting to manipulating
the account books. He filled the fictitious assets with real ones through Maytas acquisition
which failed, after that he decided to confess the crime. “Notwithstanding his constant
exhortations that his employees adopt a global mindset in the shrinking world, Ramalinga
Raju never followed this advice. In the end it was his lust for land that felled the IT czar and
took him to jail.”4 It was a fraud that involve about Rs 8,000 crore, Satyam is heading for
more trouble in the days ahead.
3. Harshad mehta scam
Harshad Mehta triggered a rise in the Bombay Stock Exchange in the year 1992 by trading in
shares at a premium across many segments. Taking advantages of the flaws in the banking
system, Harshad Mehta diverted Rs 4000 crore from the banks to stockbrokers between April
1991 to May 1992. Harshad Mehta moved money from one bank account to another,
especially illegally or dishonestly from several banks and millions of investors were conned
in the process. He was exposed, the markets crashed and he was arrested and banned for life
from trading in the stock markets. “Once the scam was exposed, though, a lot of banks were
left holding BRs which did not have any value - the banking system had been swindled of a
whopping Rs 4,000 crore.”5 He died in 2002 with many litigations still pending against him.
4. Ketan Parekh
Ketan Parekh targeted smaller exchanges like the Allahabad Stock Exchange and the Calcutta
Stock Exchange, and bought shares in fictitious names. His dealings revolved around shares
of ten companies like Himachal Futuristic, Global Tele-Systems, SSI Ltd, DSQ Software,
Zee Telefilms, Silverline, Pentamedia Graphics and Satyam Computer (K-10 scrips). “In
2001, a payment crisis triggered by Kolkata-based beers brought Parekh, who was known as
KP, down. A probe by market regulator SEBI along with other investigating agencies
unearthed the skeletons and KP was proclaimed a rogue trader. He was banned in the stock
market since 2001.”6 He borrowed Rs 250 crore from Global Trust Bank to fuel his
ambitions. Ketan alongwith his associates also managed to get Rs 1,000 crore from the
Madhavpura Mercantile Co-operative Bank. According to RBI regulations, a broker is
allowed a loan of only Rs 15 crore.
5. C.R.Bhansali Scam
He launched the finance company such as CRB Capital Markets, CRB Mutual Fund and CRB
Share Custodial Services. He collected money from the public through fixed deposits, bonds
and debentures during 1992-96. The money was transferred to companies that never existed.
The Bhansali scam resulted in a loss of over Rs 1,200 crore. Bhansali also succeeded to rise
about Rs 900 crore from the markets. “Bhansali was arrested as soon as he landed in Delhi.
Bhansali's advocate however maintained that his client had surrendered himself to CBI
officials 'as soon as he came to know that he was embroiled in an alleged case of fraud by the
company, which was being investigated by the CBI.”7 Bhansali tried borrowing more money
from the market. This led to a financial crisis. It became difficult for Bhansali to sustain

himself. The Reserve Bank of India (RBI) refused banking status to CRB and he was in the
dock. SBI was one of the banks to be hit by his huge defaults
6. Sohin daya scam
The main accused in the multi-crore shoes scam was Sohin Daya, son of a former Sheriff of
Mumbai. Others were Rafique Tejani of Metro Shoes, and Kishore Signapurkar of Milano
Shoes arrested for creating several leather co-operative societies which did not exist. They
raised loans of crores of rupees on behalf of fictitious societies. “The scam had cost the
government around Rs 1200 crore, while the poor Cobblers of Mumbai were severely
affected.”8 The scam was exposed in 1995. The accused created a fictitious cooperative
society of cobblers to take advantage of government loans through various schemes.
7. DINESH DALMIA’S” STOCK SCAM
Dinesh Dalmia was the managing director of DSQ Software Limited. He was involved in a
stocks scam of Rs 595 crore. His group included DSQ Holdings Ltd, Hulda Properties and
Trades Ltd, and Power flow Holding and Trading Pvt Ltd. “Mr. Dalmia, accused of criminal
breach of trust, cheating and fraud, is alleged to have induced National Securities Depository
Limited (NSDL) to dematerialise and credit 130 lakh equity shares of the software company
as fully paid shares.”9 He fled to US in 2003 and arrested by CBI in 2006.
8. Abdul KarimTelgi
He uses to sell fruits and vegetables on trains. He was the man behind one of the big scam
that rocked India. The fake stamp racket involving Abdul Karim Telgi was exposed in 2000.
The loss is estimated to be Rs 171.33 crore. In 1994, Abdul Karim Telgi acquired a stamp
paper license from the Indian government and began printing fake stamp papers. Telgi bribed
to get into the government security press in Nashikand bought special machines to print fake
stamp papers. “Several cases were against him in the '90s. Denied bail but not arrested. He
was arrested in August 2001, after he's made crores in a business spanning 72 centres in 12
states over 10 years.”10
9. The money market fraud
Virendra Rastogi chief executive of RBG Resources was deceiving banks worldwide of an
estimated $1 billion. “After fooling the world of finance with a sophisticated fraud spanning
three continents and six years from 1996 to 2002, Rastogi's RBG Resources fell under the
suspicion of Britain's Serious Fraud Office (SFO) because of a simple unintended human
error. In 2002 a PricewaterhouseCoopers auditor in Romania became suspicious when six
documents - purporting to be sent from six different companies all over the world - were all
sent from the same fax machine in Hong Kong.”11 According to CBI five companies, whose
directors were the four Rastogi brothers named Subash, Virender, Ravinde and Narinder
exported bicycle parts during 1995-96 to Russia and Hong Kong by heavily over invoicing
the value of goods for claiming excess duty draw back from customs.
CONCLUSION
With the recent increase in corporate scandals corporate governance norms and
standards have grew around the country. Different rules have been identified in recent
surveys and their number is increasing. India has been no exception to the rule. Several issues
deserve the attention. The problems for private companies, that form a vast majority of Indian
corporate entities, are not given any attention. It must be understood that ownership and
control are separate. Minority shareholders are exploited. Serious efforts should be done to
develop guidelines for corporate governance. The implementation of the rules at the ground
level is necessary. The influence of top companies dominates the role of analysts and stock
market. Adequate corporate governance is needed in the Indian company. Even the strictest
norms can be flawed in a system with widespread corruption. The industry organizations and
SEBI themselves pushing for an improved corporate governance system, the future of
corporate governance in India promises to be distinctly better than the past.
References:
1. Bhole, L.M. (2009): “Financial Markets & SEBI”, Tata Mcgraw Hill Private Ltd., New Delhi, p. 235
2. Vashisht, A.K., Tandon, B.B., and Arya, P.P. (2006): “Corporate Governance”, Deep and Deep Publications, New Delhi, Page 196
3. Fernando A.C. (2009): “Business Ethics and Corporate Governance”, Dorling Kindersley (India) Pvt Ltd., New Delhi, Page 12
4. Kingshuk Nag: “Satyam case: Ramalinga Raju's lust for land tripped him”, Apr 10, 2015

5. http://indianeconomyataglance.blogspot.in/2009/03/harshad-mehtas-scam.html
6.http://indiatoday.intoday.in/story/ketan-parekh-stock-market-share-prices-sebi-k-10-
stocks/1/208342.html
7. http://www.icmrindia.org/free%20resources/casestudies/Finance%20freecasep2.htm
8. http://www.dnaindia.com/mumbai/report-7-high-profile-scams-that-rocked-maharashtra-
and-their-net-worth-2003438
9. “Stock scam: Dinesh Dalmia arrested”: The Hindu, February 14, 2006
10. “Abdul Karim Telgi Ki Ajeeb Dastan”: The Times of India, Nov 16, 2003
11. Sarkar, Dipankar De: “Rastogi's multi-million dollar scam was right out of Bollywood”, Hindustan Times, June 06, 2008
WOMEN EMPOWERMENT AND RURAL PROGRAMMES
By
Dr. Jitendra Kumar Yadav
Principal , Laxmi Bai Sahuji Institute of Management
Jabalpur (MP)
ABSTRACT
----------------------------------------------------------------------------------------------------------------
Women empowerment and Rural Programmes is a debatable subject. After independence of
India, the constitutional makers and national leaders strongly demand equal social position of
women with men. The past three decades have witnessed a steadily increasing awareness of
the need to empower women through measures to increase social economic and political
equity, the border access to fundamental human rights, improvement in nutrition, basic health
and education. Along with awareness of the subordinate status of women has come the
concept of gender as an overarching socio-cultural variable, seem in relation to other factors,
such as race, class, age and ethnicity. Gender equality refers to that stage of human social
development at which “the rights, responsibilities and opportunities of individuals will not be
determined by the fact of being born male or female”, in other words, a stage when both men
and women realize their full potential. Today we have seen the women occupied the
respectable positions in all walks of the fields. Yet, they have not absolutely freed some
discrimination and harassment of the society. Therefore, each and every one should be
careful to promote the women status.
In the changing scenario of the Indian society efforts has been made to empower
women so that they can not only joins hand in making important decisions in the family or
society but also hold the public office for development.
Keywords: Women Empowerment , Rural Programmes, Opportunity.
INTRODUCTION:
The very issue of women empowerment arises because of the stark reality that women are
still marginalized and sidelined from the mainstream as a use-and-throw commodity. The
patriarchal canopy had always denied women the warm rays of autonomy and freedom.
Empowerment of women involves many things, economic opportunity, property rights,
political representation, social equality, personal rights

Women comprise nearly half of the national population of a country. Of Course, the
Globalization provided opportunities of education and employment to urbanwomen and
helped them to develop and possess all the rights equally with men. Butthe problem is that
the women in rural areas are still backward in education, socialstatus, economic background,
political matters, etc. Hence, the development of thecountry is inescapably linked with the
status of development of rural women. Economic empowerment is one approach to enable
women to realize their inherent knowledge, skills and competences for creation of small
business enterprises. There are shining examples from the developing countries to illustrate
women entrepreneurs who started small and grew to large enterprises. Women are considered
as a focal point and the unifying force in the family. While their contribution to the family
and society is considerable, they are subjected to numerous constraints undermining their
potentials. They receive only small share indevelopment opportunities and are often excluded
from education, better jobs, participation in political system and better health care, decision
making, etc. Besides, they suffer from physiological, physiological, social and cultural
barriers, which hinder their empowerment. In rural areas, women are preoccupied with
mostly household work including the bearing and rearing of children. Accordingly, the
opportunities for improving their conditions are limited. The Government of India and state
governments have already been formulated social welfare, women empowerment and rural
development Programmes for the betterment of women, backward classes and vulnerable
groups. These Programmes are discussed as under.
WELFARE PROGRAMMES OF GOVERNMENT:
Following are a few Government Programmes, which aimed at empowerment of women,
social welfare and rural development in different aspects:
1.Integrated development programme (IRDP)
2. Training of Rural Youth for self-Employment (TRYSEM)
3. Jawahar Rozgar Yojana (JRY)
4. Professional women’s Development Network (PWDN)
5. The National Employment Guarantee Act(NREGA)
6. Pradhan Mantri Gram Sadak Yojana (PMGSY)
7. Indiara Awas Yojana (IAY)
8. Swarnajayanti Gram Swarozgar Yojana (SGSY)
9. Sampoorna Grameen Rozgar Yojana (SGRY)

10. Swarna Jayanti Shahari Rozgar Yojana (SJSRY)
These Programmes are helping Empowering Women and Rural development.
1.Integrated development programme (IRDP): Various kinds of agencies are carrying on
the task of providing ruralemployment. They include, Employment Guarantee Scheme, Food
for Work Programme, small Farmers Development Agency, Marginal Farmers and
Agricultural Laborers, Drought prone Areas Development Proramme, Desert Development
Programme, Command Area Development Programme, etc. TheSixth plan (1980-85)
proposed that such multiplicity of programmes for the ruralpoor operated through a
multiplicity of agencies should be ended and replaced byone single integrated programme
operative throughout the country. This programme was named the Integrated Rural
Development Programme (IRDP), which was initiated on 2nd October 1980 in all the 5011
blocks in India. The IRDP aims at providing self-employment opportunities to the rural poor
through assistance in the form of subsidy and bank credit to enable them acquire productive
assets and appropriate skills to cross the poverty line.
2. Training of Rural Youth for self-Employment (TRYSEM): TRYSEM is centrally
sponsored scheme. It started functioning since15th August 1979. It aimed at providing basis
technical and entrepreneurial skills to the rural youth from families below the poverty line to
enable them to take up self-employment in the broad fields of agriculture and allied sectors,
industries,services and business activities.
3. Jawahar Rozgar Yojana (JRY): On 28th April 1989, Prime Minister Rajiv Gandhi
launched the Jawahar RozgarYojana and the primary objective which is general of gainful
employment for the unemployed and underemployed, men and women in the rural areas.
4. Professional women’s Development Network (PWDN): PWDN was established in 1992
in order to offer a comprehensive service of women’s development and training to both
employers and individuals in areas of consultancy, research training, development,
monitoring and such other training programme
5. The National Employment Guarantee Act (NREGA): The National Employment
Guarantee Act was notified on 7th September,2005, aims at enhancing live hood security of
households in rural areas of the country by providing at least 100 days of guaranteed wage
employment in afinancial year to every household whose adult member’s volunteers to do

unskilled manual work. The NREGA Act which came into existence on Feb 2, 2006 was
initially
Implemented into 200 districts of the country in the I Phase. In the II Phase beginning 2007-
08, it was further extended to 130 more districts for implementation. From April 2008, it
extended across the country. Over the three years since it became operational, NREGA
(2005) has had a positive impact on the lives of millions of people across the poorest district
in the country. In particular, it holds the powerful prospect of bringing major changes in the
lives of women. It is rechristened as MAHATHMA GANDHI NATIOAL RURAL
EMPLOYMENT GUARANTEE SCHEME (MGNREGS) on the occasion of 140th Birth of
Mahatma Gandhi.
6. Pradhan Mantri Gram Sadak Yojana (PMGSY): Launched in December 2000 as a 100
percent CSS, PMGSY aims to provide allwearer connectivity to all the eligible unconnected
rural habitations. Bharat Nirman emerges connectivity by 2009 to all the habitations with a
population of 1000 or more in the lains of 500 or more in the hilly, desert and tribal areas.
7. Indiara Awas Yojana (IAY): Indira Awas Yoyana was implemented since 1985-86 under
the Rural Landless Employment Gurantee Scheme (RLEGP).Indira Awas Yojana aims to
provide dwelling units free of cost – sharing basis in the rates of 75:25 between the Center
and the States.
8. Swarnajayanti Gram Swarozgar Yojana (SGSY):SGSY, launched in April 1999 after
restructuring the integrated Rural DevelopmentProgramme and allied schemes, is the only
self-employment programme for therural poor. The objective is to bring the self-employed
above the poverty line by providing them income-generating assets through bank credit and
Government subsidy.
9. Sampoorna Grameen Rozgar Yojana (SGRY): SGRY launched on September 25, 2001
to provide additional wage employment inthe rural areas, has cash and food grains
component and the Centre bears 75 percent and 100 percent of the cost of the two with the
balance borne by the
States/Union Territories.
10. Swarna Jayanti Shahari Rozgar Yojana (SJSRY): In December 1997, the Urban Self-
Employment Programme (USEP) and theUrban Wage Employment Programme (UWEP),

which are the two specialcomponents of SJSRY, substitute for various programmes operated
earlier forurban poverty alleviation. The SJSRY is founded on a 75:25 basis between
theCenter and States.
While the benefits of the above mentioned programmes flowing to the women can be
measured in quantitative terms, for other programmes such as Pradhan Mantri Gram Sadak
Yojana (PMGSY), it isnot always possible to collect the segregated data reflecting the direct
benefits flowing to the rural women. But this programme does have a significant impact on
the living conditions of the rural women in terms of providing connectivity through the rural
roads, which may enhance the opportunities for the girl child to have an access to the
educational facilities.
Similarly, due to better rural roads women may have easier access to the health facilities and
local market which may not only increase their productivity but may also increase their
awareness which goes a long way in changing the traditional social structure and resulting in
improvement of the rural women.
We will see percentage of benefiters from someof these Govt. Programmes:
Name of Programmes Percentages of Benefiters
Swarna Jayanti Gram Swarazgar Yojana
(SGSY)
78.33
Indira Awas Yojana (IAY) 39.17
Ashraya Yojana 55.00
Prime Minister’s Rozgar Yojana(PMRY) 28.33
Navagram Yojana 23.33
Stree Shakti Yojana 95.00
National Rural Employee Guarantee
Scheme (NGEGS)
17.50

Now-a-days economic development is one of the factors that have changed the entire
scenario of social and cultural environment within the country especially for the women. The
rural women are engaged in small-scale entrepreneurship programme with the help of Self
Help Groups. Through that they were economically empowered and attaining status in family
and community.
Rural women play a vital role in farm and home system. She contributes substantially inthe
physical aspect of farming, livestock management, post-harvest and allied activities. Her
direct and indirect contribution at the farm and home level along with livestock management
operation has not only help to save their assets but also led to increase the family income. She
performs various farm, livestock, post-harvest and allied activities and possesses skills and
indigenous knowledge in these areas. The women were empowering themselves technically
to cope with the changing times and productively using their free time and existing skills for
setting and sustaining enterprises. They were engaged in starting individual or collective
income generation programme with the help of self-help group. This will not only generate
income for them but also improve the decision-making capabilities that led to overall
empowerment.
Empowering women particularly rural women is a challenge. Following are some of the
personal and social capabilities, which were developed as result of taking up enterprise
among rural women.
• Economic empowerment
• Improved standard of living
• Self confidence
• Enhance awareness
• Sense of achievement
• Increased social interaction
• Engaged in political activities
• Increased participation level in gram-sabha meeting
• Improvement in leadership qualities
• Involvement in solving problems related to women and community
• Decision making capacity in family and community
Economic empowerment of women by micro entrepreneurship led to the empowermentof
women in many things such as socio-economic opportunity, property rights, political

representation, social equality, personal right, family development, market development,
community development and at last the nation development.
Standing on the threshold of the twenty-first century as one looks back a question that
confronts us is where indeed are the women in India in terms of empowerment and socio-
economic emancipation? In the changing scenario of the Indian society efforts has been made
to empower women so that they can not only joins hand in making important decisions in the
family or society but also hold the public office for development.
Rural development is an integral process of economic growth and social progress. It implies
the development of rural sector which has many dimensions. The role of microfinance and
women empowerment in this context is important because it provides an environment of
sustainable improvement in the quality of life of rural womenfolk enabling them to form
S.H.Gs, and providing them equal opportunities in decisionmaking process and participation
in community life.
CONCLUSION
Still the rural areas is underdeveloped. As suchthere was employment –gap among the rural
people, as many of the small scaleindustries, cottage industries and handicrafts are ended.
Further, even thoughwomen constitute half of the population, they have no adequate
representation, uneducated and employment, especially in rural areas. The rural
development,women empowerment and employment generation policies discussed above are
very helpful for the rural women so as to start income generating activitiesindependently or
give at least 100 days of employment for the rural women. But it is emphasized that still there
is no or less awareness about the government Programmes among the rural people and
particularly among rural women. Hence, the voluntaryorganization and Non-Governmental
Organizations have to act to increase theawareness among the rural women on the
government Programmes.
Rural development symbolizes rural industrialization. Rural industrialization provides the
best solution to tackle with the twin problems of unemployment and poverty in the rural areas
of the country particularly women employees. However, the development of rural
industrialization is plagued by some major problems like inadequate flow of credit; use of
obsolete technology, machinery and equipment, and inadequate infrastructural facilities.
Solving these problems is necessary for developing rural industries in the country. The
NGOs have proved as an effective agent in developing industries in rural areas with effective
empowerment of women in our country.
The Govt. of India planning to facilitate Road, House, Electricity, Drinking Water and
minimum needs to Rural area such that Rural Development has to be taken place and get a
chance to employability in Rural youth, and give maximum protection to women,in that
context Govt. of Madhya Pradesh implemented a programme called Ladli Laxmi
Yojana,Sukanya Yojana , Beti bachao it speaks about give an importance to girl child.
There is no cast for poverty and there is no cast for hungry .So that empowering rural women.
1. http:/indiabudget.nic.in
2. http://www.indiatogether.org
3. http://gcra.in
4. http://mgnrage.in
5. http://google.com
6. http://govt.ap.in

“IMPACT OF FINANCIAL REPORTING QUALITY ON EPS: AN EMPIRICAL
STUDY OF INDIAN FINANCING COMPANIES”
By
Ms. Saumya Singh
UGC Net & ICSSR Fellow,
Faculty of Management Studies, Banaras Hindu University, Varanasi (U.P.)
Dr. Raj Kumar
Professor, Faculty of Management Studies,
Banaras Hindu University, Varanasi (U.P.)
ABSTRACT
The paper examines the effect of Financial Reporting Quality on Company Performance of
Indian financing companies. The data are extracted from 112 sample firms representing the
quoted financing companies in India as the population of the study. Multiple step-wise
regressions are conducted for the analysis of data. The results from regression analysis
suggest that there is positive impact of firm attributes on financial reporting quality of quoted
financing firms in India. In addition, the Fishers statistics of significant change in step-wise
analysis indicates model II is a good fit. Therefore, the model reveals that the Financial
Reporting Quality of quoted financing firms in India has positive influence in performance of
the company. It is therefore, recommended that the company should report reliable and error
free information based on prevailing standards to ensure higher quality of financial reporting.
Keywords: Financial Reporting Quality (FRQ), Earning Per Share (EPS), Firm attributes,
Financing Companies.
1. INTRODUCTION
The word corporate disclosure and Financial Reporting is used interchangeably in the
accounting research. Financial Reporting is a process through which an undertaking
communicates with especially external parties. It is the Communication of various details
regarding the activities of the business, which are to be disclosed either statutorily or
otherwise, to convey a true and fair view of the operating results and performance for the
particular years. Information about corporate activities is essential for investors and other
users in order to reach appropriate decisions. The aim of financial reporting to promote

transparency is accomplished through comprehensive reporting of corporate actual performed
activities which was a global concern since long time.
In order to have to good predictive value or better feedback, the reporting must be timely and
pertinent. Moreover, annual reports are most crucial avenues for corresponding companies’
performance to different stakeholders. As annual reports helps on decision making, therefore
it, should always present reliable and error free information. It was also viewed that, it can
never be completely free from bias, as various estimates, assumptions and economic
phenomena are integrated in the annual report under situations of uncertainty (Jonas and
Blanchet, 2000). Although it is not possible to achieve complete lack of bias, a definite level
of exactitude in reporting is always required for decision to be purposeful. Therefore, it is
important that the information presentation in the annual report should not be misleading or
ambiguous and should present financial/ non-financial performance of corporate clearly.
Users should be able to understand the information presented by the companies according to
prevailing standards and practices of reporting. To achieve this, the annual reports should
contain full disclosure and higher level of transparency. The study, therefore, centered on
evaluating the effect of firms’ attributes and Financial Reporting Quality on EPS of Indian
financing companies.
2. THEORETICAL BACKGROUND
Corporate disclosure of financial reports helps the investors, lenders and several other users
to analyze the past performance of the company and to compare its performance with other
peer companies’ performance for the particular years. The disclosure can be done through
various ways similarly the disclosure through annual report plays an important role. Previous
study on this area was initiated by Cerf (1964) and afterwards, several researches have
conducted on the reporting of quality of information in various contexts. The glimpses of
such studies are: Owusu- Ansah (1998); Ho and Wong (2001), Chau and Gray (2002); Naser
et al. (2006); Akhtaruddin (2005) and Ofoegbu and Okoye (2006). Each of these studies has
been differentiated by research objectives, differences in nature of independent variables,
differences in corporate reporting index calculation and differences in statistical tools for the
analysis. These studies identified the corporate attributes which are used as analyst in
explaining the quality of financial reporting. The most popular characteristics that were
studied in prior researches are selected and incorporated in the present research to know the
influence of financial reporting quality on corporate performance. The variables include

profitability i.e. EPS, Age of Company, Board Composition, Firm Structural Complexity,
Firm Multiple Listing and Number of Shares which are explained as:
2. 1. Profitability
Earnings Per Share (EPS) is the portion of distributable company’s revenue which is
allocated among outstanding equity share holders. EPS is considered as indicator of the
profitability of any corporate performance, and it is also widely used as measures for
calculating profitability. Previous studies by Cerf, 1964; Singhvi and Desai, 1971; Wallace
and Naser, 1995; Inchausti, 1997; Owusu-Ansah, 1998, examined EPS are capable of
persuading the extent of corporate financial reporting. Such studies generated that EPS is a
good measure of corporate performance, and also depicted from the above studies that
profitable firm is likely to disclose more information. More of previous studies i.e, Singhvi
and Desai (1971); Wallace and Naser (1995); Meek et al.(1995); Inchausti (1997); Glaum and
Street (2003) and Akhtaruddin (2005) have empirically tested the relationship between EPS
as profitability and extent corporate reporting, in which they found the mixed results.
For instance, Singhvi and Desai (1971) & Owusu-Ansah (1998) found positive and
significant connection between profitability and corporate reporting, whereas Meek et al.
(1995) found that profitability has no impact on reporting of corporate information. Wallace
and Naser (1995) described a negative relationship between EPS and corporate reporting.
Lang and Lundholm (1993) pointed that the influence of profitability on corporate reporting
can be positive, neutral or negative, depending on its level of performance.
2.2 Age of Company
Age of company is a crucial indicator of firm attribute as older company tends to produce
more information when compared to newly constructed company. It is believed that old
companies might have improved its financial reporting practices over time, and therefore,
they are expected to provide more disclosure than newly established companies
(Akhtaruddin, 2005; Al-Shammari, 2005; Patelli, L.& Prencipe, A., 2007; Barako, et. al. ,
2006). In 1988, Owusu-Ansah in his study proved that company age has a statistically
significant & positive influence on corporate disclosure and reporting practices in Hong
Kong. In New Zealand, Owusu-Ansah and Yeho (2005) also found company age as the vital
factor in explaining the extent of mandatory disclosure practices. Al Shammari et al (2007)
examined the association between the age and reporting practices; he found the significant
association between them.
Moreover, Kakani et al. (2001) have a slight different opinion that newer and smaller firm
must have lack of capital, not established brand name and reputation unlike older firms;
However, it is not possible to reach a conclusion that long-established firms can disclose
more information or be more compliant than newly-established firms.
2.3 Size of Board Members
The board of directors is another important component of corporate reporting and governance
system. Board size is considered as an interesting variable as it will indirectly replicate the
existence of executive and non executive directors on the board (Haniffa and Cook, 2002).
According to agency theory, the board should be more effective when composed of a
majority of unrelated directors (Jensen and Meckling, 1976 & Berle and Means, 1991).
Mangel and Singh (1993) expressed that outside directors have more opportunity for their
control and greater flexibility in decision making as it was amplified by their equity position
with the company. Fama and Jensen (1983), Brickley and James (1987), Hermalin, B. E. &
Weisbach (1988), and Pearce, J. A., & Zahra, S. A. (1992) depicted that the role of non-
executive directors helps in monitoring and controlling of corporate performance and actions.
In addition, Fama and Jensen, (1983) expressed that exterior directors to be considered as
decision experts which may lessen corporate spending and would always act as a positive
influence over the company decisions and actions. Chen and Jaggi (2000) examined the
significant effect of size of board members and practices of corporate financial disclosures in
Hong-Kong. Cheng, E. C., & Courtenay, S. M. (2006) reported that board structure is
significantly correlated to the corporate reporting in Singapore stock exchange listed firms.
However, Forker (1992) concluded that there is no significant relationship between corporate
disclosure attribute i.e., size of board members and quality in financial reporting. Ho and
Wong (2001) also found no considerable association between the proportion of board
members and the extent of voluntary corporate reporting in Hong Kong listed companies.
Eng and Mak (2003) also found a negative association between board numbers and level of
voluntary financial reporting. These results suggested that board structure acts as a substitute
rather than a complement for corporate financial reporting.
2.4 Firm Structural Complexity

Here, structural complexity is defined as the actual number of subsidiaries, as evident in
Indian companies. Few studies have been conducted on firm structural complexity to know
the effect on corporate reporting. Thus, Haniffa and Cook (2002) argued that structural
complexity has a significant influence on the extent of corporate reporting. Studies showed
that company having numbers of subsidiaries required a firm to have an effective corporate
reporting structure for monitoring purposes (Courtis, 1978; Cooke, 1989a). The availability
of above structure thus helps to reduce the cost of information per unit, thereby providing the
expectation of higher disclosure.
2.5 Firm Multiple Listing
Firm multiple listing e.g., listed versus unlisted, or listed versus multiple listings, has been
found by many researchers to be associated with disclosure (Singhvi and Desai, 1971, Firth,
1979; Cooke, 1989a, 1989b, 1991, 1992, 1993; Malone et al., 1993; Hossain et al., 1994;
Wallace et al., 1994; Hossain et al., 1995; Inchausti, 1997; Patton and Zelenka, 1997). This
association largely reflects the additional information disclosures specified in the listing
requirements of the various stock exchanges.
2.6 Number of Shares
Cerf finds that there is a positive relation between disclosure and number of shares. Prior
research (Lang and Lundholm, 1993; Frankel et al., 1995; Bujaki and McConomy, 2002;
Collet and Hrasky, 2005) suggests that companies planning to issue new equity during the
coming year should increase their disclosure level to reduce information asymmetry with
external investors and reduce financing costs. Collett and Hrasky (2005) find a positive
association between voluntary disclosure & governance practices and the intention to raise
equity capital in Australia. However, Bujaki and Mc Conomy (2002) do not report a
significant association between number of share issued and the extent of corporate
governance information.
3.1 RESEARCH DESIGN
The study focuses on the financial reporting quality of Indian financing companies. The
content analysis technique has been used to empirically investigate the data. To test the
disclosure status an index has been developed based on the past review of literature and
annual reports of the financing companies. The objectives of this research are:
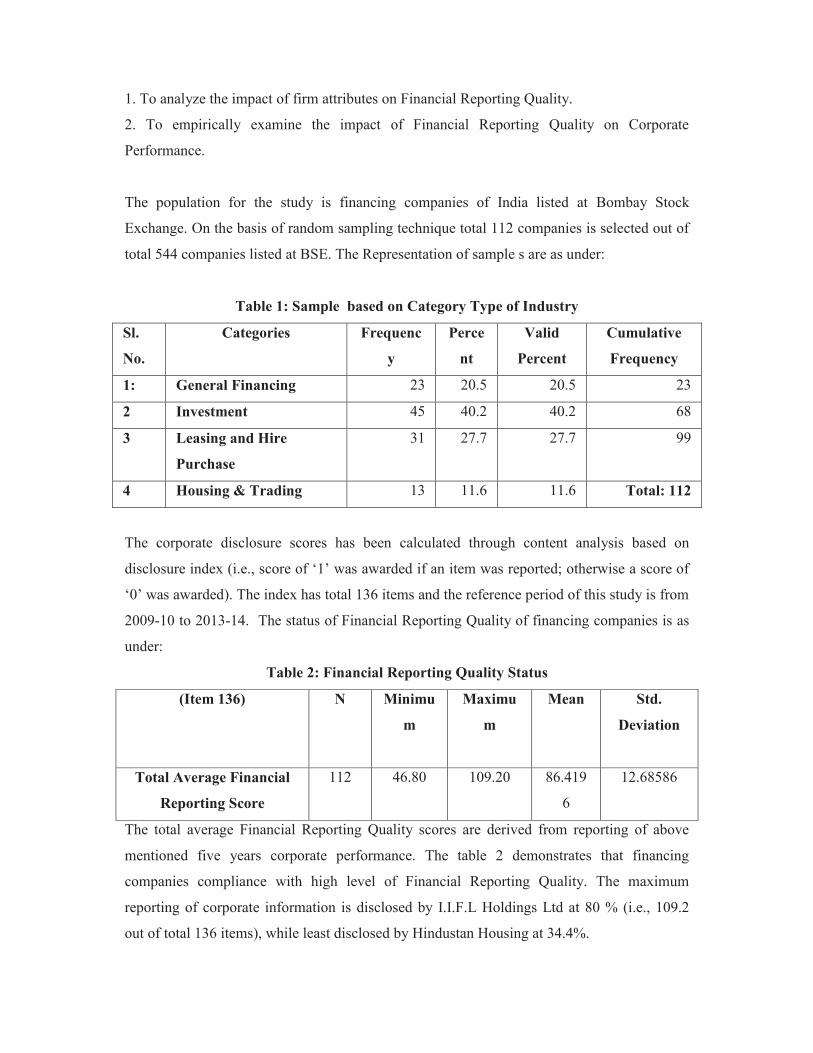
1. To analyze the impact of firm attributes on Financial Reporting Quality.
2. To empirically examine the impact of Financial Reporting Quality on Corporate
Performance.
The population for the study is financing companies of India listed at Bombay Stock
Exchange. On the basis of random sampling technique total 112 companies is selected out of
total 544 companies listed at BSE. The Representation of sample s are as under:
Table 1: Sample based on Category Type of Industry
Sl.
No.
Categories Frequenc
y
Perce
nt
Valid
Percent
Cumulative
Frequency
1: General Financing 23 20.5 20.5 23
2 Investment 45 40.2 40.2 68
3 Leasing and Hire
Purchase
31 27.7 27.7 99
4 Housing & Trading 13 11.6 11.6 Total: 112
The corporate disclosure scores has been calculated through content analysis based on
disclosure index (i.e., score of ‘1’ was awarded if an item was reported; otherwise a score of
‘0’ was awarded). The index has total 136 items and the reference period of this study is from
2009-10 to 2013-14. The status of Financial Reporting Quality of financing companies is as
under:
Table 2: Financial Reporting Quality Status
(Item 136) N Minimu
m
Maximu
m
Mean Std.
Deviation
Total Average Financial
Reporting Score
112 46.80 109.20 86.419
6
12.68586
The total average Financial Reporting Quality scores are derived from reporting of above
mentioned five years corporate performance. The table 2 demonstrates that financing
companies compliance with high level of Financial Reporting Quality. The maximum
reporting of corporate information is disclosed by I.I.F.L Holdings Ltd at 80 % (i.e., 109.2
out of total 136 items), while least disclosed by Hindustan Housing at 34.4%.
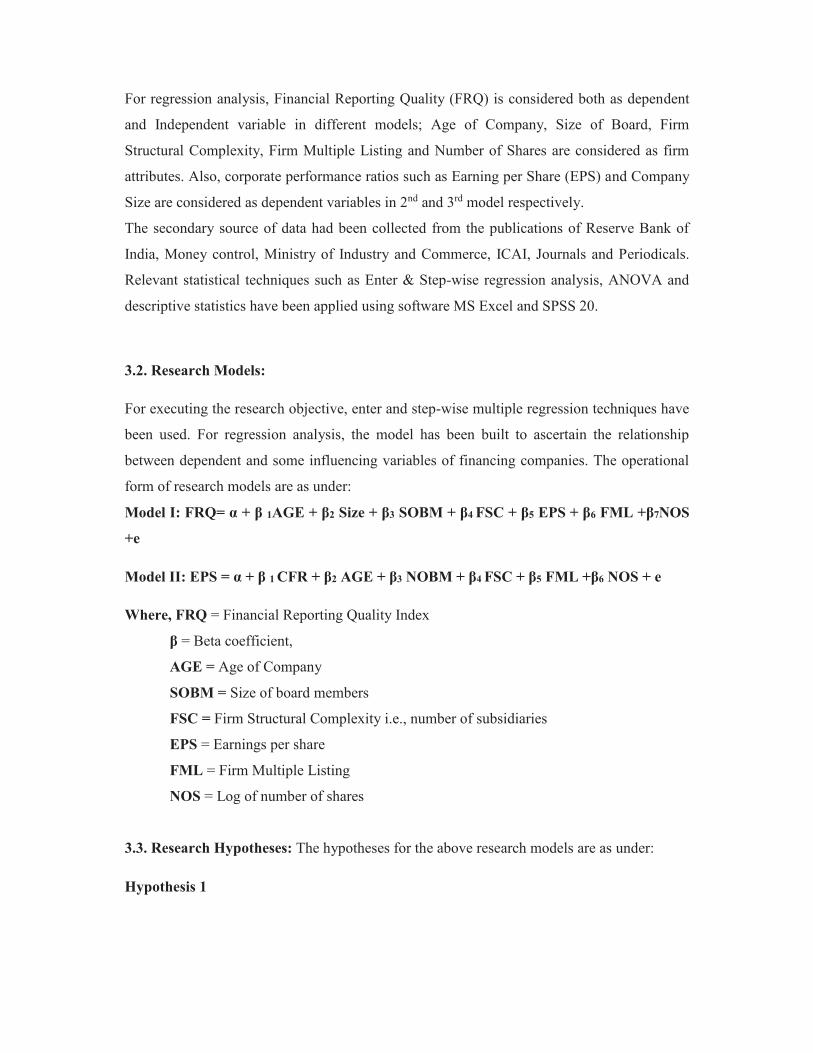
For regression analysis, Financial Reporting Quality (FRQ) is considered both as dependent
and Independent variable in different models; Age of Company, Size of Board, Firm
Structural Complexity, Firm Multiple Listing and Number of Shares are considered as firm
attributes. Also, corporate performance ratios such as Earning per Share (EPS) and Company
Size are considered as dependent variables in 2nd and 3rd model respectively.
The secondary source of data had been collected from the publications of Reserve Bank of
India, Money control, Ministry of Industry and Commerce, ICAI, Journals and Periodicals.
Relevant statistical techniques such as Enter & Step-wise regression analysis, ANOVA and
descriptive statistics have been applied using software MS Excel and SPSS 20.
3.2. Research Models:
For executing the research objective, enter and step-wise multiple regression techniques have
been used. For regression analysis, the model has been built to ascertain the relationship
between dependent and some influencing variables of financing companies. The operational
form of research models are as under:
Model I: FRQ= α + β 1AGE + β2 Size + β3 SOBM + β4 FSC + β5 EPS + β6 FML +β7NOS
+e
Model II: EPS = α + β 1 CFR + β2 AGE + β3 NOBM + β4 FSC + β5 FML +β6 NOS + e
Where, FRQ = Financial Reporting Quality Index
β = Beta coefficient,
AGE = Age of Company
SOBM = Size of board members
FSC = Firm Structural Complexity i.e., number of subsidiaries
EPS = Earnings per share
FML = Firm Multiple Listing
NOS = Log of number of shares
3.3. Research Hypotheses: The hypotheses for the above research models are as under:
Hypothesis 1
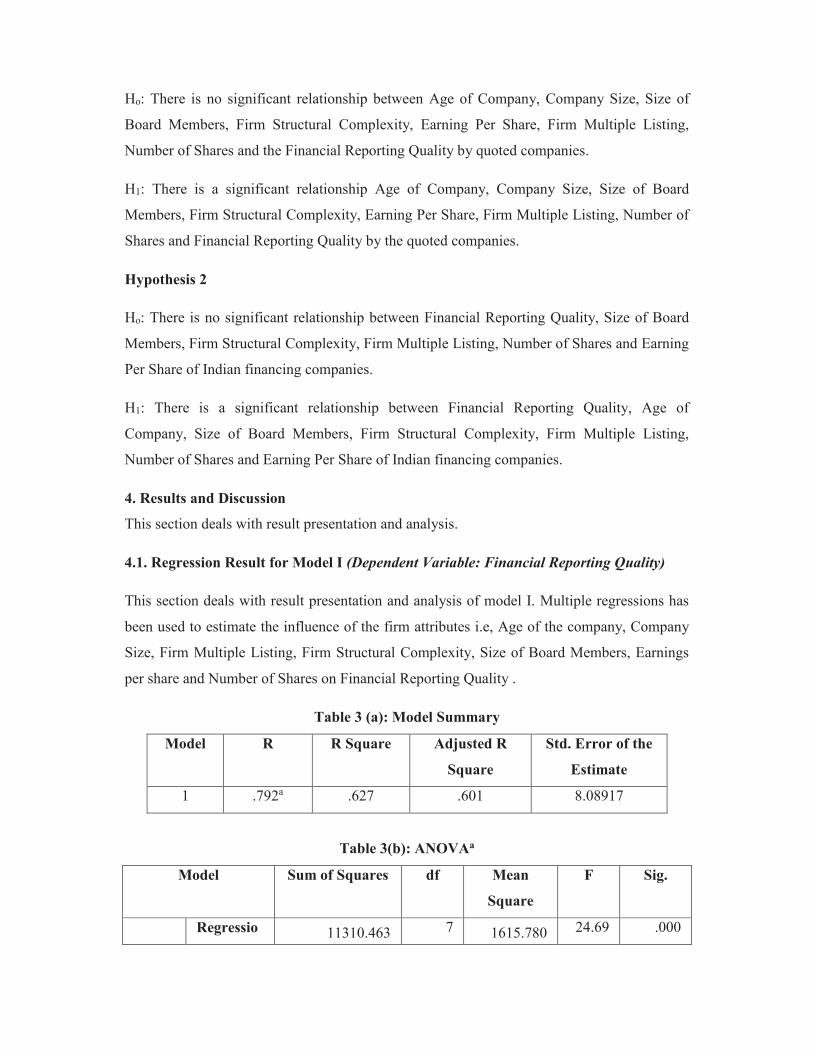
Ho: There is no significant relationship between Age of Company, Company Size, Size of
Board Members, Firm Structural Complexity, Earning Per Share, Firm Multiple Listing,
Number of Shares and the Financial Reporting Quality by quoted companies.
H1: There is a significant relationship Age of Company, Company Size, Size of Board
Members, Firm Structural Complexity, Earning Per Share, Firm Multiple Listing, Number of
Shares and Financial Reporting Quality by the quoted companies.
Hypothesis 2
Ho: There is no significant relationship between Financial Reporting Quality, Size of Board
Members, Firm Structural Complexity, Firm Multiple Listing, Number of Shares and Earning
Per Share of Indian financing companies.
H1: There is a significant relationship between Financial Reporting Quality, Age of
Company, Size of Board Members, Firm Structural Complexity, Firm Multiple Listing,
Number of Shares and Earning Per Share of Indian financing companies.
4. Results and Discussion
This section deals with result presentation and analysis.
4.1. Regression Result for Model I (Dependent Variable: Financial Reporting Quality)
This section deals with result presentation and analysis of model I. Multiple regressions has
been used to estimate the influence of the firm attributes i.e, Age of the company, Company
Size, Firm Multiple Listing, Firm Structural Complexity, Size of Board Members, Earnings
per share and Number of Shares on Financial Reporting Quality .
Table 3 (a): Model Summary
Model R R Square Adjusted R
Square
Std. Error of the
Estimate
1 .792a .627 .601 8.08917
Table 3(b): ANOVAa
Model Sum of Squares df Mean
Square
F Sig.
Regressio 11310.463 7 1615.780 24.69 .000

1 n 3
Residual 6739.767 104 65.435
Total 18050.230 111
Table 3(c): Coefficients
Model I
Unstandardized Standardized
t
Sig. B Std.
Error
Beta
(Constant) 62.779 3.571 17.57
9
.000
Age of the company -.122 .059 -.129 -2.068 .041
of Company 2.956 .976 .296 3.030 .003
Size of Board Members 1.239 .445 .229 2.783 .006
Firm Structural
Complexity
.191 .113 .122 1.684 .095
Earnings per share .136 .059 .179 2.308 .023
Firm Multiple Listing 1.609 .969 .109 1.660 .100
Log of Number of
Shares
2.008 .596 .211 3.371 .001
In regression analysis, R Square is commonly used to measure the regression model and
known as coefficient of determination. In the above model, Ajusted R square is .601 which
shows that 60.1% variance of Financial Reporting Quality has been explained by firm
attributes. The standard error comes out to be 8.1392 which is slightly high and it conveys
that the deviation from the mean is also not low. But, the relation between the variables is
found to be true and highly significant at the p < .05. Also, it is found that there is positive
and highly significant effect of age of company, company size, size of board members and
number of shares on Financial Reporting Quality in Indian Financing Companies (Singvi and
Desai, 1971; Buzby, 1975; Firth, 1979; Chow and Wong-Boren, 1987; Wallace and
Naser,1995; Cooke, 1989; Wallace et al, 1994; Raffournier, 1995, Inchausti, 1997, Owusu-
Ansah, 1998; Ferguson et al., 2002). While, no such relation is found with firm structural
complexity and firm multiple listing in context of Indian Financing Companies.
4.2. Regression Results for Model II (Dependent variable: EPS)
This section deals with result presentation and analysis of model 2. A stepwise multiple
regressions were conducted to evaluate whether Financial Reporting Quality and firm

attributes were necessary to predict Earning per Share as Corporate Performance. Age of the
company, log of Total Assets, Firm Multiple Listing, Firm Structural Complexity and Size of
Board Members are measured as firm attributes for the analysis:
Table 4 (a): Model Summary (Step-Wise Regression)
Model R R Square Adjusted
R Square
Std.
Error
R Square
Change
F
Change
df1 df2 Sig. F
Chan
ge
2.1 .565a .319 .313 13.939
17
.319 51.134 1 109 .000
2.2 .590b .348 .336 13.709
14
.028 4.689 1 108 .033
2.3 .610c .372 .354 13.516
25
.024 4.105 1 107 .045
2.4 .630d .396 .374 13.311
62
.025 4.315 1 106 .040
Table 4 (a) shows the combined correlation of independent variables and dependent variables
at
56.5%, 59%, 61% and 63% respectively in step wise regression analysis. It indicating
moderate & positive relationship and coefficient of determination of 31.9%, 34.8%, 37.2% &
39.6% respectively indicates a weak explanatory power of Financial Reporting Quality, Firm
Structural Complexity, Firm Multiple Listing and Age of the company over the predictability
of EPS. It means that there are some other variables that predict the corporate performance
much better when considered as EPS. In addition, the Fishers statistics of significant change
in step-wise analysis indicates model II is a good fit. Therefore, the model indicates that the
Financial Reporting Quality of quoted financing firms in India has positive influence in
performance of company.
4.CONCLUSION
Financial Reporting is a process through which an undertaking communicates with especially
external parties. Information about corporate activities is essential for investors and other
users in order to reach appropriate decisions. The present research is an extension of previous
research in the Indian context of Financing Companies where a set of variables is considered
to examine their association with the quality of financial reporting. It was pointed out that
Indian financing Industry compliance with high level of Financial Reporting Quality (FRQ).

Furthermore, it was noted that the relation between the firms attributes and FRQ are found to
be true and highly significant at the p < .05. It is also highlighted that there is significant
effect of age of company, company size, size of board members and number of shares on
Financial Reporting Quality in Indian Financing Companies; while, no such relation is found
with firm structural complexity and firm multiple listing. In addition, a stepwise multiple
regressions were conducted to evaluate whether Financial Reporting Quality and firm
attributes were necessary to predict Earning per Share as Corporate Performance. The Fishers
statistics of significant change in step-wise analysis indicates model II is a good fit.
Therefore, the model II reveals that the Financial Reporting Quality of quoted financing firms
in India has positive influence in performance of the company. It is therefore, recommended
that the company should report reliable and error free information based on prevailing
standards to ensure higher quality of financial reporting.
REFERENCES
v Al-Shammari, B. (2008). Voluntary disclosure in Kuwait corporate annual reports.
Review of Business Research, 1, 10−30.
v Akhtaruddin, M. (2005). Corporate mandatory disclosure practices in Bangladesh.
International Journal of Accounting, 40, 399-422.
v Barako, D.G. et. al. (2006). Relationship between corporate governance attributes and
voluntary disclosures in annual reports: The Kenyan experience. Financial Reporting,
Regulation and Governance, 5(1), 1-26.
v Berle, A. A., & Means, G. G. C. (1991). The modern corporation and private
property. Transaction publishers.
v Brickley, J. A., & James, C. M. (1987). The takeover market, corporate board
composition, and ownership structure: The case of banking. Journal of Law and
Economics, 161-180.
v Bujaki, M., & McConomy, B. J. (2002). Corporate governance: Factors influencing
voluntary disclosure by publicly traded Canadian firms. Accounting Perspectives,
1(2), 105.
v Cerf, A. R. (1961). Corporate Reporting and Investment Decisions, University of
California, Berkley Press, 1961.
v Chau, G. K. and Gray, S. J. (2002). Ownership Structure and Corporate Voluntary
Disclosure in Hong Kong and Singapore. The International Journal of Accounting,
37(2), 247–265.
v Collett, P. & Hrasky, S. (2005). Voluntary disclosure of corporate governance
practices by listed Australian companies. Corporate Governance: An International
Review, 13(2), 188-196.
v Courtis, J. K. (1978). Modelling a financial ratios categoric framework. Journal of
Business Finance & Accounting, 5(4), 371-386.
v Cheng, E. C., & Courtenay, S. M. (2006). Board composition, regulatory regime and
voluntary disclosure. The international journal of accounting, 41(3), 262-289.
v Fama, E. F. & Jensen, M.C. (1983). Agency Problems and Residual Claims. Journal
of Law and Economics, 26(2), 327-349.
v Glaum, M. and Street, D. (2003).Compliance with the disclosure requirement of
German’s new market, IAS Versus US GAAP. Journal of International Financial
Management and Accounting, 14(1), 64-100.
v Hermalin, B. E. & Weisbach, M. S. (1988). The determinants of board composition.
The RAND Journal of Economics, 589-606.
v Haniffa, R. M. & Cooke, T. E. (2002). Culture, corporate governance and disclosure
in Malaysian corporations. Abacus, 38(3): 317-349. Review, 6(1), 45-68.
v Ho, S. and Wong, K. 2001. A Study of Corporate Disclosure Practice and
Effectiveness in Hong Kong. Journal of International Financial Management and
Accounting, 12, 75-102.
v Inchausti, B.G. (1997). The influence of company characteristics and accounting
regulation on information disclosed by Spanish firms. The European Accounting
Review, 6(1), 45-68.
v Jenson, M.C and Meckling, W. H. (1976). Theory of the firm: managerial behavior,
agency costs and ownership structure. Journal of Financial Economics, 3 (4), 305-
360.
v Jonas, G. & Blanchet, J. (2000). Assessing Quality of Financial Reporting, Journal of
Accounting Horizons, 14(3), 353-363.
v Kakani, R. K. et. al. (2001). Determinants of financial performance of Indian
corporate sector in the post liberalization era: an exploratory study. NSE Research
Initiative Paper, 5, 1-38.

v Lang, M. H. and Lundholm, R. J. (1993). Cross-sectional Determinants of Analyst
Ratings of Corporate Disclosures. Journal of Accounting Research, Vol. 3(1), pp.
246-271.
v Mangel, R., & Singh, H. (1993). Ownership structure, board relationships and CEO
compensation in large US corporations. Accounting and Business Research, 23(sup1),
339-350.
v Malone, D. et. al. (1993). An empirical investigation of the extent of corporate
financial disclosure in the oil and gas industry. Journal of Accounting, Auditing &
Finance, 8(3), 249-273.
v Meek G.K., et. al. (1995). Factors Influencing Voluntary Annual Report Disclosures
by US, UK and Continental European Multinational Corporations. Journal of
International Business Studies, 26(3), 555-572.
v Naser, et. al. (2006). Determinants of corporate social disclosure in developing
countries: The case of Qatar. Advances in International Accounting, 19: 1-23.
v Ofoegbu, G. and E. Okoye (2006). The relevance of accounting and auditing
Standards in corporate financial reporting in Nigeria: Emphasis on compliance. The
Nigerian Accountant, 39 (4), 45-53.
v Owusu-Ansah, S. (1998). The impact of corporate attributes on the extent of
mandatory disclosure and reporting by listed companies in Zimbabwe. The
International Journal of Accounting, 33(5), 605-631.
v Patelli, L. & Prencipe, A. (2007). The relationship between voluntary disclosure and
independent directors in the presence of a dominant shareholder. European
Accounting Review, 16(1), 5-33.
v Patton, J., & Zelenka, I. (1997). An empirical analysis of the determinants of the
extent of disclosure in annual reports of joint stock companies in the Czech Republic.
European Accounting Review, 6(4), 605-626.
v Pearce, J. A., & Zahra, S. A. (1992). Board composition from a strategic contingency
perspective. Journal of management studies, 29(4), 411-438.
v Singhvi, S. S. & Desai, H.B. (1971). An empirical analysis of the quality of corporate
financial disclosure. The Accounting Review, 46(1), 120-138.
v Sejjaaka, S. (2003). Corporate Mandatory Disclosure by Financial Institutions in
Uganda. Accounting and Corporate Financial Management in Emerging Markets
Research in Accounting in Emerging Economies, 24, 123–148.
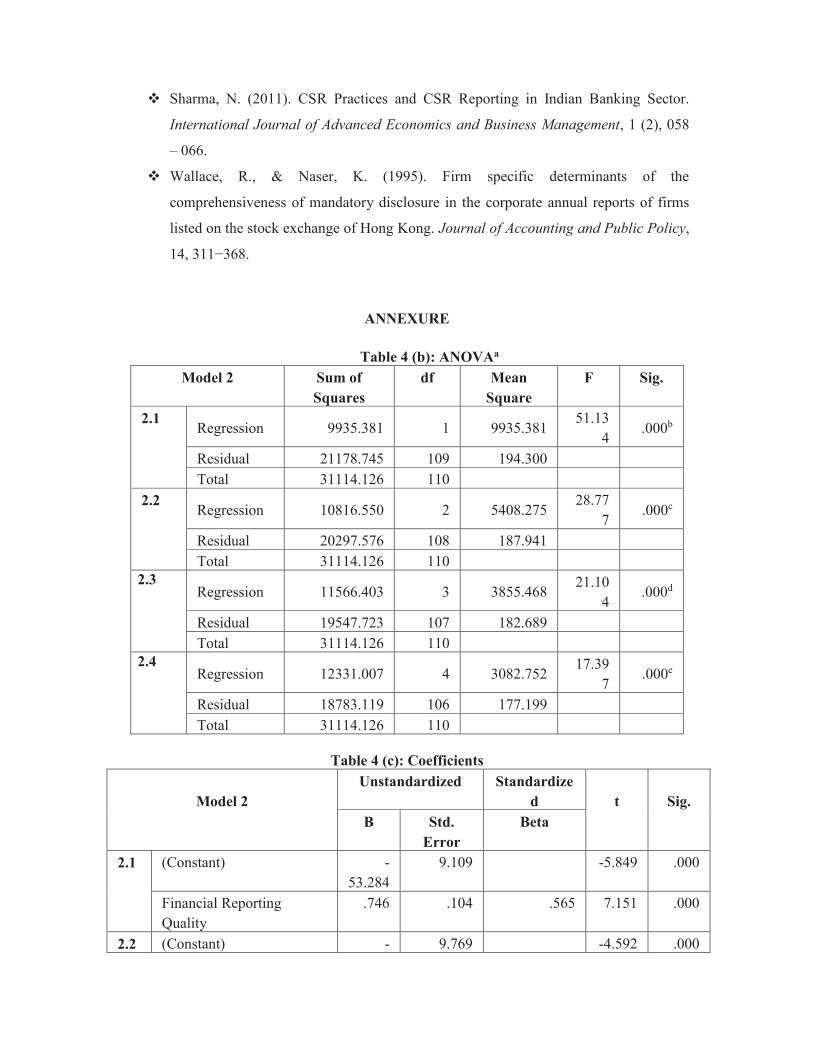
v Sharma, N. (2011). CSR Practices and CSR Reporting in Indian Banking Sector.
International Journal of Advanced Economics and Business Management, 1 (2), 058
– 066.
v Wallace, R., & Naser, K. (1995). Firm specific determinants of the
comprehensiveness of mandatory disclosure in the corporate annual reports of firms
listed on the stock exchange of Hong Kong. Journal of Accounting and Public Policy,
14, 311−368.
ANNEXURE
Table 4 (b): ANOVAa
Model 2 Sum of
Squares
df Mean
Square
F Sig.
2.1 Regression 9935.381 1 9935.381
51.13
4 .000b
Residual 21178.745 109 194.300
Total 31114.126 110
2.2 Regression 10816.550 2 5408.275
28.77
7 .000c
Residual 20297.576 108 187.941
Total 31114.126 110
2.3 Regression 11566.403 3 3855.468
21.10
4 .000d
Residual 19547.723 107 182.689
Total 31114.126 110
2.4 Regression 12331.007 4 3082.752
17.39
7 .000e
Residual 18783.119 106 177.199
Total 31114.126 110
Table 4 (c): Coefficients
Model 2
Unstandardized Standardize
d
t
Sig.
B Std.
Error
Beta
2.1 (Constant) -
53.284
9.109 -5.849 .000
Financial Reporting
Quality
.746 .104 .565 7.151 .000
2.2 (Constant) - 9.769 -4.592 .000
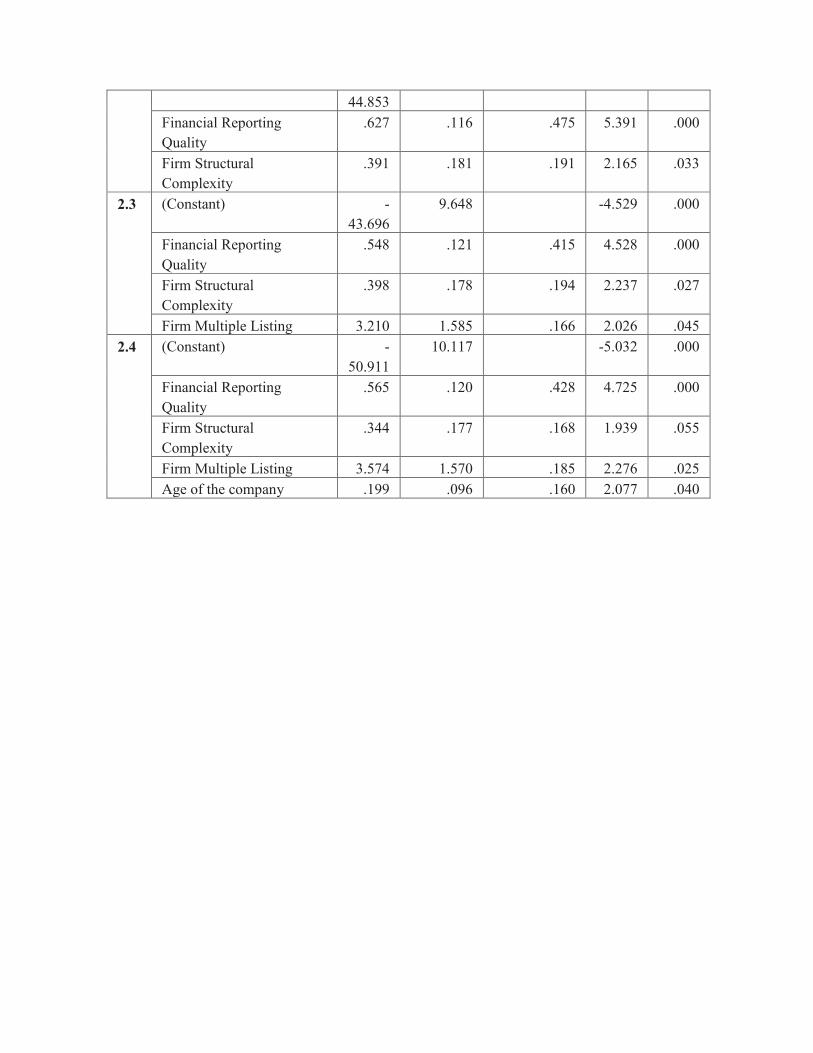
44.853
Financial Reporting
Quality
.627 .116 .475 5.391 .000
Firm Structural
Complexity
.391 .181 .191 2.165 .033
2.3 (Constant) -
43.696
9.648 -4.529 .000
Financial Reporting
Quality
.548 .121 .415 4.528 .000
Firm Structural
Complexity
.398 .178 .194 2.237 .027
Firm Multiple Listing 3.210 1.585 .166 2.026 .045
2.4 (Constant) -
50.911
10.117 -5.032 .000
Financial Reporting
Quality
.565 .120 .428 4.725 .000
Firm Structural
Complexity
.344 .177 .168 1.939 .055
Firm Multiple Listing 3.574 1.570 .185 2.276 .025
Age of the company .199 .096 .160 2.077 .040

INFRASTRUCTURE DEVELOPMENT AND ITS IMPACT ON STANDARD OF
LIVING
By
Pragati Choudhary
Reserch Scholar, Barkahtullah University
Bhopal (M.P.)
Dr.Pavan Mishra
Professor ,Department of Commerce
Barkahtullah University ,Bhopal (M.P.)
ABSTRACT
India is a developing nation. Economic development in India is not possible if a proper
consideration is not given to Infrastructure. As Infrastructure sector is a key driver for the
Indian economy as it is the highly responsible for propelling India’s overall development and
enjoys intense focus from Government for initiating policies that would ensure time-bound
creation of world class infrastructure in the country. The objective of this paper is to examine
change in infrastructure help in setting high standard of living and what could be the factors
driving that change.
Key words: Infrastructure, Standard of Living, Factors Affecting Standard of Living.
INTRODUCTION
Infrastructure sector is a key driver for the Indian economy as it is the highly responsible for
propelling India’s overall development and enjoys intense focus from Government for
initiating policies that would ensure time-bound creation of world class infrastructure in the
country. India needs infrastructure. From the moment you set foot in the country, you witness
the ageing roads and railways, the unreliable power and the absence of sanitation.
Infrastructure sector includes power, bridges, dams, roads and urban infrastructure
development. The importance of infrastructure for sustained economic development is
important. High transaction costs arising from inadequate and inefficient infrastructure can
prevent the economy from realizing its full growth potential. Physical infrastructure covering
transportation, power and communication through its backward and forward linkages
facilitates growth, social infrastructure including water supply, sanitation, sewage disposal,
education and health, which are in the nature of primary services and has a direct impact on
the quality of life.
STANDARD OF LIVING refers to quality and quantity of goods and service available to
people and the way in which these goods and services are distributed among population.
Infrastructure industries are measured by six key infrastructure and core industries (i.e.,
electricity, crude oil, petroleum refinery products, coal, steel and cement).
Telecommunications, power, ports, railways, civil aviation, and post
REVIEW OF LIREATURE
Rajarshi Majumder (2014) the study was initiated with the objective of analyzing different
aspects of infrastructure and economic development with special focus on India. It was
observed that there has been an impressive growth and expansion of infrastructure in India
during the 1971-95 periods the slowing down of both Plan expenditure on those
infrastructural sectors and the rate of progress in recent years development levels but with
certain time lag. Infrastructural sectors are suffering from a common problem that of
Financing
Sriram C Kumar (2012). Scarcity of available funds for investment and competing priorities
present challenges to all governments in infrastructure planning and delivery. New
infrastructure must not only support social and economic goals, it must also do so within
acceptable environmental parameters Financing the Infrastructure is what the key important
factor to achieve overall economic growth of a country which will generate not only direct
employment but also generates huge indirect employment increasing private sector
participation
V B Hans (2007) Strong linkages between infrastructural facilities and income generation of
the people utilizing the services of infrastructure, which has led to their socio-economic
development over the years. Strongest linkage was observed between education infrastructure
and economic development, in the study education is a vital component of human and social
capital we infer that its development in turn can influence other factors and forces of
development in the rural areas. Time, money and space (distance) are posing challenges to
users of infrastructural services.
OBJECTIVE OF STUDY
v To study infrastructure development and its impact on standard of living.
v To study that government is helping in setting high standard through smart city mission
v To study technological change its impact on standard of living
v To find out main reason for low standard of living
v To find out steps that would help in raising standard of living
METHOLOGY OF STUDY
The research design adopted for the study will be descriptive in nature. The study covers an
area of Bhopal. Primary data is collected by personal administered questionnaire which is
collected by respondents. Secondary data is collected by different sources like books,
published research articles, journals and web sites.

ANAYLAYSIS AND RESULT:
The sample of people is distributed more towards yes 57.5% and 20% towards some extent
That means change in infrastructure helps in setting high standards as because standard of
living depicts country is developed or it is in developing as in developed country
infrastructure is not a major problem in developed country than in developing one.13%said
no and 10% were not able to comment on it.
People think change in infrastructure help in setting high
standard
Percentage
YES 46 57.5%
CANT SAY 8 10%
NO 10 12.5%
TO SOME
EXTENT
16 20%
57%
10%
13%
20%
Change in infrastructure help in setting high
standard
YES CANT SAY NO TO SOME EXTENT
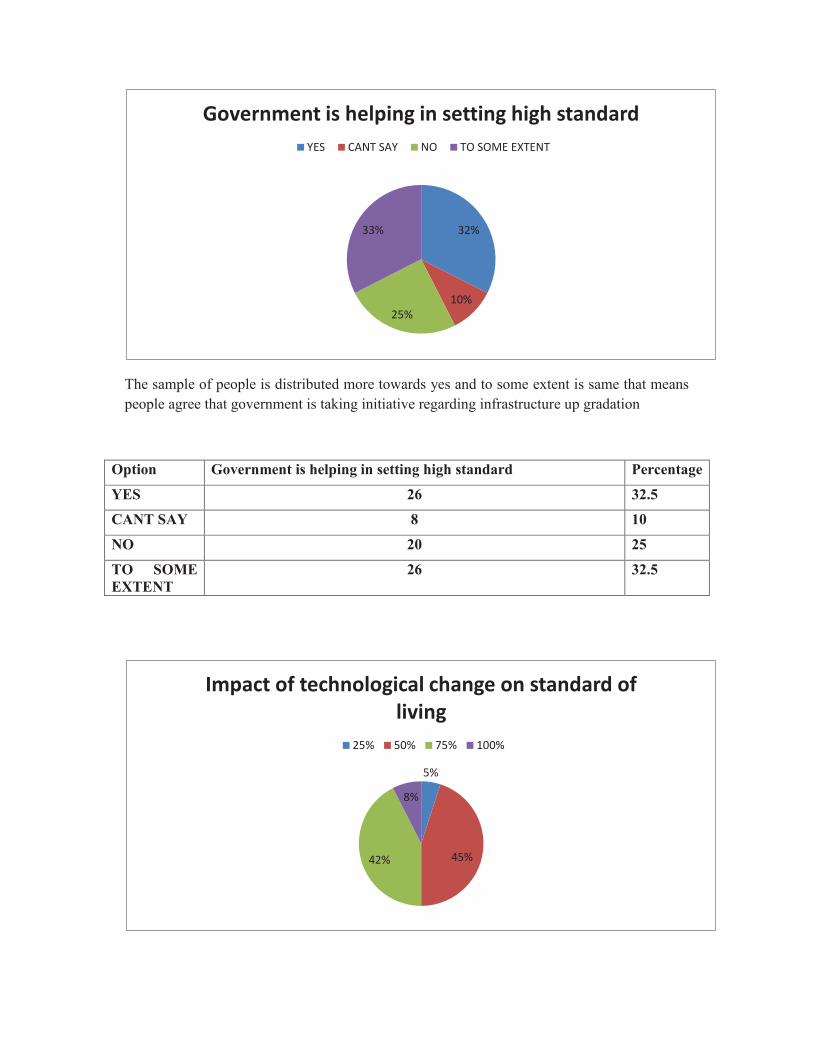
The sample of people is distributed more towards yes and to some extent is same that means
people agree that government is taking initiative regarding infrastructure up gradation
Option Government is helping in setting high standard Percentage
YES 26 32.5
CANT SAY 8 10
NO 20 25
TO SOME
EXTENT
26 32.5
32%
10%
25%
33%
Government is helping in setting high standard
YES CANT SAY NO TO SOME EXTENT
5%
45%42%
8%
Impact of technological change on standard of
living
25% 50% 75% 100%

The sample of people is distributed more towards ( up to 50 percent) dependence on
technology in view of standard of living is45%where as ( up to 75percent) dependence on
technology in view of standard of living is42%
Option Impact of technological change on standard of living Percentage
upto25% 4 5%
upto50% 36 45%
upto75% 34 42.5%
upto100% 6 7.5%
The sample of people think that population increase (40%) is the main reason for low
standard of living where as education level comes second and per capita income comes third
in a row usually branding is followed by high class which all have a Bad effect on economy
Option MAIN REASON OF LOW STANDARD OF
LIVING
Percentage
LACK OF EDUCATION 24 30%
POPULATION
INCRESE
32 40%
LOW PER CAPITA
INCOME
22 27.50%
LARGE PERCETAGE
OF ILLNESS
2 2.50%
24
32
22
2
MAIN REASON OF LOW STANDARD OF LIVING
LACK OF EDUCATION
POPULATION INCRESE
LOW PER CAPITA INCOME
LARGE PERCETAGE OF ILLNESS

Option FACTORS NEED TO EMPHASIS ON TO RAISE
STANDARD OF LIVING
Percentage
EDUCATION 26 32.50%
POPULATION
CONTROL
20 25%
EMPLYOMENT 30 37.50%
TRADE AND
COMMERCE
4 5%
The sample of people thinks that employment is key driven factor for raising standard of
living. Employment opportunity should be raised in public sector and Enhancement in private
sector should be done. Followed by education on next level. Population control measures
should be used. Less burden of taxes should be introduce in trade and commerce
CONCLUSION
In respondents view basic needs fulfilment with comforts in life accomplices standard of
living The main problem of low standard of living in India is unemployment and poor
education facility, increase in population, increase gap between rich and poor, all these have
an impact on standard of living as in one of the view of respondent “world is changing
globally if a neighboring country has a luxury car why we leave behind to drive it” India is a
country where people live with brotherhood that tradition should be continued but some
Population control, education for all, removal of corruption employment
programmes,awareness camps, reduce heavy taxes should be eradicated
The core infrastructure elements must include
• Affordable housing, especially for the poor
• Safety and security of citizens
• Sustainable environment
• Adequate water, electricity supply
32%
25%
38%
5%
FACTORS NEED TO EMPHASIS ON TO RAISE
STANDARD OF LIVING
EDUCATION POPULATION CONTROL EMPLYOMENT TRADE AND COMMERCE
• Sanitation, including solid waste management
• Efficient urban mobility and public transport
• Good governance, especially e-Governance
• Citizen participation
• Robust IT connectivity and digitalization
Core infrastructure facility gives a decent quality of life to its citizens, a clean and sustainable
environment. The performance of infrastructure is largely a reflection of the performance of
the economy.
REFERENCES
Majumder, Rajarshi. (2014), “Infrastructure and economic development: a regional
analysis” Jawaharlal Nehru University, http://hdl.handle.net/10603/21136.
Kumar. Sriram, (2012),” Infrastructure growth role of listed companies in India” Sri
Krishnadevaraya Institute of Management http://hdl.handle.net/10603/63346
Hans, V B, (2007),” Infrastructure for rural development a comparative study in Dakshina
Kannada district” Mangalore University, http://hdl.handle.net/10603/97520.
https://www.weforum.org/agenda/2014/11/five-ways-india-can-overcome-infrastructure-
challenges/
https://india.gov.in/spotlight/smart-cities-mission-step-towards-smart-india
http://mls.sagepub.com/content/32/3/347.short
https://en.wikipedia.org/wiki/Economic_development_in_India
http://www.ibef.org/industry/infrastructure-sector-india.aspx
http://www.dnb.co.in/India2020economyoutlook/growth_drivers.asp

ROLE OF MOBILE PHONES AND INTERNET TECHNOLOGIES IN FINANCIAL
SERVICES IN MADHYA PRADESH
Dr.Brijesh Upadhyay * Shivshankar Vishwakarma **
ABSTRACT
Present research paper is a part of the PhD research study entitled “Role of information Technology in
Financial Inclusion in Madhya Pradesh.” This paper highlights the importance of mobile phones and
internet technologies playing key role in rendering and having banking services. For this purpose data
has been collected both from primary as well as secondary sources. Primary data is gathered from
among the population of Madhya Pradesh State, whereas secondary data is taken from Government
reports, RBI reports, journals, books, newspapers etc. The variables taken are demographics (age,
gender and occupation), mobile phone accessibility, level of awareness of mobile banking, IT-enabled
banking services. Data is gathered randomly with the help of well structured schedules by
interviewing the respondents. Analysis is carried out with the help of MS-Excel 2007 and SPSS 16.0
softwares. The results demonstrated that mobile phones and internet assist in rendering banking
services making it more convenient.
Keywords: Mobile banking, information technology, IT-enabled banking, financial services,
internet.
1. INTRODUCTION: As per the definition of the Reserve Bank of India (2005), “Financial
Inclusion” is “a process of ensuring access to appropriate financial products and services
needed by all sections of the society in general and vulnerable groups such as weaker sections
and low income groups in particular, at an affordable cost in a fair and transparent manner by
regulated mainstream institutional players”.
The state of Madhya Pradesh has demonstrated an outstanding growth including those who
were financial excluded. It is quite important to name to milestone policies planned and well-
executed by the Governments i.e. PMJDY and Samridhi. The former is ventured by the
Government of India while the later by the Government of Madhya Pradesh. PMJDY
reported that the state has demonstrated almost 100% of financial inclusion. To talk about the
statistics with reference to the said report, rural part has 10942255 and the urban part has
11291452 accounts making a total of 2223370 accounts making a record in Madhya Pradesh
state.
Moving from financial world to social life, homo sapiens have been riding high and high with
the help of technology. This time is synonymously known as ‘information age’ so the
services are also being rendered in a information technology-enabled way. Now-a-days
mobile phones have become an essential information and communication device for every
individual.
Financial institutions are also harnessing this mobile phone revolution by facilitating their
customers electronically with quick services. Mobile banking removes space and time
limitations from banking activities. Today, most of the banks are using mobile banking as an
additional channel apart from retail banking, ATM, online banking etc. The transformational
model attempts to attract the unbanked segments by using the existing infrastructure like
telecommunication and business correspondent /business facilitator. The main reason that
Mobile Banking scores over other form of banking is that it enables ‘Anywhere Anytime
Banking'.
2. REVIEW OF LITERATURE
Various magazine articles, books and research journals are referred for getting the problem
understand in a fuller form. Although conclusions of some remarkable studies are mentioned
below yet these are not exhaustible:
Malviya, Surendra (2016) stated that mobile banking is a generic term for delivery of banking
services and products through telecommunication and electronic channels, such as internet,
cell phone, smart phones etc. The concept and scope of Mobile banking is still evolving. It
facilitates with an effective payment and accounting system thereby enhancing the speed of
delivery of banking services considerably. With the rapid growth of mobile phone users in
India, banks have a cost effective channel for providing most popular mobile banking
services such as balance checks, account transactions, cheque status, setting alerts, payment
reminders, accessing mini statement, placing orders for cheque books, etc. As the adoption of
mobile banking is increased across the globe, India is contributing as fifth worldwide. Thus it
can be concluded that with the new innovation like mobile banking, we can say that through
banks can provide its services to every users who is having smart phone and can help the
government of India to reach to maximum unbanked customers. Singh, Ardhendu Shekhar et
al. (2014) Importance of financial inclusion has been emphasized by every stakeholder, and
mobile banking shows a potential in helping to achieve this. But, there are various issues,
which come in the way of accomplishing the task. Adoption of technology has got its own
share of difficulty to overcome along with the issues of financial inclusion. They tried to
resolve it by proposing a tripartite model involving banks, post offices, and mobile operators/
BCs by building on their individual strengths and overcoming the hindrances. However,
security and regulatory issues need to be addressed. Singh, Charan (2014) said that common
mobile banking applications with minimal usage of text should be developed leveraging

channels such as SMS or GPRS. These applications should be self-explanatory and should
incorporate image-based interactive user interface, as well as higher usage of voice based
commands. Consumers and Mobile Financial Services (2016) a company stated in its report
that the main factors limiting consumer adoption of mobile banking and payments were a
preference for using other methods for banking or making payments and security concerns. In
terms of the value proposition to consumers, the significant number of mobile users who
reported an interest in using their phones to receive discounts, coupons, and promotions or to
track rewards and loyalty points suggests that tying these services to a mobile payment
service may increase the attractiveness of mobile phones as a means of payment.
3. OBJECTIVES OF THE STUDY
1. To find the current status of mobile phone accessibility in Madhya Pradesh.
2. To study the awareness of mobile banking facility in Madhya Pradesh.
3. To find the awareness of information technology enabled banking services in Madhya
Pradesh.
4. METHODOLOGY OF THE STUDY
The area of study is Madhya Pradesh state which is one of states of India. Secondary data has
been collected through sources such as, RBI bulletin, annual reports of RBI, Ministry of
Finance, Govt. of India, journals, newspapers and websites. Primary data is gathered from
among the respondents who are the residents of Madhya Pradesh state. For this purpose a
well-structured schedule is used as tool and random sampling as technique to collect the data.
The method of face to face interviewing is applied for getting responses. The targetted
sample size was 500 numbers but on scrutinizing the filled in schedules, 494 numbers of
schedules were found appropriate for further analysis.
5. DATA ANALYSIS:
Data so collected is filled in MS-Excel worksheet as well as SPSS software for statistical
analysis. The same is detailed below:
5.1 Demography of Respondents:
5.1.1 Age:

The age distribution of the respondents is given in the table 1. For this purpose
different age groups are constructed named as; Less then 20 yrs, 20-29 yrs, 30-39 yrs, 40-49
yrs, 50-59 yrs, and 60 yrs and above. It is found that highest distribution is observed for the
age group of 20-29 yrs with 32.79%, followed by the age group 40-49 yrs with 27.94% and
30 to 39 yrs with 24.09%. The age groups 50 to 59 yrs and 60 yrs and above are observed
with a frequency distribution of 10.53% and 2.43% respectively. The distribution of the age
group less than 20 yrs is observed least with a distribution of 2.23% only.
Table.1: Frequency Distribution of Age of
Respondent (in complete years)
Age group ( in complete
years) Frequency Percent
20 to 29 162 32.79
40 to 49 138 27.94
30 to 39 119 24.09
50 to 59 52 10.53
60 and above 12 2.43
Less then 20 11 2.23
Total= 494 100
5.1.2 Gender:
Gender is an important variable which show our social condition and so the variable
gender is taken and analysed in the study. This variable is classified into male and female.
Data related to gender of the respondents is presented in the Table 2 further.
Table 2: Frequency Distribution of Gender of
Respondents
Gender Frequency Percent
Male 389 78.7
Female 105 21.3
Total= 494 100

It is fairly clear that out of the total respondents examined for this study, majority is observed
for male with 78.7% whereas female are observed with 21.3%.
5.1.3 Occupation/ source of household income:
The variable named as occupation of the respondent/ source of household
income is also considered for study. The categories for identifying occupation are named as,
government service, private job, labourer, self employed, agriculture, and other (specify). The
data is analyzed by conducting multiple response frequency distributions because the
respondents were having more then one source of income. The distribution of the samples
with regard to occupation of the respondents is displayed in the table 3 given further.
Table 3: Multi-response frequency of Occupation of the
Respondent/Source of Income of the house hold
Respondents
categories
Responses Percent
of Cases Count Percent
Private job 148 29.54 30.08
Agriculture 113 22.55 22.97
Govt. service 108 21.56 21.95
Labourer 69 13.77 14.02
Other 32 6.39 6.5
Self Employed 31 6.19 6.3
Total= 501 100 101.83
It is observed that of the total count of 501 responses, 29.54% goes with private
service included in 30.8% of Cases followed by agriculture with 22.55% and in 22.97% of
cases. Govt. service is observed as occupation of the respondents with 21.56% in 21.95% of
cases whereas labourer with 13.77% in 14.02% of cases. Self employed is found with 6.19%
in 6.50% of cases. The category found with least distribution is other with 6.39% and in
6.50% of cases.
5.2 Mobile phone Accessibility:
Data is also collected for the respondents who possess mobile phone this ensures
accessibility of the same. The question was dichotomous with the answers as yes and no. On
analyzing the samples, it is observed that 92.5% of the respondents chose the answer as yes
while rest of the 7.5% as ‘no’. Data is displayed in the table 4 which is given below:

Table 4: Accessibility to mobile phone
Mobile phone
possessed/ accessible Frequency Percent
Yes 457 92.51
No 37 7.49
Total= 494 100
5.3 Level of Awareness of Mobile banking:
The respondents’ level of awareness of mobile banking is also analyzed. For this
purpose Likert Scale (five points) is used with response options as, highly aware, fairly
aware, neutral, poorly aware and negligible. The respondents’ level of awareness of mobile
banking is recorded as per the information collected from respondents. The data of this
variable is displayed in the table 5 given below:
Table 5: Level of Awareness of Mobile banking
Response
variables Frequency Percent
Negligible 270 54.66
Fairly Aware 128 25.91
Poorly Aware 48 9.72
Highly Aware 26 5.26
Neutral 22 4.45
Total= 494 100
It is observed that the majority of respondents, i.e., 54.66% chosen the option as
negligible followed by fairly aware with 25.91%. Next distribution is observed as poorly
aware with 9.72%. The response named as highly aware is observed with 5.26% of
distribution. The lowest distribution is found for the response as neutral with 4.45%.
5.4 Awareness of information technology enabled banking facilities:
For finding the awareness of the banking services that are rendered with the help of
information technology, data is collected. The identified variables regarding IT-enabled
banking facilities are: i) Internet (Net) Banking, ii) Mobile Banking, iii) Mobile wallets, iv)
Internet wallets, v) MICRO ATM, vi) BIOMETRIC ATM, vii) Core Banking Solution(CBS),
viii) RTGS(Real Time Grass Settlement), ix) ECS( Electronic Clearing System), x) EFT
(Electronic Fund Transfer), and xi) None. Due to the nature of the question and probable
answer/s, multiple frequency distribution is found appropriate for analyzing this data. Table
6 given further can be referred for the distribution of samples.
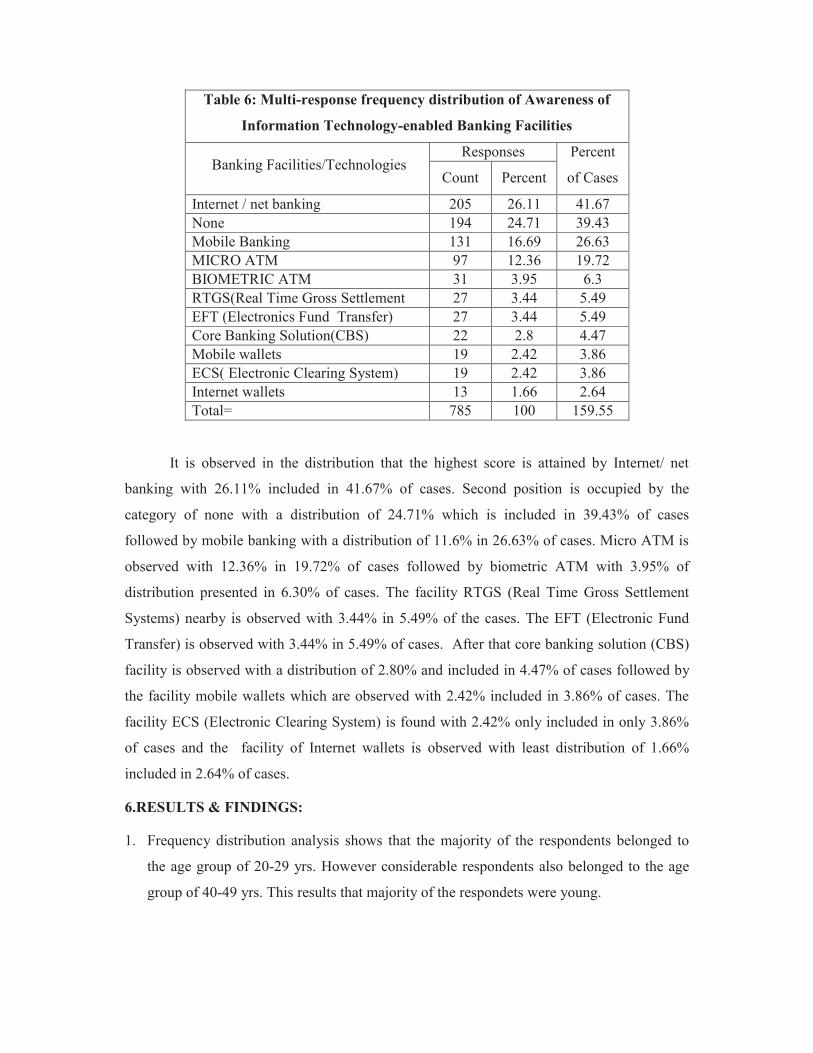
Table 6: Multi-response frequency distribution of Awareness of
Information Technology-enabled Banking Facilities
Banking Facilities/Technologies Responses Percent
of Cases Count Percent
Internet / net banking 205 26.11 41.67
None 194 24.71 39.43
Mobile Banking 131 16.69 26.63
MICRO ATM 97 12.36 19.72
BIOMETRIC ATM 31 3.95 6.3
RTGS(Real Time Gross Settlement 27 3.44 5.49
EFT (Electronics Fund Transfer) 27 3.44 5.49
Core Banking Solution(CBS) 22 2.8 4.47
Mobile wallets 19 2.42 3.86
ECS( Electronic Clearing System) 19 2.42 3.86
Internet wallets 13 1.66 2.64
Total= 785 100 159.55
It is observed in the distribution that the highest score is attained by Internet/ net
banking with 26.11% included in 41.67% of cases. Second position is occupied by the
category of none with a distribution of 24.71% which is included in 39.43% of cases
followed by mobile banking with a distribution of 11.6% in 26.63% of cases. Micro ATM is
observed with 12.36% in 19.72% of cases followed by biometric ATM with 3.95% of
distribution presented in 6.30% of cases. The facility RTGS (Real Time Gross Settlement
Systems) nearby is observed with 3.44% in 5.49% of the cases. The EFT (Electronic Fund
Transfer) is observed with 3.44% in 5.49% of cases. After that core banking solution (CBS)
facility is observed with a distribution of 2.80% and included in 4.47% of cases followed by
the facility mobile wallets which are observed with 2.42% included in 3.86% of cases. The
facility ECS (Electronic Clearing System) is found with 2.42% only included in only 3.86%
of cases and the facility of Internet wallets is observed with least distribution of 1.66%
included in 2.64% of cases.
6.RESULTS & FINDINGS:
1. Frequency distribution analysis shows that the majority of the respondents belonged to
the age group of 20-29 yrs. However considerable respondents also belonged to the age
group of 40-49 yrs. This results that majority of the respondets were young.
2. On conducting frequency distribution, it is found that majority of the respondents were
found as male. Since, Indian society is largely dominated by males hence it is hard to
contact females in households.
3. Statistical analysis of the variable defined as occupation show that majority of the
respondents belonged to private job followed by agriculture. Later government service is
observed in the distribution. This means that the respondents under study largely are
engaged in private jobs however agriculture is chosen as occupation on second position.
4. The statistics regarding awareness of the respondents regarding information technology-
enabled banking facilities was also observed. It is found in multi-response frequency
distribution that majority respondents are aware of internet/ net banking following by the
variable none. However other facilities are also observed in the distribution. This is
because these days young generation is aware of net banking technology.
5. On analyzing awareness of mobile banking on five point Likert scale, it observed that
most of the respondents are negligible about this technology. However second lead is
attained by fairly aware. This could be due the lack of internet and mobile banking
literacy.
7.SUGGESTIONS
Based on the above analysis and findings, followings suggestions and recommendations have
been suggested for the further improvements in the context of role of mobile phones in
financial inclusion in Madhya Pradesh :
The Governments should make policies and further implementation for increasing the
internet technologies so that the people can take advantage of these technologies for mobile
and net banking activities. Secondly, people possessing smartphones with internet facility
should use for banking activities. Business houses should subsidize the rates of
communication services as well as devices like mobiles so that they can penetrate in the
larger market and in return the people and financial institutions will get benefitted. People
will also get rid of visiting the banks each and every time.
8.CONCLUSION
At the end we can conclude that mobile phones are revolutionary instruments that can play a
vital role for rending as well as performing banking services and activities. Every stakeholder
should exploit the information technology and revolution and getting the prompt service
regarding financial business. This will lessen the workload of banks and the Governments.

However online frauds and hacking issues should be aware of. The awareness for the purpose
is required from the authorities end.
REFERENCES
1. Singh, Ardhendu Shekhar et al. (2014), Role of Mobile banking in financial inclusion.
Accessed from https://www.microfinancegateway.org/library/role-mobile-banking-
financial-inclusion
2. https://en.wikipedia.org/wiki/Mobile_phone
3. Cellular telephone (mobile phone). Accessed from
:http://searchmobilecomputing.techtarget.com/definition/cellular-telephone.
4. Dr. Surendra Malviya(2016), Mobile banking current status in India, International
Journal of Commerce and Management Research, ISSN: 2455-1627, Impact Factor:
RJIF 5.22 Volume 2; Issue 5; May 2016; Page No. 63-66.
5. Singh, Charan (June 2014) “Financial Inclusion in India: Select Issues June 2014”
https://www.iimb.ernet.in/research/sites/default/.../WP%20No.%20474.pd
6. Consumers and Mobile Financial Services 2016, March 2016. Accessed from
www.federalreserve.gov/publications/default.htm.
7. Consultation Paper No. 16/2016 Consultation Paper on the review of regulatory
framework for the use of USSD for mobile financial services
8. Kothari, C.R./ Research Methodology: New Age International, 2002.
9. Economic & Political Weekly
10. Young/ Scientific Social Surveys & Research: Prentice Hall India, 1998, pp 201- 215.
11. Naqvi, Hena (2016), A New Era of Social Security, Kurukshetra. Vol 64, No 8, pp
23-28.
Authors:
* Dr. Brijesh Upadhyay: Author is Associate Professor at Department of Business
Management, Faculty of RDBM, MGCGV Chitrakoot (Satna) MP.He has published
many research papers in national and international journals. He also has attended
various seminar and conferences. He is guiding PhD research scholars.
** Shivshankar Vishwakarma: Corresponding author is currently a PhD research scholar
at MGCGV Chitrakoot (Satna) under the Faculty of RDBM and Department of
Business Management. E-mail: [email protected] Contact no:
9826818360