
Edinburgh Research Explorer · currently under way (Kopetzki et al., 2013). Casein-kinase 1 (CK1)...
25
Edinburgh Research Explorer Process modelling and simulation for continuous pharmaceutical manufacturing of ibuprofen Citation for published version: Jolliffe, HG & Gerogiorgis, D 2015, 'Process modelling and simulation for continuous pharmaceutical manufacturing of ibuprofen' Chemical Engineering Research and Design, vol. 97, pp. 175-191. DOI: 10.1016/j.cherd.2014.12.005 Digital Object Identifier (DOI): 10.1016/j.cherd.2014.12.005 Link: Link to publication record in Edinburgh Research Explorer Document Version: Peer reviewed version Published In: Chemical Engineering Research and Design General rights Copyright for the publications made accessible via the Edinburgh Research Explorer is retained by the author(s) and / or other copyright owners and it is a condition of accessing these publications that users recognise and abide by the legal requirements associated with these rights. Take down policy The University of Edinburgh has made every reasonable effort to ensure that Edinburgh Research Explorer content complies with UK legislation. If you believe that the public display of this file breaches copyright please contact [email protected] providing details, and we will remove access to the work immediately and investigate your claim. Download date: 21. Aug. 2018
Transcript of Edinburgh Research Explorer · currently under way (Kopetzki et al., 2013). Casein-kinase 1 (CK1)...
Edinburgh Research Explorer
Process modelling and simulation for continuous pharmaceuticalmanufacturing of ibuprofen
Citation for published version:Jolliffe, HG & Gerogiorgis, D 2015, 'Process modelling and simulation for continuous pharmaceuticalmanufacturing of ibuprofen' Chemical Engineering Research and Design, vol. 97, pp. 175-191. DOI:10.1016/j.cherd.2014.12.005
Digital Object Identifier (DOI):10.1016/j.cherd.2014.12.005
Link:Link to publication record in Edinburgh Research Explorer
Document Version:Peer reviewed version
Published In:Chemical Engineering Research and Design
General rightsCopyright for the publications made accessible via the Edinburgh Research Explorer is retained by the author(s)and / or other copyright owners and it is a condition of accessing these publications that users recognise andabide by the legal requirements associated with these rights.
Take down policyThe University of Edinburgh has made every reasonable effort to ensure that Edinburgh Research Explorercontent complies with UK legislation. If you believe that the public display of this file breaches copyright pleasecontact [email protected] providing details, and we will remove access to the work immediately andinvestigate your claim.
Download date: 21. Aug. 2018
Process Modelling and Simulation for Continuous Pharmaceutical Manufacturing of Ibuprofen
Hikaru G. Jolliffe and Dimitrios I. Gerogiorgis*
Institute for Materials and Processes (IMP), School of Engineering, University of Edinburgh,
The King’s Buildings, Edinburgh, EH9 3JL, United Kingdom
*Corresponding author: [email protected] (+44 131 6517072)
ABSTRACT Pharmaceutical corporations face rapidly rising process research and development (R&D) as well as production costs due to globalised competition. Batch production processes are dominant in the pharmaceutical industry and have multiple advantages, including equipment flexibility, high-fidelity quality control and the ability to recall specific batches; they however suffer disadvantages such as limited heat transfer and mixing scalability and low operational asset efficiency. Continuous Pharmaceutical Manufacturing (CPM) has a documented potential to reduce cost because continuous production techniques can be easier to scale up and can be designed to be more efficient in terms of both solvent and energy use: therefore, it is both timely and important to explore the expanding feasibility limits of this emerging technology. The literature has been extensively surveyed in order to identify a series of candidate Active Pharmaceutical Ingredients (API) for flowsheet synthesis, process modelling and mass balance simulation toward rapid assessment of CPM potential. Ibuprofen [2-(4-isobutylphenyl)propanoic acid], the widely used non-steroidal anti-inflammatory drug (NSAID), has emerged as an ideal CPM candidate because it is in high global demand and can generate significant profit margins. The flowsheet is based on a published organic synthesis pathway and produces 50 kg of ibuprofen annually using three plug flow reactors (PFRs) in series, followed by a final separation for purification. Kinetic and thermodynamic parameter estimation modelling has been employed in order to compute essential data for design, and all PFR reactors have been designed based on reported conversions of feed and intermediate organic molecules in the respective pharmaceutical synthesis reactions. Theoretically computed reactor designs are in good agreement with experimental prototypes constructed for the same organic synthesis, as well as in with previously reported CPM systems. The developed continuous final separation performs very well in accordance with green chemistry principles, and with relatively low environmental impact (an E-factor of 25.4).
*ManuscriptClick here to view linked References
1
1 INTRODUCTION Batch manufacturing processes feature advantages including equipment usage versatility, flexible production planning and scheduling, and a wide range of attainable products, and have dominated the pharmaceutical industry for a number of decades; they still are considerably more preferable due to regulatory and licensing considerations and the option to quickly recall specific batches of products (Plumb, 2005). Nevertheless, they have several disadvantages: new processes are often difficult to scale up to production level due to poor heat transfer and mixing (potentially resulting in unacceptable product quality) and efficiency can be very low with high volumes of unrecovered solvent (Anderson, 2012; Gernaey et al., 2012). Batch production plants also require significant intermediate storage capacity between process stages, resulting in large inventories of feedstock organic chemicals and sensitive intermediates.
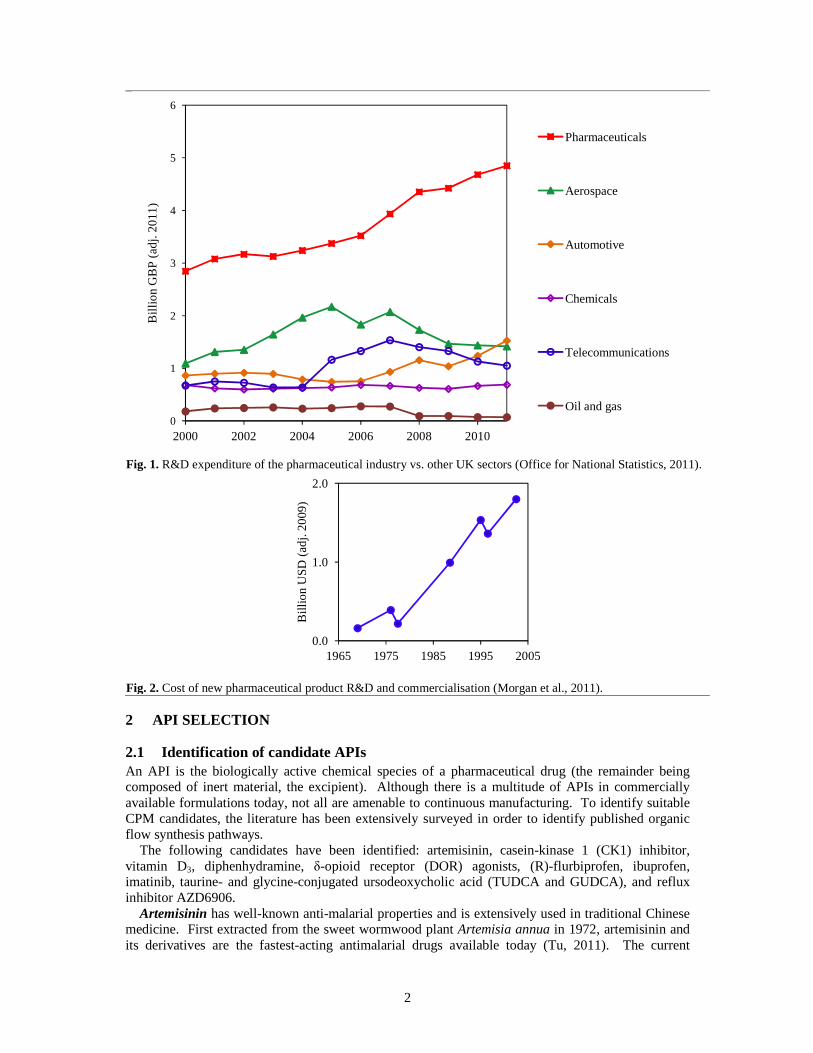
In recent years, pharmaceutical firms have faced mounting pressure to reduce ever-increasing R&D as well as production costs (Fig. 1). The commercialisation of new drugs can require up to $1.8 billion in total per product, a high cost which has been steadily increasing (Fig. 2). Competition from generic drug manufacturers also increases the pressure on pharmaceutical firms (Behr et al., 2004). Taking into account clinical approval and patent duration, by the time the product reaches the market half of its patent life may have expired; once this occurs, the original developer may lose up to 90% of market share to generic manufacturers (Plumb, 2005).
Continuous Pharmaceutical Manufacturing (CPM) offers many advantages: lower costs, reduced waste, decreased time-to-market for new drugs, continuous flow reactors can deliver significantly higher yields, and solvent and energy waste can be decreased by up to 90% by steady-state operation (Kockmann et al., 2008; Roberge et al., 2008; Anderson, 2012). For identical production rates, continuous systems require considerably smaller equipment volumes than batch processes (Ashe and Lazowski, 2012). Lower solvent requirement and more efficient heat transfer during exothermic reactions both lead to safer operation (LaPorte and Wang, 2007; Kockmann et al., 2008; Roberge et al., 2008), therefore CPM can offer cost savings to pharmaceutical corporations, as it does in commodity and fine chemicals industries (Schaber et al., 2011). Labour cost can also be reduced, due to the limited need for human intervention in material transport and quality control (Plumb, 2005).
Experimental demonstration and process validation at pilot plant scale are key to showcasing CPM benefits: as this is laborious, costly and time-consuming, flowsheet synthesis and process modelling can be used to investigate the feasibility and viability of candidate CPM processes (Douglas, 1988; Gerogiorgis and Barton, 2009). Minimal investment is required, and numerous process options and configurations can be rapidly evaluated by means of suitable mathematical models and simulations, especially when pilot plants are expensive and know-how is limited (Gerogiorgis and Ydstie, 2005).
This work presents an adapted flowsheet and a steady-state process model which has been developed for the continuous synthesis and purification of an Active Pharmaceutical Ingredient (API) identified as a promising candidate for this new production paradigm. Reactor design has been performed based on published kinetics of the continuous organic synthesis pathway, and a final separation stage for product purification has been designed, with multiple solvents evaluated with respect to API recovery and green chemistry performance. Process modelling and simulation have thus been successfully applied to illustrate the benefits and feasibility of CPM for ibuprofen.
The paper is organized as follows: the evaluation of candidate APIs is presented, and following this the static model flowsheet and mass balances are shown. Published data is analysed to determine reaction orders and kinetic constants, which are then used to design continuous plug flow reactors. A summary of material properties is given next, followed by heat transfer requirements and final separation design. Finally, mass balance and unit operation design results are discussed in relation to the technical feasibility of the process and the emerging field of CPM process R&D. Detailed kinetic, thermodynamic and physicochemical property prediction models are presented in the Appendix.
2
2 API SELECTION
2.1 Identification of candidate APIs An API is the biologically active chemical species of a pharmaceutical drug (the remainder being composed of inert material, the excipient). Although there is a multitude of APIs in commercially available formulations today, not all are amenable to continuous manufacturing. To identify suitable CPM candidates, the literature has been extensively surveyed in order to identify published organic flow synthesis pathways.
The following candidates have been identified: artemisinin, casein-kinase 1 (CK1) inhibitor, vitamin D3, diphenhydramine, δ-opioid receptor (DOR) agonists, (R)-flurbiprofen, ibuprofen, imatinib, taurine- and glycine-conjugated ursodeoxycholic acid (TUDCA and GUDCA), and reflux inhibitor AZD6906.
Artemisinin has well-known anti-malarial properties and is extensively used in traditional Chinese medicine. First extracted from the sweet wormwood plant Artemisia annua in 1972, artemisinin and its derivatives are the fastest-acting antimalarial drugs available today (Tu, 2011). The current
Fig. 1. R&D expenditure of the pharmaceutical industry vs. other UK sectors (Office for National Statistics, 2011).
Fig. 2. Cost of new pharmaceutical product R&D and commercialisation (Morgan et al., 2011).
0
1
2
3
4
5
6
2000 2002 2004 2006 2008 2010
Bill
ion
GB
P (
adj.
2011
)Pharmaceuticals
Aerospace
Automotive
Chemicals
Telecommunications
Oil and gas
0.0
1.0
2.0
1965 1975 1985 1995 2005
Bill
ion
USD
(ad
j. 20
09)
3
production method relies on plant cultivation and subsequent extraction (White, 2008); the continuous production of artemisinin from the waste product of this extraction process has been recently demonstrated (Kopetzki et al., 2013). This method converts dihydroartemisinic acid (DHAA) into artemisinin, and construction of a scaled-up system with an annual capacity of one metric tonne is currently under way (Kopetzki et al., 2013).
Casein-kinase 1 (CK1) inhibitor is potent in the regulation of mammal circadian rhythms, and research indicates it is promising for the regulation of sleep disorders and mood disorders (Lee et al., 2009). Recently, Sanofi-Aventis developed a class of CK1 inhibitors, and certain ones have been synthesised continuously (Almario et al., 2009).
Vitamin D3 has extreme physiological importance, as this molecule and its analogues are used to treat osteoporosis and renal failure (Posner and Kahraman, 2003). A continuous route for the synthesis of activated vitamin D3 and some of its analogues has been reported (Fuse et al., 2012).
Diphenhydramine, discovered in 1942, is a first-generation antihistamine first marketed as Benadryl® (Ravina and Kubinyi, 2011). More effective than many newer antihistamines at treating allergic symptoms, it also has sedative properties and is used in sleep aids (Richardson et al., 2002). Global demand of diphenhydramine is high (at over 100 metric tonnes a year), and recent work has demonstrated its continuous flow synthesis using molten ionic salts (Snead and Jamison, 2013).
DOR agonists have been shown to have analgaesic properties without the side-effects associated with opioids; recently, researchers have presented a continuous synthesis method for the production a DOR (developed by Astra Zeneca) and some of its analogues (Wei et al., 2000; Qian et al., 2010).
Flurbiprofen is a non-steroidal anti-inflammatory drug (NSAID) used to treat several pathological conditions, including osteoarthritis. The R-enantiomer of flurbiprofen, R-flurbiprofen, has undergone clinical trials for a variety of conditions (Wechter et al., 2000; Quann et al., 2007), and a continuous synthesis pathway and isolation method of R-flurbiprofen has been reported (Tambornini et al., 2012).
Ibuprofen [2-(4-isobutylphenyl)propanoic acid] is a widely used NSAID which treats pain, fever, and inflammation, and is listed as essential by the World Health Organisation. The original 6-step synthesis devised in the 1960s has been replaced by a more efficient 3-step method (Adams, 1992). A continuous synthesis pathway for ibuprofen has been published recently (Bogdan et al., 2009).
Imatinib is effective in treatment of multiple cancers, especially chronic myeloid leukaemia (Goldman and Melo, 2003). Marketed as Glivec®, it has been highly successful commercially (with revenues of $4.7 billion in 2012) and commands one of the highest prices for an anti-cancer treatment at $92,000 a year (Abboud et al., 2013). A continuous production method has been developed as well in order to handle poorly soluble intermediates (Hopkin et al., 2010).
Ursodeoxycholic acid (UDCA) is a secondary bile acid which can be conjugated with amino-acids (e.g. taurine and glycine) to form TUDCA and GUDCA, with potential therapeutic uses in stroke, Parkinson’s, and Huntington’s diseases (Rivard et al., 2007; Boatright et al., 2009). A continuous flow synthesis pathway has also been reported for the conjugation of UDCA with taurine and glycine at the multi-gram scale (Venturoni et al., 2012).
Reflux inhibitor AZD6906 is a promising API without central nervous system side-effects. However, its batch synthesis is difficult due to highly exothermic reactions, toxic reagents, and unstable products; consequently, researchers have developed a continuous process which adapts a previous batch synthesis route (Gustafsson et al., 2012).
2.2 Evaluation of candidate APIs The identified candidate APIs require systematic evaluation: technical as well as economic considerations have been taken into account and ten (10) broad criteria have been defined in order to comparatively rank the candidates and determine which API would be the most attractive to pursue for flowsheet synthesis, process modelling and simulation.
A. Is the process fully continuous? One of the driving forces for CPM is the need to overcome drawbacks such as batch process intermediate storage and scheduling, which result in low operational asset efficiency. A fully continuous process is more desirable than one with even one batch unit operation (typically a separation or purification).
B. Is the final product a currently marketed API? Economic evaluation is of high importance for CPM development. The business case for a continuous flow process is stronger if the API is commercially available, because this implies a clear scope for revenue and cost reduction.
4
C. Is the process of low to medium complexity? The feasibility and viability of complex CPM pathways are subject to higher uncertainties, so processes which require fewer and/or conventional unit operations and configurations are more preferable.
D. Has the process been implemented? Evidence of actual or planned CPM implementation (either at pilot-plant or production level) strengthens the likelihood of success.
E. Are feedstock and reagent materials readily available? The availability of feedstocks and reagents is key to feasibility: processes which rely on chemicals which are prohibitively expensive (or whose supply cannot be guaranteed) are less favourable for implementation.
F. Does the continuous synthesis pathway offer improved performance over the batch process? A promising API synthesis method must demonstrate clear advantages over current batch production processes.
G. Can the process be scaled up easily and safely? A CPM route must be feasible at a pilot plant as well as production level in order to realise the expected benefits over batch production.
H. Are intermediate separations eliminated? The most attractive process has a minimal number of intermediate separations (excluding final purification), which imply lower solvent and energy use.
I. How high is the price of the commercially available product? The business case (and profitability) of a CPM process is stronger if the final API is sold at a high price.
J. How high is the global sales volume? If the product API is in high global demand, the business case for a CPM process will be stronger.
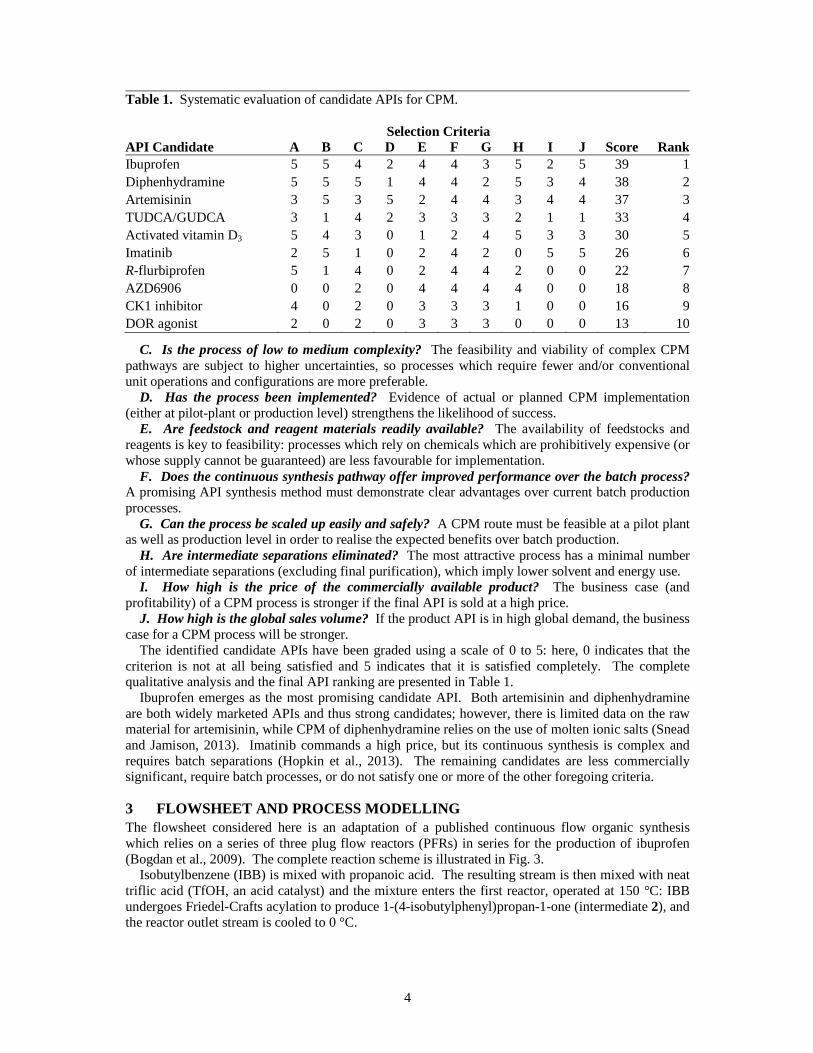
The identified candidate APIs have been graded using a scale of 0 to 5: here, 0 indicates that the criterion is not at all being satisfied and 5 indicates that it is satisfied completely. The complete qualitative analysis and the final API ranking are presented in Table 1.
Ibuprofen emerges as the most promising candidate API. Both artemisinin and diphenhydramine are both widely marketed APIs and thus strong candidates; however, there is limited data on the raw material for artemisinin, while CPM of diphenhydramine relies on the use of molten ionic salts (Snead and Jamison, 2013). Imatinib commands a high price, but its continuous synthesis is complex and requires batch separations (Hopkin et al., 2013). The remaining candidates are less commercially significant, require batch processes, or do not satisfy one or more of the other foregoing criteria.
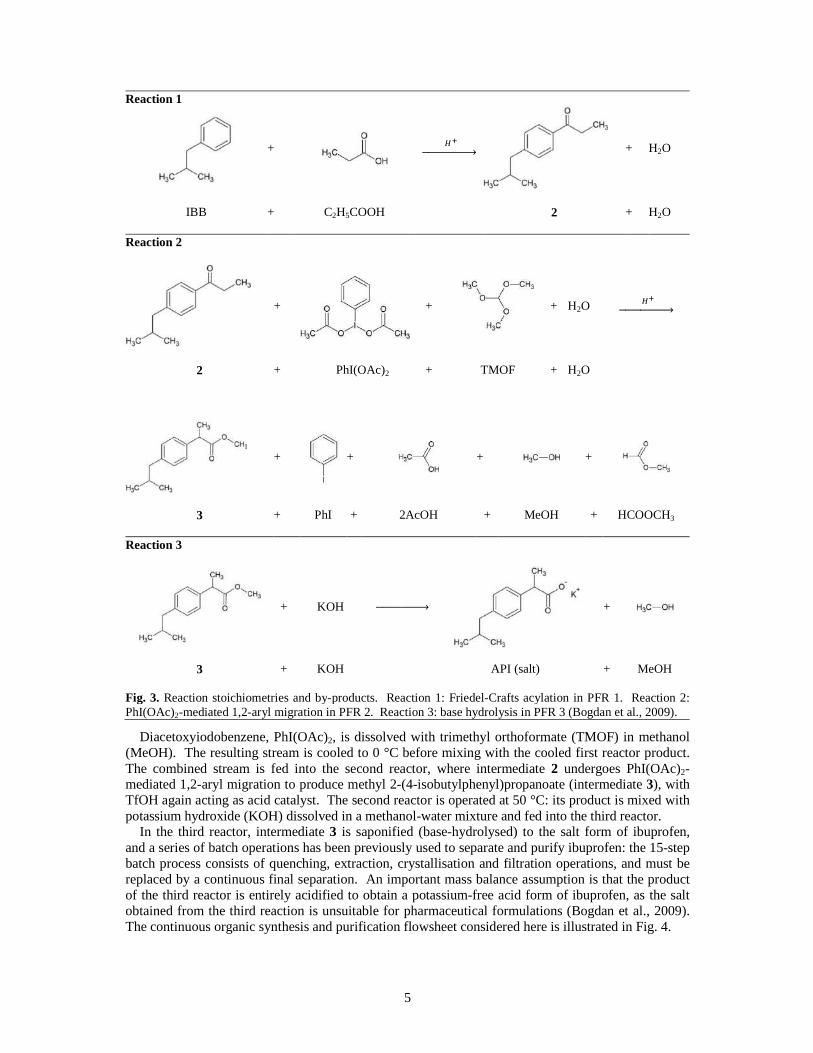
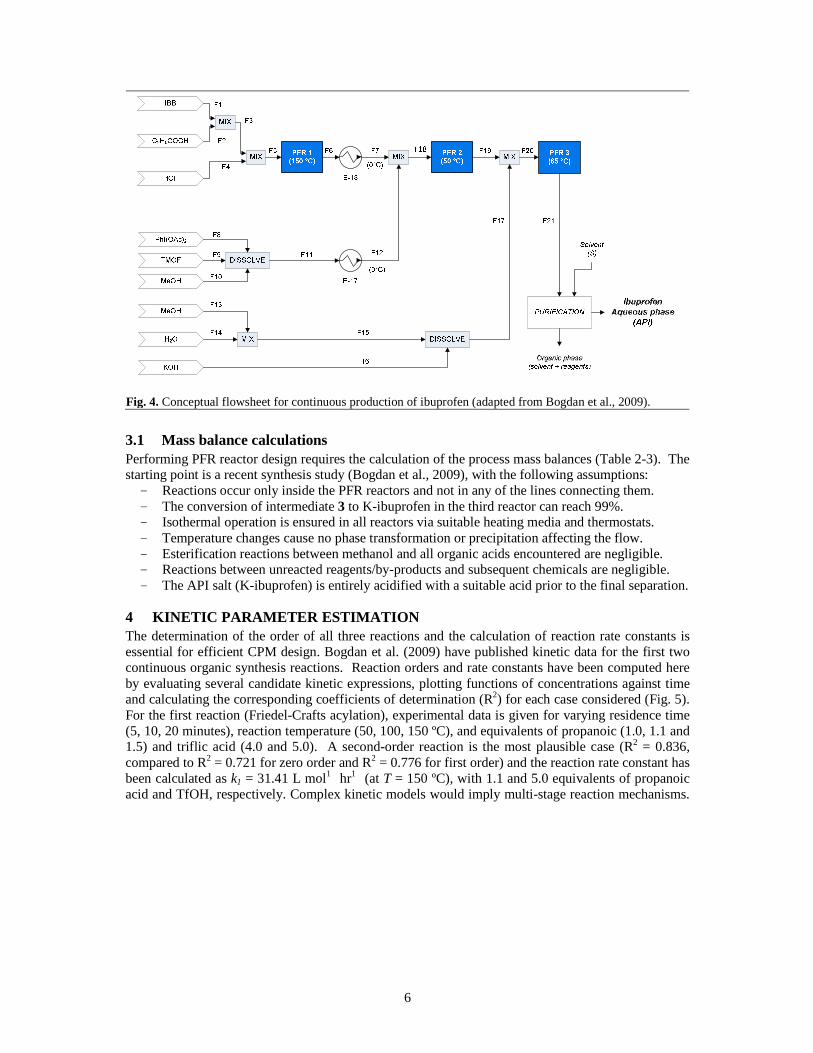
3 FLOWSHEET AND PROCESS MODELLING The flowsheet considered here is an adaptation of a published continuous flow organic synthesis which relies on a series of three plug flow reactors (PFRs) in series for the production of ibuprofen (Bogdan et al., 2009). The complete reaction scheme is illustrated in Fig. 3.
Isobutylbenzene (IBB) is mixed with propanoic acid. The resulting stream is then mixed with neat triflic acid (TfOH, an acid catalyst) and the mixture enters the first reactor, operated at 150 °C: IBB undergoes Friedel-Crafts acylation to produce 1-(4-isobutylphenyl)propan-1-one (intermediate 2), and the reactor outlet stream is cooled to 0 °C.
Table 1. Systematic evaluation of candidate APIs for CPM.
API Candidate Selection Criteria
A B C D E F G H I J Score RankIbuprofen 5 5 4 2 4 4 3 5 2 5 39 1Diphenhydramine 5 5 5 1 4 4 2 5 3 4 38 2Artemisinin 3 5 3 5 2 4 4 3 4 4 37 3TUDCA/GUDCA 3 1 4 2 3 3 3 2 1 1 33 4Activated vitamin D3 5 4 3 0 1 2 4 5 3 3 30 5Imatinib 2 5 1 0 2 4 2 0 5 5 26 6R-flurbiprofen 5 1 4 0 2 4 4 2 0 0 22 7AZD6906 0 0 2 0 4 4 4 4 0 0 18 8CK1 inhibitor 4 0 2 0 3 3 3 1 0 0 16 9DOR agonist 2 0 2 0 3 3 3 0 0 0 13 10
5
Diacetoxyiodobenzene, PhI(OAc)2, is dissolved with trimethyl orthoformate (TMOF) in methanol (MeOH). The resulting stream is cooled to 0 °C before mixing with the cooled first reactor product. The combined stream is fed into the second reactor, where intermediate 2 undergoes PhI(OAc)2-mediated 1,2-aryl migration to produce methyl 2-(4-isobutylphenyl)propanoate (intermediate 3), with TfOH again acting as acid catalyst. The second reactor is operated at 50 °C: its product is mixed with potassium hydroxide (KOH) dissolved in a methanol-water mixture and fed into the third reactor.
In the third reactor, intermediate 3 is saponified (base-hydrolysed) to the salt form of ibuprofen, and a series of batch operations has been previously used to separate and purify ibuprofen: the 15-step batch process consists of quenching, extraction, crystallisation and filtration operations, and must be replaced by a continuous final separation. An important mass balance assumption is that the product of the third reactor is entirely acidified to obtain a potassium-free acid form of ibuprofen, as the salt obtained from the third reaction is unsuitable for pharmaceutical formulations (Bogdan et al., 2009). The continuous organic synthesis and purification flowsheet considered here is illustrated in Fig. 4.
Reaction 1
+
+ H2O
IBB + C2H5COOH 2 + H2O
Reaction 2
+
+
+ H2O
2 + PhI(OAc)2 + TMOF + H2O
+
+
+ +
3 + PhI + 2AcOH + MeOH + HCOOCH3
Reaction 3
+ KOH
+
3 + KOH API (salt) + MeOH
Fig. 3. Reaction stoichiometries and by-products. Reaction 1: Friedel-Crafts acylation in PFR 1. Reaction 2: PhI(OAc)2-mediated 1,2-aryl migration in PFR 2. Reaction 3: base hydrolysis in PFR 3 (Bogdan et al., 2009).
6
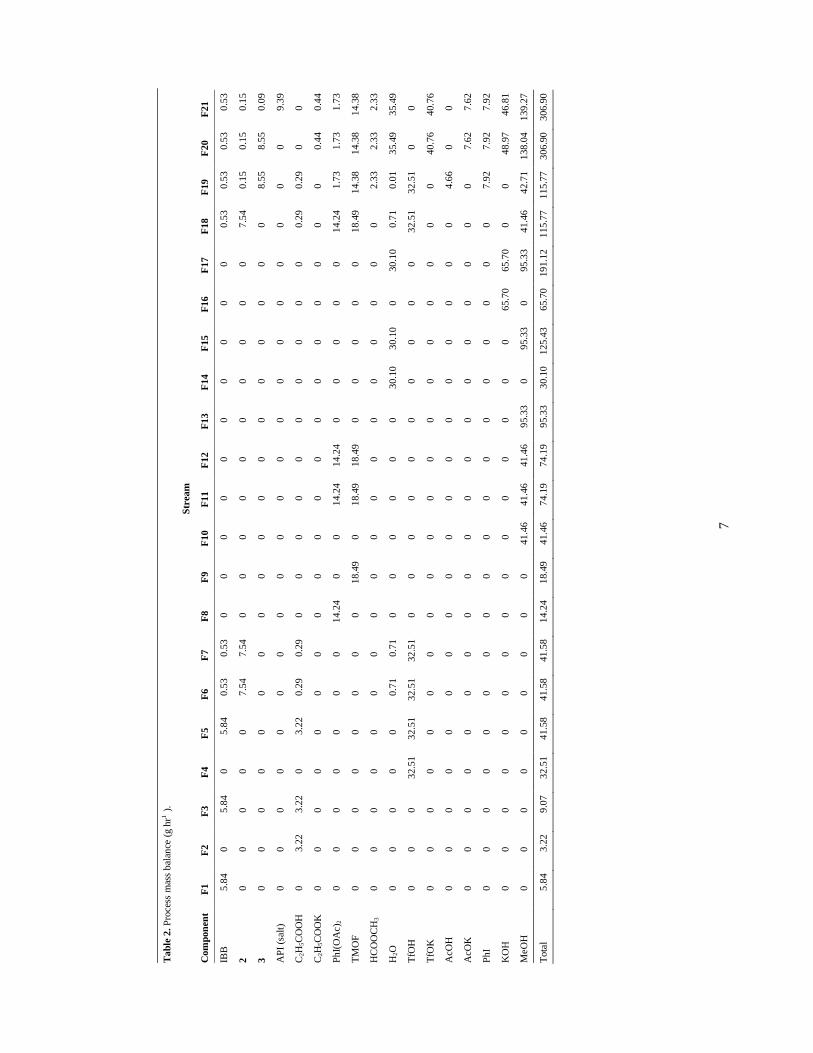
3.1 Mass balance calculations Performing PFR reactor design requires the calculation of the process mass balances (Table 2-3). The starting point is a recent synthesis study (Bogdan et al., 2009), with the following assumptions: - Reactions occur only inside the PFR reactors and not in any of the lines connecting them. - The conversion of intermediate 3 to K-ibuprofen in the third reactor can reach 99%. - Isothermal operation is ensured in all reactors via suitable heating media and thermostats. - Temperature changes cause no phase transformation or precipitation affecting the flow. - Esterification reactions between methanol and all organic acids encountered are negligible. - Reactions between unreacted reagents/by-products and subsequent chemicals are negligible. - The API salt (K-ibuprofen) is entirely acidified with a suitable acid prior to the final separation.
4 KINETIC PARAMETER ESTIMATION The determination of the order of all three reactions and the calculation of reaction rate constants is essential for efficient CPM design. Bogdan et al. (2009) have published kinetic data for the first two continuous organic synthesis reactions. Reaction orders and rate constants have been computed here by evaluating several candidate kinetic expressions, plotting functions of concentrations against time and calculating the corresponding coefficients of determination (R2) for each case considered (Fig. 5). For the first reaction (Friedel-Crafts acylation), experimental data is given for varying residence time (5, 10, 20 minutes), reaction temperature (50, 100, 150 ºC), and equivalents of propanoic (1.0, 1.1 and 1.5) and triflic acid (4.0 and 5.0). A second-order reaction is the most plausible case (R2 = 0.836, compared to R2 = 0.721 for zero order and R2 = 0.776 for first order) and the reaction rate constant has been calculated as k1 = 31.41 L mol1 hr1 (at T = 150 ºC), with 1.1 and 5.0 equivalents of propanoic acid and TfOH, respectively. Complex kinetic models would imply multi-stage reaction mechanisms.
Fig. 4. Conceptual flowsheet for continuous production of ibuprofen (adapted from Bogdan et al., 2009).
7
T
able
2. P
roce
ss m
ass
bala
nce
(g h
r1).
St
ream
Com
pone
nt
F1
F2
F3
F4
F5
F6
F7
F8
F9
F10
F
11
F12
F
13
F14
F
15
F16
F
17
F18
F
19
F20
F
21
IBB
5.
84
0 5.
84
0 5.
84
0.53
0.
53
0 0
0 0
0 0
0 0
0 0
0.53
0.
53
0.53
0.
53
2 0
0 0
0 0
7.54
7.
54
0 0
0 0
0 0
0 0
0 0
7.54
0.
15
0.15
0.
15
3 0
0 0
0 0
0 0
0 0
0 0
0 0
0 0
0 0
0 8.
55
8.55
0.
09
API
(sa
lt)
0 0
0 0
0 0
0 0
0 0
0 0
0 0
0 0
0 0
0 0
9.39
C2H
5CO
OH
0
3.22
3.
22
0 3.
22
0.29
0.
29
0 0
0 0
0 0
0 0
0 0
0.29
0.
29
0 0
C2H
5CO
OK
0
0 0
0 0
0 0
0 0
0 0
0 0
0 0
0 0
0 0
0.44
0.
44
PhI(
OA
c)2
0 0
0 0
0 0
0 14
.24
0 0
14.2
4 14
.24
0 0
0 0
0 14
.24
1.73
1.
73
1.73
TM
OF
0 0
0 0
0 0
0 0
18.4
9 0
18.4
9 18
.49
0 0
0 0
0 18
.49
14.3
8 14
.38
14.3
8
HC
OO
CH
3 0
0 0
0 0
0 0
0 0
0 0
0 0
0 0
0 0
0 2.
33
2.33
2.
33
H2O
0
0 0
0 0
0.71
0.
71
0 0
0 0
0 0
30.1
0 30
.10
0 30
.10
0.71
0.
01
35.4
9 35
.49
TfO
H
0 0
0 32
.51
32.5
1 32
.51
32.5
1 0
0 0
0 0
0 0
0 0
0 32
.51
32.5
1 0
0
TfO
K
0 0
0 0
0 0
0 0
0 0
0 0
0 0
0 0
0 0
0 40
.76
40.7
6
AcO
H
0 0
0 0
0 0
0 0
0 0
0 0
0 0
0 0
0 0
4.66
0
0
AcO
K
0 0
0 0
0 0
0 0
0 0
0 0
0 0
0 0
0 0
0 7.
62
7.62
PhI
0 0
0 0
0 0
0 0
0 0
0 0
0 0
0 0
0 0
7.92
7.
92
7.92
KO
H
0 0
0 0
0 0
0 0
0 0
0 0
0 0
0 65
.70
65.7
0 0
0 48
.97
46.8
1
MeO
H
0 0
0 0
0 0
0 0
0 41
.46
41.4
6 41
.46
95.3
3 0
95.3
3 0
95.3
3 41
.46
42.7
1 13
8.04
13
9.27
Tot
al
5.84
3.
22
9.07
32
.51
41.5
8 41
.58
41.5
8 14
.24
18.4
9 41
.46
74.1
9 74
.19
95.3
3 30
.10
125.
43
65.7
0 19
1.12
11
5.77
11
5.77
30
6.90
30
6.90
8
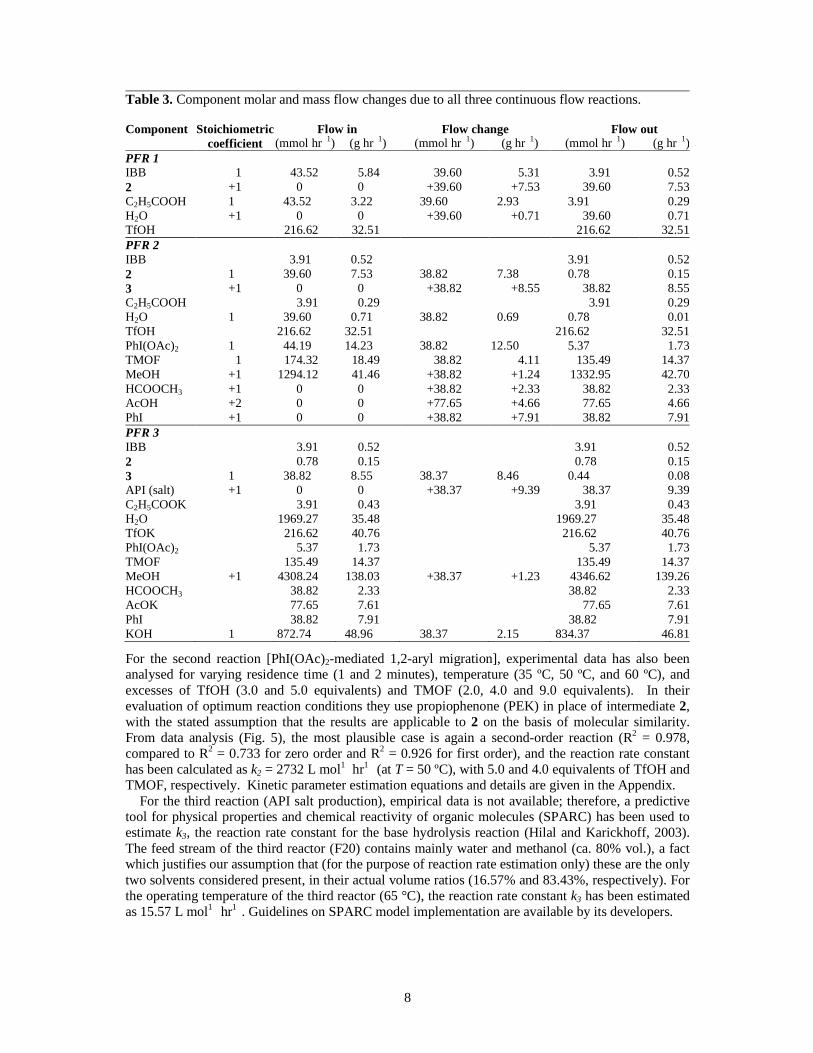
For the second reaction [PhI(OAc)2-mediated 1,2-aryl migration], experimental data has also been analysed for varying residence time (1 and 2 minutes), temperature (35 ºC, 50 ºC, and 60 ºC), and excesses of TfOH (3.0 and 5.0 equivalents) and TMOF (2.0, 4.0 and 9.0 equivalents). In their evaluation of optimum reaction conditions they use propiophenone (PEK) in place of intermediate 2, with the stated assumption that the results are applicable to 2 on the basis of molecular similarity. From data analysis (Fig. 5), the most plausible case is again a second-order reaction (R2 = 0.978, compared to R2 = 0.733 for zero order and R2 = 0.926 for first order), and the reaction rate constant has been calculated as k2 = 2732 L mol1 hr1 (at T = 50 ºC), with 5.0 and 4.0 equivalents of TfOH and TMOF, respectively. Kinetic parameter estimation equations and details are given in the Appendix.
For the third reaction (API salt production), empirical data is not available; therefore, a predictive tool for physical properties and chemical reactivity of organic molecules (SPARC) has been used to estimate k3, the reaction rate constant for the base hydrolysis reaction (Hilal and Karickhoff, 2003). The feed stream of the third reactor (F20) contains mainly water and methanol (ca. 80% vol.), a fact which justifies our assumption that (for the purpose of reaction rate estimation only) these are the only two solvents considered present, in their actual volume ratios (16.57% and 83.43%, respectively). For the operating temperature of the third reactor (65 °C), the reaction rate constant k3 has been estimated as 15.57 L mol1 hr1 . Guidelines on SPARC model implementation are available by its developers.
Table 3. Component molar and mass flow changes due to all three continuous flow reactions. Component Stoichiometric
coefficient Flow in Flow change Flow out
(mmol hr 1) (g hr 1) (mmol hr 1) (g hr 1) (mmol hr 1) (g hr 1)PFR 1 IBB 1 43.52 5.84 39.60 5.31 3.91 0.522 +1 0 0 +39.60 +7.53 39.60 7.53C2H5COOH 1 43.52 3.22 39.60 2.93 3.91 0.29H2O +1 0 0 +39.60 +0.71 39.60 0.71TfOH 216.62 32.51 216.62 32.51PFR 2 IBB 3.91 0.52 3.91 0.522 1 39.60 7.53 38.82 7.38 0.78 0.153 +1 0 0 +38.82 +8.55 38.82 8.55C2H5COOH 3.91 0.29 3.91 0.29H2O 1 39.60 0.71 38.82 0.69 0.78 0.01TfOH 216.62 32.51 216.62 32.51PhI(OAc)2 1 44.19 14.23 38.82 12.50 5.37 1.73TMOF 1 174.32 18.49 38.82 4.11 135.49 14.37MeOH +1 1294.12 41.46 +38.82 +1.24 1332.95 42.70HCOOCH3 +1 0 0 +38.82 +2.33 38.82 2.33AcOH +2 0 0 +77.65 +4.66 77.65 4.66PhI +1 0 0 +38.82 +7.91 38.82 7.91PFR 3 IBB 3.91 0.52 3.91 0.522 0.78 0.15 0.78 0.153 1 38.82 8.55 38.37 8.46 0.44 0.08API (salt) +1 0 0 +38.37 +9.39 38.37 9.39C2H5COOK 3.91 0.43 3.91 0.43H2O 1969.27 35.48 1969.27 35.48TfOK 216.62 40.76 216.62 40.76PhI(OAc)2 5.37 1.73 5.37 1.73TMOF 135.49 14.37 135.49 14.37MeOH +1 4308.24 138.03 +38.37 +1.23 4346.62 139.26HCOOCH3 38.82 2.33 38.82 2.33AcOK 77.65 7.61 77.65 7.61PhI 38.82 7.91 38.82 7.91KOH 1 872.74 48.96 38.37 2.15 834.37 46.81

5 PLUG FLOW REACTOR (PFR) DESIGN Reactor design is performed assuming ideal solutions, homogeneous mixtures, no radial concentration gradients, and isothermal operation without axial or radial temperature gradients: specific heat capacities and reaction enthalpies remain constant within each PFR, and phase changes do not occur. All reactors are assumed to be submerged in heating media with adequate flow circulation; due to the small radial size considered, heat transfer suffices so as to ensure constant and uniform temperature.
The first reaction is assumed to be second-order (first in IBB and first in propanoic acid), the second reaction is also assumed to be second-order (first order in intermediate 2 and first order in PhI(OAc)2), and the third reaction is assumed to be pseudo-first-order (first-order in intermediate 3 due to a considerable excess of potassium hydroxide used for the base hydrolysis). These assumptions are justified by the kinetic parameter estimation and model reactions with the highest possible fidelity.
The standard plug flow reactor performance equation has been used:
∫ −=
fAX
A
AAi r
dXC
,
00,τ (1)
Published data indicate that 91% conversion is achievable in the first reactor, and that over 98% is attainable in the second one (Bogdan et al., 2009). No data has been published for the conversion of the base hydrolysi in the third reactor, for which a value of 99% has been assumed. The assumptions that have been made and the parameters estimated toward PFR design are summarised in Table 4.
Fig. 5. Reaction order and kinetic parameter determination. A: reaction 1 (feed concentrations: CIBB,0 = 1.42 M, CC2H5COOH,0 = 1.56 M). B: reaction 2 (feed concentrations: CPEK,0 = 0.38 M, CPhI(OAc)2,0 = 0.39 M).
Table 4. Plug Flow Reactor (PFR) design basis and assumptions.
PFR 1 PFR 2 PFR 3 Reaction 1 2 3 Reaction order 2 2 2 Reaction type Friedel-Crafts acylation 1,2-aryl migration Base hydrolysis Rate law COOHHCIBBIBB CCkr
521=− 2)(222 OAcPhICCkr =− 33 Ckr ′=−
Reactor temperature (°C) 150 50 65 Conversion (%) 91 98 99 Rate constant ki (L mol 1 hr 1) 31.41 2732.3 15.57 Coefficient of determination (R2) 0.836 0.978 – Method for ki Data analysis Data analysis SPARC model
R² = 0.836
0.0
0.1
0.2
0.3
0.4
0.5
0.6
0.7
0.8
0 0.05 0.1 0.15 0.2
Time (hr)
R² = 0.978
0.0
0.1
0.2
0.3
0.4
0.5
0.6
0 0.01 0.02 0.03 0.04Time (hr)
A B
ln,
ln,
10
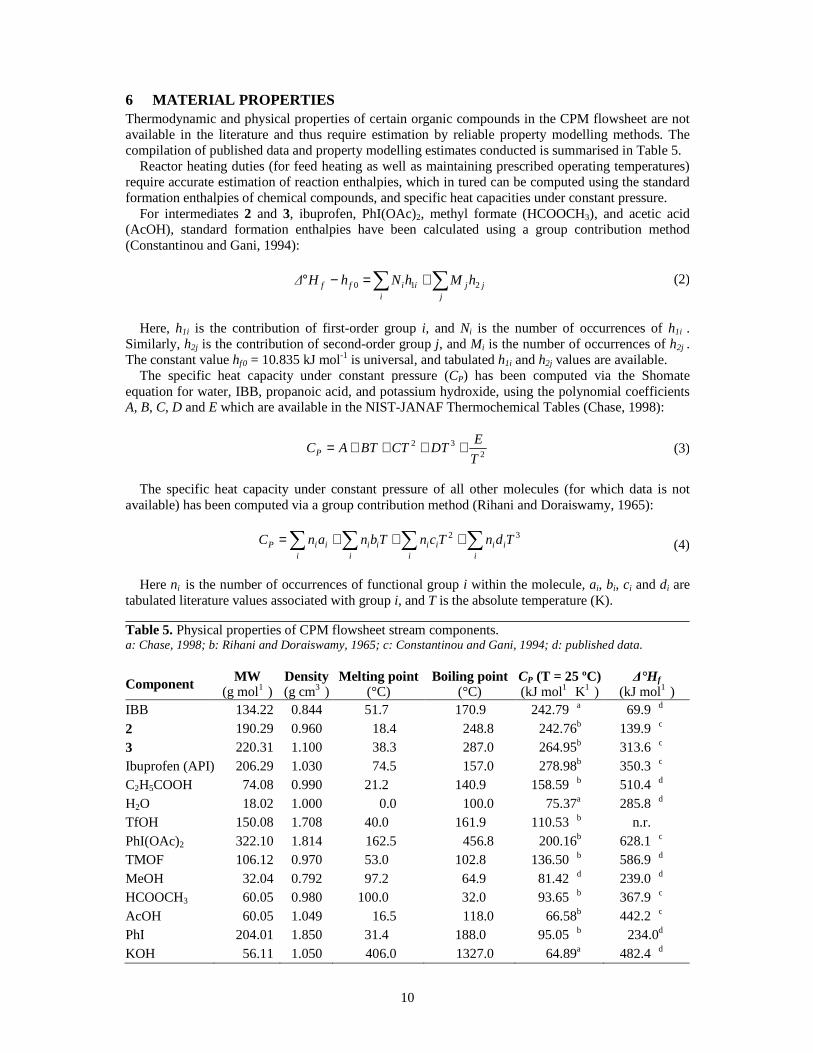
6 MATERIAL PROPERTIES Thermodynamic and physical properties of certain organic compounds in the CPM flowsheet are not available in the literature and thus require estimation by reliable property modelling methods. The compilation of published data and property modelling estimates conducted is summarised in Table 5.
Reactor heating duties (for feed heating as well as maintaining prescribed operating temperatures) require accurate estimation of reaction enthalpies, which in tured can be computed using the standard formation enthalpies of chemical compounds, and specific heat capacities under constant pressure.
For intermediates 2 and 3, ibuprofen, PhI(OAc)2, methyl formate (HCOOCH3), and acetic acid (AcOH), standard formation enthalpies have been calculated using a group contribution method (Constantinou and Gani, 1994):
∑∑ +=−°j
jji
iiff hMhNhH∆ 210 (2)
Here, h1i is the contribution of first-order group i, and Ni is the number of occurrences of h1i . Similarly, h2j is the contribution of second-order group j, and Mi is the number of occurrences of h2j . The constant value hf 0 = 10.835 kJ mol-1 is universal, and tabulated h1i and h2j values are available.
The specific heat capacity under constant pressure (CP) has been computed via the Shomate equation for water, IBB, propanoic acid, and potassium hydroxide, using the polynomial coefficients A, B, C, D and E which are available in the NIST-JANAF Thermochemical Tables (Chase, 1998):
232
T
EDTCTBTACP ++++= (3)
The specific heat capacity under constant pressure of all other molecules (for which data is not available) has been computed via a group contribution method (Rihani and Doraiswamy, 1965):
∑ ∑∑∑ +++=i i
iiiii
iii
iiP TdnTcnTbnanC 32 (4)
Here ni is the number of occurrences of functional group i within the molecule, ai, bi, ci and di are tabulated literature values associated with group i, and T is the absolute temperature (K).
Table 5. Physical properties of CPM flowsheet stream components. a: Chase, 1998; b: Rihani and Doraiswamy, 1965; c: Constantinou and Gani, 1994; d: published data.
Component MW (g mol1 )
Density (g cm3 )
Melting point (°C)
Boiling point (°C)
CP (T = 25 ºC) (kJ mol1 K1 )
∆°Hf
(kJ mol1 ) IBB 134.22 0.844 51.7 170.9 242.79 a 69.9 d 2 190.29 0.960 18.4 248.8 242.76b 139.9 c 3 220.31 1.100 38.3 287.0 264.95b 313.6 c Ibuprofen (API) 206.29 1.030 74.5 157.0 278.98b 350.3 c C2H5COOH 74.08 0.990 21.2 140.9 158.59 b 510.4 d H2O 18.02 1.000 0.0 100.0 75.37a 285.8 d TfOH 150.08 1.708 40.0 161.9 110.53 b n.r. PhI(OAc)2 322.10 1.814 162.5 456.8 200.16b 628.1 c TMOF 106.12 0.970 53.0 102.8 136.50 b 586.9 d MeOH 32.04 0.792 97.2 64.9 81.42 d 239.0 d HCOOCH3 60.05 0.980 100.0 32.0 93.65 b 367.9 c AcOH 60.05 1.049 16.5 118.0 66.58b 442.2 c PhI 204.01 1.850 31.4 188.0 95.05 b 234.0d KOH 56.11 1.050 406.0 1327.0 64.89a 482.4 d
11
Chemical solubilities have been computed using the UNIFAC group contribution method (Fredenslund et al., 1975), via activity coefficients which are sums of a combinatorial and a residual component. The prerequisite enthalpies of fusion have also been calculated via a group contribution method (Chickos and Acree, 1999). All property estimation equations are presented in the Appendix.
7 HEAT TRANSFER DESIGN Energy balance calculation is essential for process R&D and CPM evaluation: therein, heat transfer duty constitutes the dominant energy requirement, since process streams require heating or cooling, while reactor operating temperatures must be maintained constant for maximum process efficiency.
All three plug flow reactors are assumed isothermal (PFR 1: 150 °C, PFR 2: 50 °C, PFR 3: 65 °C). Reactor and process lines are considered submerged in heat transfer media with adequate circulation, and heat transfer dominates over ancillary (e.g. pumping) requirements in this conceptual flowsheet. Reactor heating duty calculations require reaction enthalpy values at corresponding temperatures; these have been computed using the reaction enthalpies at standard state, which in turn emerge from standard enthalpies of formation of the reagents and products for the respective chemical reactions:
∑∑ °°° −= reagentsfproductsfrxn ∆H∆H∆H ,, (5)
Reaction enthalpies at the corresponding reactor temperatures are calculated using Hess’s Law, considering the sum of three terms: the enthalpy change in cooling the reactants from the constant reactor temperature T to standard temperature (° = 25 °C), the reaction enthalpy at standard state, and the enthalpy change in heating the products from 25 °C to the reactor operating temperature:
( ) ( )∑∑ °−++−°= ° TTC∆HTTC∆H productsPrxnreagentsPrxn ,, (6)
The heating duty for each reactor is thus computed as a sum of feed heating and reaction enthalpy. For temperatures above the boiling points of certain components (e.g. methanol, methyl formate),
empirical observations indicate that partial evaporation (off-gassing) is possible (Bogdan et al., 2009). Nevertheless, this process simulation study assumes that all components remain in the liquid phase throughout the flowsheet and off-gassing is negligible by suitable reactor design (Mascia et al., 2013).
8 FINAL SEPARATION DESIGN Development of continuous separation and purification unit operations is critical in order to attain the full potential of CPM. Product streams frequently contain large quantities of excess reagent to be recycled, and by-products which must be removed; moreover, an aqueous product (API) stream (e.g. via continuous solvent exchange) is essential in downstream processing and final dosage formation.
A Pfizer solvent selection guide classifies solvents as preferred, usable or undesirable, based on their environmental impact (Alfonsi et al., 2008): accordingly, a selection of solvents from all three categories has been evaluated, including ethanol and ethyl acetate (preferred), toluene and acetonitrile (usable), and hexane (undesirable) and methyl acetate (unclassified). Water and methanol (preferred) are both present in the process, as they are essential according to the organic synthesis considered.
The API potassium salt form dissolved in stream F21 cannot be used in commercial formulations, due to its extreme hygroscopicity which compromises stability (Gruber, 2009). Before purification, stream F21 is assumed entirely acidified so that all ibuprofen is in its formal (carboxylic acid) form. The composition of the remainder of stream F21 has been assumed unchanged after this acidification step (the conversion of API salt to carboxylic acid form does not affect other effluent components).
The product stream of the third reactor must undergo final API purification. An efficient choice for this continuous API separation from an organic stream is liquid-liquid extraction (LLE): therein, the introduction of a new solvent (in which the valuable API solute exhibits preferentially high solubility) induces a multiphase mixture, as long as it is partially or entirely immiscible with the original solvent. For LLE design, stream F21 is assumed a binary mixture of water and methanol with several solutes. Ternary phase diagrams have been used to calculated compositions upon solvent addition and phase separation (Skrzecz et al., 1999) at ambient and effluent operating temperatures (25 °C and 65 °C).
Thermodynamic equilibrium between the aqueous and the organic phase is rapidly established in the LLE unit, and no crystallisation or precipitation is considered to occur under these flow conditions. The API distribution in each of the two (organic/O and water/W) phases relies on the assumption that the partition coefficient of ibuprofen is equal to the ratio of corresponding solubilities in each phase; these are computed for each of the resulting (O, W) phases via the UNIFAC method (cf. Appendix).
9 RESULTS AND DISCUSSION
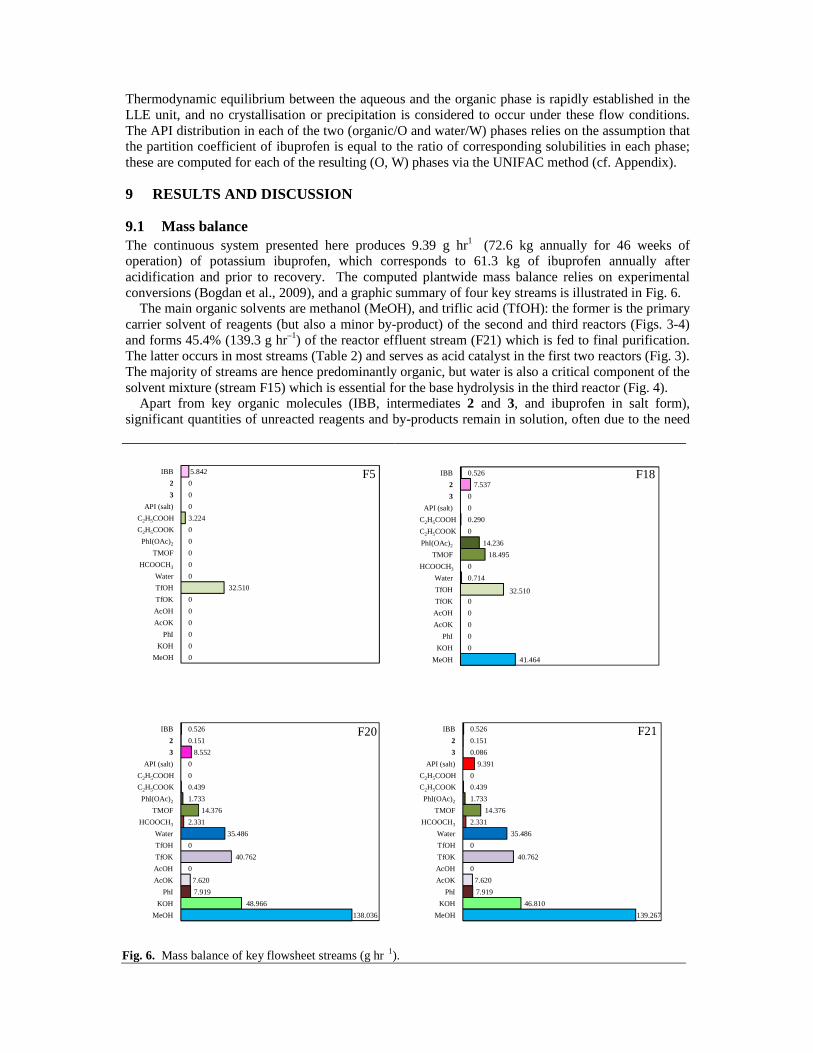
9.1 Mass balance The continuous system presented here produces 9.39 g hr1 (72.6 kg annually for 46 weeks of operation) of potassium ibuprofen, which corresponds to 61.3 kg of ibuprofen annually after acidification and prior to recovery. The computed plantwide mass balance relies on experimental conversions (Bogdan et al., 2009), and a graphic summary of four key streams is illustrated in Fig. 6.
The main organic solvents are methanol (MeOH), and triflic acid (TfOH): the former is the primary carrier solvent of reagents (but also a minor by-product) of the second and third reactors (Figs. 3-4) and forms 45.4% (139.3 g hr–1) of the reactor effluent stream (F21) which is fed to final purification. The latter occurs in most streams (Table 2) and serves as acid catalyst in the first two reactors (Fig. 3). The majority of streams are hence predominantly organic, but water is also a critical component of the solvent mixture (stream F15) which is essential for the base hydrolysis in the third reactor (Fig. 4).
Apart from key organic molecules (IBB, intermediates 2 and 3, and ibuprofen in salt form), significant quantities of unreacted reagents and by-products remain in solution, often due to the need
Fig. 6. Mass balance of key flowsheet streams (g hr 1).
5.842
0.000
0.000
0.000
3.224
0.000
0.000
0.000
0.000
0.000
32.510
0.000
0.000
0.000
0.000
0.000
0.000
IBB
2
3
API (salt)
C2H5COOH
C2H5COOK
PhI(OAc)2
TMOF
HCOOCH3
Water
TfOH
TfOK
AcOH
AcOK
PhI
KOH
MeOH
0.526
7.537
0.000
0.000
0.290
0.000
14.236
18.495
0.000
0.714
32.5100.000
0.000
0.000
0.000
0.000
41.464
IBB
2
3
API (salt)
C2H5COOH
C2H5COOK
PhI(OAc)2
TMOF
HCOOCH3
Water
TfOH
TfOK
AcOH
AcOK
PhI
KOH
MeOH
0.526
0.151
8.552
0.000
0.000
0.439
1.733
14.376
2.331
35.486
0.000
40.762
0.000
7.620
7.919
48.966
138.036
IBB
2
3
API (salt)
C2H5COOH
C2H5COOK
PhI(OAc)2
TMOF
HCOOCH3
Water
TfOH
TfOK
AcOH
AcOK
PhI
KOH
MeOH
0.526
0.151
0.086
9.391
0.000
0.439
1.733
14.376
2.331
35.486
0.000
40.762
0.000
7.620
7.919
46.810
139.267
IBB
2
3
API (salt)
C2H5COOH
C2H5COOK
PhI(OAc)2
TMOF
HCOOCH3
Water
TfOH
TfOK
AcOH
AcOK
PhI
KOH
MeOH
F5 F18
F20 F21
13
to use reagents in excess (e.g. TMOF, HCOOCH3, KOH). This is particularly important in stream F21, where unreacted reagents and by-products form 92.9% of the dissolved chemical substances, implying a clear need for a final separation ensuring API purification before downstream processing.
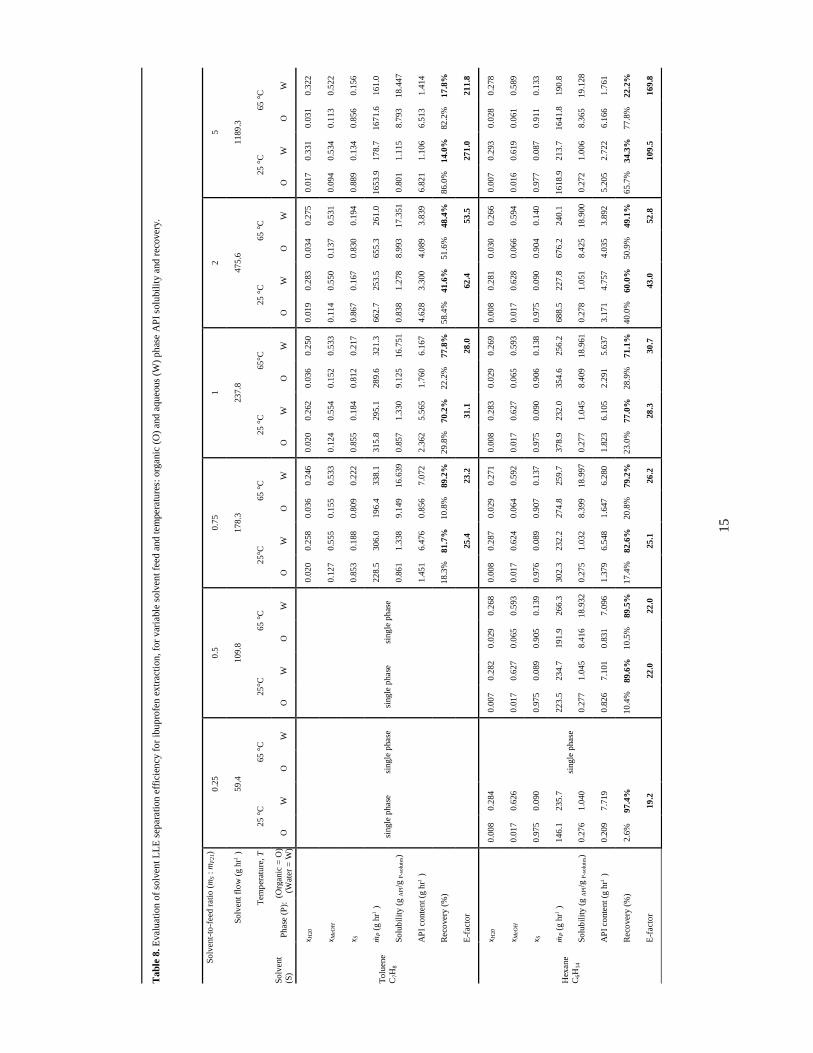
9.2 Reactor design The reactor sizes computed (PFR 1: 6.392 mL, PFR 2: 1.997 mL, PFR 3: = 28.912 mL) (Table 7) are reasonably small for the target capacity, illustrating the CPM benefit of space-efficient equipment. The reactors have been designed with a relatively small internal diameter (ID = 5.0 mm) to ensure efficient heat transfer; CPM pilot plant systems have been successfully demonstrated at this scale, with heat transfer ID = 1.6 mm and reactor ID = 11.7 to 40 mm, respectively (Mascia et al., 2013). Process simulations have also been performed at the reported capacity and compared to the published reactor dimensions implemented in the laboratory-scale experimental system (Bogdan et al., 2009). Computed reactor volumes are similar; the third reactor estimate is larger than that reported, implying a SPARC underestimation of the base hydrolysis rate constant (k3) due to the lack of kinetic data.
9.3 Heat transfer design Continuous synthesis reactions are endothermic: enthalpies at PFR temperatures are given in Table 7. Inlet streams to all three reactors require energy to reach and be kept at the operating temperature. The computed reactor heating requirements are of the same order of magnitude, but the wide variation in reactor lengths induces a considerably lower specific heating duty for the third reactor (Table 7). Energy duties have been computed solely for preheating feeds and maintaining isothermal operation: pumping, cooling, losses and power for Process Analytical Technology (PAT) are not considered, but heat integration opportunities must be taken into account in the detailed design phase for CPM plants.
9.4 Final separation design Six organic solvents (ethanol, acetonitrile, toluene, n-hexane, ethyl acetate, methyl acetate) have been evaluated as LLE candidates; the first five are discussed in a Pfizer publication (Alfonsi et al., 2008). Ethanol and acetonitrile are fully miscible with stream F21, yielding no manageable phase separation. System compositions obtained for LLE using methyl/ethyl acetate are outside the multiphase region for all levels of solvent use in both temperatures considered, so miscibility renders them unsuitable.
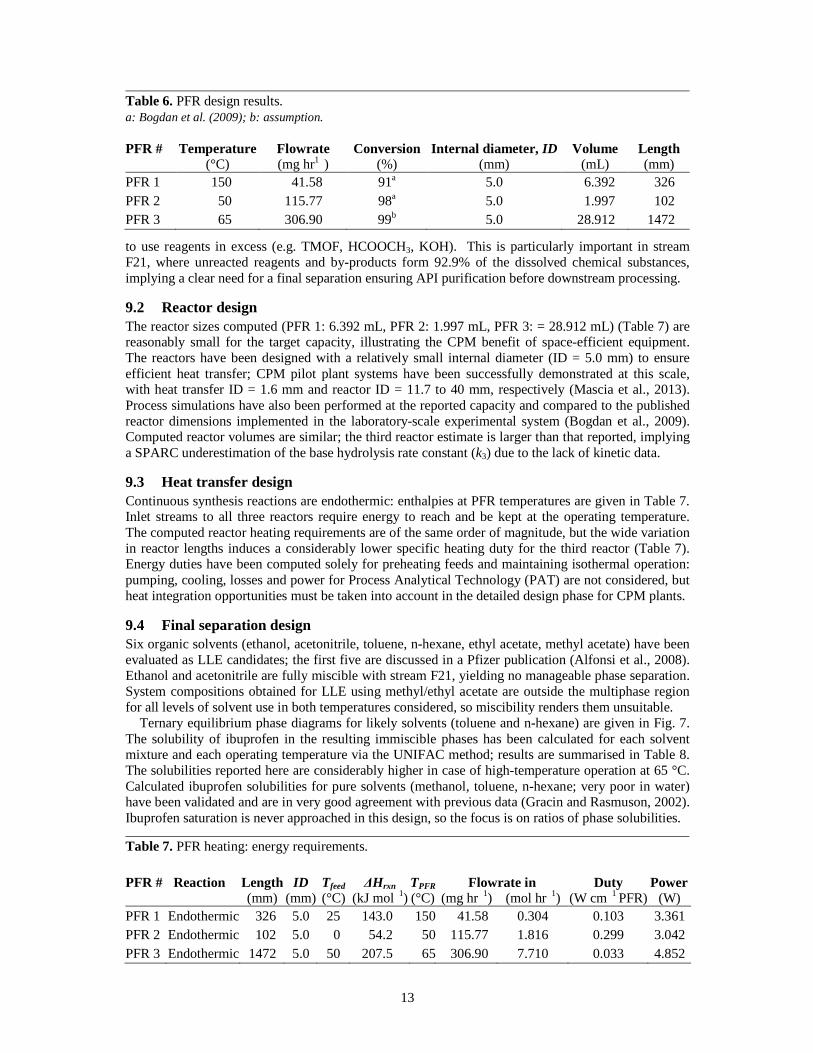
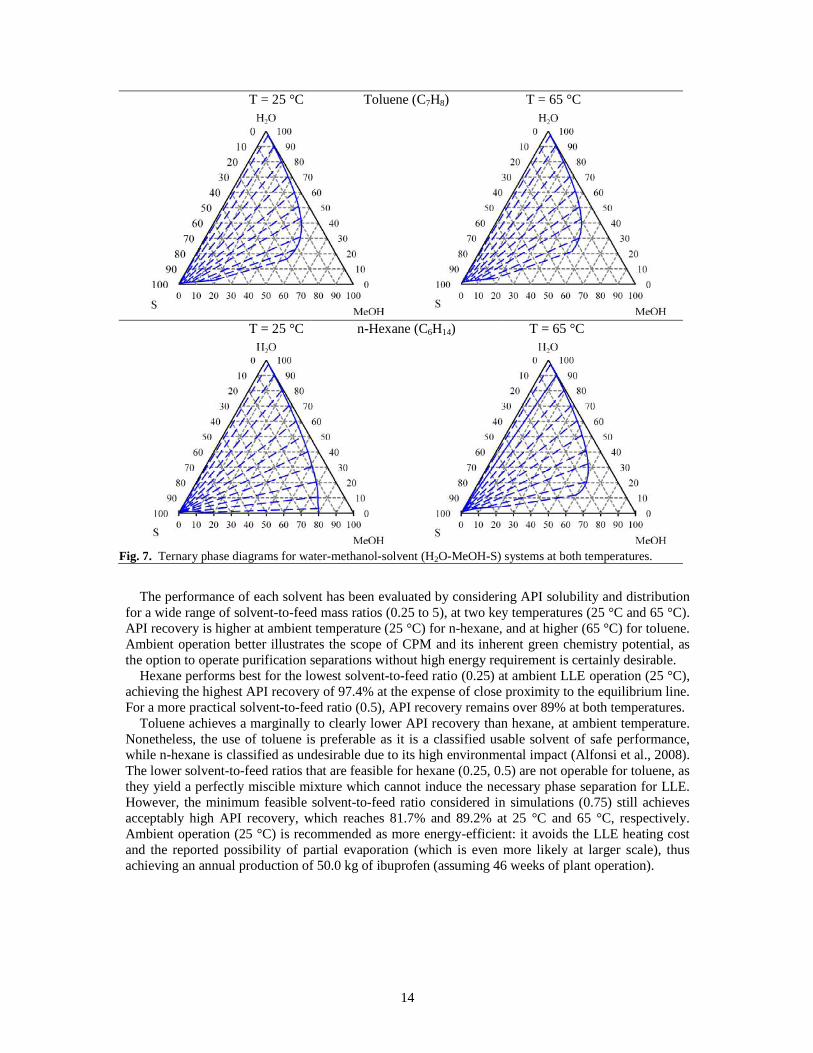
Ternary equilibrium phase diagrams for likely solvents (toluene and n-hexane) are given in Fig. 7. The solubility of ibuprofen in the resulting immiscible phases has been calculated for each solvent mixture and each operating temperature via the UNIFAC method; results are summarised in Table 8. The solubilities reported here are considerably higher in case of high-temperature operation at 65 °C. Calculated ibuprofen solubilities for pure solvents (methanol, toluene, n-hexane; very poor in water) have been validated and are in very good agreement with previous data (Gracin and Rasmuson, 2002). Ibuprofen saturation is never approached in this design, so the focus is on ratios of phase solubilities.
Table 6. PFR design results. a: Bogdan et al. (2009); b: assumption.
PFR #
Temperature
(°C) Flowrate
(mg hr1 ) Conversion
(%) Internal diameter, ID
(mm) Volume
(mL) Length (mm)
PFR 1 150 41.58 91a 5.0 6.392 326 PFR 2 50 115.77 98a 5.0 1.997 102 PFR 3 65 306.90 99b 5.0 28.912 1472
Table 7. PFR heating: energy requirements. PFR #
Reaction Length
(mm) ID
(mm) Tfeed (°C)
∆Hrxn TPFR
(°C) Flowrate in Duty Power
(kJ mol 1) (mg hr 1) (mol hr 1) (W cm 1 PFR) (W) PFR 1 Endothermic 326 5.0 25 143.0 150 41.58 0.304 0.103 3.361 PFR 2 Endothermic 102 5.0 0 54.2 50 115.77 1.816 0.299 3.042 PFR 3 Endothermic 1472 5.0 50 207.5 65 306.90 7.710 0.033 4.852
14
The performance of each solvent has been evaluated by considering API solubility and distribution
for a wide range of solvent-to-feed mass ratios (0.25 to 5), at two key temperatures (25 °C and 65 °C). API recovery is higher at ambient temperature (25 °C) for n-hexane, and at higher (65 °C) for toluene. Ambient operation better illustrates the scope of CPM and its inherent green chemistry potential, as the option to operate purification separations without high energy requirement is certainly desirable.
Hexane performs best for the lowest solvent-to-feed ratio (0.25) at ambient LLE operation (25 °C), achieving the highest API recovery of 97.4% at the expense of close proximity to the equilibrium line. For a more practical solvent-to-feed ratio (0.5), API recovery remains over 89% at both temperatures.
Toluene achieves a marginally to clearly lower API recovery than hexane, at ambient temperature. Nonetheless, the use of toluene is preferable as it is a classified usable solvent of safe performance, while n-hexane is classified as undesirable due to its high environmental impact (Alfonsi et al., 2008). The lower solvent-to-feed ratios that are feasible for hexane (0.25, 0.5) are not operable for toluene, as they yield a perfectly miscible mixture which cannot induce the necessary phase separation for LLE. However, the minimum feasible solvent-to-feed ratio considered in simulations (0.75) still achieves acceptably high API recovery, which reaches 81.7% and 89.2% at 25 °C and 65 °C, respectively. Ambient operation (25 °C) is recommended as more energy-efficient: it avoids the LLE heating cost and the reported possibility of partial evaporation (which is even more likely at larger scale), thus achieving an annual production of 50.0 kg of ibuprofen (assuming 46 weeks of plant operation).
T = 25 °C Toluene (C7H8) T = 65 °C
T = 25 °C n-Hexane (C6H14) T = 65 °C
Fig. 7. Ternary phase diagrams for water-methanol-solvent (H2O-MeOH-S) systems at both temperatures.
15
Tab
le 8
. Eva
luat
ion
of s
olve
nt L
LE
sep
arat
ion
effi
cien
cy f
or ib
upro
fen
extr
actio
n, f
or v
aria
ble
solv
ent f
eed
and
tem
pera
ture
s: o
rgan
ic (
O)
and
aque
ous
(W)
phas
e A
PI s
olub
ility
and
rec
over
y.
Solv
ent-
to-f
eed
ratio
(m
S : m
F21
) 0.
25
0.5
0.75
1
2 5
Solv
ent f
low
(g
hr1
) 59
.4
109.
8 17
8.3
237.
8 47
5.6
1189
.3
Tem
pera
ture
, T
25 °
C
65 °
C
25°C
65
°C
25
°C
65 °
C
25 °
C
65°C
25
°C
65
°C
25
°C
65
°C
Solv
ent
(S)
Pha
se (
P):
(Org
anic
= O
)(W
ater
= W
)O
W
O
W
O
W
O
W
O
W
O
W
O
W
O
W
O
W
O
W
O
W
O
W
Tol
uene
C
7H8
x H20
sing
le p
hase
si
ngle
pha
se
sing
le p
hase
si
ngle
pha
se
0.02
0 0.
258
0.03
6 0.
246
0.02
0 0.
262
0.03
6 0.
250
0.01
9 0.
283
0.03
4 0.
275
0.01
7 0.
331
0.03
1 0.
322
x MeO
H
0.12
7 0.
555
0.15
5 0.
533
0.12
4 0.
554
0.15
2 0.
533
0.11
4 0.
550
0.13
7 0.
531
0.09
4 0.
534
0.11
3 0.
522
x S
0.85
3 0.
188
0.80
9 0.
222
0.85
5 0.
184
0.81
2 0.
217
0.86
7 0.
167
0.83
0 0.
194
0.88
9 0.
134
0.85
6 0.
156
ṁP (
g hr
1)
228.
5 30
6.0
196.
4 33
8.1
315.
8 29
5.1
289.
6 32
1.3
662.
7 25
3.5
655.
3 26
1.0
1653
.9
178.
7 16
71.6
16
1.0
Solu
bilit
y (g
API
/g P
-sol
utes
) 0.
861
1.33
8 9.
149
16.6
39
0.85
7 1.
330
9.12
5 16
.751
0.
838
1.27
8 8.
993
17.3
51
0.80
1 1.
115
8.79
3 18
.447
AP
I co
nten
t (g
hr1
) 1.
451
6.47
6 0.
856
7.07
2 2.
362
5.56
5 1.
760
6.16
7 4.
628
3.30
0 4.
089
3.83
9 6.
821
1.10
6 6.
513
1.41
4
Rec
over
y (%
) 18
.3%
81
.7%
10
.8%
89
.2%
29
.8%
70
.2%
22
.2%
77
.8%
58
.4%
41
.6%
51
.6%
48
.4%
86
.0%
14
.0%
82
.2%
17
.8%
E-f
acto
r
25.4
23.2
31.1
28.0
62.4
53.5
271.
0
211.
8
Hex
ane
C6H
14
x H20
0.
008
0.28
4
sing
le p
hase
0.00
7 0.
282
0.02
9 0.
268
0.00
8 0.
287
0.02
9 0.
271
0.00
8 0.
283
0.02
9 0.
269
0.00
8 0.
281
0.03
0 0.
266
0.00
7 0.
293
0.02
8 0.
278
x MeO
H
0.01
7 0.
626
0.01
7 0.
627
0.06
5 0.
593
0.01
7 0.
624
0.06
4 0.
592
0.01
7 0.
627
0.06
5 0.
593
0.01
7 0.
628
0.06
6 0.
594
0.01
6 0.
619
0.06
1 0.
589
x S
0.97
5 0.
090
0.97
5 0.
089
0.90
5 0.
139
0.97
6 0.
089
0.90
7 0.
137
0.97
5 0.
090
0.90
6 0.
138
0.97
5 0.
090
0.90
4 0.
140
0.97
7 0.
087
0.91
1 0.
133
ṁP (
g hr
1)
146.
1 23
5.7
223.
5 23
4.7
191.
9 26
6.3
302.
3 23
2.2
274.
8 25
9.7
378.
9 23
2.0
354.
6 25
6.2
688.
5 22
7.8
676.
2 24
0.1
1618
.9
213.
7 16
41.8
19
0.8
Solu
bilit
y (g
API
/g P
-sol
utes
) 0.
276
1.04
0 0.
277
1.04
5 8.
416
18.9
32
0.27
5 1.
032
8.39
9 18
.997
0.
277
1.04
5 8.
409
18.9
61
0.27
8 1.
051
8.42
5 18
.900
0.
272
1.00
6 8.
365
19.1
28
AP
I co
nten
t (g
hr1
) 0.
209
7.71
9 0.
826
7.10
1 0.
831
7.09
6 1.
379
6.54
8 1.
647
6.28
0 1.
823
6.10
5 2.
291
5.63
7 3.
171
4.75
7 4.
035
3.89
2 5.
205
2.72
2 6.
166
1.76
1
Rec
over
y (%
) 2.
6%
97.4
%
10.4
%
89.6
%
10.5
%
89.5
%
17.4
%
82.6
%
20.8
%
79.2
%
23.0
%
77.0
%
28.9
%
71.1
%
40.0
%
60.0
%
50.9
%
49.1
%
65.7
%
34.3
%
77.8
%
22.2
%
E-f
acto
r
19.2
22.0
22.0
25.1
26.2
28.3
30.7
43.0
52.8
109.
5
169.
8
16
The environmental (E-) factor is a widely used green chemistry metric with a versatile definition (Sheldon, 2012): in its simplest form, it is the waste mass generated per unit mass or product, so lower E-factor values are more desirable and indicate greener design. Ranging widely, it is typically 0.1 in petrochemical industries, but can be as high as 200 for pharmaceutical products (Ritter, 2013).
The E-factor is computed as a mass ratio of waste (all material not recovered) to API (ibuprofen):
API
waste
m
mE = (7)
uAPIusurbpdwaste mmmm +++= (8)
E-factors have been calculated considering a downstream solvent (methanol and toluene/n-hexane) recovery of 90% (Sheldon, 2012), API recovery as reported, and remaining waste comprising all by-products, unreacted feed, 10% waste solvents and un-recovered API. Results are given in Table 8. The solvent feed obviously affects the effluent masses of unrecovered API and solvent waste, both of which in turn have a strong impact on the E-factor, as indicated by Eq. (8); this is particularly evident in case of the highest solvent-to-feed ratio (5), where the E-factor is larger by an order of magnitude.
Toluene is the recommended LLE solvent when considering green chemistry but also performance: for a solvent-to-feed ratio of 0.75 at ambient temperature (25 °C), its use yields an E-factor of 25.4. This is actually a quite acceptable value, rather low for the purpose of pharmaceutical manufacturing, and much lower than E-factors of many pharmaceuticals produced by batch methods (Sheldon, 2012).
10 CONCLUSIONS This paper presents a steady-state process model and simulation for the continuous production of a selected API which has emerged after systematic evaluation of several technical and market criteria. Continuous plug flow reactors and the final purification have been designed for CPM of ibuprofen, via systematic kinetic parameter estimation, solvent selection and thermodynamic property modelling, which is imperative for most organic molecules. Green design efficiency is explored via the E-factor.
Reaction order determination and kinetic parameter estimation have been performed by analysing published data of a continuous flow synthesis pathway (Bogdan et al., 2009). Three plug flow reactors in series have been designed: the computed PFR volumes (6.4, 2.0, 28.9 mL) are relatively small and clearly illustrate the fixed cost and plant footprint advantages of continuous over batch manufacturing. Energy requirements for ensuring high endothermic conversions under isothermal reactor operation are also quite reasonable and imply high potential for energy efficiency, justifying the expectation of fixed as well as operating cost advantages of CPM over batch manufacturing (Schaber et al., 2011). Actual CPM energy requirements will be slightly higher, due to auxiliary (e.g. pumping) functions. Design of a continuous final separation step after the third reactor is essential for a CPM process, to obtain an aqueous API stream which is pure enough to be fed to secondary (downstream) processing. A systematic evaluation of several candidate organic solvents (via UNIFAC solubility estimation) indicates that toluene is the most efficient extraction solvent, achieving a 81.7% ibuprofen recovery at a solvent-to-feed mass ratio of 0.75 and ambient temperature (25°C), yielding 50.0 kg API annually. This systematic LLE separation design achieves high API recovery with low solvent requirement, thus demonstrating the green chemistry principles of solvent and waste minimisation: a widely used environmental impact metric (the E-factor) has been computed for all candidate designs, and the value corresponding to the selected design (25.4) is quite low compared to many pharmaceutical processes.
Ibuprofen hereby emerges as an ideal API for Continuous Pharmaceutical Manufacturing (CPM): this therapeutic molecule is in high global demand and its production has extreme societal importance, thus representing a significant business opportunity for pilot- and production-scale implementations. The small PFR volumes and heating duties computed illustrate the documented (Roberge et al., 2008) and realised (Mascia et al., 2013) advantages of CPM technology, while the final LLE separation and reasonable solvent duty showcase the potential to design inherently green pharmaceutical processes. The suitability of methanol and a solvent exchange to ethanol (the de facto batch processing solvent) require more investigation, to facilitate the integration of CPM with downstream processing practice. The concurrent need for model-based technical and economic optimisation of the entire CPM process also emerges clearly by this process simulation study and must be pursued with systematic methods.
17
ACKNOWLEDGEMENT The authors gratefully acknowledge the financial support of the Engineering and Physical Sciences Research Council (EPSRC) via a Doctoral Training Partnership (DTP) studentship to Mr H.G. Joliffe.
NOMENCLATURE
Latin Letters A Shomate equation parameter ai Heat capacity group contribution estimation parameter for functional group i as Pure solid component activity B Shomate equation parameter bi Heat capacity group contribution estimation parameter for functional group i C Shomate equation parameter CA Concentration of molecule A, mol L1 CA,0 Initial concentration of molecule A, mol L1 Ci Group coefficient for functional group i in the total phase change entropy group additivity
estimation method CP Specific heat capacity at constant pressure, J mol1 K1 ci Heat capacity group contribution estimation parameter for functional group i D Shomate equation parameter di Heat capacity group contribution estimation parameter for functional group i E Shomate equation parameter Gi Contribution from one functional group i to the total phase change entropy in the group
additivity estimation method, J mol-1 K-1 hf 0 Constant used in estimating the standard enthalpy of formation ∆°Hf
h1i Standard enthalpy of formation group contribution of a single first-order group i h2j Standard enthalpy of formation group contribution of a single second-order group j ID Internal diameter, mm k’ Pseudo-first-order reaction rate constant, s1
ki Rate constant of reaction i, L mol1 s1 (second-order reaction) Li UNIFAC compound parameter of r, q and z Mj Number of j second-order functional groups mAPI Mass of recovered API mbpd Mass of byproducts mur Mass of unreacted reagents mus Mass of unrecovered solvent muAPI Mass of unrecovered API MW Molecular weight, g mol1
mwaste Mass of waste Ni Number of i first-order functional groups
2CHn Number of consecutive CH2 groups
ni Number of i functional groups Qk UNIFAC surface area parameter for functional group k qi UNIFAC parameter for molecule i , a measure of Van der Waals molecular surface area R Universal gas constant, 8.3144 J mol1 K1 R2 Coefficient of determination Rk UNIFAC volume parameter for functional group k rA Rate of reaction of molecule A, mol l1 s1
ri UNIFAC parameter for molecule i , a measure of Van der Waals volume T Temperature, K T° Standard temperature, 298 K Tfeed Feed temperature, °C TPFR Reactor temperature, °C Tfus Melting (fusion) point temperature, K
18
t Time, hr Umn UNIFAC energy interaction between groups m and n XA Conversion of molecule A at time t XA,f Final conversion of molecule A xi Mole fraction of molecule i xm UNIFAC mole fraction of group m xi
sat Mole fraction at saturation (solubility) z UNIFAC system coordination number (default value: 10)
Greek Letters Γk UNIFAC residual group activity coefficient for group k Γk
(i) UNIFAC residual group activity coefficient in a reference solution of 100% i molecules γi Activity coefficient of component i γi
c UNIFAC combinatorial component of γi
r UNIFAC residual component of γi
sat Activity coefficient of component i at saturation ∆°Hf Standard enthalpy of formation, J mol1
∆Hfus Enthalpy of fusion, J mol1
∆°Hrxn Standard reaction enthalpy, J mol1
∆Hrxn Reaction enthalpy, J mol1
tpceTm H∆ fus Total phase change enthalpy, J mol-1
∆Sfus Entropy of fusion, J mol1 K1
tpceT
S∆ fus
0 Total phase change entropy, J mol1 K1
θi UNIFAC molar-weighted area fractional component for molecule i θm UNIFAC summation of area fraction of group m over all different groups νk
(i) UNIFAC number of occurrences of functional group k in molecule i τi Residence time in reactor i, hr ϕi UNIFAC molar-weighted segment fractional component molecule i Ψmn UNIFAC group energy interaction parameter
LITERATURE REFERENCES 1. Abboud, C., Berman, E., Cohen, A., Cortes, J., DeAngelo, D. et al., 2013. The price of drugs for chronic
myeloid leukemia (CML) is a reflection of the unsustainable prices of cancer drugs: from the perspective of a large group of CML experts. Blood 121(22): 4439–4442.
2. Abrams, D.S., Prausnitz, J.M., 1975. Statistical thermodynamics of liquid mixtures: a new expression for the excess Gibbs energy of partly or completely miscible systems. AICHE J. 21(1): 116–128.
3. Adams, S.S., 1992. The propionic acids: a personal perspective. J. Clin. Pharmacol. 32(4): 317–323. 4. Almario, G.A., Barrague, M., Burnier, P., Enguehard, C., Gao, Z. et al., 2009. 6-cycloamino-3-(pyridin-4-
yl)imidazo[1,2-b]pyridazine derivatives, preparation thereof and therapeutic use thereof. WO2009016286 A3.
5. Alfonsi, K., Colberg., J., Dunn, P.J., Fevig, T., Jennings, S. et al., 2008. Green chemistry tools to influence a medicinal chemistry and research chemistry based organisation. Green Chem. 10(1):31–36
6. Anderson, N.G., 2012. Using continuous processes to increase production. Org. Process Res. Dev. 16(5): 852–869.
7. Ashe, R., 2012. From batch to continuous processing. Chem. Eng.-New York 119(10): 34–40. 8. Behr, A., Brehme, V. A., Ewers, C.L.J., Grön, H., Kimmel, T. et al., 2004. New developments in chemical
engineering for the production of drug substances. Eng. Life Sci. 4(1): 15–24. 9. Boatright, J.H., Nickerson, J.M., Moring, A.G., Pardue, M.T., 2009. Bile acids in treatment of ocular
disease. J. Ocul. Biol. Dis. Infor. 2(3): 149–159. 10. Bogdan, A.R., Poe, S.L., Kubis, D.C., Broadwater, S.J., McQuade, D.T., 2009. The continuous-flow
synthesis of ibuprofen. Ind. Angew. Chem. Int. Edit. 48(45): 8547–8550. 11. Chase, M.W., Jr., 1998. NIST-JANAF Thermochemical Tables (4th edition), J. Phys. Chem. Ref. Data,
Monograph 9. 12. Chickos, J.S., Acree, W.E., 1999. Estimating solid-liquid phase change enthalpies and entropies. J. Phys.
Chem. Ref. Data 28(6): 1535–1673.
19
13. Constantinou, L., Gani, R., 1994. New group contribution method for estimating properties of pure compounds. AICHE J. 40(10): 1697–1710.
14. Douglas, J.M., 1988. Conceptual Design of Chemical Processes. McGraw-Hill, New York. 15. Fredenslund, A., Jones, R.L., Prausnitz, J.M., 1975. Group-contribution estimation of activity coefficients in
nonideal liquid mixtures. AICHE J. 21(6): 1086–1099. 16. Fuse, S., Mifune, Y., Tanabe, N., Takahashi, T., 2012. Continuous-flow synthesis of activated vitamin D3
and its analogues. Org. Biomol. Chem. 10(27): 5205–5211. 17. Gernaey, K.V., Cervera-Padrell, A.E., Woodley, J.M., 2012. Development of continuous pharmaceutical
production processes supported by process systems engineering methods and tools. Future Med. Chem. 4(11): 1371–1374.
18. Gerogiorgis, D.I., Barton, P.I., 2009. Steady-state optimization of a continuous pharmaceutical process. Comp. Aid. Ch. 27(A): 927-932.
19. Gerogiorgis, D.I., Ydstie, B.E., 2005. Multiphysics CFD modelling for design and simulation of a multiphase chemical reactor. Chem. Eng. Res. Des. 83(A6): 603–610.
20. Goldman, J.M., Melo, J.V., 2003. Chronic myeloid leukemia – advances in biology and new approaches to treatment. N. Engl. J. Med. 349(15): 1451–1464.
21. Gracin, S., Brinck, T., Rasmuson, Å.C., 2002. Prediction of solubility of solid organic compounds in solvents by UNIFAC. Ind. Eng. Chem. Res. 41(20): 5114–5124.
22. Gracin, S., Rasmuson, Å.C., 2002. Solubility of phenylacetic Acid, p-hydroxyphenylacetic acid, p-aminophenylacetic acid, p-hydroxybenzoic acid, and ibuprofen in pure solvents. J. Chem. Eng. Data 47 (6): 1379–1383.
23. Gruber, P., 2009. Solubilized ibuprofen. US20090175940 A1. 24. Gustafsson, T., Sörensen, H., Pontén, F., 2012. Development of a continuous flow scale-up approach of
reflux inhibitor AZD6906. Org. Process Res. Dev. 16(5): 925–929. 25. Hilal, S.H., Karickhoff, S.W., 2003. Verification and validation of the SPARC model (No. EPA/600/R-
03/033 (NTIS PB2004-101168)). U.S. Environmental Protection Agency (EPA). 26. Hopkin, M.D., Baxendale, I.R., Ley, S.V., 2010. A flow-based synthesis of imatinib: the API of Gleevec.
Chem. Commun. 46(14): 2450–2452. 27. Kockmann, N., Gottsponer, M., Zimmermann, B., Roberge, D.M., 2008. Enabling continuous-flow
chemistry in microstructured devices for pharmaceutical and fine-chemical production. Chem.-Eur. J. 14(25): 7470–7477.
28. Kopetzki, D., Lévesque, F., Seeberger, P.H., 2013. A continuous-flow process for the synthesis of artemisinin. Chem.-Eur. J. 19(17): 5450–5456.
29. LaPorte, T.L., Wang, C., 2007. Continuous processes for the production of pharmaceutical intermediates and active pharmaceutical ingredients. Curr. Opin. Drug Di. De. 10(6): 738–745.
30. Lee, H., Chen, R., Lee, Y., Yoo, S., Lee, C., 2009. Essential roles of CKIδ and CKIε in the mammalian circadian clock. P. Natl. Acad. Sci. U.S.A. 106(50): 21359–21364.
31. Mascia, S., Heider, P.L., Zhang, H., Lakerveld, R., Benyahia, B. et al., 2013. End-to-end continuous manufacturing of pharmaceuticals: integrated synthesis, purification, and final dosage formation. Angew. Chem. Int. Ed. 52(47):12359–12363.
32. Morgan, S, Grootendorst, P., Lexchin, J., Cunningham, C., Greyson, D., 2011. The cost of drug development: a systematic review. Health Policy 100(1): 4–17.
33. UK Office for National Statistics. 2011. Business Enterprise Research and Development, 2011. Statistical Bulletin.
34. Plumb, K., 2005. Continuous processing in the pharmaceutical industry – changing the mind set. Chem. Eng. Res. Des. 83(A6): 730–738.
35. Posner, G.H., Kahraman, M., 2003. Organic chemistry of vitamin D analogues (deltanoids). Eur. J. Org. Chem. 2003(20): 3889–3895.
36. Qian, Z., Baxendale, I.R., Ley, S.V., 2010. A continuous flow process using a sequence of microreactors with in-line IR analysis for the preparation of n,n-diethyl-4-(3-fluorophenylpiperidin-4-ylidenemethyl)benzamide as a potent and highly selective δ-opioid receptor agonist. Chem.-Eur. J. 16(41): 12342–12348.
37. Quann, E.J., Khwaja, F., Zavitz, K.H., Djakiew, D., 2007. The aryl propionic acid R-flurbiprofen selectively induces P75NTR-dependent decreased survival of prostate tumor cells. Cancer Res. 67(7): 3254–3262.
38. Ravina, E., Kubinyi, H., 2011. The Evolution of Drug Discovery. Wiley. 39. Richardson, G.S., Roehrs, T.A., Rosenthal, L., Koshorek, G., Roth, T., 2002. Tolerance to daytime sedative
effects of H1 antihistamines. J. Clin. Psychopharm. 2(5): 511–515. 40. Rihani, D.N., Doraiswamy, L.K., 1965. Estimation of heat capacity of organic compounds from group
contributions. Ind. Eng. Chem. Fund. 4(1): 17–21. 41. Ritter, S.K., 2013. Reducing environmental impact of organic synthesis. Chem. Eng. News. 91(15): 22-23.
20
42. Rivard, A.L., Steer, C.J., Kren, B.T., Rodrigues, C.M.P., Castro, R.E. et al., 2007. Administration of tauroursodeoxycholic acid (TUDCA) reduces apoptosis following myocardial infarction in rat. Am. J. Chinese Med. 35(2): 279–295.
43. Roberge, D.M., Zimmermann, B., Rainone, F., Gottsponer, M., Eyholzer, M., Kockmann, N., 2008. Microreactor technology and continuous processes in the fine chemical and pharmaceutical industry: is the revolution underway? Org. Process Res. Dev. 12(5): 905–910.
44. Schaber, S.D., Gerogiorgis, D.I., Ramachandran, R., Evans, J.M.B., Barton, P.I., Trout, B.L., 2011. Economic analysis of integrated continuous and batch pharmaceutical manufacturing: a case study. Ind. Eng. Chem. Res. 50(17): 10083–10092.
45. Sheldon, R.A., 2012. Fundamentals of green chemistry: efficiency in reaction design. Chem. Soc. Rev. 41(4): 1437-1451.
46. Skrzecz, A., Shaw, D., Maczynski, A., 1999. IUPAC-NIST solubility data series 69. Ternary alcohol-hydrocarbon-water systems. J. Phys. Chem. Ref. Data 28(4): 983–1235.
47. Snead, D.R., Jamison, T.F., 2013. End-to-end continuous flow synthesis and purification of diphenhydramine hydrochloride featuring atom economy, in-line separation, and flow of molten ammonium salts. Chem. Sci. 4(7): 2822–2827.
48. Tambornini, L., Romano, D., Pinto, A., Bertolani, A., Molinari, F., Conti, P., 2012. An efficient method for the lipase-catalysed resolution and in-line purification of racemic flurbiprofen in a continuous-flow reactor. J. Mol. Catal. B – Enzym. 84: 78-82.
49. Tu, Y., 2011. The discovery of artemisinin (qinghaosu) and gifts from Chinese medicine. Nat. Med. 17(10): 1217–1220.
50. Venturoni, F., Gioiello, A., Sardella, R., Natalini, B., Pellicciari, R., 2012. Continuous flow synthesis and scale-up of glycine- and taurine-conjugated bile salts. Org. Biomol. Chem. 10(20): 4109–4115.
51. Wechter, W.J., Leipold, D.D., Quiggle, D.D., McCracken, J.D., Murray, E.D., Loughman, B.E., 2000. R-Flurbiprofen (E-7869), a chemopreventive and treatment of cancer. Inflammopharmacology 8(2): 189–206.
52. Wei, Z.-Y., Brown, W., Takasaki, B., Plobeck, N., Delorme, D. et al., 2000. N,n-diethyl-4-(phenylpiperidin-4-ylidenemethyl)benzamide: a novel, exceptionally selective, potent δ opioid receptor agonist with oral bioavailability and its analogues. J. Med. Chem. 43(21): 3895–3905.
53. White, N.J., 2008. Qinghaosu (artemisinin): the price of success. Science 320(5874): 330–334. 54. Wittig, R., Lohmann, J., Gmehling, J., 2003. Vapor-liquid equilibria by UNIFAC group contribution. 6.
Revision and extension. Ind. Eng. Chem. Res. 42(1): 183–188.
APPENDIX
A1. Reaction kinetics The differential rate equation for a second order reaction between two substances A and B (first order in A as well as in B) is written with respect to reactant A as follows:
BAA CkC
dt
dC =− (A1)
The following nonlinear equation is obtained by integration:
( )tCCkCC
CCAB
BA
AB0,0,
0,
0,ln −= (A2)
A plot of 0,
0,lnBA
AB
CC
CC against time results in a linear correlation, given that the initial concentrations
of the reactants ( 0,AC and 0,BC ) are generally not equal. The reaction rate constant k can be
determined from the slope of the plot, which is equal to ( )tCCk AB 0,0, − .
For the first PFR, the reaction rate equation for the key organic feedstock (IBB) is:
COOHCHCHIBBIBB CCkr231=− (A3)
This can be written as:
21
( )( )IBBIBBCOOHHCIBBIBBIBB XCCXCCkr 0,0,0,0,11 52−−=− (A4)
The integral form is used to evaluate the required residence time and reactor volume:
( )( )∫ −−=
fIBBX
IBBIBBCOOHHCIBBIBBIBB
IBBIBBIBB XCCXCC
dX
k
C ,
520
0,0,0,0,2
0,τ (A5)
For the second PFR, the reaction rate equation for organic intermediate 2 is:
2)(222 OAcPhICCkr =− (A6)
Organic intermediate 2 and PhI(OAc)2 react in a 1:1 stoichiometric ratio, however the feed is not equimolar:
( )( )20,20,)(20,20,222 2XCCXCCkr OAcPhI −−=− (A7)
The integral form is again used to evaluate the required residence time and reactor volume:
( )( )∫ −−= fX
OAcPhI XCCXCC
dX
k
C ,2
20
20,20,)(20,20,2
2
2
0,22τ (A8)
For the third PFR, the reaction rate equation is:
−=−OH
CCkr 333 (A9)
Potassium hydroxide (KOH) is in excess, so this is a pseudo-first order reaction rate equation:
33 Ckr ′=− (A10)
where the pseudo-first order reaction constant kꞌ is:
−=′OH
Ckk 3 (A11)
The integrated form is used to evaluate the required residence time and reactor volume:
( )∫ −′= fX
X
dX
Ck
,3
0 23
3
0,33
1
1τ (A12)
A2. Enthalpy of fusion
The total phase change entropy tpceT
S∆ fus
0 is considered a valid approximation for the entropy of
fusion ( fus∆S ) and is estimated using equation (A27) for aliphatic and benzenoid aromatic
hydrocarbons:
fustpceT
∆SS∆ fus ≅0 (A13)
∑ +=i
CHCHCHiitpceT
GCnGnS∆ fus
2220 (A14)
22
≠≥
= ∑ otherwise,00.1
andif,31.1 22
2i
iCH
CH
CHinnC (A15)
Parameter Gi indicates a group and its associated additivity value, and ni is the number of
occurrences of Gi. Group coefficients Ci are used (i.e. ni Gi Ci) where there are multiple occurrences, with the exception of methylene (CH2) groups, where the group coefficient value is 1.31 if the number of consecutive CH2 groups exceeds the number of other groups and 1.0 otherwise. The calculation requires tabulated values of Gi and Ci (Chickos and Acree, 1999).
With tpceT
S∆ fus
0 taken to be a good estimate of the entropy of fusion, the total phase change enthalpy
tpceTm H∆ fus is estimated as follows (assuming no additional solid phase changes):
fustpceT
tpceTm TS∆H∆ fusfus
0= (A16)
The total phase change enthalpy is similarly considered a valid approximation of the enthalpy of fusion, fus∆H :
tpceTmfus H∆∆H fus≅ (A17)
A3. Solubility
The UNIFAC activity coefficient for molecule i ( iγ ) is the sum of a combinatorial ( ciγ ) and a residual
component ( riγ ) (Fredenslund et al., 1975):
ri
cii γγγ lnlnln += (A18)
The combinatorial component is calculated via the UNIQUAC model (Abrams and Prausnitz, 1975):
∑−++=j
Jji
ii
ii
i
ici Lx
xLq
z
x
φφθφγ ln
2lnln (A19)
where iφ and iθ are the molar weighted segment (similar to volume) and area fractional components, respectively. Furthermore, Li is a UNIFAC compound parameter defined by ri , qi and z:
∑=
jjj
iii rx
rxφ (A20)
∑=
jjj
iii qx
qxθ (A21)
( ) ( )12
−−−= iiii rqrz
L , )10( =z (A22)
Parameters ir and iq are calculated from contributions of R and Q (the volume and surface area
parameters for each functional group, respectively) according to their occurrence kν on the molecule:
( )∑=k
ki
ki Rr ν (A23)

23
( )∑=k
ki
ki Qq ν (A24)
The residual component is calculated as follows:
( ) ( )[ ]∑ Γ−Γ=k
ikk
ik
ri lnlnln νγ (A25)
where kΓ and ( )ikΓ is the residual group activity coefficient of group k in reality and in a reference
solution of pure substance i, respectively. Both kΓ and ( )ikΓ are calculated via the following equation:
−−=Γ ∑∑∑m
nnmm
kmm
mmkmkk Q
ψθψθψθln1ln (A26)
where parameters mθ (summation of the area fraction of group m over all different groups) and xm (the mole fraction of group m) are defined as follows:
∑=
nnn
mmm
xQ
xQθ (A27)
∑∑
∑=
j nj
jn
jj
jm
mx
x
xν
ν (A28)
Parameter mnΨ is calculated using a modified Arrhenius equation and represents a measure of
interaction energy between groups:
−−=RT
UUΨ nmmn
mn exp (A29)
Tabulated data for values of Q, R and group interactions have been published for a multitude of groups (Wittig et al., 2003).
The solubility (mole fraction at saturation satix ) of components in solvent mixtures is calculated
using the following equation (Gracin et al., 2002):
−==
TTR
∆Hxa
fus
fussati
sati
si
11expγ (A30)
Here, Hfus is the enthalpy of fusion and Tfus is the melting point of pure solid solute i. The solid
activity ( sia ) is first estimated via the exponential of Eq. (A30), and the activity coefficient obtained
from Eq. (A18) is used to obtain the solubility of the solid in the solvent mixture ( satix ) via Eq. (A30).
An iterative process is required for Eq. (A30), as the activity coefficient depends on mole fraction.


![Alpha-Casein as a Molecular Chaperone · The major protein constituent of casein micelles, accounting for 65% of protein is S-casein [4]. The function of -casein, present at the surface](https://static.fdocuments.net/doc/165x107/5fd57079b24729154a34f060/alpha-casein-as-a-molecular-chaperone-the-major-protein-constituent-of-casein-micelles.jpg)


