EDI Neighbourhood Data 2006- 2011 EDI Results & 2011 Neighbourhood Demographics.
20
EDI Neighbourhood Data 2006- 2011 EDI Results & 2011 Neighbourhood Demographics
-
Upload
tyshawn-willis -
Category
Documents
-
view
237 -
download
0
Transcript of EDI Neighbourhood Data 2006- 2011 EDI Results & 2011 Neighbourhood Demographics.

EDI Neighbourhood Data
2006- 2011 EDI Results & 2011 Neighbourhood Demographics

EDI
• The Early Development Instrument (EDI) gathers data about children’s developmental vulnerability.
– EDI is a population-based tool that measures children’s development in five key domains, providing a snapshot of how developmentally ready children are when they enter Grade 1.
– Examining results by these domains helps to determine strengths and needs of a particular population (community) so that our communities have a better understanding of the relationship between the way children develop and the environment in which they live.

EDI – What We Know
• Research by staff at the Offord Centre has found:
– Birth circumstances have an important impact on children’s readiness to learn at school
– Children with low birth weight and/or preterm births were more likely to score in the lowest 10th percentile (vulnerable)
– Children with normal birth weight and full-term pregnancies were least likely to score low in two or more readiness to learn domains

EDI – What We Know
• Lower neighbourhood school readiness has been associated with:
– Lower income– Higher % of lone-parent families– Higher % of low income families– Higher % of families who have moved within the last
year
Research conducted by M. Janus and D. Offord – Offord Centre for Child Studies

National Household Survey Data
• Provides data that was previously collected in Census
• Suppresses data for areas where the response was less than 50% of the population
• Data definitions changed from Census to NHS making it difficult to compare historically (some, but not all)
• Population Counts still with Census
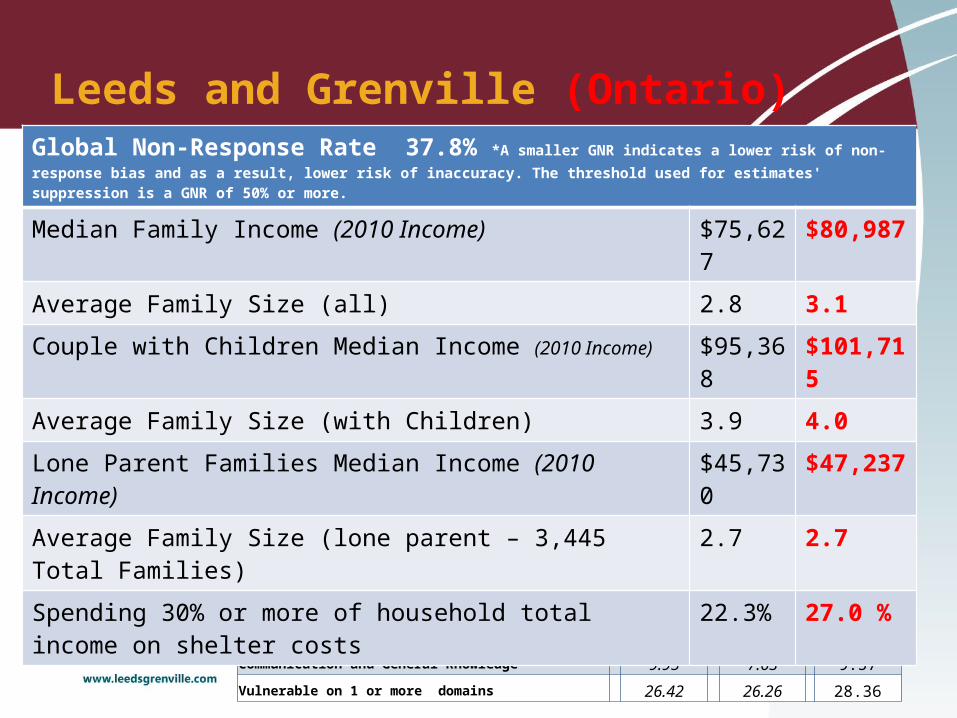
Leeds and Grenville (Ontario)
EDI Domain
2006 2008 2011
% of SK ALL L&G
% of SK ALL L&G
% of SK ALL L&G
Physical Health and Well-Being 13.88 14.51 16.24
Social Competence 9.95 9.44 11.01
Emotional Maturity 11.27 9.72 10.58
Language and Cognitive Development 10.31 6.86 9.25
Communication and General Knowledge 9.95 7.63 9.57Vulnerable on 1 or more domains 26.42 26.26 28.36
Global Non-Response Rate 37.8% *A smaller GNR indicates a lower risk of non-response bias and as a result, lower risk of inaccuracy. The threshold used for estimates' suppression is a GNR of 50% or more.
Median Family Income (2010 Income) $75,627 $80,987
Average Family Size (all) 2.8 3.1
Couple with Children Median Income (2010 Income) $95,368 $101,715
Average Family Size (with Children) 3.9 4.0
Lone Parent Families Median Income (2010 Income) $45,730 $47,237
Average Family Size (lone parent – 3,445 Total Families) 2.7 2.7
Spending 30% or more of household total income on shelter costs 22.3% 27.0 %

Athens
EDI Domain
2006 2008 2011
% of SK
% of SK ALL L&G
% of SK
% of SK ALL L&G
% of SK% of SK ALL L&G
Physical Health and Well-Being 14.88 13.88 16.67 14.51 15.15 16.24
Social Competence 10.7
19.95 10.00 9.44 6.06 11.01
Emotional Maturity 10.71 11.27 10.00 9.72 6.06 10.58
Language and Cognitive Development 7.14 10.31 3.33 6.86 6.06 9.25Communication and General Knowledge
10.71 9.95 10.00 7.63 0.00 9.57
Vulnerable on 1 or more domains 32.14 26.42 20.00 26.26 21.21 28.36
Global Non-Response Rate 43.9% *A smaller GNR indicates a lower risk of non-response bias and as a result, lower risk of inaccuracy. The threshold used for estimates' suppression is a GNR of 50% or more.
Median Family Income (2010 Income) $75, 409
Average Family Size (all of township) 3.1
Couple with Children Median Income (2010 Income) $94,080
Average Family Size (with Children) 3.9
Lone Parent Families Median Income (2010 Income) $57,395
Average Family Size (lone parent – 80 Total Families) 2.7
Spending 30% or more of household total income on shelter costs 14.8%

Augusta
EDI Domain
2006 2008 2011
% of SK
% of SK ALL L&G
% of SK
% of SK ALL L&G
% of SK% of SK ALL L&G
Physical Health and Well-Being 14.88 13.88 11.81 14.51 24.56 16.24
Social Competence 6.61 9.95 10.16 9.44 7.02 11.01
Emotional Maturity 5.79 11.27 5.47 9.72 12.28 10.58
Language and Cognitive Development 11.57 10.31 11.72 6.86 9.73 9.25Communication and General Knowledge
10.74 9.95 11.72 7.63 10.53 9.57
Vulnerable on 1 or more domains 23.14 26.42 24.22 26.26 32.46 28.36
Global Non-Response Rate 36.3% *A smaller GNR indicates a lower risk of non-response bias and as a result, lower risk of inaccuracy. The threshold used for estimates' suppression is a GNR of 50% or more.
Median Family Income (2010 Income) $75,694
Average Family Size (all of township) 2.9
Couple with Children Median Income (2010 Income) $62,762
Average Family Size (with Children) 4.2
Lone Parent Families Median Income (2010 Income) $64,203
Average Family Size (lone parent – 110 Total Families) 2.6
Spending 30% or more of household total income on shelter costs 26.7%
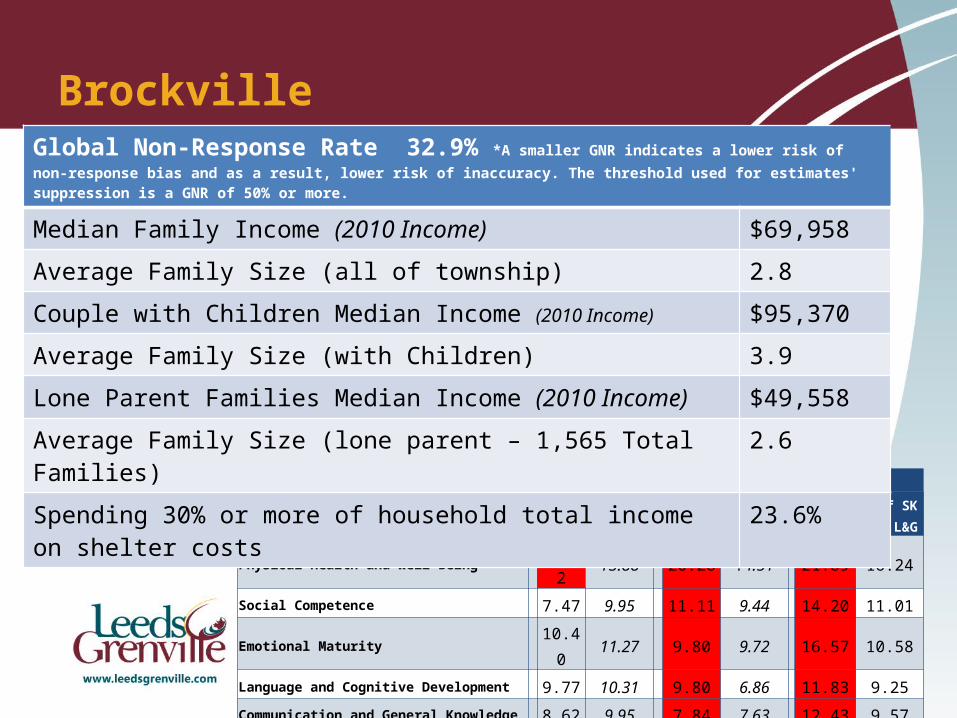
Brockville
EDI Domain
2006 2008 2011
% of SK
% of SK ALL L&G
% of SK
% of SK ALL L&G
% of SK% of SK ALL L&G
Physical Health and Well-Being 15.52 13.88 20.26 14.51 21.89 16.24
Social Competence 7.47 9.95 11.11 9.44 14.20 11.01
Emotional Maturity 10.40 11.27 9.80 9.72 16.57 10.58
Language and Cognitive Development 9.77 10.31 9.80 6.86 11.83 9.25Communication and General Knowledge
8.62 9.95 7.84 7.63 12.43 9.57
Vulnerable on 1 or more domains 24.71 26.42 32.03 26.26 37.87 28.36
Global Non-Response Rate 32.9% *A smaller GNR indicates a lower risk of non-response bias and as a result, lower risk of inaccuracy. The threshold used for estimates' suppression is a GNR of 50% or more.
Median Family Income (2010 Income) $69,958
Average Family Size (all of township) 2.8
Couple with Children Median Income (2010 Income) $95,370
Average Family Size (with Children) 3.9
Lone Parent Families Median Income (2010 Income) $49,558
Average Family Size (lone parent – 1,565 Total Families) 2.6
Spending 30% or more of household total income on shelter costs 23.6%

Edwardsburgh/Cardinal
EDI Domain
2006 2008 2011
% of SK
% of SK ALL L&G
% of SK
% of SK ALL L&G
% of SK% of SK ALL L&G
Physical Health and Well-Being 28.26 13.88 30.0 14.51 16.67 16.24
Social Competence 21.74 9.95 5.0 9.44 13.33 11.01
Emotional Maturity 21.74 11.27 15.0 9.72 13.33 10.58
Language and Cognitive Development 17.39 10.31 2.5 6.86 10.0 9.25Communication and General Knowledge
15.22 9.95 12.5 7.63 13.33 9.57
Vulnerable on 1 or more domains 50.00 26.42 32.5 26.26 26.67 28.36
Global Non-Response Rate 44.5% *A smaller GNR indicates a lower risk of non-response bias and as a result, lower risk of inaccuracy. The threshold used for estimates' suppression is a GNR of 50% or more.
Median Family Income (2010 Income) $74,068
Average Family Size (all of township) 2.8
Couple with Children Median Income (2010 Income) $82,862
Average Family Size (with Children) 3.9
Lone Parent Families Median Income (2010 Income) $33,714
Average Family Size (lone parent – 210 Total Families) 2.3
Spending 30% or more of household total income on shelter costs 23.8%

Elizabethtown - Kitley
EDI Domain
2006 2008 2011
% of SK
% of SK ALL L&G
% of SK
% of SK ALL L&G
% of SK% of SK ALL L&G
Physical Health and Well-Being 6.0 13.88 9.09 14.51 13.0 16.24
Social Competence 4.0 9.95 3.64 9.44 5.0 11.01
Emotional Maturity 10.0 11.27 3.64 9.72 6.0 10.58
Language and Cognitive Development 4.0 10.31 9.09 6.86 10.0 9.25Communication and General Knowledge
6.0 9.95 1.82 7.63 6.0 9.57
Vulnerable on 1 or more domains 18.0 26.42 20.0 26.26 24.0 28.36
Global Non-Response Rate 37.0% *A smaller GNR indicates a lower risk of non-response bias and as a result, lower risk of inaccuracy. The threshold used for estimates' suppression is a GNR of 50% or more.
Median Family Income (2010 Income) $78,971
Average Family Size (all of township) 2.9
Couple with Children Median Income (2010 Income) $99,326
Average Family Size (with Children) 3.8
Lone Parent Families Median Income (2010 Income) $61,659
Average Family Size (lone parent – 260 Total Families) 2.8
Spending 30% or more of household total income on shelter costs 16.1%

Front of Yonge
EDI Domain
2006 2008 2011
% of SK
% of SK ALL L&G
% of SK
% of SK ALL L&G
% of SK% of SK ALL L&G
Physical Health and Well-Being 24.24 13.88 11.11 14.51 24.24 16.24
Social Competence 21.21 9.95 14.81 9.44 15.15 11.01
Emotional Maturity 30.30 11.27 11.11 9.72 15.15 10.58
Language and Cognitive Development 24.24 10.31 3.70 6.86 9.09 9.25Communication and General Knowledge
24.24 9.95 14.81 7.63 18.18 9.57
Vulnerable on 1 or more domains 42.42 26.42 33.33 26.26 33.33 28.36
Global Non-Response Rate 37.0% *A smaller GNR indicates a lower risk of non-response bias and as a result, lower risk of inaccuracy. The threshold used for estimates' suppression is a GNR of 50% or more.
Median Family Income (2010 Income) $75,568
Average Family Size (all of township) 2.8
Couple with Children Median Income (2010 Income) $99,238
Average Family Size (with Children) 3.9
Lone Parent Families Median Income (2010 Income) $48,443
Average Family Size (lone parent – 80 Total Families) 2.1
Spending 30% or more of household total income on shelter costs 20.8%

Gananoque
EDI Domain
2006 2008 2011
% of SK
% of SK ALL L&G
% of SK
% of SK ALL L&G
% of SK% of SK ALL L&G
Physical Health and Well-Being 8.89 13.88 18.42 14.51 20.83 16.24
Social Competence 2.22 9.95 2.63 9.44 4.17 11.01
Emotional Maturity 6.67 11.27 13.16 9.72 14.58 10.58
Language and Cognitive Development 8.89 10.31 13.16 6.86 2.08 9.25Communication and General Knowledge
4.44 9.95 13.16 7.63 4.17 9.57
Vulnerable on 1 or more domains 17.78 26.42 23.68 26.26 29.17 28.36
Global Non-Response Rate 34.9% *A smaller GNR indicates a lower risk of non-response bias and as a result, lower risk of inaccuracy. The threshold used for estimates' suppression is a GNR of 50% or more.
Median Family Income (2010 Income) $64,901
Average Family Size (all of township) 2.7
Couple with Children Median Income (2010 Income) $87,453
Average Family Size (with Children) 3.6
Lone Parent Families Median Income (2010 Income) $40,214
Average Family Size (lone parent – 260 Total Families) 2.7
Spending 30% or more of household total income on shelter costs 29.9%
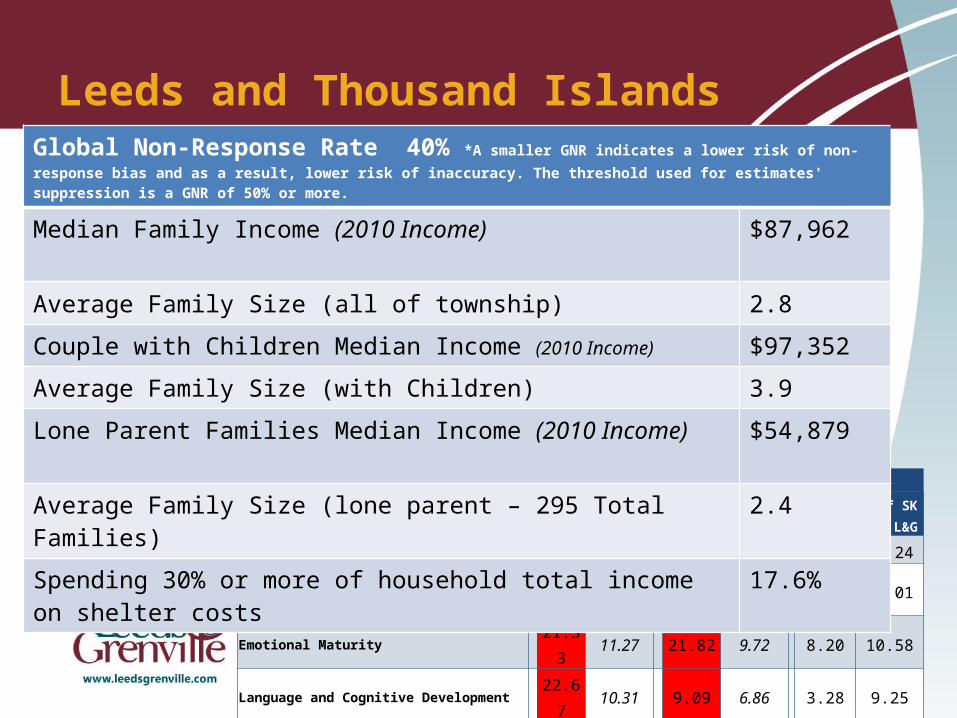
Leeds and Thousand Islands
EDI Domain
2006 2008 2011
% of SK
% of SK ALL L&G
% of SK
% of SK ALL L&G
% of SK% of SK ALL L&G
Physical Health and Well-Being 24.0 13.88 21.82 14.51 13.11 16.24
Social Competence 25.33 9.95 25.45 9.44 6.56 11.01
Emotional Maturity 21.33 11.27 21.82 9.72 8.20 10.58
Language and Cognitive Development 22.67 10.31 9.09 6.86 3.28 9.25Communication and General Knowledge
22.67 9.95 10.91 7.63 4.92 9.57
Vulnerable on 1 or more domains 44.0 26.42 40.0 26.26 21.31 28.36
Global Non-Response Rate 40% *A smaller GNR indicates a lower risk of non-response bias and as a result, lower risk of inaccuracy. The threshold used for estimates' suppression is a GNR of 50% or more.
Median Family Income (2010 Income) $87,962
Average Family Size (all of township) 2.8
Couple with Children Median Income (2010 Income) $97,352
Average Family Size (with Children) 3.9
Lone Parent Families Median Income (2010 Income) $54,879
Average Family Size (lone parent – 295 Total Families) 2.4
Spending 30% or more of household total income on shelter costs 17.6%

Merrickville - Wolford
EDI Domain
2006 2008 2011
% of SK
% of SK ALL L&G
% of SK
% of SK ALL L&G
% of SK% of SK ALL L&G
Physical Health and Well-Being 2.70 13.88 0.00 14.51 10.53 16.24
Social Competence 8.11 9.95 10.81 9.44 9.94 11.01
Emotional Maturity 5.41 11.27 10.81 9.72 8.19 10.58
Language and Cognitive Development 0.0 10.31 0.0 6.86 7.06 9.25Communication and General Knowledge
2.70 9.95 0.0 7.63 10.53 9.57
Vulnerable on 1 or more domains 10.81 26.42 21.62 26.26 22.22 28.36
Global Non-Response Rate >50% *A smaller GNR indicates a lower risk of non-response bias and as a result, lower risk of inaccuracy. The threshold used for estimates' suppression is a GNR of 50% or more.
Median Family Income (2010 Income)
Average Family Size (all of township)
Couple with Children Median Income (2010 Income)
Average Family Size (with Children)
Lone Parent Families Median Income (2010 Income)
Average Family Size (lone parent – 295 Total Families)
Spending 30% or more of household total income on shelter costs

North Grenville
EDI Domain
2006 2008 2011
% of SK
% of SK ALL L&G
% of SK
% of SK ALL L&G
% of SK% of SK ALL L&G
Physical Health and Well-Being 8.13 13.88 15.38 14.51 3.85 16.24
Social Competence 7.26 9.95 8.55 9.44 7.69 11.01
Emotional Maturity 5.65 11.27 9.48 9.72 4.0 10.58
Language and Cognitive Development 4.84 10.31 1.71 6.86 7.69 9.25Communication and General Knowledge
5.65 9.95 4.27 7.63 3.85 9.57
Vulnerable on 1 or more domains 18.55 26.42 25.64 26.26 11.54 28.36
Global Non-Response Rate 43% *A smaller GNR indicates a lower risk of non-response bias and as a result, lower risk of inaccuracy. The threshold used for estimates' suppression is a GNR of 50% or more.
Median Family Income (2010 Income) $94,044
Average Family Size (all of township) 3.0
Couple with Children Median Income (2010 Income) $115,624
Average Family Size (with Children) 4.0
Lone Parent Families Median Income (2010 Income) $48,432
Average Family Size (lone parent – 415 Total Families) 2.6
Spending 30% or more of household total income on shelter costs 17.3%

Prescott
EDI Domain
2006 2008 2011
% of SK
% of SK ALL L&G
% of SK
% of SK ALL L&G
% of SK% of SK ALL L&G
Physical Health and Well-Being 14.88 13.88 11.81 14.51 24.56 16.24
Social Competence 6.61 9.95 10.16 9.44 7.02 11.01
Emotional Maturity 5.79 11.27 5.47 9.72 12.28 10.58
Language and Cognitive Development 11.57 10.31 11.72 6.86 9.73 9.25Communication and General Knowledge
10.74 9.95 11.72 7.63 10.53 9.57
Vulnerable on 1 or more domains 23.14 26.42 24.22 26.26 32.46 28.36
Global Non-Response Rate >50% *A smaller GNR indicates a lower risk of non-response bias and as a result, lower risk of inaccuracy. The threshold used for estimates' suppression is a GNR of 50% or more.
Median Family Income (2010 Income)
Average Family Size (all of township)
Couple with Children Median Income (2010 Income)
Average Family Size (with Children)
Lone Parent Families Median Income (2010 Income)
Average Family Size (lone parent – 415 Total Families)
Spending 30% or more of household total income on shelter costs

Rideau Lakes
EDI Domain
2006 2008 2011
% of SK
% of SK ALL L&G
% of SK
% of SK ALL L&G
% of SK% of SK ALL L&G
Physical Health and Well-Being 6.17 13.88 4.17 14.51 10.29 16.24
Social Competence 9.88 9.95 2.78 9.44 5.88 11.01
Emotional Maturity 13.58 11.27 8.33 9.72 4.41 10.58
Language and Cognitive Development 8.64 10.31 4.17 6.86 4.41 9.25Communication and General Knowledge
6.17 9.95 2.78 7.63 11.76 9.57
Vulnerable on 1 or more domains 24.69 26.42 16.67 26.26 16.18 28.36
Global Non-Response Rate 39.1% *A smaller GNR indicates a lower risk of non-response bias and as a result, lower risk of inaccuracy. The threshold used for estimates' suppression is a GNR of 50% or more.
Median Family Income (2010 Income) $74,585
Average Family Size (all of township) 2.8
Couple with Children Median Income (2010 Income) $86,632
Average Family Size (with Children) 3.9
Lone Parent Families Median Income (2010 Income) $46,382
Average Family Size (lone parent – 255 Total Families) 2.4
Spending 30% or more of household total income on shelter costs 18.2%

WestportGlobal Non-Response Rate 46.8% *A smaller GNR indicates a lower risk of non-response bias and as a result, lower risk of inaccuracy. The threshold used for estimates' suppression is a GNR of 50% or more.
Median Family Income (2010 Income) $65,839
Average Family Size (all of township) 2.7
Couple with Children Median Income (2010 Income) $65,671
Average Family Size (with Children) 3.7
Lone Parent Families Median Income (2010 Income) $65,169
Average Family Size (lone parent –15 Total Families) 1.8
Spending 30% or more of household total income on shelter costs 17.2%
EDI Domain
2006 2008 2011
% of SK
% of SK ALL L&G
% of SK
% of SK ALL L&G
% of SK% of SK ALL L&G
Physical Health and Well-Being 6.17 13.88 4.17 14.51 10.29 16.24
Social Competence 9.88 9.95 2.78 9.44 5.88 11.01
Emotional Maturity 13.58 11.27 8.33 9.72 4.41 10.58
Language and Cognitive Development 8.64 10.31 4.17 6.86 4.41 9.25Communication and General Knowledge
6.17 9.95 2.78 7.63 11.76 9.57
Vulnerable on 1 or more domains 24.69 26.42 16.67 26.26 16.18 28.36

…building community capacity for ALL Children …